Embed Size (px)
Citation preview

Deutsche BankDeutsche Bank
Interim Report as of March 31, 2012

Deutsche Bank Interim Report as of March 31, 2012
The Group at a glance
Three months ended
Mar 31, 2012 Mar 31, 2011
Share price at period end € 37.31 € 41.49 Share price high € 39.51 € 48.70 Share price low € 26.17 € 39.24 Basic earnings per share € 1.49 € 2.20 Diluted earnings per share € 1.44 € 2.13 Average shares outstanding, in m., basic 929 937 Average shares outstanding, in m., diluted 960 969 Return on average shareholders’ equity (post-tax) 10.2 % 16.7 % Pre-tax return on average shareholders’ equity 13.6 % 23.7 % Pre-tax return on average active equity 13.7 % 23.9 % Book value per basic share outstanding
1 € 58.72 € 53.14 Cost/income ratio
2 76.1 % 67.6 % Compensation ratio
3 39.8 % 40.8 % Noncompensation ratio
4 36.4 % 26.8 %
in € m. in € m.
Total net revenues 9,193 10,474 Provision for credit losses 314 373 Total noninterest expenses 7,000 7,080 Income before income taxes 1,879 3,021 Net income 1,401 2,130
Mar 31, 2012 Dec 31, 2011
in € bn. in € bn.
Total assets 2,103 2,164 Shareholders’ equity 55.0 53.4 Core Tier 1 capital ratio
5 10.0 % 9.5 % Tier 1 capital ratio
5 13.4 % 12.9 %
Number Number
Branches 3,075 3,078 thereof in Germany 2,036 2,039
Employees (full-time equivalent) 100,682 100,996 thereof in Germany 47,241 47,323
Long-term rating Moody’s Investors Service Aa3 Aa3 Standard & Poor’s A+ A+ Fitch Ratings A+ A+
The reconciliation of average active equity and related ratios is provided on page 78 of this report. 1 Book value per basic share outstanding is defined as shareholders’ equity divided by the number of basic shares outstanding (both at period end). 2 Total noninterest expenses as a percentage of total net interest income before provision for credit losses plus noninterest income. 3 Compensation and benefits as a percentage of total net interest income before provision for credit losses plus noninterest income. 4 Noncompensation noninterest expenses, which are defined as total noninterest expenses less compensation and benefits, as a percentage of total net interest
income before provision for credit losses plus noninterest income. 5 The capital ratios relate the respective capital to risk weighted assets for credit, market and operational risk. Excludes transitional items pursuant to section 64h (3) of
the German Banking Act.
Due to rounding, numbers presented throughout this document may not add up precisely to the totals provided and percentages may not precisely reflect the absolute figures.
Deutsche Bank

Deutsche Bank Content 1 Interim Report as of March 31, 2012
Letter from the Chairman of the Management Board – 2
Management Report Operating and Financial Review – 8
Economic Environment – 8 Consolidated Results of Operations – 9 Segment Results of Operations – 10 Financial Position – 18
Risk Report – 24 Outlook – 41
Review Report – 44
Consolidated Financial Statements Consolidated Statement of Income – 45 Consolidated Statement of Comprehensive Income – 46 Consolidated Balance Sheet – 47 Consolidated Statement of Changes in Equity – 48 Consolidated Statement of Cash Flows – 50
Notes to the Consolidated Financial Statements Basis of Preparation – 51 Impact of Changes in Accounting Principles – 52 Segment Information – 53 Information on the Income Statement – 57 Information on the Balance Sheet – 60 Other Financial Information – 67
Other Information – 77

Deutsche Bank Letter from the Chairman of the Management Board 2 Interim Report as of March 31, 2012
Dr. Josef Ackermann Chairman of the Management Board and the Group Executive Committee
During the first quarter of this year, business conditions were significantly more stable, after the extreme market volatility which characterized the second half of 2011. Financial markets recovered across the world, against a backdrop of more encouraging news from the U.S. economy, and clear signals of determination on the part of European policymakers and central bankers to tackle the sovereign debt situation in some Eurozone states. Measures to mitigate stresses in the banking system, including the European Central Bank’s long-term refinancing operations, also contributed significantly to more positive market conditions. Equity markets rallied and credit spreads tightened during the quarter. Never-theless, investors, particularly private investors, remained wary after the market turmoil of last year, and this cautious sentiment affected business volumes. Furthermore, conditions in the global economy remain challenging. In the United States, employment figures showed signs of improvement, but real estate markets remain subdued. In our home market, Germany, the economy proved its resilience, but levels of sovereign indebtedness in some Eurozone states remained very high whilst the pace of economic recovery was modest. Conditions in the world’s mature economies inevitably affected the outlook for export-driven growth in Asia and other emerging markets.

Deutsche Bank Letter from the Chairman of the Management Board 3 Interim Report as of March 31, 2012
Deutsche Bank’s first-quarter results reflect both the more stable conditions of the quarter, and continued caution in the world’s financial markets and the wider global economy. They also reflect our prudent approach to risk-taking and capital management without jeopardizing our client facing activities. Group net revenues were € 9.2 billion, down 12 % versus the first quarter of 2011.
Pre-tax profits were € 1.9 billion, after an impairment charge of € 257 mil-lion in Corporate Investments, versus € 3.0 billion in the first quarter 2011, and net income was € 1.4 billion, versus € 2.1 billion in the prior year quarter. In our core businesses, Corporate & Investment Bank (CIB) and Private Clients and Asset Management (PCAM), pre-tax profits were € 2.6 billion, after a litigation related charge of approximately € 210 mil-lion in Corporate Banking & Securities (CB&S). Our focus on Asia is delivering tangible result and we recorded strong pre-tax profit growth from Asia Pacific. Notwithstanding the introduction of Basel 2.5 capital requirements at the end of last year, our capital position remained robust. We succeeded in strengthening our Core Tier 1 capital ratio to 10 %, reduced risk-weighted assets by € 13 billion, from € 381 billion at the end of 2011 to € 368 billion. We continue to make good progress on litigation issues and on de-risking our balance sheet. And we deliberately chose to keep the utilization of risk levels well below our Group limits during the quarter. Our share price also recovered by 27 % during the quarter.
In CIB, pre-tax profits were € 2.1 billion – a significant rebound versus the second half of 2011, but lower than € 2.6 billion in the first quarter 2011. In CB&S, pre-tax profits were € 1.7 billion, versus € 2.3 billion in the prior year quarter. In Debt Sales & Trading, our ‘flow’ businesses, including foreign exchange, core rates and credit trading all turned in strong performances in stabilized markets, reflecting record volumes in foreign exchange, and our second best first quarter ever in core interest rate trading; revenues in structured credit trading were somewhat lower than in the first quarter of 2011, reflecting deliberately lower inventory levels, and the non-recurrence of some specific gains in the prior year quarter. Revenues in equities trading also rebounded strongly versus the second half of last year but were lower than in the first quarter last year, reflecting comparatively lower levels of industry-wide client activity; however, the strength of our franchise was reflected in our being voted No. 1 for European Sales, Trading and Research (Institutional Investor).

Deutsche Bank Letter from the Chairman of the Management Board 4 Interim Report as of March 31, 2012
Our Corporate Finance businesses, debt & equity origination and M&A/advisory, achieved a global top-3 ranking as measured by fees during the quarter (Dealogic) – our highest-ever position, reflecting top-5 status across all major product areas. Revenues also rebounded from late last year, but were below the first quarter 2011, reflecting lower levels of corporate activity, driven by continued wariness on the part of clients in the wake of last year’s market volatility.
In Global Transaction Banking (GTB), pre-tax profits were € 340 million, up 24 % versus the first quarter 2011 and our best-ever for a first quarter. This reflected record first-quarter revenues, with strength across all core business and regions, together with solid credit quality and expense discipline. Cash Management revenues were boosted by good progress in winning business with top-quality clients, as we reaped the benefits of the marketing efforts of previous quarters. Deutsche Bank’s status as a secure and top-quality repository for assets in uncertain conditions has proved attractive to both existing and new clients – as was underlined by no fewer than 11 Quality and Share Leader Awards from Greenwich, and the title of ‘Global Corporate Trust Services Provider of the Year’ by Infrastructure Investor Awards.
In Asset and Wealth Management (AWM), pre-tax profits were € 142 million, down 25 % versus the first quarter of 2011. In Asset Management (AM), pre-tax profits were € 54 million, as asset flows were impacted by a more cautious investor sentiment and the prospect of our disposal of parts of this business. We continue to pursue strategic options for the disposal of parts of our Asset Management platform, where such a move would create positive value for our shareholders, and stabilize the invested asset base. Private Wealth Management (PWM) produced pre-tax profits of € 88 million, lower than the first quarter of 2011 but a significant rebound from the fourth quarter of last year, reflecting solid revenue momentum in Germany, the rest of EMEA and Asia. PWM also attracted € 2 billion of net money inflows during the quarter, and total invested assets grew by € 9 billion to € 278 billion, reflecting both new money inflows and improving asset valuations.
In Private & Business Clients (PBC), pre-tax profits were € 413 million, versus € 788 million in the prior year first quarter which included a significant one-time gain related to our stake in Hua Xia Bank in China.

Deutsche Bank Letter from the Chairman of the Management Board 5 Interim Report as of March 31, 2012
Brokerage revenues were lower, reflecting the more risk-averse mood among private customers in Germany; however, revenues in deposit and credit products were more resilient, and we succeeded in attracting a further € 5 billion in customer deposits as part of our deposit campaign. Provisions for credit losses were also lower, in part reflecting the good quality of our credit portfolio, and lower provisions recorded at Postbank. We continue to make good progress on Postbank integration, notably in the area of risk reduction.
As regulators around the globe focus on capital adequacy in the banking system, our capital ratios are of primary importance to us. In this context, I am pleased to report that during the first quarter, we succeeded in raising our Tier 1 capital ratio from 12.9 % at the end of 2011 to 13.4 %, and our Core Tier 1 ratio from 9.5 % to 10 %. This positive trend reflects both capital formation and prudent deployment of risk assets in our trading businesses during the quarter. Our capital ratios have remained solid despite the introduction of stricter risk weightings under Basel 2.5, and our Core Tier 1 ratio is comfortably above the European Banking Authority requirement of reaching 9 % by this June. Despite the tighter regulatory environment we will continue to grow and strengthen our client franchise where we can add value to our shareholders.
Looking ahead to the rest of 2012, the outlook in our environment remains balanced between some encouraging signs of progress, and reminders that the fundamental challenges facing the global economy remain present. On the one hand, we see evidence of economic recovery in North America, and momentum in Asian economies, which seem better equipped to avoid a ‘hard landing’. In our home market, Germany, economic performance continues to be resilient, and across the Eurozone, we also see clear evidence of political will to address the challenges of sovereign debt, as evidenced by the progress made on Greek debt restructuring recently. However, the strength and momentum of global economic recovery is still unclear, world energy prices remain stubbornly high, while in certain peripheral Eurozone states, sovereign debt levels remain elevated, and unemployment, particularly among young people, is an acute problem. These challenges, together with geopolitical uncertainties, could all impact global economic recovery as 2012 progresses. Against this backdrop, financial markets remain cautious – as we have seen in April, with investor risk appetite markedly lower. This inevitably impacts business conditions for our industry.

Deutsche Bank Letter from the Chairman of the Management Board 6 Interim Report as of March 31, 2012
At Deutsche Bank, we are prepared for both challenges and opportuni-ties. We continue to focus on business growth, and on driving returns on the investments we have made in our platform; simultaneously, we maintain strict vigilance over costs, risks and the deployment of precious capital resources.
Our first quarter results reflect the work we have done to secure our plat-form since the outbreak of the crisis in late 2008. Thanks to a successful recalibration, our investment banking business has produced solid reve-nues in a challenging environment after significant market turbulence. Our GTB and PCAM businesses are now making a powerful contribution to a better-balanced earnings mix. In an environment of capital constraints, we have demonstrated both capital formation and risk discipline and have continued to strengthen our client business. This bears out our convic-tion that Deutsche Bank is well-placed to face the future with confidence: positioned to outperform in recovering markets, but also possessing the strength to confront future challenges in the market, and a more de-manding regulatory environment. As we look forward, we are also absolutely committed to our duty not only as bankers, but also as citizens in the wider community. As we steer Deutsche Bank through uncertain conditions, we are guided by clear principles of social respon-sibility in respect of the business we choose to do. In this context we agree with international policy makers that transparency in agricultural commodity derivatives markets should be enhanced, measures to avoid misconducts should be strengthened and we have taken appropriate measures. Furthermore our new policy on cluster munitions demands to exit relationships and not to engage in new business with cluster munitions manufacturers, distributors and companies that produce key components of cluster munitions. Lastly, we are equally mindful about market concerns regarding compensation structures and we continue to adjust our compensation system.
As you know, I will be stepping down as Board and GEC Chairman at the upcoming Annual General Meeting on May 31, 2012. This will there-fore be my last letter to shareholders. I take this opportunity to express my warmest and most sincere thanks to you, our shareholders, for all your loyalty, support and encouragement over the past ten years. I warmly invite you to attend our Annual General Meeting in person, and

Deutsche Bank Letter from the Chairman of the Management Board 7 Interim Report as of March 31, 2012
I hope to see as many of you as possible in the Frankfurter Festhalle, where I look forward to expressing my gratitude to you in person. During these years, I have also been deeply gratified and impressed by the tremendous efforts made by Deutsche Bank’s staff, and by their crea-tivity, loyalty and commitment throughout some extremely challenging periods for our business.
It has been an honour to serve you during my years at Deutsche Bank; I am confident that Deutsche Bank is well-equipped for a successful future.
Yours sincerely,
Josef Ackermann Chairman of the Management Board and the Group Executive Committee
Frankfurt am Main, April 2012
Deutsche Bank Management Report 8 Interim Report as of March 31, 2012 Operating and Financial Review
Operating and Financial Review
Economic Environment
Global economic growth appears to have accelerated slightly in the first quarter of 2012 after economic mo-mentum had slowed in the preceding quarter, which, in particular, had resulted from the decline in economic output in the eurozone and Japan. This is reflected by the results of purchasing manager surveys (PMI sur-veys), which improved slightly in the first quarter compared to low levels at the end of 2011. In the U.S., the PMI survey and the more positive developments in the labor market point to sustained economic momentum with an (annualized) growth rate of just under 3 % in the first quarter. In Japan, we expect growth to have re-covered significantly thanks to improved foreign trade and the start of reconstruction measures after the catas-trophe in March 2011. By contrast, economic output in the eurozone is likely to have declined again in the first quarter of 2012 – albeit at a slower pace than at the end of 2011. Within the eurozone, Germany’s GDP proba-bly stagnated at the start of the year, with French GDP falling slightly. By contrast, the southern economies of the EU probably contracted again noticeably due to the consolidation of public and private finances in these countries. Global economic growth continues to benefit from high, stable growth rates in the emerging markets and in developing countries, which are providing moderate momentum for world trade.
The slightly improved sentiment among purchasing managers is probably largely due to the liquidity measures by the European Central Bank, the fiscal pact agreed by the EU countries and initial agreements on structural reforms especially in Italy and Spain, all of which have considerably reduced the risks of an escalation of the European sovereign debt crisis. Accordingly, risk premiums on government bonds from the peripheral countries declined from their record levels and stock markets around the world rose markedly.
Overall, the banking sector had a better start into 2012 than had been expected. In the U.S., economic recov-ery and the decline in unemployment continued, strengthening lending both to corporates as well as house-holds. In Europe, growth forecasts at least did not fall further. As a result, lending slowed and volumes stagnated but did not drop significantly – large differences across individual countries notwithstanding.
The most important factor behind the calming of sentiment was the ECB’s two three-year refinancing opera-tions which supplied banks with a gross € 1 trillion in medium-term liquidity at favorable conditions. This eased pressure in private funding markets and enabled many banks to place bonds with investors at better conditions than in the second half 2011. Italian and Spanish banks used much of the additional funds to buy domestic sovereign bonds, thereby relaxing their governments’ tight refinancing situation. In these circumstances, the unprecedented haircut forced on holders of Greek debt did not lead to the feared major market disruptions, although long-term consequences remain unpredictable.
The slightly improved sentiment benefited investment banking; capital issuance except M&A rose substantially compared with the last few months of 2011 even though volumes in most cases remained below the high pre-year level. Overall the profitability of European banks may have recovered at least somewhat, but they remain far behind their U.S. peers.
Management Report

Deutsche Bank Management Report 9 Interim Report as of March 31, 2012 Operating and Financial Review
Consolidated Results of Operations
The business environment during the first quarter 2012 was more stable compared to the extreme market volatility which characterized the second half of 2011. However, conditions in the global economy remained challenging. While equity markets improved and credit spreads tightened during the quarter, there was con-tinued caution in the world’s financial markets and among investors. Our first quarter results reflect these factors. In addition, we took a prudent approach to risk taking and capital management without jeopardizing our client facing activities.
In the Corporate & Investment Bank (CIB), net revenues were down 8 % in the first quarter 2012 to € 6.2 billion versus € 6.7 billion in the first quarter 2011. Against the backdrop of a far less favorable environment compared to the prior year quarter, this is a strong result which reflects good performance across most businesses, de-spite continued risk discipline and lower client activity than in the prior year. Private Clients and Asset Man-agement (PCAM) net revenues were € 3.4 billion in the first quarter 2012 compared to revenues of € 4.1 billion in the first quarter 2011 which was positively impacted by € 263 million related to our stake in Hua Xia Bank for which equity method accounting was applied for the first time. The remaining decrease was mainly attributable to lower operating revenues in Postbank driven by the impact of de-risking activities and also reflecting a low interest rate environment, as well as lower releases of loan loss allowances recorded prior to consolidation (which are shown as interest income). Further, retail client investment activity remained muted, primarily in Germany, and continued low market levels as well as ongoing uncertainties during the quarter adversely im-pacted the funds business. Overall, the Group’s net revenues in the first quarter 2012 were € 9.2 billion, after a € 257 million impairment charge related to our exposure in Actavis recorded in Corporate Investments, which is a decrease of € 1.3 billion, or 12 %, versus the first quarter 2011.
Provision for credit losses was € 314 million in the quarter, a decrease of 16 %, from € 373 million in the first quarter 2011. The decrease was mainly attributable to lower provisions recorded at Postbank and the positive performance of our retail portfolio as well as the successful sales of non-performing loans, partly offset by higher provision for credit losses in CIB, being in line with our expectation. The provision for credit losses ex-cludes releases from Postbank related loan loss allowances recorded prior to consolidation of € 36 million which are included in net interest income.
Noninterest expenses were € 7.0 billion in the quarter, essentially unchanged compared to the first quarter 2011. Compensation related costs decreased by € 622 million as a result of lower performance related com-pensation, based on lower operating performance and a reduced deferred compensation charge for em-ployees eligible for career retirement. These effects were offset by litigation related charges (approximately € 210 million) and increased policyholder benefits and claims in Abbey Life, both in Corporate Banking & Secu-rities (CB&S). The first quarter 2012 also included an accrual of € 73 million for the German bank levy in Con-solidation & Adjustments (C&A) which did not occur in the prior year quarter. In addition, there was a negative impact of € 40 million related to a buyback offer for a specific closed-end fund in Private & Business Clients (PBC).
Deutsche Bank Management Report 10 Interim Report as of March 31, 2012 Operating and Financial Review
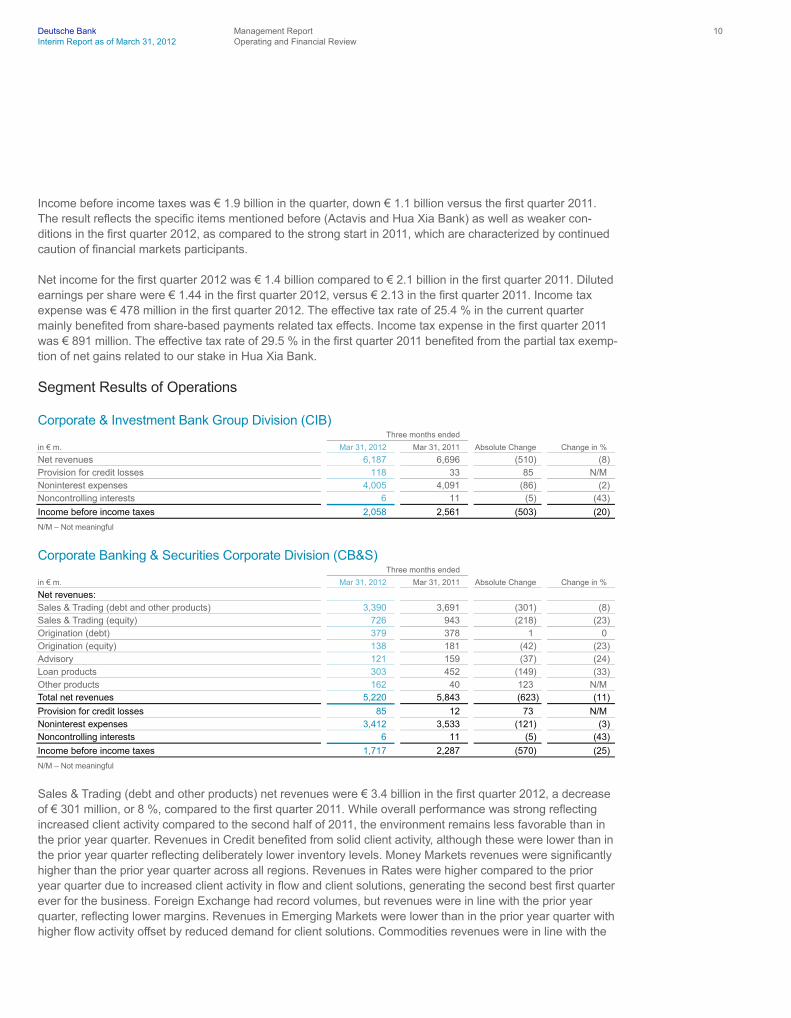
Income before income taxes was € 1.9 billion in the quarter, down € 1.1 billion versus the first quarter 2011. The result reflects the specific items mentioned before (Actavis and Hua Xia Bank) as well as weaker con-ditions in the first quarter 2012, as compared to the strong start in 2011, which are characterized by continued caution of financial markets participants.
Net income for the first quarter 2012 was € 1.4 billion compared to € 2.1 billion in the first quarter 2011. Diluted earnings per share were € 1.44 in the first quarter 2012, versus € 2.13 in the first quarter 2011. Income tax expense was € 478 million in the first quarter 2012. The effective tax rate of 25.4 % in the current quarter mainly benefited from share-based payments related tax effects. Income tax expense in the first quarter 2011 was € 891 million. The effective tax rate of 29.5 % in the first quarter 2011 benefited from the partial tax exemp-tion of net gains related to our stake in Hua Xia Bank.
Segment Results of Operations
Corporate & Investment Bank Group Division (CIB) Three months ended
in € m. Mar 31, 2012 Mar 31, 2011 Absolute Change Change in %
Net revenues 6,187 6,696 (510) (8) Provision for credit losses 118 33 85 N/M Noninterest expenses 4,005 4,091 (86) (2) Noncontrolling interests 6 11 (5) (43)
Income before income taxes 2,058 2,561 (503) (20)
N/M – Not meaningful
Corporate Banking & Securities Corporate Division (CB&S) Three months ended
in € m. Mar 31, 2012 Mar 31, 2011 Absolute Change Change in %
Net revenues: Sales & Trading (debt and other products) 3,390 3,691 (301) (8) Sales & Trading (equity) 726 943 (218) (23) Origination (debt) 379 378 1 0 Origination (equity) 138 181 (42) (23) Advisory 121 159 (37) (24) Loan products 303 452 (149) (33) Other products 162 40 123 N/M Total net revenues 5,220 5,843 (623) (11)
Provision for credit losses 85 12 73 N/M Noninterest expenses 3,412 3,533 (121) (3) Noncontrolling interests 6 11 (5) (43)
Income before income taxes 1,717 2,287 (570) (25)
N/M – Not meaningful
Sales & Trading (debt and other products) net revenues were € 3.4 billion in the first quarter 2012, a decrease of € 301 million, or 8 %, compared to the first quarter 2011. While overall performance was strong reflecting increased client activity compared to the second half of 2011, the environment remains less favorable than in the prior year quarter. Revenues in Credit benefited from solid client activity, although these were lower than in the prior year quarter reflecting deliberately lower inventory levels. Money Markets revenues were significantly higher than the prior year quarter across all regions. Revenues in Rates were higher compared to the prior year quarter due to increased client activity in flow and client solutions, generating the second best first quarter ever for the business. Foreign Exchange had record volumes, but revenues were in line with the prior year quarter, reflecting lower margins. Revenues in Emerging Markets were lower than in the prior year quarter with higher flow activity offset by reduced demand for client solutions. Commodities revenues were in line with the

Deutsche Bank Management Report 11 Interim Report as of March 31, 2012 Operating and Financial Review
prior year quarter, with a strong performance across all products. RMBS revenues were significantly lower than in the prior year quarter, reflecting reduced client demand.
Sales & Trading (equity) generated net revenues of € 726 million in the first quarter 2012, a decrease of € 218 million, or 23 %, compared to the first quarter 2011. While improved market sentiment was reflected in increases across major equity indices, industry-wide client activity remained significantly lower than in the prior year quarter. Equity Trading revenues were lower than in the prior year quarter despite market share increases in Europe and the U.S, reflecting lower industry-wide market volumes as well as the non-recurrence of a gain on the sale of our stake in the Russian stock exchange RTS in the prior year quarter. Equity Derivative reve-nues were also lower than in the prior year quarter due to reduced flow and corporate volumes. Prime Finance revenues were in line with the prior year quarter, as higher balances were offset by pricing pressures. During the quarter Deutsche Bank was voted number one for European Sales, Trading, and Research in Institutional Investor 2012 All-Europe surveys.
Origination and Advisory generated revenues of € 638 million in the first quarter 2012, a decrease of € 79 million, or 11 %, compared to the first quarter 2011, reflecting lower industry-wide activity. Deutsche Bank was ranked number three globally by share of Corporate Finance fees, its highest ranking ever. Deutsche Bank was also ranked top five across M&A, Equity Origination, and Debt Origination globally. Advisory revenues of € 121 million were down 24 % on the prior year quarter reflecting subdued activity levels compared to the prior year, and Deutsche Bank was ranked number five for the quarter. Debt Origination revenues of € 379 million were in line with the prior year quarter, and Deutsche Bank was ranked number two in All International Bonds and number two in All Bonds in Europe, according to Thomson Reuters. Equity Origination revenues de-creased by 23 % to € 138 million compared to the prior year quarter reflecting lower industry-wide equity capi-tal market activity, although issuance levels grew towards the end of the quarter as volatility declined. Deutsche Bank was ranked number five globally in equity issuance and number one in IPOs (Bloomberg). (All rankings sourced from Dealogic unless stated otherwise).
Loan products revenues were € 303 million in the first quarter 2012, a decrease of € 149 million, or 33 %, on the prior year quarter due to the combination of reduced balances, markdowns and the net effect of move-ments in credit spreads.
Deutsche Bank Management Report 12 Interim Report as of March 31, 2012 Operating and Financial Review
Net revenues from other products were € 162 million in the first quarter 2012, an increase of € 123 million from the prior year quarter. This increase was driven by higher mark-to-market gains on investments held to back insurance policyholder claims in Abbey Life, which are offset in noninterest expenses.
Provision for credit losses in CB&S were a net charge of € 85 million in the first quarter 2012 compared to a low net charge of € 12 million in the prior year quarter.
Noninterest expenses were € 3.4 billion in the first quarter 2012, a decrease of € 121 million, or 3 %, compared to the first quarter 2011. This decrease was substantially driven by lower performance related compensation, based on lower operating performance and a reduced deferred compensation charge for employees eligible for career retirement. These decreases were partly offset by approximately € 210 million of litigation related ex-penses, and the impact of the afore-mentioned effects from Abbey Life.
Income before income taxes in CB&S was € 1.7 billion in the first quarter 2012, compared to € 2.3 billion in the prior year quarter.
Global Transaction Banking Corporate Division (GTB) Three months ended
in € m. Mar 31, 2012 Mar 31, 2011 Absolute Change Change in %
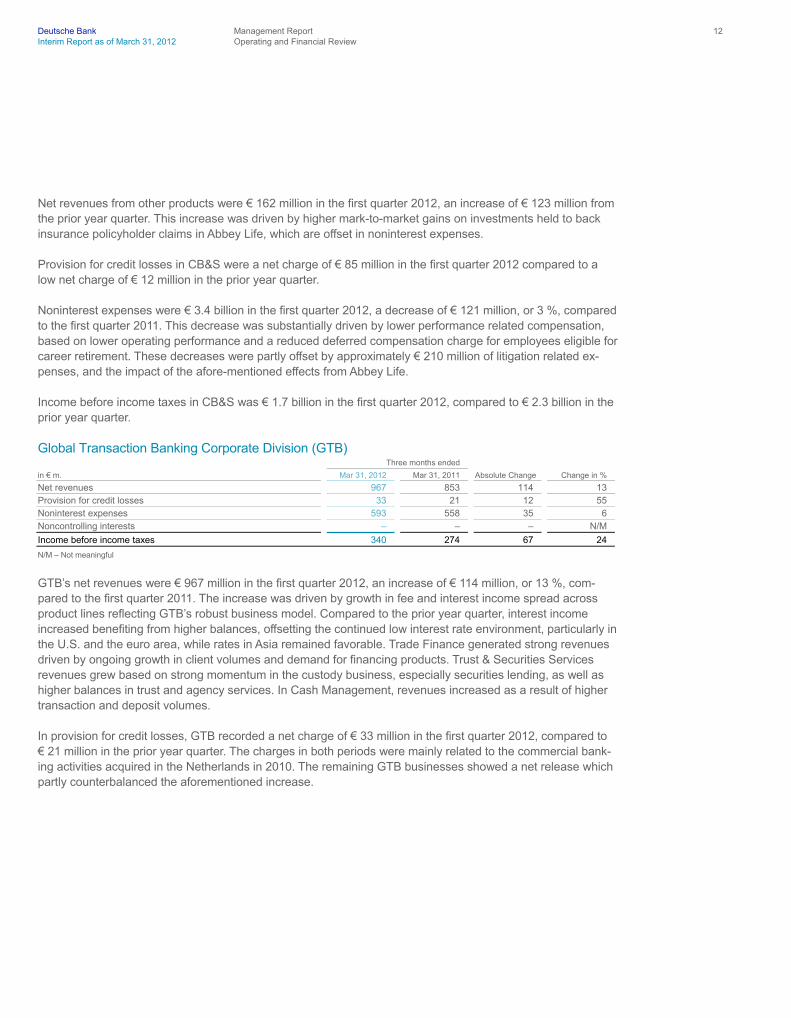
Net revenues 967 853 114 13 Provision for credit losses 33 21 12 55 Noninterest expenses 593 558 35 6 Noncontrolling interests – – – N/M
Income before income taxes 340 274 67 24
N/M – Not meaningful
GTB’s net revenues were € 967 million in the first quarter 2012, an increase of € 114 million, or 13 %, com-pared to the first quarter 2011. The increase was driven by growth in fee and interest income spread across product lines reflecting GTB’s robust business model. Compared to the prior year quarter, interest income increased benefiting from higher balances, offsetting the continued low interest rate environment, particularly in the U.S. and the euro area, while rates in Asia remained favorable. Trade Finance generated strong revenues driven by ongoing growth in client volumes and demand for financing products. Trust & Securities Services revenues grew based on strong momentum in the custody business, especially securities lending, as well as higher balances in trust and agency services. In Cash Management, revenues increased as a result of higher transaction and deposit volumes.
In provision for credit losses, GTB recorded a net charge of € 33 million in the first quarter 2012, compared to € 21 million in the prior year quarter. The charges in both periods were mainly related to the commercial bank-ing activities acquired in the Netherlands in 2010. The remaining GTB businesses showed a net release which partly counterbalanced the aforementioned increase.

Deutsche Bank Management Report 13 Interim Report as of March 31, 2012 Operating and Financial Review
Noninterest expenses of € 593 million in the first quarter 2012 were up € 35 million, or 6 %, compared to the first quarter 2011. This increase was mainly driven by performance related compensation as well as insurance related costs. In addition, integration costs for the acquisition in the Netherlands contributed to this increase.
Income before income taxes was € 340 million for the quarter, an increase of € 67 million, or 24 %, compared to the prior year quarter.
Private Clients and Asset Management Group Division (PCAM) Three months ended
in € m. Mar 31, 2012 Mar 31, 2011 Absolute Change Change in %
Net revenues 3,384 4,074 (690) (17) Provision for credit losses 194 338 (144) (43) Noninterest expenses 2,604 2,680 (76) (3) Noncontrolling interests 30 78 (47) (61)
Income before income taxes 555 978 (423) (43)
Asset and Wealth Management Corporate Division (AWM) Three months ended
in € m. Mar 31, 2012 Mar 31, 2011 Absolute Change Change in %
Net revenues: Discretionary portfolio management/fund management (AM) 384 416 (32) (8) Discretionary portfolio management/fund management (PWM) 102 110 (9) (8)
Total discretionary portfolio management/fund management 486 526 (40) (8) Advisory/brokerage (PWM) 199 230 (31) (14) Credit products (PWM) 102 94 8 8 Deposits and payment services (PWM) 67 35 32 92
Other products (AM) (4) 26 (30) N/M Other products (PWM) 34 91 (57) (63)
Total other products 29 116 (87) (75) Total net revenues 883 1,002 (119) (12)
Provision for credit losses 0 19 (18) (98) Noninterest expenses 739 792 (52) (7) Noncontrolling interests 1 1 (0) (6)
Income before income taxes 142 190 (48) (25)
Breakdown of AWM by business
Asset Management: Net revenues 380 441 (62) (14) Provision for credit losses (0) 0 (0) N/M Noninterest expenses 325 366 (40) (11)
Income before income taxes 54 75 (20) (27)
Private Wealth Management: Net revenues 503 561 (57) (10) Provision for credit losses 0 19 (18) (98) Noninterest expenses 414 426 (12) (3)
Income (loss) before income taxes 88 116 (28) (24)
N/M – Not meaningful

Deutsche Bank Management Report 14 Interim Report as of March 31, 2012 Operating and Financial Review
AWM reported net revenues of € 883 million in the first quarter 2012, a decrease of € 119 million, or 12 %, compared to the same period in 2011. Revenues from other products declined by € 87 million (from € 116 million to € 29 million) compared to the same period last year. Of this decline € 57 million, or 63 %, was attributable to Private Wealth Management (PWM), which was significantly impacted by positive effects from the realignment of Sal. Oppenheim in 2011. The remaining decline in revenues from other products of € 30 million was attributable to Asset Management (AM) reflecting lower gains on sale of investments. Discre-tionary portfolio management/fund management revenues in AWM decreased by € 40 million, or 8 %. The decline was € 32 million in AM and € 9 million in PWM. Both developments were driven by negative market impacts resulting in lower asset flows and lower performance fees. Advisory/brokerage revenues decreased by € 31 million, or 14 %, to € 199 million. This was mainly driven by a lower client activity reflecting investor uncer-tainty. Partly offsetting these decreases were € 32 million (or 92 %) higher revenues in deposits and payment services compared to the same period in 2011, mainly due to the launch of various product initiatives targeting stable funding. Revenues from credit products were € 8 million, or 8 %, higher compared to the first quarter 2011, mainly due to higher lending volume in Asia/Pacific and Americas.
Provision for credit losses decreased to a level below € 1 million by € 18 million compared to the same period last year, mainly related to lower provisions in Sal. Oppenheim.
Noninterest expenses in the first quarter 2012 were € 739 million, down by € 52 million, or 7 %, compared to the first quarter 2011. The decline reflected mainly lower retention and severance expenses. In addition, the decrease also reflected improved platform efficiencies in AM.
In the first quarter 2012, AWM recorded an income before income taxes of € 142 million compared to € 190 million in the first quarter last year. Income before income taxes declined by € 28 million in PWM and by € 20 million in AM.
Invested Assets in AWM increased € 7 billion to € 820 billion in the first quarter of 2012. In PWM, invested assets were € 278 billion, an increase of € 9 billion compared to December 31, 2011. The increase included € 11 billion due to market appreciation and € 2 billion net inflows, partly offset by € 3 billion from foreign curren-cy movements. Invested assets in AM decreased by € 2 billion. Net outflows of € 10 billion, mainly related to one single customer in Europe, and negative effects from foreign currency movements of € 8 billion, were partly offset by € 16 billion due to market appreciation.

Deutsche Bank Management Report 15 Interim Report as of March 31, 2012 Operating and Financial Review
Private & Business Clients Corporate Division (PBC) Three months ended
in € m. Mar 31, 2012 Mar 31, 2011 Absolute Change Change in %
Net revenues: Discretionary portfolio management/fund management 54 72 (19) (26) Advisory/brokerage 257 290 (33) (11) Credit products 545 547 (2) (0) Deposits and payment services 550 519 31 6 Other products 1,096 1,644 (548) (33) Total net revenues 2,501 3,072 (571) (19)
Provision for credit losses 194 320 (126) (39) Noninterest expenses 1,865 1,888 (23) (1) Noncontrolling interests 29 77 (47) (62)
Income before income taxes 413 788 (375) (48)
Breakdown of PBC by business
Advisory Banking Germany: Net revenues 1,031 1,038 (7) (1) Provision for credit losses 5 50 (45) (90) Noninterest expenses 835 757 78 10
Income before income taxes 191 231 (40) (17)
Advisory Banking International: Net revenues 497 707 (210) (30) Provision for credit losses 64 63 1 1 Noninterest expenses 306 345 (39) (11)
Income before income taxes 127 298 (171) (57)
Consumer Banking Germany:
1 Net revenues 972 1,327 (354) (27) Provision for credit losses 125 206 (81) (39) Noninterest expenses 723 785 (62) (8) Noncontrolling interests 29 77 (47) (62)
Income before income taxes 95 258 (164) (63) 1 Postbank (including purchase price adjustments, noncontrolling interests and other transaction related components).
Net revenues in the first quarter 2012 were € 2.5 billion, down € 571 million, or 19 %, compared to the first quarter 2011. Most of this decline was attributable to lower revenues from other products, which decreased by € 548 million. This development reflected the non-recurrence of a one time positive impact of € 263 million related to our stake in Hua Xia Bank. In addition, Postbank contributed € 354 million to the decrease, with € 972 million revenues in the current quarter, compared to € 1.3 billion in the prior year quarter. The decrease was attributable to lower operating revenues driven by the impact of de-risking activities and also reflecting a low interest rate environment, as well as lower releases of loan loss allowances recorded prior to consolidation (which are shown as interest income). Furthermore, revenues in Postbank were negatively affected by € 34 million impairments on Greek government bonds. Advisory/brokerage revenues were down by € 33 million, or 11 %, in both Advisory Banking Germany and International. Revenues from discretionary portfolio manage-ment/fund management decreased by € 19 million, or 26 %, mainly in Advisory Banking Germany. Both product categories were impacted by the ongoing reluctance of retail clients to invest. Revenues from deposits and payment services were € 550 million, up € 31 million, or 6 %, compared to the first quarter 2011, mainly driven by an increase in deposit volumes in both Advisory Banking units. Credit products revenues were essentially unchanged, compared to the first quarter 2011. Increased revenues resulting from higher loan volumes offset the impact of lower margins in all major regions of Advisory Banking.
Deutsche Bank Management Report 16 Interim Report as of March 31, 2012 Operating and Financial Review
Provision for credit losses was € 194 million in the first quarter of 2012 versus € 320 million in the first quarter 2011, of which € 125 million and € 206 million, respectively, related to Postbank. The decrease of € 81 million in Postbank provision for credit losses was attributable to releases of loan loss allowances recorded after con-solidation. In the current quarter, releases of loan loss allowances recorded prior to consolidation were € 36 million (versus € 117 million in the first quarter 2011) and are reported as net interest income. Excluding Postbank, provisions for credit losses decreased by € 44 million, compared to the same quarter last year. The decrease was primarily attributable to an improved credit performance in consumer finance. In addition, the decline was attributable to a positive impact from the sale of non-performing loan portfolios of € 51 million, whereas the first quarter 2011 included a positive effect from portfolio sales of € 33 million.
Noninterest expenses were € 1.9 billion in the first quarter 2012, slightly below the first quarter 2011. The decrease included € 54 million related to Postbank, mainly due to lower operating expenses and the non-recurrence of expenses related to measures recorded in the prior year’s quarter. Excluding Postbank (and costs related to Postbank integration reflected in Advisory Banking Germany), noninterest expenses were up € 31 million, mainly resulting from a negative impact of € 40 million related to a buyback offer for a specific closed-end fund.
Income before income taxes was € 413 million in the first quarter, a decrease of € 375 million, or 48 %, com-pared to the first quarter 2011. The decrease was mainly driven by the non-recurrence of the aforementioned one time positive impact in Advisory Banking International related to our share in Hua Xia Bank. Advisory Banking International recorded an income before income taxes of € 127 million in the current quarter compared to € 298 million in the prior year quarter. Income before income taxes in Advisory Banking Germany was € 191 million in the current quarter and € 231 million in the first quarter 2011. In Consumer Banking Germany income before income taxes was € 95 million and € 258 million, respectively.
Invested assets were € 308 billion as of March 31, 2012, up € 5 billion compared to December 31, 2011. The increase was driven by € 6 billion related to market appreciation, partly offset by € 1 billion of net outflows.
PBC’s total number of clients was 28.5 million, of which 14.0 million related to Postbank. PBC’s number of clients at March 31, 2012 was essentially unchanged from December 31, 2011.
Corporate Investments Group Division (CI) Three months ended
in € m. Mar 31, 2012 Mar 31, 2011 Absolute Change Change in %
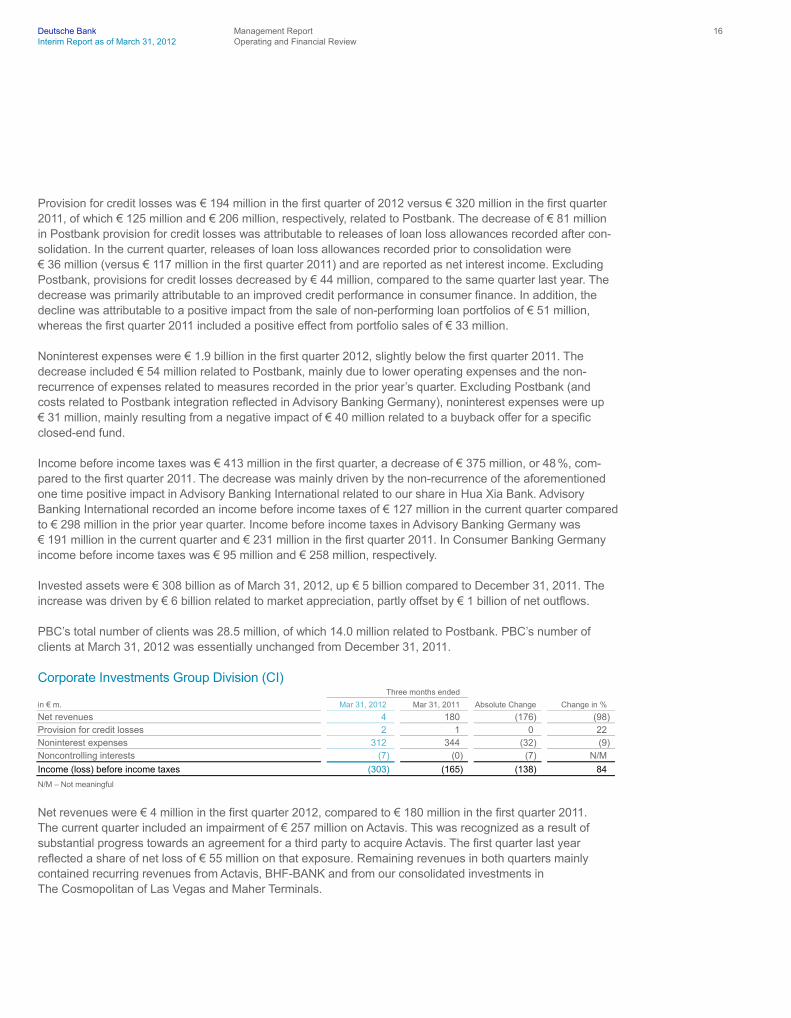
Net revenues 4 180 (176) (98) Provision for credit losses 2 1 0 22 Noninterest expenses 312 344 (32) (9) Noncontrolling interests (7) (0) (7) N/M
Income (loss) before income taxes (303) (165) (138) 84
N/M – Not meaningful
Net revenues were € 4 million in the first quarter 2012, compared to € 180 million in the first quarter 2011. The current quarter included an impairment of € 257 million on Actavis. This was recognized as a result of substantial progress towards an agreement for a third party to acquire Actavis. The first quarter last year reflected a share of net loss of € 55 million on that exposure. Remaining revenues in both quarters mainly contained recurring revenues from Actavis, BHF-BANK and from our consolidated investments in The Cosmopolitan of Las Vegas and Maher Terminals.

Deutsche Bank Management Report 17 Interim Report as of March 31, 2012 Operating and Financial Review
Noninterest expenses were € 312 million in the first quarter 2012, compared to € 344 million in the same period last year. The decrease was mainly related to a specific charge in the first quarter 2011 that was related to the at that time announced sale of the Group’s headquarters in Frankfurt am Main.
CI recorded a loss before income taxes of € 303 million in the first quarter 2012 and of € 165 million in the first quarter 2011.
Consolidation & Adjustments (C&A) Three months ended
in € m. Mar 31, 2012 Mar 31, 2011 Absolute Change Change in %
Net revenues (382) (476) 94 (20) Provision for credit losses 0 (0) 0 N/M Noninterest expenses 79 (34) 113 N/M Noncontrolling interests (29) (89) 59 (67)
Income (loss) before income taxes (431) (353) (78) 22
N/M – Not meaningful
Loss before income taxes in Consolidation & Adjustments (C&A) was € 431 million in the first quarter 2012, compared to € 353 million in the prior year.
Revenues in both periods included significant negative effects from different accounting methods used for management reporting and IFRS. These amounted to € 319 million in the current quarter, of which approxi-mately half was driven by the development of U.S. dollar/euro basis swap spreads. The Group predominantly funds its operations in euro and then converts some of these funds into U.S. dollars using the basis swap mar-ket. The funding and the related basis swaps represent an economically hedged position and different account-ing methods may result in material effects in C&A. While the funding instrument is accounted for at amortized costs, the mark-to-market valuation of the swaps is sensitive to movements in U.S. dollar/euro mid- to long-term basis swap spreads. These valuation related timing effects reverse over the life of these positions. In the current year quarter, these spreads narrowed significantly resulting in a mark-to-market loss. Revenues in the current quarter also included mark-to-market losses of approximately € 70 million from the narrowing of the credit spreads of certain of our own debt as well as effects of approximately € 80 million from different account-ing methods related to economically hedged short-term positions which resulted from changes in short-term euro interest rates and from the reversal of prior period interest rate effects. This accounting difference was the main driver for the loss before income taxes of € 353 million in the first quarter 2011. Revenues in both periods also reflected negative effects from the hedging of net investments in certain foreign operations.

Deutsche Bank Management Report 18 Interim Report as of March 31, 2012 Operating and Financial Review
Noninterest expenses in the current year quarter included the accrual for the German bank levy of € 73 million, whereas in the prior year, the accrual for the German bank levy only started in the second quarter. The positive effect in C&A from the reversal of noncontrolling interests, which are deducted from income before income taxes of the divisions, was mostly related to Postbank in both quarters. It significantly decreased in comparison to the prior year quarter.
Financial Position
The table below shows information on our financial position.
in € m. Mar 31, 2012 Dec 31, 2011
Cash and due from banks 14,700 15,928 Interest-earning deposits with banks 126,784 162,000 Central bank funds sold, securities purchased under resale agreements and securities borrowed 73,111 57,110 Trading assets 258,504 240,924 Positive market values from derivative financial instruments 759,231 859,582 Financial assets designated at fair value through profit or loss
1 186,908 180,293 Loans 407,501 412,514 Brokerage and securities related receivables 170,820 122,810 Remaining assets 105,736 112,942 Total assets 2,103,295 2,164,103
Deposits 588,319 601,730 Central bank funds purchased, securities sold under repurchase agreements and securities loaned 66,602 43,401 Trading liabilities 69,044 63,886 Negative market values from derivative financial instruments 738,120 838,817 Financial liabilities designated at fair value through profit or loss
2 111,608 118,318 Other short-term borrowings 59,901 65,356 Long-term debt 163,061 163,416 Brokerage and securities related payables 183,772 139,733 Remaining liabilities 67,063 74,786 Total liabilities 2,047,490 2,109,443
Total equity 55,805 54,660 1 Includes securities purchased under resale agreements designated at fair value through profit or loss of € 125,611 million and € 117,284 million and securities
borrowed designated at fair value through profit or loss of € 25,912 million and € 27,261 million as of March 31, 2012 and December 31, 2011, respectively. 2 Includes securities sold under repurchase agreements designated at fair value through profit or loss of € 83,197 million and € 93,606 million as of March 31, 2012 and
December 31, 2011, respectively.
Movements in Assets As of March 31, 2012, total assets were € 2,103 billion. The decrease of € 61 billion, or 3 %, compared to December 31, 2011, was primarily driven by lower positive market values from derivative financial instruments and interest-earning deposits with banks, partially offset by increases in brokerage and securities related re-ceivables and trading assets. Foreign exchange movement, in particular between U.S. dollar and euro, con-tributed € 30 billion to the overall reduction of our balance sheet in the first quarter 2012.
Positive market values from derivative financial instruments were down by € 100 billion, predominantly driven by increasing yield curves and tightening of credit spreads during the first quarter 2012. Interest-earning depos-its with banks were down by € 35 billion from the elevated level observed at year-end 2011.

Deutsche Bank Management Report 19 Interim Report as of March 31, 2012 Operating and Financial Review
Brokerage and securities related receivables were up € 48 billion compared to December 31, 2011, as volumes increased over the course of the year from traditionally lower year-end levels. Trading assets were up by € 18 billion, predominantly driven by debt securities.
Movements in Liabilities Total liabilities were down by € 62 billion to € 2,047 billion, primarily driven by lower negative market values from derivative financial instruments, partially offset by increases in brokerage and securities related payables.
Negative market values from derivative financial instruments were down by € 101 billion, while brokerage and securities related payables were up € 44 billion compared to December 31, 2011, driven by the same factors as the corresponding asset positions.
Equity As of March 31, 2012, total equity was € 55.8 billion, an increase of € 1.1 billion or 2 %, compared to € 54.7 billion as of December 31, 2011. The main factors contributing to this development were net income attributable to Deutsche Bank shareholders of € 1.4 billion and a decrease of € 575 million in our balance of treasury shares which are deducted from equity, partly offset by a decrease in the noncontrolling interests of € 423 million and a reduction of additional paid-in capital of € 259 million. The decrease in the noncontrolling interests was mainly caused by the exercise of Deutsche Post’s put option on Postbank shares. The resulting increase in Postbank shares led in turn to an increase in additional paid-in capital. The above mentioned net reduction of additional paid-in capital is mainly driven by net changes in share awards.
Regulatory Capital Starting December 31, 2011, the calculation of the Group’s regulatory capital and capital ratios incorporates the amended capital requirements for trading book and securitization positions following the Capital Requirements Directive 3, also known as “Basel 2.5”. The Bank’s Tier 1 capital ratio was 13.4 % as of March 31, 2012, up from 12.9 % at December 31, 2011. The Tier 1 capital ratio was positively impacted by the reduction of risk-weighted assets. The core Tier 1 capital ratio, which excludes hybrid capital instruments, was 10.0 % as of March 31, 2012, compared to 9.5 % at the end of 2011. Tier 1 capital as of March 31, 2012, was € 49.4 billion, € 372 million higher than at the end of 2011. The positive impact of the first quarter’s net income attributable to Deutsche Bank shareholders of € 1.4 billion was partly offset by effects from changes in foreign exchange rates, dividend accruals and equity compensation effects. Risk-weighted assets were € 368 billion as of March 31, 2012, € 13 billion lower than at the end of 2011, largely reflecting reductions in credit risk and, to a lesser extent, market risk as well as changes in foreign exchange rates.
Amendments to IAS 39 and IFRS 7, “Reclassification of Financial Assets” Under the amendments to IAS 39 and IFRS 7 issued in October 2008, certain financial assets were reclassi-fied in the second half of 2008 and the first quarter of 2009 from the financial assets at fair value through profit or loss and the available for sale classifications into the loans classification. The reclassifications were made in instances where management believed that the expected repayment of the assets exceeded their estimated fair values, which reflected the significantly reduced liquidity in the financial markets, and that returns on these assets would be optimized by holding them for the foreseeable future. Where this clear change of intent exist-ed and was supported by an ability to hold and fund the underlying positions, we concluded that the reclassifi-cations aligned the accounting more closely with the business intent.

Deutsche Bank Management Report 20 Interim Report as of March 31, 2012 Operating and Financial Review
As of March 31, 2012 and December 31, 2011 the carrying value of reclassified assets was € 22.1 billion and € 22.9 billion, respectively, compared with a fair value of € 19.8 billion and € 20.2 billion as of March 31, 2012 and December 31, 2011, respectively. These assets are predominantly held in CB&S.
Please refer to the section “Amendments to IAS 39 and IFRS 7, “Reclassification of Financial Assets”” on page 61 for additional information on the impact of reclassification.
Update on Key Credit Market Exposures The following is an update on the development of certain credit positions (including protection purchased from monoline insurers) of certain CB&S businesses on which we have previously provided additional risk disclo-sures. There have been no significant developments since December 31, 2011, with respect to our commercial paper holdings in Ocala or those mortgage related exposures described in our 2011 Financial Report – Man-agement Report: Operating and Financial Review. Our gross exposure to U.S. subprime and Alt-A RMBS and CDO declined from € 2.4 billion at December 31, 2011 to € 2.3 billion at March 31, 2012. Net of hedges and other protection purchased, we had negative exposures (i.e., we would recognize a gain were all of the gross positions to default) of € 146 million at December 31, 2011 and € 62 million at March 31, 2012.
The following is an update on the development on protection purchased from monoline insurers.
Monoline exposure related to U.S. residential mortgages
1,2 Mar 31, 2012 Dec 31, 2011
in € m. Notional amount
Fair value prior to CVA
3 CVA
3
Fair value after CVA
3 Notional amount
Fair value prior to CVA
3 CVA
3
Fair value after CVA
3
AA Monolines:
4 Other subprime 118 63 (17) 46 124 65 (20) 45 Alt-A 3,335 1,519 (255) 1,264 3,662 1,608 (353) 1,255
Total AA Monolines 3,453 1,582 (272) 1,310 3,786 1,673 (373) 1,300 1 Excludes counterparty exposure to monoline insurers that relates to wrapped bonds of € 48 million as of March 31, 2012 and € 52 million as of December 31, 2011, which represents an estimate of
the potential mark-downs of wrapped assets in the event of monoline defaults. 2 A portion of the mark-to-market monoline exposure has been mitigated with CDS protection arranged with other market counterparties and other economic hedge activity. 3 For monolines with actively traded CDS, the credit valuation adjustment (CVA) is calculated using a full CDS-based valuation model. For monolines without actively traded CDS, a model-based
approach is used with various input factors, including relevant market driven default probabilities, the likelihood of an event (either a restructuring or an insolvency), an assessment of any potential settlement in the event of a restructuring, and recovery rates in the event of either restructuring or insolvency. The monolines CVA methodology is reviewed on a quarterly basis by management.
4 Ratings are the lowest of Standard & Poor’s, Moody’s or our own internal credit ratings as of March 31, 2012 and December 31, 2011.
Deutsche Bank Management Report 21 Interim Report as of March 31, 2012 Operating and Financial Review
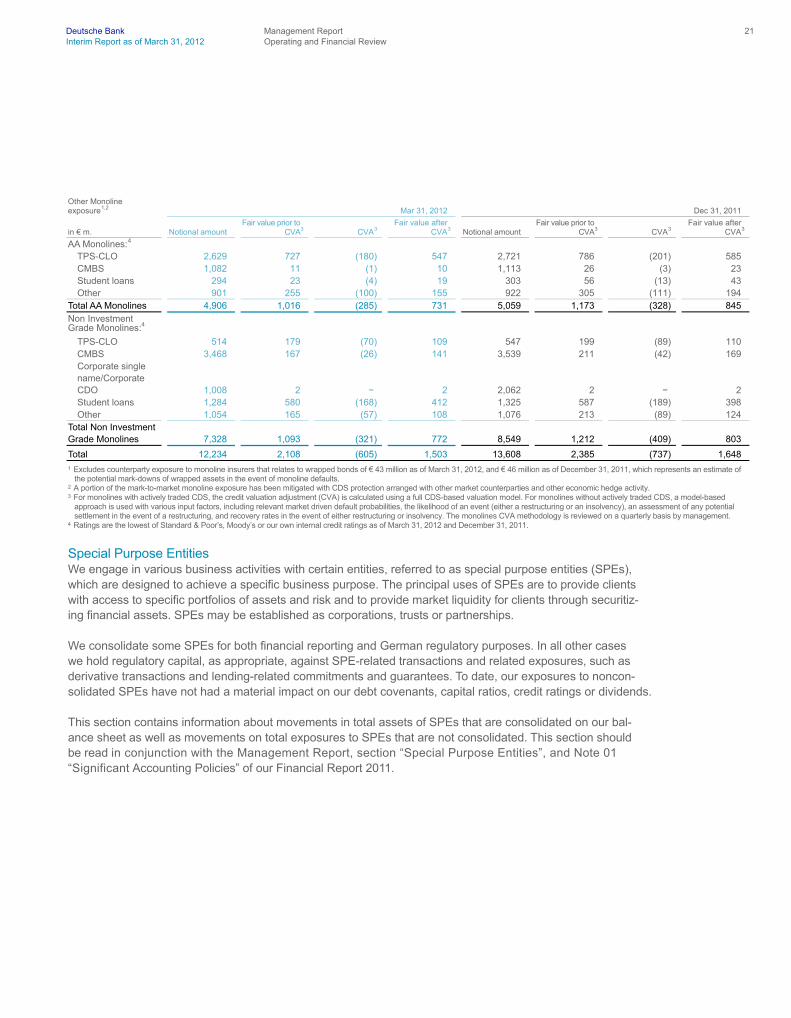
Other Monoline exposure
1,2 Mar 31, 2012 Dec 31, 2011
in € m. Notional amount
Fair value prior to CVA
3 CVA
3
Fair value after CVA
3 Notional amount
Fair value prior to CVA
3 CVA
3
Fair value after CVA
3
AA Monolines:
4 TPS-CLO 2,629 727 (180) 547 2,721 786 (201) 585 CMBS 1,082 11 (1) 10 1,113 26 (3) 23 Student loans 294 23 (4) 19 303 56 (13) 43 Other 901 255 (100) 155 922 305 (111) 194
Total AA Monolines 4,906 1,016 (285) 731 5,059 1,173 (328) 845 Non Investment Grade Monolines:4
TPS-CLO 514 179 (70) 109 547 199 (89) 110 CMBS 3,468 167 (26) 141 3,539 211 (42) 169 Corporate single name/Corporate CDO
1,008 2 − 2 2,062 2 − 2
Student loans 1,284 580 (168) 412 1,325 587 (189) 398 Other 1,054 165 (57) 108 1,076 213 (89) 124
Total Non Investment Grade Monolines 7,328 1,093 (321) 772 8,549 1,212 (409) 803
Total 12,234 2,108 (605) 1,503 13,608 2,385 (737) 1,648 1 Excludes counterparty exposure to monoline insurers that relates to wrapped bonds of € 43 million as of March 31, 2012, and € 46 million as of December 31, 2011, which represents an estimate of
the potential mark-downs of wrapped assets in the event of monoline defaults. 2 A portion of the mark-to-market monoline exposure has been mitigated with CDS protection arranged with other market counterparties and other economic hedge activity. 3 For monolines with actively traded CDS, the credit valuation adjustment (CVA) is calculated using a full CDS-based valuation model. For monolines without actively traded CDS, a model-based
approach is used with various input factors, including relevant market driven default probabilities, the likelihood of an event (either a restructuring or an insolvency), an assessment of any potential settlement in the event of a restructuring, and recovery rates in the event of either restructuring or insolvency. The monolines CVA methodology is reviewed on a quarterly basis by management.
4 Ratings are the lowest of Standard & Poor’s, Moody’s or our own internal credit ratings as of March 31, 2012 and December 31, 2011.
Special Purpose Entities We engage in various business activities with certain entities, referred to as special purpose entities (SPEs), which are designed to achieve a specific business purpose. The principal uses of SPEs are to provide clients with access to specific portfolios of assets and risk and to provide market liquidity for clients through securitiz-ing financial assets. SPEs may be established as corporations, trusts or partnerships.
We consolidate some SPEs for both financial reporting and German regulatory purposes. In all other cases we hold regulatory capital, as appropriate, against SPE-related transactions and related exposures, such as derivative transactions and lending-related commitments and guarantees. To date, our exposures to noncon-solidated SPEs have not had a material impact on our debt covenants, capital ratios, credit ratings or dividends.
This section contains information about movements in total assets of SPEs that are consolidated on our bal-ance sheet as well as movements on total exposures to SPEs that are not consolidated. This section should be read in conjunction with the Management Report, section “Special Purpose Entities”, and Note 01 “Significant Accounting Policies” of our Financial Report 2011.

Deutsche Bank Management Report 22 Interim Report as of March 31, 2012 Operating and Financial Review
Total Assets in Consolidated SPEs These tables provide details about the assets (after consolidation eliminations) in our consolidated SPEs.
Mar 31, 2012 Asset type
in € m.
Financial assets at fair value through profit or loss
1
Financial assets available for sale
Loans
Cash and cash equivalents
Other assets
Total assets
Category: Group sponsored ABCP conduits
2 − 32 9,881 1 30 9,944 Group sponsored securitizations 2,120 441 1,157 3 46 3,767 Third party sponsored securitizations
3 1,891 − 487 13 143 2,534 Repackaging and investment products 4,429 1,012 196 882 371 6,890 Mutual funds 4,797 − − 1,078 16 5,891 Structured transactions 2,421 118 3,748 22 350 6,659 Operating entities 2,292 3,816 3,158 75 3,269 12,610 Other 162 267 543 170 585 1,727
Total 18,112 5,686 19,170 2,244 4,810 50,022 1 Fair value of derivative positions was € 649 million. 2 Decrease due to the paydown of certain facilities during the period. 3 Increase due to the consolidation of certain Collateralized Mortgage Obligations in the period.
Dec 31, 2011 Asset type
in € m.
Financial assets at fair value through profit or loss
1
Financial assets available for sale
Loans
Cash and cash equivalents
Other assets
Total assets
Category: Group sponsored ABCP conduits − 39 10,998 1 33 11,071 Group sponsored securitizations 2,044 191 1,169 3 48 3,455 Third party sponsored securitizations − − 493 14 156 663 Repackaging and investment products 5,032 971 207 606 409 7,225 Mutual funds 3,973 − − 1,934 566 6,473 Structured transactions 2,425 43 3,748 22 334 6,572 Operating entities 2,116 3,879 3,228 102 3,439 12,764 Other 114 239 329 84 548 1,314
Total 15,704 5,362 20,172 2,766 5,533 49,537 1 Fair value of derivative positions was € 580 million.

Deutsche Bank Management Report 23 Interim Report as of March 31, 2012 Operating and Financial Review
Exposure to Nonconsolidated SPEs This table details the maximum unfunded exposure remaining to certain nonconsolidated SPEs.
Maximum unfunded exposure remaining
in € bn. Mar 31, 2012 Dec 31, 2011
Category: Group sponsored ABCP conduits 1.1 1.2 Third party ABCP conduits 1.9 1.9 Third party sponsored securitizations U.S.
1 1.4 1.6 non-U.S. 1.3 1.4 Guaranteed mutual funds
2 10.3 9.8 Real estate leasing funds 0.7 0.7 1 Decrease is due to the maturity of certain facilities during the period. 2 Increase is due to improved fund performance and client inflows during the period.
Related Party Transactions
We have business relationships with a number of companies in which we own significant equity interests. We also have business relationships with a number of companies where members of our Management Board hold positions on boards of directors or non-executive boards. Our business relationships with these companies cover many of the financial services we provide to our clients generally. For more detailed information, please refer to the section “Other Financial Information” of this Interim Report.
Events after the Reporting Date
As a result of the substantial progress towards an agreement for a third party to acquire Actavis, CI recognized an impairment loss of € 257 million in the first quarter 2012.
As of April 25, 2012, we classified our exposure in Actavis (recorded within CI) as held for sale following further progress towards an agreement for a third party to acquire Actavis. Currently, we do not anticipate further ma-terial financial impacts in this regard.

Deutsche Bank Management Report 24 Interim Report as of March 31, 2012 Risk Report
Risk Report
Risk Management Framework The wide variety of our businesses requires us to identify, measure, aggregate and manage our risks effective-ly, and to allocate our capital among our businesses appropriately. We operate as an integrated group through our divisions, business units and infrastructure functions. We manage risk and capital through a framework of principles, organizational structures as well as measurement and monitoring processes that are closely aligned with the activities of the divisions and business units. Further information about our risk management frame-work, which has remained principally unchanged, can be found in our Financial Report 2011.
Postbank conducts its own risk management activities under its own statutory responsibilities. We provide advisory services to Postbank with regard to specific risk management areas.
Credit Exposure We classify our credit exposure under two broad headings: corporate credit exposure and consumer credit exposure.
— Our corporate credit exposure consists of all exposures not defined as consumer credit exposure. — Our consumer credit exposure consists of our smaller-balance standardized homogeneous loans, primarily
in Germany, Italy and Spain, which include personal loans, residential and nonresidential mortgage loans, overdrafts and loans to self-employed and small business customers of our private and retail business.
Corporate Credit Exposure The following table breaks down several of our main corporate credit exposure categories according to the creditworthiness categories of our counterparties.
Mar 31, 2012
in € m. Loans
1
Irrevocable lending commitments
2 Contingent liabilities OTC derivatives
3 Debt securities available for sale Total
AAA-AA 50,283 19,687 8,042 32,443 22,415 132,870 A 43,101 35,240 22,055 15,923 7,970 124,289 BBB 55,619 36,118 19,410 14,793 4,758 130,698 BB 51,673 22,785 12,641 6,538 2,465 96,102 B 16,482 9,631 5,940 2,649 168 34,870 CCC and below 18,640 2,212 1,598 1,531 217 24,198
Total 235,798 125,673 69,686 73,877 37,993 543,027 1 Includes impaired loans mainly in category CCC and below amounting to € 5.8 billion as of March 31, 2012. 2 Includes irrevocable lending commitments related to consumer credit exposure of € 9.9 billion as of March 31, 2012. 3 Includes the effect of netting agreements and cash collateral received where applicable.

Deutsche Bank Management Report 25 Interim Report as of March 31, 2012 Risk Report
Dec 31, 2011
in € m. Loans
1
Irrevocable lending commitments
2 Contingent liabilities OTC derivatives
3 Debt securities available for sale Total
AAA-AA 51,321 21,152 6,535 37,569 22,753 139,330 A 45,085 37,894 24,410 17,039 8,581 133,009 BBB 59,496 36,659 21,002 12,899 5,109 135,165 BB 50,236 21,067 13,986 7,478 2,303 95,070 B 17,650 9,152 6,051 3,007 263 36,123 CCC and below 18,148 2,071 1,669 1,632 371 23,891
Total 241,936 127,995 73,653 79,624 39,380 562,588 1 Includes impaired loans mainly in category CCC and below amounting to € 6.0 billion as of December 31, 2011. 2 Includes irrevocable lending commitments related to consumer credit exposure of € 9.2 billion as of December 31, 2011. 3 Includes the effect of netting agreements and cash collateral received where applicable.
The above table shows an overall decrease in our corporate credit exposure during the first quarter of 2012 amounting to € 20 billion or 3 % which primarily reflects decreases in loans of € 6 billion, OTC derivatives of € 6 billion, contingent liabilities of € 4 billion and in irrevocable lending commitments of € 2 billion, all predomi-nantly in investment grade rated exposures.
Credit Risk Exposure to certain European Countries Certain European countries are presented within the tables below due to their heightened sovereign default risk caused by the wider European sovereign debt crisis. This heightened risk is driven by a number of factors impacting the associated sovereign including large public debt levels, limited access to capital markets, high credit default swap spreads, proximity of debt repayment dates, poor economic fundamentals and outlook (including low gross domestic product growth, high unemployment and the necessity to implement various austerity measures) and the fact that some of these countries have accepted “bail out” packages. We also monitor other European countries very closely given their associated exposures to these certain countries as well as to their recent rating downgrades although their observed risk factors currently do not warrant inclusion in this disclosure.
The following table provides our risk management perspective of our aggregate net credit risk exposure con-sidering the domicile of the group parent, thereby reflecting the one obligor principle. These exposures consid-er derivative netting and are net of hedges and collateral. Also, in our risk management we classify exposure to special purpose entities based on the domicile of the underlying assets as opposed to the domicile of the spe-cial purpose entities.
in € m. Mar 31, 2012 Dec 31, 2011
Greece 547 840Ireland 1,771 1,570Italy 17,967 18,064Portugal 1,412 1,733Spain 12,466 12,750
Total 34,163 34,957
Net credit exposure is down € 794 million since year-end 2011 primarily driven by reductions in the Postbank portfolio related to Financial Institutions exposure in Portugal and Spain as well as in Greece partly due to the participation in the Greek government bonds restructuring.
Deutsche Bank Management Report 26 Interim Report as of March 31, 2012 Risk Report
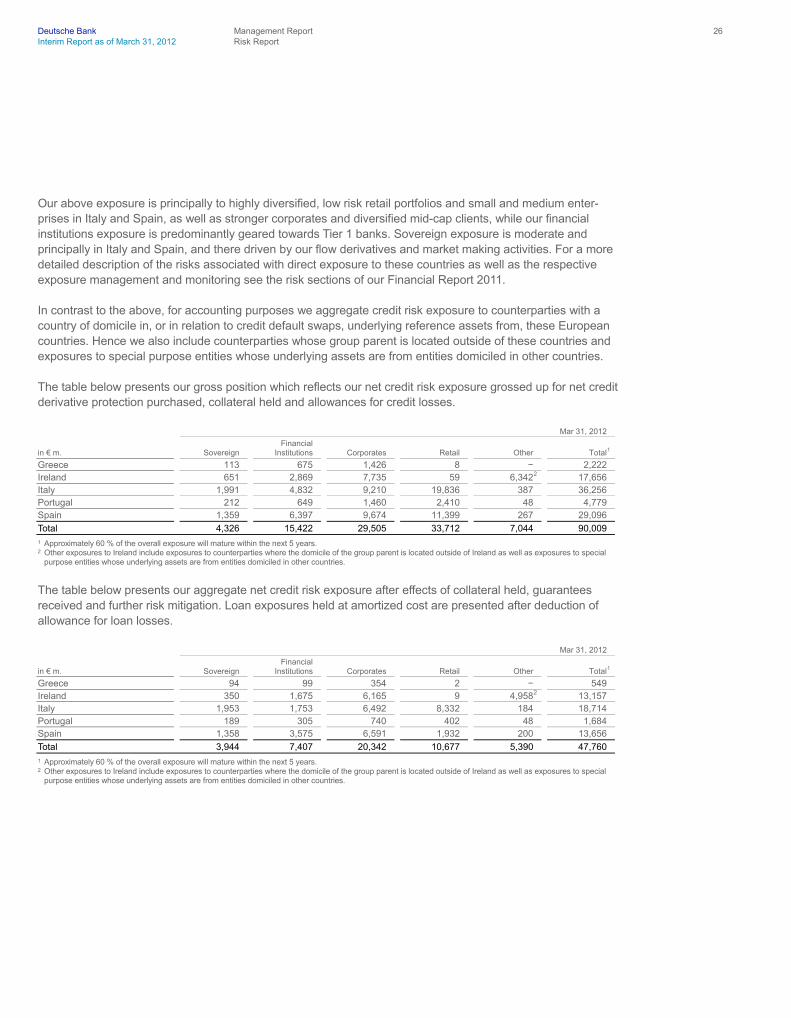
Our above exposure is principally to highly diversified, low risk retail portfolios and small and medium enter-prises in Italy and Spain, as well as stronger corporates and diversified mid-cap clients, while our financial institutions exposure is predominantly geared towards Tier 1 banks. Sovereign exposure is moderate and principally in Italy and Spain, and there driven by our flow derivatives and market making activities. For a more detailed description of the risks associated with direct exposure to these countries as well as the respective exposure management and monitoring see the risk sections of our Financial Report 2011.
In contrast to the above, for accounting purposes we aggregate credit risk exposure to counterparties with a country of domicile in, or in relation to credit default swaps, underlying reference assets from, these European countries. Hence we also include counterparties whose group parent is located outside of these countries and exposures to special purpose entities whose underlying assets are from entities domiciled in other countries.
The table below presents our gross position which reflects our net credit risk exposure grossed up for net credit derivative protection purchased, collateral held and allowances for credit losses.
Mar 31, 2012
in € m. Sovereign
Financial Institutions
Corporates
Retail
Other
Total
1
Greece 113 675 1,426 8 − 2,222 Ireland 651 2,869 7,735 59 6,342
2 17,656 Italy 1,991 4,832 9,210 19,836 387 36,256 Portugal 212 649 1,460 2,410 48 4,779 Spain 1,359 6,397 9,674 11,399 267 29,096
Total 4,326 15,422 29,505 33,712 7,044 90,009 1 Approximately 60 % of the overall exposure will mature within the next 5 years. 2 Other exposures to Ireland include exposures to counterparties where the domicile of the group parent is located outside of Ireland as well as exposures to special
purpose entities whose underlying assets are from entities domiciled in other countries.
The table below presents our aggregate net credit risk exposure after effects of collateral held, guarantees received and further risk mitigation. Loan exposures held at amortized cost are presented after deduction of allowance for loan losses.
Mar 31, 2012
in € m. Sovereign
Financial Institutions
Corporates
Retail
Other
Total
1
Greece 94 99 354 2 − 549 Ireland 350 1,675 6,165 9 4,958
2 13,157 Italy 1,953 1,753 6,492 8,332 184 18,714 Portugal 189 305 740 402 48 1,684 Spain 1,358 3,575 6,591 1,932 200 13,656
Total 3,944 7,407 20,342 10,677 5,390 47,760 1 Approximately 60 % of the overall exposure will mature within the next 5 years. 2 Other exposures to Ireland include exposures to counterparties where the domicile of the group parent is located outside of Ireland as well as exposures to special
purpose entities whose underlying assets are from entities domiciled in other countries.

Deutsche Bank Management Report 27 Interim Report as of March 31, 2012 Risk Report
In arriving at our net exposure the principal cause of the reduction from the gross position is the application of collateral held, in particular with respect to the retail category, but also for financial institutions, predominantly in relation to derivative margining arrangements, as well as for corporates. Other adjustments to arrive at our net exposure include credit derivatives with underlying reference assets domiciled in one of the above countries as well as allowance for credit losses.
The table below provides an overview of our aggregate net credit risk exposure to counterparties with a coun-try of domicile in, or in relation to credit default swaps, underlying reference assets from, these European coun-tries, broken down by type of financial instrument. Exposures are presented after effects of collateral held, guarantees received and further risk mitigation but excluding net notional amounts of credit derivatives for protection sold/(bought). Loan exposures held at amortized cost are presented before and after deduction of allowance for loan losses.
Financial assets carried at amortized cost
Financial assets measured at fair value
Financial instruments at fair value through profit or loss Mar 31, 2012
in € m.
Loans before loan loss allowance
Loans after loan loss allowance
Other
1
Financial assets available for sale
2
Derivatives Other
Total
3
Greece 213 198 22 42 126 122 510 Ireland 4,498 4,487 2,774 1,333 2,107 3,703 14,404 Italy 12,429 11,838 3,617 1,273 3,471 (2,371) 17,828 Portugal 1,107 1,081 246 167 327 473 2,294 Spain 6,438 6,009 3,087 3,312 547 1,139 14,094
Total 24,685 23,613 9,746 6,127 6,578 3,066 49,130 1 Primarily includes contingent liabilities and undrawn lending commitments. 2 Excludes equities and other equity interests. 3 After loan loss allowances.
The following table provides an overview of our credit derivative exposure with sovereign and non-sovereign underlying assets domiciled in, or in relation to credit default swaps, underlying reference assets from, these European countries. The table presents the notional amounts for protection sold and protection bought on a gross level as well as the resulting net notional position and its fair value. For a more detailed description of our usage of credit derivatives to manage credit risk see the respective risk sections of our Financial Report 2011.
Notional amounts Mar 31, 2012
in € m. Protection sold
Protection bought
Net protection sold/(bought)
Net fair value
Greece 2,322 (2,284) 39 (7) Ireland 11,117 (12,363) (1,246) 36 Italy 61,010 (60,125) 885 94 Portugal 12,255 (12,865) (610) 18 Spain 35,772 (36,210) (438) 8
Total 122,476 (123,847) (1,370) 149

Deutsche Bank Management Report 28 Interim Report as of March 31, 2012 Risk Report
The table below provides an overview of our aggregate undrawn exposure to counterparties with a country of domicile in certain European countries. Terms and conditions related to any potential limitations of the counter-party being able to draw down on available facilities are included within the specific contractual documentation.
Mar 31, 2012
in € m. Sovereign
Financial Institutions
Corporates
Retail
Other
Total
Greece − 5 156 2 − 163 Ireland − 5 1,287 3 353 1,648 Italy 13 679 3,471 267 − 4,430 Portugal − 42 136 39 − 217 Spain − 436 2,866 587 − 3,889
Total 13 1,167 7,916 898 353 10,347
Sovereign Credit Risk Exposure to certain European Countries Following the October 26, 2011, Euro Summit Statement and the February 21, 2012, Eurogroup Statement, on February 24, 2012 the Greek government, made an invitation to private sector holders of bonds issued or guaranteed by the Greek government to participate in a debt exchange offer and/or consent solicitations, re-ferred to as the Private Sector Involvement (PSI). The bonds invited to participate in the PSI had an aggregate outstanding face amount of approximately € 206 billion. The debt exchange offer and consent solicitations were aimed at maximizing the PSI in the overall support package being offered to Greece, in conjunction with the support provided by the official sector (IMF, EU, ECB), thereby mitigating the likelihood of Greece default-ing on its obligations.
In March 2012, we participated in the exchange offer and consent solicitations with all our Greek Government Bonds (GGB) eligible in this respect. Under the PSI, GGB holders, in exchange, received (i) new bonds issued by the Greek government having a face amount equal to 31.5 % of the face amount of their exchanged bonds, (ii) European Financial Stability Facility (EFSF) notes with a maturity of two years or less having a face amount of 15 % of the face amount of their exchanged bonds and (iii) detachable securities linked to the Greece gross domestic product issued by the Greek government having a notional amount equal to the face amount of each holder’s new bonds. The Greek government also delivered short-term EFSF notes to discharge all unpaid interest accrued up to February 24, 2012, on exchanged bonds.
The bonds that we tendered in the debt exchange were derecognized and the new instruments recognized at fair value classified as either financial assets available for sale or at fair value through profit or loss.

Deutsche Bank Management Report 29 Interim Report as of March 31, 2012 Risk Report
The below sovereign information includes, in the figures as of March 31, 2012, the Greek government bonds received as part of the rescheduling.
The following table provides an overview of our sovereign credit risk exposure to certain European Countries.
Mar 31, 2012 Dec 31, 2011
in € m.
Direct Sovereign exposure
1
Net Notional of CDS referencing sovereign debt
Net sovereign exposure
Memo Item: Net fair value of CDS referencing sovereign debt
2
Direct Sovereign exposure
1
Net Notional of CDS referencing sovereign debt
Net sovereign exposure
Memo Item: Net fair value of CDS referencing sovereign debt
2
Greece 113 (19) 94 6 433 15 448 (50) Ireland 314 37 350 (26) 208 (27) 181 (21) Italy 66 1,886 1,953 97 176 1,591 1,767 1 Portugal 212 (23) 189 4 116 (161) (45) 16 Spain 1,141 218 1,358 (37) 1,026 292 1,318 (13)
Total 1,846 2,099 3,944 44 1,959 1,710 3,669 (67) 1 Includes sovereign debt classified as financial assets/liabilities at fair value through profit or loss, available for sale and loans carried at amortized cost. 2 The amounts reflect the net fair value in relation to default swaps referencing sovereign debt of the respective country representing the counterparty credit risk.
The above shown amounts reflect a net “accounting view” of our sovereign exposure. With the exception of Greece, the increase compared to year-end 2011 mainly reflects market making activities as well as fair value changes from market price movements occurring within the first three months of 2012.
The above mentioned direct sovereign exposure included the carrying value of positions held at amortized cost which, as of March 31, 2012, amounted to € 619 million for Italy and € 730 million for Spain and, as for December 31, 2011 amounted to € 546 million for Italy and € 752 million for Spain.
The following table provides an overview of the fair value of our sovereign credit risk exposure to certain Euro-pean countries classified as financial assets at fair value through profit or loss.
Mar 31, 2012 Dec 31, 2011
in € m. Fair value of sovereign debt
Fair value of derivatives with sovereign counterparties (net position)
1
Total fair value of sovereign exposures
Fair value of sovereign debt
Fair value of derivatives with sovereign counterparties (net position)
1
Total fair value of sovereign exposures
Greece 40 30 70 197 25 222 Ireland 42 14 56 (32) 7 (25) Italy
2 (3,812) 2,562 (1,250) (3,325) 2,332 (993) Portugal 108 72 180 81 4 85 Spain 184 30 214 52 28 80
Total (3,438) 2,708 (730) (3,027) 2,396 (631) 1 Includes the impact of master netting and collateral arrangements. 2 Short sovereign debt position for Italy predominantly related to structured trades with corresponding credit derivatives offset.

Deutsche Bank Management Report 30 Interim Report as of March 31, 2012 Risk Report
The following table provides an overview of our sovereign credit risk exposure to certain European countries classified as financial assets available for sale.
Mar 31, 2012 Dec 31, 2011
in € m. Fair value of sovereign debt
Original carrying amount
1
Accumulated impairment losses recognized in net income
Fair value of sovereign debt
Original carrying amount
1
Accumulated impairment losses recognized in net income
Greece 42 53
2 −
3 211 494 (368) Ireland 258 213 − 232 213 − Italy 697 726 − 625 724 − Portugal 33 44 − 31 46 − Spain 197 194 − 193 194 −
Total 1,227 1,230 − 1,292 1,671 (368) 1 For positions acquired as part of the acquisition of Postbank on December 3, 2010, the original carrying amount reflects the fair value of those positions at that date. 2 For positions subject to the Greek debt rescheduling on March 12, 2012, the original carrying amount reflects the fair value at their initial recognition. 3 The accumulated impairment losses recognized in net income for Greece reflect impairment losses incurred on positions recognized since the Greek debt
rescheduling on March 12, 2012. The accumulated impairment losses recognized in net income until the Greek debt rescheduling including effects from the derecognition of previously outstanding positions and the initial recognition of new positions amounted to € 389 million.
Consumer Credit Exposure The table below presents our total consumer credit exposure, consumer loan delinquencies in terms of loans that are 90 days or more past due, and net credit costs, which are the annualized net provisions charged after recoveries. Loans 90 days or more past due and net credit costs are both expressed as a percentage of total exposure.
Total exposure in € m.
90 days or more past due as a % of total exposure
Net credit costs as a % of total exposure
1
Mar 31, 2012 Dec 31, 2011 Mar 31, 2012 Dec 31, 2011 Mar 31, 2012 Dec 31, 2011
Consumer credit exposure Germany: 135,849 135,069 0.87 % 0.95 % 0.31 % 0.49 %
Consumer and small business financing 20,059 19,805 1.33 % 1.88 % 1.18 % 1.55 % Mortgage lending 115,790 115,264 0.79 % 0.79 % 0.15 % 0.31 %
Consumer credit exposure outside Germany 39,934 39,672 4.06 % 3.93 % 0.56 % 0.61 %
Consumer and small business financing 13,818 13,878 7.57 % 7.22 % 1.31 % 1.31 % Mortgage lending 26,116 25,794 2.21 % 2.15 % 0.16 % 0.23 %
Total consumer credit exposure
2 175,783 174,741 1.60 % 1.63 % 0.36 % 0.52 % 1 Releases of allowances for credit losses established by consolidated entities prior to their consolidation are not included in the ratio until December 31, 2011 but
recorded through net interest income (for detailed description see next section “Impaired Loans”). Taking such amounts into account, the net credit costs as a percentage of total exposure would have amounted to 0.42 % as of December 31, 2011. In the first quarter 2012 releases of our consolidated entities are included in the net credit costs.
2 Includes impaired loans amounting to € 3.4 billion as of March 31, 2012, and € 3.4 billion as of December 31, 2011.

Deutsche Bank Management Report 31 Interim Report as of March 31, 2012 Risk Report
The volume of our total consumer credit exposure increased by € 1.0 billion, or 0.6 %, from year-end 2011 to March 31, 2012. Postbank contributed a net exposure increase of € 292 million, where increases are mainly originated in Germany. The volume of our consumer credit exposure excluding Postbank rose by € 748 million, or 0.8 %, from year-end 2011 to March 31, 2012, mainly driven by our mortgage lending activities in Germany (up € 600 million) and in Poland (up € 242 million, mainly foreign exchange effects).
In total, the 90 days or more past due ratio remains nearly unchanged. The reduced ratio in Germany is mainly driven by a sale of non performing loans in the first quarter of 2012. The increase in the ratio in our consumer credit exposure outside Germany is due to changes in the charge-off criteria for certain portfolios in 2009, which increased the time until the respective loans are completely charged-off. Assuming no change in under-lying credit performance, the effect of our changed charge-off practice will continue to increase the 90 days or more past due ratio until the portfolio has reached a steady state, which is expected approximately 5 years after the change in charge-off criteria.
The reduction of net credit costs as percentage of total exposure is mainly driven by the aforementioned sale of non performing loans in Germany, but also without the sale net credit costs would have been reduced.
Impairment Loss and Allowance for Loan Losses We consider loans to be impaired when we recognize objective evidence that an impairment loss has been incurred. We first assess whether objective evidence of impairment exists individually for loans that are individ-ually significant. We then assess collectively for loans that are not individually significant and loans which are significant but for which there is no objective evidence of impairment under the individual assessment. We reduce the carrying amount of the impaired loan by the use of an allowance account and recognize the amount of the loss in the consolidated statement of income as a component of the provision for credit losses. We rec-ord increases to our allowance for loan losses as an increase of the provision for loan losses in our consoli-dated statement of income. Charge-offs reduce our allowance while recoveries, if any, are credited to the al-lowance account. If we determine that we no longer require allowances which we have previously established, we decrease our allowance and record the amount as a reduction of the provision for loan losses in our consol-idated statement of income.
As a result of consolidations we acquired certain loans for which a specific allowance had been established beforehand by the consolidated entity. Such loans were taken onto our balance sheet at their fair values as determined by their expected cash flows which reflected the credit quality of these loans at the time of acquisi-tion. Loan loss allowances established for acquired loans prior to their consolidation, have not been consoli-dated into our stock of loan loss allowances. Instead, we have considered these loan loss allowances in determining the fair value representing the cost basis of the newly consolidated loans.
As long as our cash flow expectations regarding acquired loans have not deteriorated since acquisition, we do not consider them to be impaired loans. Subsequent improvements in the credit quality of these loans are reflected as an appreciation in their carrying value with a corresponding gain recognized in net interest income. Loan loss allowances established for acquired loans after consolidation are included in our provision for credit losses and loan loss allowances. Deterioration in credit quality of the acquired loans at the acquired entity results in an impairment of the full loan from a Group consolidated perspective, but with an allowance for loan losses only established for the portion reflecting the incremental deterioration in credit quality. Improvements in credit quality or charge-offs of loans for which the allowances for loan losses were established prior to their consolidation do not offset the aforementioned increases.

Deutsche Bank Management Report 32 Interim Report as of March 31, 2012 Risk Report
Postbank’s methodology for establishing loan loss allowances is similar to that of the Group. Exceptions in-clude the fact that Postbank executes direct charge-offs without first establishing a loan loss allowance and the fact that the loan loss allowances in its retail mortgage portfolio are assessed individually for loans being 180 days or more past due. In reflecting Postbank in our consolidated results, the effects of the aforementioned differences have been aligned to our policies for reporting purposes.
Impaired Loans The following two tables show the breakdown of IFRS impaired loans by region and industry sector.
Mar 31, 2012 Dec 31, 2011
in € m. Individually assessed
Collectively assessed
Total
Individually assessed
Collectively assessed
Total
Germany 1,789 1,471 3,260 1,750 1,474 3,224 Western Europe (excluding Germany) 2,778 1,618 4,396 2,910 1,675 4,585 Eastern Europe 40 204 244 52 189 241 North America 916 76 992 999 75 1,074 Central and South America 49 − 49 40 0 40 Asia/Pacific 242 3 245 267 3 270 Africa − − − 0 0 0 Other 1 − 1 − 0 0
Total 5,815 3,372 9,187 6,018 3,416 9,434
Mar 31, 2012 Dec 31, 2011
in € m. Individually assessed
Collectively assessed Total
Individually assessed
Collectively assessed Total
Banks and insurance 109 − 109 91 − 91 Fund management activities 537 1 538 917 − 917 Manufacturing 621 165 786 616 162 778 Wholesale and retail trade 337 140 477 324 138 462 Households 483 2,551 3,034 394 2,616 3,010 Commercial real estate activities 2,532 239 2,771 2,582 224 2,806 Public sector − − − − 0 0 Other 1,197 276 1,473 1,094 276 1,370
Total 5,815 3,372 9,187 6,018 3,416 9,434
Our total impaired loans were € 9.2 billion, a decrease of € 247 million or 3 % during the first three months of 2012 due to charge-offs of € 462 million and € 18 million as a result of exchange rate movements, offset by a € 233 million gross increase of impaired loans. The decrease was mainly driven by the charge-off of a small number of impaired loans held against clients domiciled in Western Europe (excluding Germany) and North America and the overall lower level of newly defaulted credit exposures.

Deutsche Bank Management Report 33 Interim Report as of March 31, 2012 Risk Report
Individually assessed impaired loans decreased by € 203 million or 3 % to € 5.8 billion, driven by charge-offs of € 283 million and € 32 million of exchange rate movements which were partly offset by gross increases of € 112 million. The overall decrease of individually assessed impaired loans is attributable to the aforemen-tioned charge-offs mainly in the industry sector fund management activities and to the lower level of new im-paired loans in all industry segments.
Our collectively assessed impaired loans amounted to € 3.4 billion, reflecting a slight decrease of € 44 million or 1 %, driven by € 179 million charge-offs, partially offset by gross increases of € 121 million and € 14 million of exchange rate movements.
In the first quarter of 2012 impaired loans recorded at Postbank increased from a Group perspective by € 30 million to € 2.0 billion. The increase in impaired loans compared to previous quarters was significantly lower as the gross increase of impaired loans was nearly offset by charge-offs of impaired loans with a low level of allowances established after consolidation.
Our impaired loans included € 1.4 billion of loans among the loans that had been reclassified to loans and receivables in accordance with IAS 39. For these loans we recorded decreases in impaired loans of € 50 million, driven by gross decreases of € 16 million, charge-offs amounting of € 16 million and exchange rate movements of € 18 million.
Movements in the Allowance for Credit Losses Our allowance for credit losses is comprised of the allowance for loan losses and the allowance for off-balance sheet provisions.
The following table provides a breakdown of the movements in our allowance for loan losses for the periods specified.
Allowance for loan losses Three months ended Mar 31, 2012 Three months ended Mar 31, 2011
in € m. Individually assessed
Collectively assessed
Total
Individually assessed
Collectively assessed
Total
Balance, beginning of year 2,011 2,150 4,162 1,643 1,653 3,296
Provision for loan losses 184 139 324 154 215 369 Net charge-offs (274) (96) (370) (129) (101) (230)
Charge-offs (283) (179) (462) (135) (157) (292) Recoveries 9 83 92 6 56 62
Changes in the group of consolidated companies − − − − − − Exchange rate changes/other (34) 0 (34) (47) (26) (73)
Balance, end of period 1,887 2,194 4,081 1,621 1,741 3,362

Deutsche Bank Management Report 34 Interim Report as of March 31, 2012 Risk Report
The following table shows the activity in our allowance for off-balance sheet positions, which consist of contin-gent liabilities and lending-related commitments.
Allowance for off-balance sheet positions Three months ended Mar 31, 2012 Three months ended Mar 31, 2011
in € m. Individually assessed
Collectively assessed
Total Individually assessed
Collectively assessed
Total
Balance, beginning of year 127 98 225 108 110 218
Provision for off-balance sheet positions (10) 1 (9) 5 (1) 4 Usage − − − − − − Changes in the group of consolidated companies − − − − − − Exchange rate changes − (1) (1) (1) (5) (5)
Balance, end of period 117 97 214 112 104 216
During the first three months of 2012, provision for credit losses was € 314 million, versus € 373 million in the first three months of 2011. In PCAM, provision for credit losses was € 194 million, versus € 338 million in the first quarter last year. The Postbank provision for credit losses was down by € 81 million to € 125 million, from € 206 million in the first quarter of 2011. In the reporting period, the Postbank provision for credit losses ex-cluded releases of loan loss allowances recorded prior to consolidation amounting to € 36 million which are included in net interest income. Excluding Postbank, provisions for credit losses in PCAM amounted to € 69 million, a reduction of € 63 million compared to the same period last year, mainly driven by the overall lower level of new provisions compared to previous quarters and by portfolio sales of non-performing loans in Germany. In CIB, provision for credit losses was € 118 million versus € 33 million in the first quarter 2011. The current quarter included € 54 million related to loans and receivables reclassified in accordance with IAS 39, versus € 22 million in the first three months of 2011. The increase in CIB is due to higher impairment charges taken against our reclassified assets for clients mainly in the Americas as well as provisions for clients outside Germany in different industry segments.
Market Risk of Trading Units excluding Postbank The following table shows the value-at-risk of the trading units of the Corporate & Investment Bank Group Division calculated with a 99 % confidence level and a one-day holding period excluding the value-at-risk of Postbank which is currently not yet integrated into the value-at-risk of Deutsche Bank Group. Our trading mar-ket risk outside of these units excluding Postbank is immaterial. “Diversification effect” reflects the fact that the total value-at-risk on a given day will be lower than the sum of the values-at-risk relating to the individual risk classes. Simply adding the value-at-risk figures of the individual risk classes to arrive at an aggregate value-at-risk would imply the assumption that the losses in all risk categories occur simultaneously.
Value-at-risk of Trading Units excluding Postbank Total Diversification effect Interest rate risk Equity price risk Foreign exchange risk Commodity price risk
in € m. 2012 2011 2012 2011 2012 2011 2012 2011 2012 2011 2012 2011
Average
1 55.0 71.8 (59.7) (66.3) 53.9 70.8 14.3 20.5 27.4 32.5 19.2 14.2 Maximum
1 65.8 94.3 (72.9) (88.6) 63.4 109.0 18.6 37.6 41.7 64.9 23.8 24.3 Minimum
1 47.3 44.9 (42.9) (41.9) 46.8 45.6 12.0 12.7 19.2 14.3 12.4 7.0 Period-end
2 65.8 50.0 (55.0) (64.1) 59.1 53.8 17.7 13.6 28.6 25.7 15.5 21.0 1 Amounts show the bands within which the values fluctuated during the period January 1 to March 31, 2012 and the full year 2011, respectively. 2 Amounts for 2012 as of March 31, 2012 and figures for 2011 as of December 31, 2011.

Deutsche Bank Management Report 35 Interim Report as of March 31, 2012 Risk Report
The value-at-risk has remained in a narrow range during the first quarter, between € 47.3 million and € 65.8 million ending the quarter near the high at € 65.8 million mainly due to slightly higher level of risk across interest rates, foreign exchange and equities and a lower level of diversification across the portfolio. The average value-at-risk for first quarter 2012 was € 55.0 million which is in line with the average for the fourth quarter 2011 but considerably lower than the average for the whole of 2011 of € 71.8 million due to risk reductions during that year.
During the first three months of 2012 our trading units achieved a positive actual income for 98% of the trading days compared to 88 % in 2011.
New Basel 2.5 Regulatory Trading Market Risk Measures The following table shows the stressed value-at-risk (with a 99 % confidence level and a one-day holding peri-od) of the trading units of our Corporate & Investment Bank Group Division.
Stressed Value-at-risk of Trading Units excluding Postbank Total Diversification effect Interest rate risk Equity price risk Foreign exchange risk Commodity price risk
in € m. 2012 2011 2012 2011 2012 2011 2012 2011 2012 2011 2012 2011
Average
1 113.6 124.4 (97.8) (109.4) 125.6 130.8 16.7 22.5 35.6 51.3 33.4 29.2 Maximum
1 129.3 169.5 (123.6) (152.3) 142.2 163.5 25.0 64.7 59.6 105.4 39.4 35.8 Minimum
1 97.1 103.8 (74.9) (77.8) 111.6 106.2 10.4 15.2 19.7 23.0 22.7 19.6 Period-end
2 119.4 111.7 (98.2) (114.5) 132.8 117.3 23.0 23.0 33.7 51.8 28.2 34.2 1 Amounts show the bands within which the values fluctuated during the period January 1 to March 31, 2012 and October 1, 2011 to December 31, 2011, respectively. 2 Amounts for 2012 as of March 31, 2012 and figures for 2011 as of December 31, 2011.
The following table shows the incremental risk charge (with a 99.9 % confidence level and one-year capital horizon) of the trading units of our Corporate & Investment Bank Group Division.
Incremental Risk Charge of Trading Units excluding Postbank Total
Global Finance and Foreign Exchange Global Rates Global Credit Trading
Emerging Markets - Debt Other
in € m. 2012 2011 2012 2011 2012 2011 2012 2011 2012 2011 2012 2011
Average
1 753.5 758.0 137.5 48.0 353.8 318.6 129.3 302.7 128.8 90.0 4.1 (1.3)Maximum
1 853.4 846.3 155.9 83.8 406.1 358.4 157.5 423.3 128.6 140.9 5.2 2.2 Minimum
1 680.0 697.1 132.6 6.5 323.3 284.7 101.5 221.9 120.5 23.9 2.2 (5.5)Period-end
2 733.4 738.0 78.0 83.8 308.7 292.7 143.0 222.0 194.2 140.9 9.5 (1.4) 1 Amounts show the bands within which the values fluctuated during the period January 1 to March 31, 2012 and October 1, 2011 to December 31, 2011, respectively. 2 Amounts for 2012 as of March 31, 2012 and figures for 2011 as of December 31, 2011.
The following table shows the comprehensive risk measure (with a 99.9 % confidence level and one-year capi-tal horizon) of the trading units of our Corporate & Investment Bank Group Division.
in € m. 2012 2011
Average
1 730.7 937.9 Maximum
1 884.2 1,007.5 Minimum
1 647.0 848.3 Period-end
2 647.0 855.7 1 Amounts show the bands within which the values fluctuated during the period January 1 to March 31, 2012 and October 1, 2011 to December 31, 2011, respectively. 2 Amounts for 2012 as of March 31, 2012 and figures for 2011 as of December 31, 2011.

Deutsche Bank Management Report 36 Interim Report as of March 31, 2012 Risk Report
As at March 31, 2012, the securitization positions and nth-to-default credit derivatives using the market risk standardized approach generated risk weighted assets of € 6.6 billion and capital deduction items of € 2.2 billion. As of December 31, 2011, these positions amounted to € 5.0 billion and € 2.2 billion respectively. As at March 31, 2012, the capital charge for longevity risk was € 26.7 million corresponding to risk weighted assets of € 334 million. As of December 31, 2011, these positions amounted to € 32.1 million and € 401 million respectively.
Market Risk of Trading Book at Postbank The following table shows the value-at-risk of Postbank’s trading book separately calculated with a 99 % confi-dence level and a one-day holding period.
Value-at-risk of Trading Book at Postbank Total Diversification effect Interest rate risk Equity price risk Foreign exchange risk Commodity price risk
in € m. 2012 2011 2012 2011 2012 2011 2012 2011 2012 2011 2012 2011
Average
1 4.9 3.2 (0.3) (0.2) 4.9 3.2 0.2 0.1 0.1 0.1 − − Maximum
1 5.9 8.2 (0.0) (0.0) 6.0 8.1 0.2 0.4 0.1 0.5 − − Minimum
1 3.3 1.1 (0.4) (0.8) 3.3 1.1 − 0.0 0.0 0.0 − − Period-end
2 4.2 3.9 (0.3) (0.0) 4.2 3.9 0.2 − 0.1 0.0 − − 1 Amounts show the bands within which the values fluctuated during the period January 1 to March 31, 2012 and the full year 2011, respectively. 2 Amounts for 2012 as of March 31, 2012 and figures for 2011 as of December 31, 2011.
Liquidity Risk The following table shows the composition of our external funding sources that contribute to the liquidity risk position as of March 31, 2012 and December 31, 2011, both in euro billion and as a percentage of our total external funding sources.
Composition of external funding sources
in € bn. (unless stated otherwise) Mar 31, 2012 Dec 31, 2011
Capital Markets and Equity 211 19 % 213 19 % Retail 277 24 % 279 24 % Transaction Banking 167 15 % 173 15 % Other Customers
1 119 10 % 110 10 % Discretionary Wholesale 117 10 % 133 12 % Secured Funding and Shorts 222 20 % 202 18 % Financing Vehicles
2 26 2 % 23 2 %
Total external funding 1,139 100 % 1,133 100 % 1 Other includes fiduciary, self-funding structures (e.g. X-markets), margin/prime brokerage cash balances (shown on a net basis). 2 Includes ABCP conduits. Reference: Reconciliation to total balance sheet: Derivatives & settlement balances € 844 billion (€ 899 billion), add-back for netting effect for Margin & Prime Brokerage cash balances (shown on a net basis) € 68 billion (€ 73 billion), other non-funding liabilities € 53 billion (€ 59 billion) for March 31, 2012, and December 31, 2011 respectively.
The increase in other customers during the first quarter of 2012 relates partly to a higher amount of net cash margin received. The lower volume of discretionary wholesale funding at the end of the first quarter 2012 is in line with a lower cash position which the bank held over quarter end. The increase of secured funding and shorts during the first three months of 2012 reflects increasing flow business in comparison to rather low year-end levels. The decrease in transaction banking deposits also reflects an anticipated reduction from elevated year-end levels. Regular stress test analyses seek to ensure that we always hold sufficient cash and liquid assets to close a potential funding gap which could open under a combined scenario comprising idiosyncratic and market related stress.
Deutsche Bank Management Report 37 Interim Report as of March 31, 2012 Risk Report
Capital Management In the first quarter 2012, we changed the methodology used for allocating average active equity to the business segments and to Consolidation & Adjustments. The total amount allocated continues to be determined based on the higher of our overall economic risk exposure or regulatory capital demand. Now, we derive our internal demand for regulatory capital assuming a Core Tier 1 ratio of 9.0 %, reflecting increased regulatory require-ments (previously, this was calculated based on a Tier 1 ratio of 10 %). As a result, the amount of capital allocated to the segments has increased.
The 2011 Annual General Meeting granted our management board the authority to buy back up to 92.9 million shares before the end of November 2015. Thereof 46.5 million shares can be purchased by using derivatives. These authorizations replaced the authorizations of the 2010 Annual General Meeting. As of the 2011 Annual General Meeting on May 26, 2011, the number of shares held in Treasury from buybacks totaled 7.6 million. During the period from the 2011 Annual General Meeting until March 31, 2012, 37.7 million shares were pur-chased, thereof none via derivatives. 38.9 million shares were used for equity compensation purposes, slightly decreasing our Treasury position. As of March 31, 2012, the number of shares held in Treasury from buybacks totaled 6.4 million.
In addition, Treasury purchased 7.0 million physically settled call options in first quarter 2012 to hedge existing equity compensation awards. These call options were purchased under the authorization from the 2011 Annual General Meeting. Of the 7.0 million call options, 3.7 million have a remaining maturity of more than 18 months.
Total outstanding hybrid Tier 1 capital (substantially all noncumulative trust preferred securities) as of March 31, 2012 amounted to € 12.4 billion compared to € 12.7 billion as of December 31, 2011. This decrease was mainly due to foreign exchange effects of the weakened U.S. dollar on our U.S. dollar denominated hybrid Tier 1 capital. During the first three months of 2012, we neither raised nor redeemed any hybrid Tier 1 capital.
In the first three months of 2012, we did not issue any lower Tier 2 capital (qualified subordinated liabilities). Qualified subordinated liabilities as of March 31, 2012, amounted to € 8.7 billion compared to € 9.4 billion as of December 31, 2011. Profit participation rights amounted to € 1.2 billion, unchanged from December 31, 2011. Cumulative preferred securities amounted to € 296 million as of March 31, 2012, virtually unchanged from December 31, 2011.
Balance Sheet Management We manage our balance sheet on a Group level excluding Postbank and, where applicable, locally in each region. In the allocation of financial resources we favor business portfolios with the highest positive impact on our profitability and shareholder value. Our balance sheet management function has the mandate to monitor and analyze balance sheet developments and to track certain market observed balance sheet ratios. Based on this we trigger discussion and management action by the Capital and Risk Committee. While we monitor IFRS balance sheet developments, our balance sheet management is principally focused on adjusted values as used in our leverage ratio target definition, which is calculated using adjusted total assets and adjusted total equity figures.

Deutsche Bank Management Report 38 Interim Report as of March 31, 2012 Risk Report
Similarly Postbank follows a value-oriented financial management approach that includes balance sheet management.
Leverage Ratio (Target Definition) We calculate our leverage ratio as a non-GAAP financial measure by dividing total assets by total equity. We disclose an adjusted leverage ratio, which is calculated using a target definition, for which the following adjustments are made to the reported IFRS assets and equity:
— Total assets under IFRS are adjusted to reflect additional netting provisions to obtain total assets adjusted. Under IFRS offsetting of financial assets and financial liabilities is required when an entity, (1) currently has a legally enforceable right to set off the recognized amounts; and (2) intends either to settle on a net basis, or to realize the asset and settle the liability simultaneously. IFRS specifically focuses on the intention to set-tle net in the ordinary course of business, irrespective of the rights in default. As most derivative contracts covered by a master netting agreement do not settle net in the ordinary course of business they must be presented gross under IFRS. Repurchase and reverse repurchase agreements are also presented gross, as they also do not settle net in the ordinary course of business, even when covered by a master netting agreement. It has been industry practice in the U.S. to net the receivables and payables on unsettled regular way trades. This is not permitted under IFRS. We make the netting adjustments described above in calculating the target definition of the leverage ratio.
— Total equity under IFRS is adjusted to reflect pro-forma fair value gains and losses on our own debt (post-tax, estimate assuming that substantially all of our own debt was designated at fair value), to obtain total equity adjusted. The tax rate applied for this calculation is a blended uniform tax rate of 35 %.
We apply these adjustments in calculating the leverage ratio according to the target definition to improve com-parability with competitors. The target definition of the leverage ratio is used consistently throughout the Group in managing the business. There will still be differences in the way competitors calculate their leverage ratios compared to our target definition of the leverage ratio. Therefore our adjusted leverage ratio should not be compared to other companies’ leverage ratios without considering the differences in the calculation. Our leverage ratio according to our target definition is not likely to be identical to, nor necessarily indicative of, what our leverage ratio would be under any current or future bank regulatory leverage ratio requirement.

Deutsche Bank Management Report 39 Interim Report as of March 31, 2012 Risk Report
The following table presents the adjustments made in calculating our leverage ratio according to the target definition.
Assets and equity in € bn. Mar 31, 2012 Dec 31, 2011
Total assets (IFRS) 2,103 2,164
Adjustment for additional derivatives netting (688) (782)
Adjustment for additional pending settlements netting (146) (105)
Adjustment for additional reverse repo netting (14) (10)
Total assets (adjusted) 1,256 1,267
Total equity (IFRS) 55.8 54.7
Adjustment for pro-forma fair value gains (losses) on the Group’s own debt (post-tax)
1 3.1 4.5
Total equity (adjusted) 58.9 59.2
Leverage ratio based on total equity
According to IFRS 38 40
According to target definition 21 21 1 The estimated cumulative tax effect on pro-forma fair value gains (losses) on such own debt was € (1.7) billion and € (2.4) billion at March 31, 2012 and at
December 31, 2011, respectively.
As of March 31, 2012, on a consolidated basis our leverage ratio according to our target definition of 21 re-mained almost unchanged compared to year-end 2011, and is well below our leverage ratio target of 25. Our leverage ratio calculated as the ratio of total assets under IFRS to total equity under IFRS was 38 as of March 31, 2012, a slight decrease compared to 40 at the end of 2011.
Overall Risk Position The table below shows our overall risk position as measured by the economic capital requirement calculated for credit, market, operational and business risk for the dates specified to determine our overall (nonregulatory) risk position, we generally consider diversification benefits across risk types except for business risk, which we aggregate by simple addition.
Economic capital requirement by risk type
in € m. Mar 31, 2012 Dec 31, 2011
Credit risk 13,045 12,812 Market Risk 11,511 12,003
Trading market risk 4,647 4,724 Nontrading market risk 6,863 7,278
Operational risk 4,919 4,846 Diversification benefit across credit, market and operational risk (4,352) (4,264)
Economic capital requirement for credit, market and operational risk 25,122 25,397
Business risk 860 980
Total economic capital requirement 25,982 26,377

Deutsche Bank Management Report 40 Interim Report as of March 31, 2012 Risk Report
As of March 31, 2012, our economic capital requirement totaled € 26.0 billion, which is € 395 million, or 1 %, below the € 26.4 billion economic capital requirement as of December 31, 2011. The lower overall economic capital requirement primarily reflected decreases in market risk. The economic capital requirement for market risk decreased by € 492 million in the first three months of 2012, largely driven by lower nontrading market risk mainly reflecting parameter recalibrations and exposure reductions. The economic capital requirement for credit risk increased by € 233 million, mainly driven by the impact of regular parameter recalibrations.
Internal Capital Adequacy As the primary measure of our Internal Capital Adequacy Assessment Process (ICAAP) we assess our internal capital adequacy based on our “gone concern approach” as the ratio of our total capital supply divided by our total capital demand as shown in the table below.
in € m.
(unless stated otherwise) Mar 31, 2012 Dec 31, 2011
Capital Supply Adjusted Active Book Equity
1 54,275 52,818 Deferred Tax Assets (8,054) (8,737) Total financial assets reclassified to loans: Fair Value Adjustments
2 (2,743) (3,323) Dividend accruals 871 697 Noncontrolling interest
3 239 694 Hybrid Tier 1 capital instruments 12,415 12,734 Tier 2 capital instruments
4 11,806 12,044
Capital Supply 68,809 66,927
Capital Demand
Economic Capital Requirement 25,982 26,377 Intangibles 15,713 15,802
Capital Demand 41,695 42,179
Internal Capital Adequacy Ratio 165 % 159 % 1 Active Book Equity adjusted for unrealized net gains (losses) on financial assets available for sale, net of applicable tax, and fair value gains on own credit-effect on
own liabilities. 2 Includes fair value adjustments for assets reclassified in accordance with IAS 39 and for banking book assets where no matched funding is available. 3 Includes noncontrolling interest up to the economic capital requirement for each subsidiary. 4 Tier 2 capital instruments excluding items to be partly deducted from Tier 2 capital pursuant to Section 10 (6) and (6a) KWG, unrealized gains on listed securities
(45 % eligible) and certain haircut-amounts that only apply under regulatory capital assessment.
A ratio of more than 100 % signifies that the total capital supply is sufficient to cover the capital demand deter-mined by the risk positions. This ratio was 165 % as of March 31, 2012, compared to 159 % as of Decem-ber 31, 2011, as the increase in capital supply, driven by higher adjusted active book equity, and reduced deduction items as well as the reduction in capital demand, reflecting decreases in market risk, developed in favor of the ratio.
Deutsche Bank Management Report 41 Interim Report as of March 31, 2012 Outlook
Outlook
The Global Economy The following section should be read in conjunction with the Outlook section in the Management Report pro-vided in the Financial Report 2011 that outlined our expectations for 2012 and 2013.
In light of the reduced risks of a renewed substantial escalation of the European sovereign debt crisis, our expectations for world economic growth have improved slightly. We have increased our forecast for global economic growth from 3.25 % to 3.5 % for 2012. This reflects the slightly better growth prospects for the euro-zone in which the recession, with GDP decreasing at 0.2 %, should be less pronounced than initially antici-pated this year. For Germany we increased our forecast to 0.5 % for 2012. In addition, the U.S. may also be able to achieve a slightly higher growth rate of 2.7 % in 2012. Our expectations have changed most concerning Japan where the redevelopment program to rectify the damages caused by the catastrophe in March 2011 is now beginning to take effect and exports should receive some momentum from rising global demand in 2012. We are now forecasting significantly higher growth of 2.8 % for Japan this year.
We maintain our forecast that sustainable global economic growth will not be achieved until the second half of the year since economic confidence deteriorated slightly again at the end of the first quarter of 2012 according to the purchasing manager surveys. Moreover, even as the European sovereign debt crisis eases, it will prob-ably continue to generate uncertainty. The situation in the Middle East poses a further risk to the global econ-omy as the political tensions which heightened in the first quarter are likely to remain at this level. This contri-buted to the sharp rise in oil prices in the first quarter, which has led us to revise our global inflation forecast for 2012 slightly upwards from 3.5 % to 3.6 %, which is nevertheless well below the level of 4.5 % in 2011. In Germany we now expect inflation to be around 2 % in comparison to 2.3 % in the previous year.
The Banking Industry In the further course of the year, the banking sector environment will be affected by macroeconomic and regu-latory developments and by the further development of the European sovereign debt crisis. The ongoing eco-nomic recovery is likely to support banks in the U.S., but not in the eurozone, where many banks, particularly in Southern Europe, may experience even harder times.
On the global level, the most important regulatory changes will probably be the legal adoption of Basel 3 and the implementation of proposals for macro-prudential supervision. In Europe, the most important changes should result from the debate about organizational and structural aspects of the universal banking principle and a potential implementation of specific taxes on the financial sector. In the U.S., the focus may be on the further specification of rules under the Dodd-Frank Act.
A stronger revival of banks’ funding markets, investment banking and asset management operations will de-pend on the success of additional steps to resolve the European sovereign debt crisis. This will require not only noticeable reforms to strengthen growth potential and improve competitiveness, but also successful austerity measures in the countries affected by crisis.

Deutsche Bank Management Report 42 Interim Report as of March 31, 2012 Outlook
If the European sovereign debt crisis can be successfully resolved, European banks might be able to proceed swiftly their restructuring efforts. These measures will be aimed at adapting to generally lower revenue levels through various means, including adjusting business models, reducing costs and raising capital ratios. The outlook remains much more positive for U.S. banks, despite substantial risks still resulting from similarly exces-sive public deficits as well as high private debt levels.
The Deutsche Bank Group Deutsche Bank is still facing further sector specific challenges caused by the changing competitive landscape and a stricter regulatory environment. Due to growing capital and liquidity requirements, risk management, capital adequacy and balance sheet efficiency will remain increasingly important as competitive differentiators. Focused on sustaining high-quality liquidity and funding profile and maintaining high capital discipline, we be-lieve that we are well prepared for the requirements of the European Banking Authority and Basel 3.
We have moved globally towards a more balanced, lower-risk business model. In 2012 and beyond, we should be able to further benefit from our strong set-up as a global investment bank and as a market leader in our home market with greater stability in revenues and a more balanced earnings mix. Additionally, we are also continuing to focus on our performance and improving efficiency.
Overall, we believe that Deutsche Bank is strongly positioned to exploit the competitive opportunities in the current environment.
The Business Segments In Corporate Banking & Securities (CB&S), we expect the investment banking environment in 2012 and 2013 to be impacted by ongoing macro concerns over Europe’s sovereign debt crisis, a potential slowdown of emerging markets and the sustainability of the U.S. recovery. In Sales & Trading, we expect that revenues from flow products such as foreign exchange, money markets, interest rates and cash equities will be affected by ongoing volatility but should remain robust given our leading client market shares, notwithstanding market con-ditions. Assuming that market conditions continue to stabilize, we expect the corporate finance fee pool to in-crease. M&A activity is expected to be robust as a cyclical recovery continues, and debt issuance is expected to increase driven by M&A related activity and disintermediation. We anticipate equity issuance to further in-crease driven by the backlog of deals from 2011.
In Global Transaction Banking, low interest rate levels will likely continue to impact net interest income in the near- and medium-term. Additionally, the recently difficult market environment may continue to have an ad-verse impact on revenues. We expect these factors to be counterbalanced to some extent by the continued strong volumes of trade finance and cash management transactions.
Deutsche Bank Management Report 43 Interim Report as of March 31, 2012 Outlook
In Asset and Wealth Management (AWM) we expect the Asset Management business to be influenced by platform re-engineering, cost efficiency efforts and the developments in the equity markets. While equity mar-kets improved and showed signs of stabilization towards end of the year and throughout the first quarter, un-certainties about sustained economic momentum continue to be a major risk in the asset management industry. The adoption and implementation of multiple new regulatory reforms continues to be a major challenge, espe-cially where uncertainty of the impact exists. We announced on February 28, 2012, that we are in exclusive negotiations with Guggenheim Partners on the sale of our Asset Management businesses that are subject to a previously-announced strategic review. The businesses include DWS Americas, the Americas mutual fund business; DB Advisors, the global institutional asset management business; Deutsche Insurance Asset Man-agement, the global insurance asset management business; and RREEF, the global alternative asset man-agement business. In Private Wealth Management (PWM), ongoing macroeconomic uncertainties and diminished transactional business may persist during the months ahead. We believe that our very close client coverage, our adequate product offerings and initial signs of market recovery will permit our general business outlook for PWM to remain positive.
The success of Private & Business Clients (PBC) is based on a solid business model: With the combination of advisory banking and consumer banking, PBC has built a leading position in its home market, Germany, accompanied by strong positions in other important European markets, and growth investments in key Asian countries. The overall macro-economic outlook for 2012 and 2013 for countries in which Private & Business Clients operates is mixed. GDP growth in the home market Germany has a slightly positive outlook, while the GDP outlook for most of the European countries in which PBC is present is rather flat or slightly negative. Asia, however, continues on its growth path. Postbank will further pursue its growth in Consumer Banking in Germa-ny while further reducing non-core risk positions. We expect Deutsche Bank and Postbank to continue their successful realization of synergies on the revenue and cost side. The increased interest in Postbank and a potential domination agreement might support the delivery of synergies in 2012. PBC continues to face uncer-tainties in its operating environment, as a significant decline in economic growth, which in return would result in higher unemployment rates, could lead to increasing credit loss provision and lower business growth. The development of investment product markets depends especially on further progress of the European sovereign debt crisis. Additionally, continued low interest rates in 2012 might negatively affect revenues in PBC.

Deutsche Bank Confirmations 44 Interim Report as of March 31, 2012 Review Report
To Deutsche Bank Aktiengesellschaft, Frankfurt am Main
We have reviewed the condensed interim consolidated financial statements of Deutsche Bank Aktiengesellschaft, Frankfurt am Main - comprising the statement of income, statement of comprehensive income, balance sheet, statement of changes in equity, statement of cash flows and selected explanatory notes - together with the interim group management report of Deutsche Bank Aktiengesellschaft, for the period from January 1 to March 31, 2012 that are part of the quarterly financial report according to Section 37x Abs. 3 WpHG (German Securities Trading Act). The preparation of the condensed interim consolidated financial statements in accordance with those International Financial Reporting Standards (IFRS) applicable to interim financial reporting as adopted by the EU, and in accordance with the IFRS for interim financial reporting as issued by the International Accounting Standards Board (IASB), and of the interim group management report in accordance with the requirements of the WpHG applicable to interim group management reports, is the re-sponsibility of Deutsche Bank Aktiengesellschaft’s management. Our responsibility is to issue a report on the condensed interim consolidated financial statements and on the interim group management report based on our review.
We performed our review of the condensed interim consolidated financial statements and the interim group management report in accordance with the German generally accepted standards for the review of financial statements promulgated by the Institut der Wirtschaftsprüfer (IDW). Those standards require that we plan and perform the review so that we can preclude through critical evaluation, with a certain level of assurance, that the condensed interim consolidated financial statements have not been prepared, in material aspects, in ac-cordance with the IFRS applicable to interim financial reporting as adopted by the EU, and in accordance with the IFRS for interim financial reporting as issued by the IASB, and that the interim group management report has not been prepared, in material aspects, in accordance with the requirements of the WpHG applicable to interim group management reports. A review is limited primarily to inquiries of company employees and analyt-ical assessments and therefore does not provide the assurance attainable in a financial statement audit. Since, in accordance with our engagement, we have not performed a financial statement audit, we cannot issue an auditor’s report.
Based on our review, no matters have come to our attention that cause us to presume that the condensed interim consolidated financial statements have not been prepared, in material respects, in accordance with the IFRS applicable to interim financial reporting as adopted by the EU, and in accordance with the IFRS for inter-im financial reporting as issued by the IASB, or that the interim group management report has not been pre-pared, in material respects, in accordance with the requirements of the WpHG applicable to interim group management reports.
KPMG AG Wirtschaftsprüfungsgesellschaft
Frankfurt am Main (Germany), April 25, 2012
Review Report
Dielehner Wirtschaftsprüfer
Bose Wirtschaftsprüfer

Deutsche Bank Consolidated Financial Statements 45 Interim Report as of March 31, 2012 Consolidated Statement of Income (unaudited)
Income Statement
Three months ended
in € m. Mar 31, 2012 Mar 31, 2011
Interest and similar income 8,375 8,369 Interest expense 4,182 4,202 Net interest income 4,193 4,167
Provision for credit losses 314 373 Net interest income after provision for credit losses 3,879 3,794
Commissions and fee income 2,849 3,081 Net gains (losses) on financial assets/liabilities at fair value through profit or loss 2,399 2,653 Net gains (losses) on financial assets available for sale (46) 415 Net income (loss) from equity method investments (149) (32) Other income (loss) (53) 190 Total noninterest income 5,000 6,307
Compensation and benefits 3,656 4,278 General and administrative expenses 3,184 2,737 Policyholder benefits and claims 150 65 Impairment of intangible assets 10 − Restructuring activities − − Total noninterest expenses 7,000 7,080
Income before income taxes 1,879 3,021
Income tax expense 478 891
Net income 1,401 2,130
Net income attributable to noncontrolling interests 20 68 Net income attributable to Deutsche Bank shareholders 1,381 2,062
Earnings per Common Share
Three months ended
Mar 31, 2012 Mar 31, 2011
Earnings per common share: Basic € 1.49 € 2.20 Diluted € 1.44 € 2.13
Number of shares in million: Denominator for basic earnings per share – weighted-average shares outstanding 929.4 937.3 Denominator for diluted earnings per share – adjusted weighted-average shares after assumed conversions 959.8 968.8
Consolidated Statement of Income (unaudited)

Deutsche Bank Consolidated Financial Statements 46 Interim Report as of March 31, 2012 Consolidated Statement of Comprehensive Income (unaudited)
Three months ended
in € m. Mar 31, 2012 Mar 31, 2011
Net income recognized in the income statement 1,401 2,130
Other comprehensive income (loss) Actuarial gains (losses) related to defined benefit plans, before tax
1,2 (221) 25 Unrealized net gains (losses) on financial assets available for sale:
Unrealized net gains (losses) arising during the period, before tax 749 230 Net (gains) losses reclassified to profit or loss, before tax 72 (385)
Unrealized net gains (losses) on derivatives hedging variability of cash flows: Unrealized net gains (losses) arising during the period, before tax 48 32 Net (gains) losses reclassified to profit or loss, before tax 12 1
Unrealized net gains (losses) on assets classified as held for sale, before tax − 42 Foreign currency translation:
Unrealized net gains (losses) arising during the period, before tax (657) (821) Net (gains) losses reclassified to profit or loss, before tax (5) −
Unrealized net gains (losses) from equity method investments (17) (57) Tax on net gains (losses) in other comprehensive income (26) (143) Other comprehensive income (loss), net of tax (45) (1,076)
Total comprehensive income, net of tax 1,356 1,054
Attributable to: Noncontrolling interests 103 72 Deutsche Bank shareholders 1,253 982 1 In the Consolidated Statement of Comprehensive Income, actuarial gains (losses) related to defined benefit plans, before tax are disclosed within other comprehensive
income (loss) starting 2011. The corresponding deferred taxes are included in the position tax on net gains (losses) in other comprehensive income. In the Consolidated Balance Sheet, actuarial gains (losses) related to defined benefit plans, net of tax, are recognized in retained earnings.
2 Assumptions for the IFRS pension discount rate were refined. For details please refer to the Basis of Preparation.
Consolidated Statement of Comprehensive Income (unaudited)

Deutsche Bank Consolidated Financial Statements 47 Interim Report as of March 31, 2012 Consolidated Balance Sheet (unaudited)
Assets in € m. Mar 31, 2012 Dec 31, 2011
Cash and due from banks 14,700 15,928 Interest-earning deposits with banks 126,784 162,000 Central bank funds sold and securities purchased under resale agreements 42,082 25,773 Securities borrowed 31,029 31,337 Financial assets at fair value through profit or loss
Trading assets 258,504 240,924 Positive market values from derivative financial instruments 759,231 859,582 Financial assets designated at fair value through profit or loss 186,908 180,293
Total financial assets at fair value through profit or loss 1,204,643 1,280,799 Financial assets available for sale 43,848 45,281 Equity method investments 3,413 3,759 Loans 407,501 412,514 Property and equipment 5,241 5,509 Goodwill and other intangible assets 15,713 15,802 Other assets 198,501 154,794 Income tax assets
1 9,840 10,607
Total assets 2,103,295 2,164,103
Liabilities and Equity in € m. Mar 31, 2012 Dec 31, 2011
Deposits 588,319 601,730 Central bank funds purchased and securities sold under repurchase agreements 62,113 35,311 Securities loaned 4,489 8,089 Financial liabilities at fair value through profit or loss
Trading liabilities 69,044 63,886 Negative market values from derivative financial instruments 738,120 838,817 Financial liabilities designated at fair value through profit or loss 111,608 118,318 Investment contract liabilities 7,406 7,426
Total financial liabilities at fair value through profit or loss 926,178 1,028,447 Other short-term borrowings 59,901 65,356 Other liabilities 224,472 187,816 Provisions 2,853 2,621 Income tax liabilities
1 4,011 4,313 Long-term debt 163,061 163,416 Trust preferred securities 12,092 12,344 Obligation to purchase common shares 1 − Total liabilities 2,047,490 2,109,443
Common shares, no par value, nominal value of € 2.56 2,380 2,380 Additional paid-in capital 23,436 23,695 Retained earnings 31,421 30,119 Common shares in treasury, at cost (248) (823) Equity classified as obligation to purchase common shares (1) − Accumulated other comprehensive income (loss), net of tax
2 (2,030) (1,981) Total shareholders’ equity 54,958 53,390
Noncontrolling interests 847 1,270
Total equity 55,805 54,660
Total liabilities and equity 2,103,295 2,164,103 1 Income tax assets and Income tax liabilities comprise both deferred and current taxes. 2 Excluding actuarial gains (losses) related to defined benefit plans, net of tax.
Consolidated Balance Sheet (unaudited)

Deutsche Bank Consolidated Financial Statements 48 Interim Report as of March 31, 2012 Consolidated Statement of Changes in Equity (unaudited)
in € m.
Common shares (no par value)
Additional paid-in capital
Retained earnings
1
Common shares in treasury, at cost
Equity classified as obligation to purchase common shares
Balance as of December 31, 2010 2,380 23,515 25,975 (450) −
Total comprehensive income, net of tax
2 − − 2,062 − − Common shares issued − − − − − Cash dividends paid − − − − − Actuarial gains (losses) related to defined benefit plans, net of tax3 − − (16) − − Net change in share awards in the reporting period − (201) − − − Treasury shares distributed under share-based compensation plans − − − 663 − Tax benefits related to share-based compensation plans − 13 − − − Additions to Equity classified as obligation to purchase common shares − − − − − Deductions from Equity classified as obligation to purchase common shares − − − − − Option premiums and other effects from options on common shares − (64) − − − Purchases of treasury shares − − − (4,574) − Sale of treasury shares − − − 4,149 − Net gains (losses) on treasury shares sold − 20 − − − Other − 173 − − −
Balance as of March 31, 2011 2,380 23,456 28,021 (212) −
Balance as of December 31, 2011 2,380 23,695 30,119 (823) −
Total comprehensive income, net of tax
2 − − 1,381 − − Common shares issued − − − − − Cash dividends paid − − − − − Actuarial gains (losses) related to defined benefit plans, net of tax
3 − − (79) − − Net change in share awards in the reporting period − (678) − − − Treasury shares distributed under share-based compensation plans − − − 938 − Tax benefits related to share-based compensation plans − 1 − − − Additions to Equity classified as obligation to purchase common shares − − − − − Deductions from Equity classified as obligation to purchase common shares − − − − (1)Option premiums and other effects from options on common shares − (26) − − − Purchases of treasury shares − − − (4,510) − Sale of treasury shares − − − 4,147 − Net gains (losses) on treasury shares sold − 5 − − − Other − 439 − − −
Balance as of March 31, 2012 2,380 23,436 31,421 (248) (1)1 The initial acquisition accounting for ABN AMRO, which was finalized at March 31, 2011, resulted in a retrospective adjustment of retained earnings of € (24) million for
December 31, 2010. 2 Excluding actuarial gains (losses) related to defined benefit plans, net of tax. 3 Assumptions for the IFRS pension discount rate were refined. For details please refer to the Basis of Preparation.
Consolidated Statement of Changes in Equity (unaudited)

Deutsche Bank Consolidated Financial Statements 49 Interim Report as of March 31, 2012 Consolidated Statement of Changes in Equity (unaudited)
Unrealized net gains (losses) on financial assets available for sale, net of applicable tax and other
Unrealized net gains (losses) on derivatives hedging variability of cash flows, net of tax
Unrealized net gains (losses) on assets classified as held for sale, net of tax
Foreign currency translation, net of tax
Unrealized net gains (losses) from equity method investments
Accumulated other comprehensive income (loss), net of tax
2
Total shareholders’ equity
Noncontrolling interests
Total equity
(113) (179) (11) (2,333) 35 (2,601) 48,819 1,549 50,368
(159) 24 33 (903) (58) (1,063) 999 73 1,072 − − − − − − − − − − − − − − − − − − − − − − − − (16) (1) (17) − − − − − − (201) − (201) − − − − − − 663 − 663 − − − − − − 13 − 13 − − − − − − − − − − − − − − − − − − − − − − − − (64) − (64) − − − − − − (4,574) − (4,574) − − − − − − 4,149 − 4,149 − − − − − − 20 − 20 − − − − − − 173 (12) 161
(272) (155) 22 (3,236) (23) (3,664) 49,981 1,609 51,590
(617) (226) − (1,166) 28 (1,981) 53,390 1,270 54,660
519 35 − (586) (17) (49) 1,332 111 1,443 − − − − − − − − − − − − − − − − − − − − − − − − (79) (7) (86) − − − − − − (678) − (678) − − − − − − 938 − 938 − − − − − − 1 − 1 − − − − − − − − − − − − − − − (1) − (1) − − − − − − (26) − (26) − − − − − − (4,510) − (4,510) − − − − − − 4,147 − 4,147 − − − − − − 5 − 5 − − − − − − 439 (527) (88)
(98) (191) − (1,752) 11 (2,030) 54,958 847 55,805

Deutsche Bank Consolidated Financial Statements 50 Interim Report as of March 31, 2012 Consolidated Statement of Cash Flows (unaudited)
Three months ended in € m. Mar 31, 2012
Mar 31, 2011 Net income 1,401 2,130 Cash flows from operating activities: Adjustments to reconcile net income to net cash provided by (used in) operating activities:
Provision for credit losses 314 373Restructuring activities − −Gain on sale of financial assets available for sale, equity method investments, and other (90) (435)Deferred income taxes, net 219 519Impairment, depreciation and other amortization, and accretion 1,009 44Share of net income (loss) from equity method investments (99) 25
Income adjusted for noncash charges, credits and other items 2,754 2,656 Adjustments for net change in operating assets and liabilities:
Interest-earning time deposits with banks 18,717 7,040Central bank funds sold, securities purchased under resale agreements, securities borrowed (16,295) (12,109)Financial assets designated at fair value through profit or loss (8,307) (5,789)Loans 4,575 11,834Other assets (46,663) (39,507)Deposits (12,189) 3,190Financial liabilities designated at fair value through profit or loss and investment contract liabilities
1 (5,544) 1,966Central bank funds purchased, securities sold under repurchase agreements and securities loaned 23,736 7,085Other short-term borrowings (4,787) (3,311)Other liabilities 40,751 38,079Senior long-term debt
2 (120) (8,248)Trading assets and liabilities, positive and negative market values from derivative financial instruments, net (13,578) (11,508)Other, net (558) 2,265
Net cash used in operating activities (17,508) (6,357)
Cash flows from investing activities: Proceeds from:
Sale of financial assets available for sale 1,103 6,293Maturities of financial assets available for sale 5,156 2,987Sale of equity method investments 11 26Sale of property and equipment 10 9
Purchase of: Financial assets available for sale (4,012) (4,563)Equity method investments − (1)Property and equipment (119) (191)
Net cash received in business combinations/divestitures 92 190Other, net (155) (170)Net cash provided by investing activities 2,086 4,580
Cash flows from financing activities: Issuances of subordinated long-term debt 11 4Repayments and extinguishments of subordinated long-term debt (175) (77)Issuances of trust preferred securities − 29Repayments and extinguishments of trust preferred securities (21) (67)Purchases of treasury shares (4,510) (4,574)Sale of treasury shares 4,144 4,188Dividends paid to noncontrolling interests (3) (3)Net change in noncontrolling interests (70) 88Net cash used in financing activities (624) (412)Net effect of exchange rate changes on cash and cash equivalents (481) (848)Net decrease in cash and cash equivalents (16,527) (3,037) Cash and cash equivalents at beginning of period 81,946 66,353 Cash and cash equivalents at end of period 65,419 63,316Net cash provided by (used in) operating activities include
Income taxes paid, net 176 398Interest paid 3,987 4,282 Interest and dividends received 8,198 8,348
Cash and cash equivalents comprise Cash and due from banks 14,700 14,338Interest-earning demand deposits with banks (not included: time deposits of € 76,065 million as of March 31, 2012, and € 35,285 million as of March 31, 2011) 50,719 48,978
Total 65,419 63,316
1 Included are senior long-term debt issuances of € 3,493 million and € 3,786 million and repayments and extinguishments of € 3,674 million and € 2,485 million through March 31, 2012 and March 31, 2011, respectively.
2 Included are issuances of € 10,027 million and € 15,401 million and repayments and extinguishments of € 10,861 million and € 19,743 million through March 31, 2012 and March 31, 2011, respectively.
Consolidated Statement of Cash Flows (unaudited)

Deutsche Bank Consolidated Financial Statements 51 Interim Report as of March 31, 2012 Basis of Preparation (unaudited)
The accompanying condensed consolidated interim financial statements, which include Deutsche Bank AG and its subsidiaries (collectively the “Group”), are stated in euros, the presentation currency of the Group. They are presented in accordance with the requirements of IAS 34, “Interim Financial Reporting”, and have been prepared in accordance with International Financial Reporting Standards (“IFRS”) as issued by the Inter-national Accounting Standards Board (“IASB”) and endorsed by the European Union (“EU”). The Group’s ap-plication of IFRS results in no differences between IFRS as issued by the IASB and IFRS as endorsed by the EU.
Deutsche Bank’s condensed consolidated interim financial statements are unaudited and include supple-mentary disclosures on segment information, income statement, balance sheet and other financial information. They should be read in conjunction with the audited consolidated financial statements of Deutsche Bank for 2011, for which the same accounting policies have been applied.
The preparation of financial statements under IFRS requires management to make estimates and assumptions for certain categories of assets and liabilities. Areas where this is required include the fair value of certain finan-cial assets and liabilities, the reclassification of financial assets, the impairment of loans and provision for off-balance-sheet positions, the impairment of other financial assets and non-financial assets, the recognition and measurement of deferred tax assets, and the accounting for legal and regulatory contingencies and uncertain tax positions. These estimates and assumptions affect the reported amounts of assets and liabilities and dis-closure of contingent assets and liabilities at the balance sheet date, and the reported amounts of revenue and expenses during the reporting period. Actual results could differ from management’s estimates and the results reported should not be regarded as necessarily indicative of results that may be expected for the entire year.
Since the second quarter 2011, the Group’s valuation approach for substantially all of its collateralized deriva-tive contracts has moved to using the overnight indexed swap (OIS) curve in order to more consistently man-age the interest rate and funding risks associated with collateralized derivatives in line with their pricing. This change in approach to OIS did not have a material impact on the Group’s consolidated financial statements in the three months ended March 31, 2012.
In the first quarter 2012, the Group has changed the discount rate assumption for its pension plans in Germany. Please refer to the section “Information on the Income Statement – Pensions and Other Post-employment Benefits” for further details.
Basis of Preparation (unaudited)

Deutsche Bank Consolidated Financial Statements 52 Interim Report as of March 31, 2012 Impact of Changes in Accounting Principles (unaudited)
Recently Adopted Accounting Pronouncements
Since January 1, 2012 no new accounting pronouncements which are relevant to the Group have been adopted.
New Accounting Pronouncements
The amendments to IAS 1, “Presentation of Financial Statements”, IAS 19, “Employee Benefits”, IAS 32, “Offsetting Financial Assets and Financial Liabilities”, IFRS 7, “Disclosures – Offsetting Financial Assets and Financial Liabilities”, IFRS 10, “Consolidated Financial Statements”, IFRS 11, “Joint Arrangements”, IFRS 12, “Disclosures of Interests in Other Entities”, IFRS 13, “Fair Value Measurement”, IFRS 9 and IFRS 9 R, “Finan-cial Instruments” will be relevant to the Group but were not effective as of March 31, 2012 and therefore have not been applied in preparing these financial statements. IFRS 7, “Disclosures – Transfers of Financial Assets”, which requires annual disclosures for transfers of financial assets, became effective for the Group on January 1, 2012 but will only be applied in the 2012 year-end financial statements. While approved by the IASB, each of the standards – except for IFRS 7, “Disclosures – Transfers of Financial Assets” – have yet to be endorsed by the EU. The Group is currently evaluating the potential impact that the adoption of these new accounting pronouncements will have on its consolidated financial statements. The adoption of the amend-ments to IAS 1 and IFRS 7, “Disclosures – Transfers of Financial Assets” is not expected to have a material impact on the consolidated financial statements.
Impact of Changes in Accounting Principles (unaudited)

Deutsche Bank Consolidated Financial Statements 53 Interim Report as of March 31, 2012 Segment Information (unaudited)
The following segment information has been prepared in accordance with the “management approach”, which requires presentation of the segments on the basis of the internal reports about components of the entity which are regularly reviewed by the chief operating decision maker in order to allocate resources to a segment and to assess its performance.
Business Segments
The Group’s segment reporting follows the organizational structure as reflected in its internal management reporting systems, which are the basis for assessing the financial performance of the business segments and for allocating resources to the business segments. During the first quarter 2012, there were no material changes in the organizational structure which affected the composition of the business segments. Generally, restatements due to minor changes in the organizational structure were implemented in the presentation of prior period comparables if they were considered in the Group’s management reporting systems.
Measurement of Segment Profit or Loss
The management reporting systems follow a “matched transfer pricing concept” in which the Group’s external net interest income is allocated to the business segments based on the assumption that all positions are fund-ed or invested via the wholesale money and capital markets. The Group reviewed its internal funding method-ology as a reaction to the significant changes of funding costs during the sovereign debt crisis and in the first quarter 2012 adopted a refinement of internal funding rates used to more adequately reflect external funding cost and the benefit of liquidity provided by unsecured funding sources.
The net financial impact from the refinement on the business segments for the first quarter 2012 was as follows:
— AWM (€ 12 million), GTB (€ 10 million), PBC (€ 7 million), and CI (€ 2 million) received additional funding benefit.
— CB&S (€ 31 million) received additional funding cost.
Allocation of Average Active Equity
In the first quarter 2011, the Group changed the methodology used for allocating average active equity to the business segments. Under the new methodology, economic capital as basis for allocation is substituted by risk weighted assets and certain regulatory capital deduction items. All other items of the capital allocation frame-work remained unchanged. The total amount allocated is determined based on the higher of the Group’s over-all economic risk exposure or regulatory capital demand. Starting 2012, the Group derives its demand for regulatory capital assuming a Core Tier 1 ratio of 9.0 %, reflecting increased regulatory requirements (previ-ously, this was calculated based on a Tier 1 ratio of 10.0 %). As a result, the amount of capital allocated to the segments has increased, predominantly in CIB. If the Group’s average active equity exceeds the higher of the overall economic risk exposure or the regulatory capital demand, this surplus is assigned to Consolidation & Adjustments.
Segment Information (unaudited)

Deutsche Bank Consolidated Financial Statements 54 Interim Report as of March 31, 2012 Segment Information (unaudited)
Segmental Results of Operations
The following tables present the results of the business segments, including the reconciliation to the consoli-dated results under IFRS, for the three months ended March 31, 2012 and March 31, 2011.
Three months ended
Mar 31, 2012 Corporate & Investment Bank Private Clients and Asset Management
in € m. (unless stated otherwise)
Corporate Banking & Securities
Global Transaction Banking
Total
Asset and Wealth Management
Private & Business Clients
Total
Corporate Investments
Consoli- dation & Adjustments
Total Consolidated
Net revenues 5,220 967 6,187 883 2,501 3,384 41 (382) 9,193
Provision for credit losses 85 33 118 0 194 194 2 0 314
Total noninterest expenses 3,412 593 4,005 739 1,865 2,604 312 79 7,000 therein: Policyholder benefits and claims 149 − 149 0 − 0 − − 149 Impairment of intangible assets − − − − 10 10 − − 10 Restructuring activities − − − − (0) (0) − − (0)
Noncontrolling interests 6 − 6 1 29 30 (7) (29) −
Income (loss) before income taxes 1,717 340 2,058 142 413 555 (303) (431) 1,879
Cost/income ratio 65 % 61 % 65 % 84 % 75 % 77 % N/M N/M 76 % Assets
2 1,673,607 81,887 1,732,405 56,644 342,673 399,294 22,946 8,642 2,103,295 Average active equity
3 26,840 2,986 29,825 5,732 13,490 19,222 1,300 3,709 54,056 Pre-tax return on average active equity
4 26 % 46 % 28 % 10 % 12 % 12 % (93) % N/M 14 % N/M – Not meaningful 1 Includes an impairment of € 257 million related to the exposure in Actavis. 2 The sum of corporate divisions does not necessarily equal the total of the corresponding group division because of consolidation items between corporate divisions, which are to be eliminated
on group division level. The same approach holds true for the sum of group divisions compared to “Total Consolidated”. 3 For management reporting purposes goodwill and other intangible assets with indefinite useful lives are explicitly assigned to the respective divisions. Starting 2011, the Group’s average active
equity is allocated to the business segments and to Consolidation & Adjustments in proportion to their regulatory capital requirements, which comprises of the regulatory capital required to support risk weighted assets and certain capital deduction items, goodwill and unamortized other intangible assets. Starting 2012, the Group derives its demand for regulatory capital assuming a Core Tier 1 ratio of 9.0 % (previously, this was calculated based on a Tier 1 ratio of 10.0 %). Prior periods were adjusted to reflect this change.
4 For an explanation of the return on average active equity please refer to Note 05 “Business Segments and Related Information” of the Financial Report 2011. For “Total Consolidated”, pre-tax return on average shareholders’ equity is 14 %.
Deutsche Bank Consolidated Financial Statements 55 Interim Report as of March 31, 2012 Segment Information (unaudited)
Three months ended
Mar 31, 2011 Corporate & Investment Bank Private Clients and Asset Management
in € m. (unless stated otherwise)
Corporate Banking & Securities
Global Transaction Banking
Total
Asset and Wealth Management
Private & Business Clients
Total
Corporate Investments
Consoli- dation & Adjustments
Total Consolidated
Net revenues 5,843 853 6,696 1,002 3,072 4,074 180 (476) 10,474
Provision for credit losses 12 21 33 19 320 338 1 (0) 373
Total noninterest expenses 3,533 558 4,091 792 1,888 2,680 344 (34) 7,080 therein: Policyholder benefits and claims 65 − 65 0 − 0 − − 65 Impairment of intangible assets − − − − − − − − − Restructuring activities − − − − − − − − −
Noncontrolling interests 11 − 11 1 77 78 (0) (89) −
Income (loss) before income taxes 2,287 274 2,561 190 788
1 978 (165) (353) 3,021
Cost/income ratio 60 % 65 % 61 % 79 % 61 % 66 % 191 % 7 % 68 % Assets (as of Dec 31, 2011)
2 1,727,156 96,404 1,796,954 58,601 335,516 394,094 25,203 11,154 2,164,103 Average active equity
3 23,310 3,091 26,401 5,876 13,765 19,641 1,399 1,536 48,977 Pre-tax return on average active equity
4 39 % 35 % 39 % 13 % 23 % 20 % (47) % N/M 24 % N/M – Not meaningful 1 Includes € 236 million positive impact related to the stake in Hua Xia Bank for which equity method accounting was applied. The amount is based on its presentation in the first quarter
2011. It included a gross gain of € 263 million, which was in part reduced by anticipated cost components of € 26 million that did not materialize later in 2011. This positive impact is excluded from the Group’s target definition.
2 The sum of corporate divisions does not necessarily equal the total of the corresponding group division because of consolidation items between corporate divisions, which are to be eliminated on group division level. The same approach holds true for the sum of group divisions compared to “Total Consolidated”.
3 For management reporting purposes goodwill and other intangible assets with indefinite useful lives are explicitly assigned to the respective divisions. Starting 2011, the Group’s average active equity is allocated to the business segments and to Consolidation & Adjustments in proportion to their regulatory capital requirements, which comprises of the regulatory capital required to support risk weighted assets and certain capital deduction items, goodwill and unamortized other intangible assets. Starting 2012, the Group derives its demand for regulatory capital assuming a Core Tier 1 ratio of 9.0 % (previously, this was calculated based on a Tier 1 ratio of 10.0 %). Prior periods were adjusted to reflect this change.
4 For an explanation of the return on average active equity please refer to Note 05 “Business Segments and Related Information” of the Financial Report 2011. For “Total Consolidated” pre-tax return on average shareholders’ equity is 24 %.
Reconciliation of Segmental Results of Operations to Consolidated Results of Operations
Loss before income taxes in Consolidation & Adjustments (C&A) was € 431 million in the first quarter 2012, compared to € 353 million in the prior year quarter.
Revenues in both periods included significant negative effects from different accounting methods used for management reporting and IFRS. These amounted to € 319 million in the current quarter, of which approxi-mately half was driven by the development of U.S. dollar/euro basis swap spreads. The Group predominantly funds its operations in euro and then converts some of these funds into U.S. dollars using the basis swap mar-ket. The funding and the related basis swaps represent an economically hedged position and different account-ing methods may result in material effects in C&A. While the funding instrument is accounted for at amortized costs, the mark-to-market valuation of the swaps is sensitive to movements in U.S. dollar/euro mid- to long-term basis swap spreads. These valuation related timing effects reverse over the life of these positions. In the current year quarter, these spreads narrowed significantly resulting in a mark-to-market loss. Revenues in the current quarter also included mark-to-market losses of approximately € 70 million from the narrowing of the credit spreads of certain of our own debt as well as effects of approximately € 80 million from different account-ing methods related to economically hedged short-term positions which resulted from changes in short-term euro interest rates and from the reversal of prior period interest rate effects. This accounting difference was the main driver for the loss before income taxes of € 353 million in the first quarter 2011. Revenues in both periods

Deutsche Bank Consolidated Financial Statements 56 Interim Report as of March 31, 2012 Segment Information (unaudited)
also reflected negative effects from the hedging of net investments in certain foreign operations.
Noninterest expenses in the current year quarter included the accrual for the German bank levy of € 73 million, whereas in the prior year, the accrual for the German bank levy only started in the second quarter. The positive effect in C&A from the reversal of noncontrolling interests, which are deducted from income before income taxes of the divisions, was mostly related to Postbank in both quarters. It significantly decreased in comparison to the prior year quarter.
Entity-Wide Disclosures
The following tables present the net revenue components of the CIB and PCAM Group Divisions for the three months ended March 31, 2012 and March 31, 2011, respectively.
Corporate & Investment Bank
Three months ended
in € m. Mar 31, 2012 Mar 31, 2011
Sales & Trading (debt and other products) 3,390 3,691 Sales & Trading (equity) 726 943 Total Sales & Trading 4,116 4,634
Origination (debt) 379 378 Origination (equity) 138 181 Total Origination 517 559
Advisory 121 159 Loan products 303 452 Transaction services 967 853 Other products 162 40
Total
1 6,187 6,696 1 Total net revenues presented above include net interest income, net gains (losses) on financial assets/liabilities at fair value through profit or loss and other revenues
such as commissions and fee income.
Private Clients and Asset Management
Three months ended
in € m. Mar 31, 2012 Mar 31, 2011
Discretionary portfolio management/fund management 539 598 Advisory/brokerage 455 520 Credit products 647 641 Deposits and payment services 617 554 Other products1 1,125 1,760
Total2 3,384 4,074 1 Revenues from Other products include Postbank. 2 Total net revenues presented above include net interest income, net gains (losses) on financial assets/liabilities at fair value through profit or loss and other revenues
such as commissions and fee income.

Deutsche Bank Consolidated Financial Statements 57 Interim Report as of March 31, 2012 Information on the Income Statement (unaudited)
Net Interest Income and Net Gains (Losses) on Financial Assets/Liabilities at Fair Value through Profit or Loss by Group Division
Three months ended
in € m. Mar 31, 2012 Mar 31, 2011
Net interest income 4,193 4,167 Trading income
1 2,248 2,767 Net gains (losses) on financial assets/liabilities designated at fair value through profit or loss
2 151 (114) Total net gains (losses) on financial assets/liabilities at fair value through profit or loss 2,399 2,653
Total net interest income and net gains (losses) on financial assets/liabilities at fair value through profit or loss 6,592 6,820
Breakdown by Group Division/CIB product: Sales & Trading (equity) 524 647 Sales & Trading (debt and other products) 3,243 3,480
Total Sales & Trading 3,767 4,127 Loan products
3 54 246 Transaction services 462 408 Remaining products
4 199 161 Total Corporate & Investment Bank 4,483 4,941 Private Clients and Asset Management 1,873 1,945 Corporate Investments 37 44 Consolidation & Adjustments 198 (110)
Total net interest income and net gains (losses) on financial assets/liabilities at fair value through profit or loss 6,592 6,820 1 Trading income includes gains and losses from derivatives held for trading and from derivatives not qualifying for hedge accounting. 2 Includes € 31 million and € (148) million from securitization structures for the three months ended March 31, 2012 and March 31, 2011, respectively. Fair value movements on related instruments of € (24) million and of € 307 million for the three months ended March 31, 2012 and March 31, 2011, respectively, are
reported within trading income. Both are reported under Sales & Trading (debt and other products). The total of these gains and losses represents the Group’s share of the losses in these consolidated securitization structures.
3 Includes the net interest spread on loans as well as the fair value changes of credit default swaps and loans designated at fair value through profit or loss. 4 Includes net interest income and net gains (losses) on financial assets/liabilities at fair value through profit or loss on origination, advisory and other products.
Commissions and Fee Income
Three months ended
in € m. Mar 31, 2012 Mar 31, 2011
Commissions and fees from fiduciary activities 816 834 Commissions, brokers’ fees, mark-ups on securities underwriting and other securities activities 868 1,118 Fees for other customer services 1,165 1,129
Total commissions and fee income 2,849 3,081
Information on the Income Statement (unaudited)

Deutsche Bank Consolidated Financial Statements 58 Interim Report as of March 31, 2012 Information on the Income Statement (unaudited)
Pensions and Other Post-Employment Benefits
Three months ended
in € m. Mar 31, 2012 Mar 31, 2011
Expenses for retirement benefit plans: Current service cost 66 67 Interest cost 153 150 Expected return on plan assets (143) (133) Past service cost (credit) recognized immediately 1 5
Total retirement benefit plans 77 89
Expenses for post-employment medical plans: Current service cost 1 1 Interest cost 2 2 Past service cost (credit) recognized immediately − −
Total post-employment medical plans 3 3
Total expenses defined benefit plans 80 92
Total expenses for defined contribution plans 106 106
Total expenses for post-employment benefits 186 198
Employer contributions to mandatory German social security pension plan 62 57
The Group expects to contribute approximately € 125 million to its retirement benefit plans in 2012. It is not expected that any plan assets will be returned to the Group during the year ending December 31, 2012.
For the Group’s most significant pension plans, the discount rate assumption at each measurement date is set based on a high quality corporate bond yield curve approach reflecting the actual timing and amount of the future expected benefit payments for the respective plans. With respect to the discount rate applied to determine the Group’s defined benefit pension obligations in Germany, the Group decided to broaden the un-derlying bond universe to include high quality covered bonds effective March 31, 2012. This recalibration re-sulted in an increase in discount rate of 30 basis points and consequently to an actuarial gain related to our defined benefits plans of approximately € 308 million before tax in the first quarter 2012. The resultant discount rate applied to determine the defined benefit pension obligations in Germany as of March 31, 2012 is 4.4 %.

Deutsche Bank Consolidated Financial Statements 59 Interim Report as of March 31, 2012 Information on the Income Statement (unaudited)
General and Administrative Expenses
Three months ended
in € m. Mar 31, 2012 Mar 31, 2011
General and administrative expenses:
IT costs 587 561 Occupancy, furniture and equipment expenses 527 482 Professional service fees 402 371 Communication and data services 232 219 Travel and representation expenses 124 126 Payment and clearing services 131 125 Marketing expenses 85 94 Consolidated investments 176 161 Other expenses1 920 598
Total general and administrative expenses 3,184 2,737 1 The increase in other expenses in the first quarter 2012 compared to the first quarter 2011 is primarily driven by litigation related expenses in CB&S and by an accrual
for the German bank levy which did not occur in the prior year quarter.

Deutsche Bank Consolidated Financial Statements 60 Interim Report as of March 31, 2012 Information on the Balance Sheet (unaudited)
Financial Assets/Liabilities at Fair Value through Profit or Loss
in € m. Mar 31, 2012 Dec 31, 2011
Trading assets: Trading securities 233,732 214,087 Other trading assets
1 24,773 26,837 Total trading assets 258,504 240,924
Positive market values from derivative financial instruments 759,231 859,582
Financial assets designated at fair value through profit or loss: Securities purchased under resale agreements 125,611 117,284 Securities borrowed 25,912 27,261 Loans 23,492 24,220 Other financial assets designated at fair value through profit or loss 11,893 11,528
Total financial assets designated at fair value through profit or loss 186,908 180,293
Total financial assets at fair value through profit or loss 1,204,643 1,280,799 1 Includes traded loans of € 15,808 million and € 18,039 million as of March 31, 2012 and December 31, 2011, respectively.
in € m. Mar 31, 2012 Dec 31, 2011
Trading liabilities: Trading securities 66,849 60,005 Other trading liabilities 2,194 3,881
Total trading liabilities 69,043 63,886
Negative market values from derivative financial instruments 738,120 838,817
Financial liabilities designated at fair value through profit or loss: Securities sold under repurchase agreements 83,197 93,606 Loan commitments 762 1,192 Long-term debt 15,059 13,889 Other financial liabilities designated at fair value through profit or loss 12,591 9,631
Total financial liabilities designated at fair value through profit or loss 111,608 118,318
Investment contract liabilities
1 7,406 7,426
Total financial liabilities at fair value through profit or loss 926,178 1,028,447 1 These are investment contracts where the policy terms and conditions result in their redemption values equaling fair values.
Financial Assets Available for Sale
in € m. Mar 31, 2012 Dec 31, 2011
Debt securities 37,993 39,381 Equity securities 1,742 1,868 Other equity interests 1,020 1,116 Loans 3,093 2,916
Total financial assets available for sale 43,848 45,281
Debt securities included Greek government bonds (excluding the below mentioned European Financial Stabil-ity Facility securities) with a fair value of € 42 million as of March 31, 2012 and € 211 million as of December 31, 2011.
In March 2012, Deutsche Bank participated in the exchange offer and consent solicitations with all our Greek government bonds eligible in this respect. Under the terms for Private Sector Involvement, Greek Government Bonds holders, in exchange, received (i) new bonds issued by the Greek government having a face amount equal to 31.5 % of the face amount of their exchanged bonds (ii) European Financial Stability Facility notes
Information on the Balance Sheet (unaudited)

Deutsche Bank Consolidated Financial Statements 61 Interim Report as of March 31, 2012 Information on the Balance Sheet (unaudited)
with a maturity date of two years or less and having a face amount of 15 % of the face amount of their ex-changed bonds and (iii) detachable securities linked to the Greece gross domestic product. The Greek gov-ernment also delivered short-term European Financial Stability Facility notes to discharge all unpaid interest accrued up to February 24, 2012 on exchanged bonds. The bonds that Deutsche Bank tendered in the debt exchange were derecognized and the new instruments recognized at fair value classified as either financial assets available for sale or at fair value through profit or loss.
In the first quarter 2012, Deutsche Bank recognized a loss in income before income taxes of € 33 million on Greek government bonds as a result of an impairment prior to the Greek debt rescheduling on March 12, 2012. More information on financial assets/liabilities related to certain European countries is included on page 30 of this report.
Amendments to IAS 39 and IFRS 7, “Reclassification of Financial Assets”
Under the amendments to IAS 39 and IFRS 7, issued in October 2008, certain financial assets were reclassi-fied in the second half of 2008 and the first quarter 2009 from the financial assets at fair value through profit or loss and the available for sale classifications into the loans classification. No reclassifications have been made since the first quarter 2009.
The Group identified assets, eligible under the amendments, for which at the reclassification date it had a clear change of intent and ability to hold for the foreseeable future rather than to exit or trade in the short term. The reclassifications were made at the fair value of the assets at the reclassification date.
The following table details the carrying values, unrealized fair value losses in accumulated other comprehen-sive income (loss), ranges of effective interest rates based on weighted average rates by business and ex-pected recoverable cash flows estimated at reclassification date.
in € bn. (unless stated otherwise)
Trading assets reclassified to loans
Financial assets available for sale reclassified to loans
Carrying value at reclassification date 26.6 11.4 Unrealized fair value losses in accumulated other comprehensive income − (1.1) Effective interest rates at reclassification date:
upper end of range 13.1 % 9.9 % lower end of range 2.8 % 3.9 %
Expected recoverable cash flows at reclassification date 39.6 17.6
Deutsche Bank Consolidated Financial Statements 62 Interim Report as of March 31, 2012 Information on the Balance Sheet (unaudited)
The following table shows carrying values and fair values as of March 31, 2012 and December 31, 2011 of the assets reclassified in 2008 and 2009.
Mar 31, 2012 Dec 31, 2011
in € m. Carrying value Fair value Carrying value Fair value
Trading assets reclassified to loans: Securitized assets
1 6,389 5,328 6,733 5,501 Debt securities 805 759 859 823 Loans 7,643 7,093 7,754 7,117
Total trading assets reclassified to loans 14,837 13,180 15,346 13,441
Financial assets available for sale reclassified to loans: Securitized assets
1 5,951 5,181 6,220 5,359 Loans 1,293 1,400 1,337 1,427
Total financial assets available for sale reclassified to loans 7,244 6,581 7,557 6,786
Total financial assets reclassified to loans 22,081 19,761 22,903 20,227 1 Securitized assets consist of mortgage- and asset-backed securities.
Sales of reclassified assets are individually subject to a governance and approval process to determine if a sale is the best course of action for the Group’s overall profitability, capital position and regulatory compliance. For the three months ended March 31, 2012 the Group sold reclassified assets with a carrying value of € 234 million. Of the sales that occurred in this period € 174 million were for assets that were previously classi-fied as trading including € 89 million of mortgage-backed securities. Sales in this period resulted in net losses of € 16 million, of which € 13 million of net losses related to assets that were previously classified as trading. The aforementioned governance and approval process determined that the assets sold were due to circum-stances that were not foreseeable at the time of reclassification, including amendments to the capital rules that led to significantly higher absolute capital requirements for the Group as a whole.
In addition to sales, the decrease in the carrying value of reclassified assets includes redemptions and maturi-ties of € 137 million on assets previously classified as trading and € 125 million on assets previously classified as available for sale.
The unrealized fair value gains (losses) that would have been recognized in profit or loss and the net gains (losses) that would have been recognized in other comprehensive income (loss) if the reclassifications had not been made are shown in the table below.

Deutsche Bank Consolidated Financial Statements 63 Interim Report as of March 31, 2012 Information on the Balance Sheet (unaudited)
Three months ended
in € m. Mar 31, 2012 Mar 31, 2011
Unrealized fair value gains (losses) on the reclassified trading assets, gross of provisions for credit losses 186 202 Impairment (losses) on the reclassified financial assets available for sale which were impaired (5) 1 Net gains (losses) recognized in other comprehensive income representing additional unrealized fair value gains (losses) on the reclassified financial assets available for sale which were not impaired 98 149 After reclassification, the pre-tax contribution of all reclassified assets to the income statement was as follows.
Three months ended
in € m. Mar 31, 2012 Mar 31, 2011
Interest income 156 196 Provision for credit losses (42) (22) Other income
1 (13) 18
Income before income taxes on reclassified trading assets 101 192
Interest income 38 36 Provision for credit losses (12) − Other income
1 (2) −
Income before income taxes on reclassified financial assets available for sale 24 36 1 Predominantly relates to losses from the sale of reclassified assets.
Financial Instruments carried at Fair Value
The financial instruments carried at fair value have been categorized under the three levels of the IFRS fair value hierarchy as follows:
Level 1 – Instruments valued using quoted prices in active markets: These are instruments where the fair value can be determined directly from prices which are quoted in active, liquid markets and where the instrument observed in the market is representative of that being priced in the Group’s inventory.
These instruments include: highly liquid treasury securities and derivative, equity and cash products traded on high-liquidity exchanges.
Level 2 – Instruments valued with valuation techniques using observable market data: These are instruments where the fair value can be determined by reference to similar instruments trading in active markets, or where a technique is used to derive the valuation but where all inputs to that technique are observable.
These instruments include: many over-the-counter (OTC) derivatives; many investment-grade listed credit bonds; some credit default swaps (CDS); many collateralized debt obligations (CDO); and many less liquid equities.

Deutsche Bank Consolidated Financial Statements 64 Interim Report as of March 31, 2012 Information on the Balance Sheet (unaudited)
Level 3 – Instruments valued using valuation techniques using market data which is not directly observable: These are instruments where the fair value cannot be determined directly by reference to market-observable information, and some other pricing technique must be employed. Instruments classified in this category have an element which is unobservable and which has a significant impact on the fair value.
These instruments include: more complex OTC derivatives; distressed debt; highly structured bonds; illiquid asset-backed securities (ABS); illiquid CDOs (cash and synthetic); monoline exposures; private equity place-ments; many commercial real-estate (CRE) loans; illiquid loans; and some municipal bonds.
The following table presents the carrying value of the financial instruments held at fair value across the three levels of the fair value hierarchy. Amounts in the table are generally presented on a gross basis, in line with the Group’s accounting policy regarding offsetting of financial instruments, as described in Note 01 “Significant Accounting Policies” of the Financial Report 2011.
Mar 31, 2012 Dec 31, 2011
in € m.
Quoted prices in active market (Level 1)
Valuation technique observable parameters (Level 2)
Valuation technique unobservable parameters (Level 3)
Quoted prices in active market (Level 1)
Valuation technique observable parameters (Level 2)
Valuation technique unobservable parameters (Level 3)
Financial assets held at fair value: Trading securities 111,591 111,575 10,565 99,487 103,327 11,272 Positive market values from derivative financial instruments 14,215 726,325 18,691 15,947 822,009 21,626 Other trading assets 808 19,988 3,977 847 20,773 5,218 Financial assets designated at fair value through profit or loss 6,978 175,231 4,699 6,907 168,224 5,162 Financial assets available for sale 9,396 29,975 4,477 3,960 37,026 4,295 Other financial assets at fair value − 7,547
1 − − 7,511
1 − Total financial assets held at fair value 142,988 1,070,641 42,409 127,148 1,158,870 47,573
Financial liabilities held at fair value: Trading securities 43,589 23,027 234 35,033 24,625 347 Negative market values from derivative financial instruments 11,682 716,137 10,301 12,815 814,696 11,306 Other trading liabilities 35 2,150 9 22 3,845 14 Financial liabilities designated at fair value through profit or loss 89 110,057 1,462 116 116,198 2,004 Investment contract liabilities
3 − 7,406 − − 7,426 − Other financial liabilities at fair value − 3,393
1 (123)
2 − 4,159
1 (250)
2
Total financial liabilities held at fair value 55,395 862,170 11,883 47,986 970,949 13,421 1 Predominantly relates to derivatives qualifying for hedge accounting. 2 Relates to derivatives which are embedded in contracts where the host contract is held at amortized cost but for which the embedded derivative is separated. The separated embedded
derivatives may have a positive or a negative fair value but have been presented in this table to be consistent with the classification of the host contract. The separated embedded derivatives are held at fair value on a recurring basis and have been split between the fair value hierarchy classifications.
3 These are investment contracts where the policy terms and conditions result in their redemption value equaling fair value. See Note 40 “Insurance and Investment Contracts” of the Financial Report 2011 for more detail on these contracts.

Deutsche Bank Consolidated Financial Statements 65 Interim Report as of March 31, 2012 Information on the Balance Sheet (unaudited)
The decrease in total level 3 assets during the three months ended March 31, 2012 mainly resulted from a decrease in positive market values from derivative financial instruments. This decrease was attributable to a combination of transfers from level 3 into level 2 due to increased observability of input parameters, set-tlements and mark-to-market movements. Other trading assets decreased predominantly due to transfers from level 3 into level 2 due to increased observability of input parameters.
The decrease in total level 3 liabilities during the three months ended March 31, 2012 came predominantly from negative market values from derivative financial instruments. This decrease was due to both mark-to-market movements and transfers from level 3 to level 2 due to increased observability of parameter inputs used to value these liabilities.
There have been no significant transfers of instruments between level 1 and level 2 of the fair value hierarchy during the period.
Allowance for Credit Losses
Allowance for loan losses Three months ended Mar 31, 2012 Three months ended Mar 31, 2011
in € m. Individually assessed
Collectively assessed
Total
Individually assessed
Collectively assessed
Total
Balance, beginning of year 2,011 2,150 4,162 1,643 1,653 3,296
Provision for loan losses 184 139 324 154 215 369 Net charge-offs (274) (96) (370) (129) (101) (230)
Charge-offs (283) (179) (462) (135) (157) (292) Recoveries 9 83 92 6 56 62
Changes in the group of consolidated companies − − − − − − Exchange rate changes/other (34) 0 (34) (47) (26) (73)
Balance, end of period 1,887 2,194 4,081 1,621 1,741 3,362
Allowance for off-balance sheet positions Three months ended Mar 31, 2012 Three months ended Mar 31, 2011
in € m. Individually assessed
Collectively assessed
Total
Individually assessed
Collectively assessed
Total
Balance, beginning of year 127 98 225 108 110 218
Provision for off-balance sheet positions (10) 1 (9) 5 (1) 4 Usage − − − − − − Changes in the group of consolidated companies − − − − − − Exchange rate changes − (1) (1) (1) (5) (5)
Balance, end of period 117 97 214 112 104 216

Deutsche Bank Consolidated Financial Statements 66 Interim Report as of March 31, 2012 Information on the Balance Sheet (unaudited)
Other Assets and Other Liabilities
in € m. Mar 31, 2012 Dec 31, 2011
Other assets: Brokerage and securities related receivables
Cash/margin receivables 59,025 63,771 Receivables from prime brokerage 8,832 9,652 Pending securities transactions past settlement date 5,536 3,479 Receivables from unsettled regular way trades 97,426 45,907
Total brokerage and securities related receivables 170,820 122,810 Accrued interest receivable 3,766 3,598 Assets held for sale 251 2,366 Other 23,665 26,020
Total other assets 198,501 154,794
in € m. Mar 31, 2012 Dec 31, 2011
Other liabilities: Brokerage and securities related payables
Cash/margin payables 56,394 58,419 Payables from prime brokerage 31,217 32,255 Pending securities transactions past settlement date 2,374 2,823 Payables from unsettled regular way trades 93,789 46,236
Total brokerage and securities related payables 183,772 139,733 Accrued interest payable 3,847 3,665 Liabilities held for sale 2 1,669 Other 36,850 42,750
Total other liabilities 224,472 187,816
Long-Term Debt
in € m. Mar 31, 2012 Dec 31, 2011
Senior debt: Bonds and notes
Fixed rate 108,275 104,906 Floating rate 43,226 46,735
Subordinated debt: Bonds and notes
Fixed rate 6,618 6,781 Floating rate 4,942 4,994
Total long-term debt 163,061 163,416
Shares Issued and Outstanding
in million Mar 31, 2012 Dec 31, 2011
Shares issued 929.5 929.5 Shares in treasury 7.1 24.9
– thereof buyback 6.4 24.1 – thereof other 0.7 0.8
Shares outstanding 922.4 904.6

Deutsche Bank Consolidated Financial Statements 67 Interim Report as of March 31, 2012 Other Financial Information (unaudited)
Regulatory Capital Starting December 31, 2011, the calculation of the Group’s capital and capital ratios incorporates the amended capital requirements for trading book and securitization positions following the Capital Requirements Di-rective 3, also known as “Basel 2.5”, as implemented in the German Banking Act and the Solvency Regulation (“Solvabilitätsverordnung”). The following table presents the risk-weighted assets, regulatory capital and capital adequacy ratios for the Group of companies consolidated for regulatory purposes excluding transitional items pursuant to section 64h (3) of the German Banking Act.
in € m. (unless stated otherwise) Mar 31, 2012 Dec 31, 2011
Credit risk 251,775 262,460 Market risk 64,929 68,091 Operational risk 51,718 50,695
Total risk-weighted assets 368,422 381,246
Core Tier 1 capital 37,003 36,313 Additional Tier 1 capital 12,416 12,734
Tier 1 capital 49,419 49,047 Tier 2 capital 5,764 6,179 Tier 3 capital − −
Total regulatory capital 55,183 55,226
Core Tier 1 capital ratio 10.0 % 9.5 % Tier 1 capital ratio 13.4 % 12.9 % Total capital ratio 15.0 % 14.5 % The following table presents a summary of the components of the Group’s Tier 1 and Tier 2 capital excluding transitional items pursuant to section 64h (3) of the German Banking Act.
in € m. Mar 31, 2012 Dec 31, 2011
Tier 1 capital: Core Tier 1 capital: Common shares 2,380 2,380 Additional paid-in capital 23,436 23,695 Retained earnings, common shares in treasury, equity classified as obligation to purchase common shares, foreign currency translation, noncontrolling interests 30,267 29,400 Items to be fully deducted from Tier 1 capital pursuant to Section 10 (2a) KWG (inter alia goodwill and intangible assets) (14,634) (14,459) Items to be partly deducted from Tier 1 capital pursuant to Section 10 (6) and (6a) KWG:
Deductible investments in banking, financial and insurance entities (1,326) (1,332) Securitization positions not included in risk-weighted assets (2,651) (2,863) Excess of expected losses over risk provisions (469) (508)
Items to be partly deducted from Tier 1 capital pursuant to Section 10 (6) and (6a) KWG (4,446) (4,703) Core Tier 1 capital 37,003 36,313
Additional Tier 1 capital: Noncumulative trust preferred securities
1 12,416 12,734 Additional Tier 1 capital 12,416 12,734
Total Tier 1 capital 49,419 49,047
Tier 2 capital: Unrealized gains on listed securities (45 % eligible) 62 70 Profit participation rights 1,150 1,150 Cumulative trust preferred securities 296 294 Qualified subordinated liabilities 8,702 9,368 Items to be partly deducted from Tier 1 capital pursuant to Section 10 (6) and (6a) KWG (4,446) (4,703)
Total Tier 2 capital 5,764 6,179 1 Included € 20 million silent participations both as of March 31, 2012 and as of December 31, 2011.
Other Financial Information (unaudited)

Deutsche Bank Consolidated Financial Statements 68 Interim Report as of March 31, 2012 Other Financial Information (unaudited)
Basel 2 requires the deduction of goodwill from Tier 1 capital. However, for a transitional period, section 64h (3) of the German Banking Act allows the partial inclusion of certain goodwill components in Tier 1 capital. While such goodwill components are not included in the regulatory capital and capital adequacy ratios shown above, the Group makes use of this transition rule in its capital adequacy reporting to the German regulatory authorities.
As of March 31, 2012, the transitional item amounted to € 287 million compared to € 319 million as of Decem-ber 31, 2011. In the Group’s reporting to the German regulatory authorities, the Tier 1 capital, total regulatory capital and the total risk-weighted assets shown above were increased by this amount. Correspondingly, the Group’s reported Tier 1 and total capital ratios including this item were 13.5 % and 15.0 %, respectively, at the end of the quarter compared to 12.9 % and 14.6 % on December 31, 2011.
Credit related Commitments and Contingent Liabilities
In the normal course of business the Group enters regularly into irrevocable lending commitments as well as lending-related contingent liabilities consisting of financial and performance guarantees, standby letters of credit and indemnity agreements on behalf of its customers. Under these contracts the Group is required to perform under an obligation agreement or to make payments to the beneficiary based on a third party’s failure to meet its obligations. For these instruments it is not known to the Group in detail, if, when and to what extent claims will be made. The Group considers these instruments in monitoring its credit exposure and may agree upon collateral to mitigate inherent credit risk. If the credit risk monitoring provides sufficient evidence of a loss from an expected claim, a provision is established and recorded on the balance sheet.
The following table shows the Group’s irrevocable lending commitments and lending-related contingent liabili-ties without considering collateral or provisions. It shows the maximum potential impact to the Group in the event that all of these liabilities must be fulfilled. The table does not show the expected future cash outflows from these obligations as many of them will expire without being drawn, arising claims will be honored by the customers, or such claims may be recovered from proceeds from obtained collateral.
in € m. Mar 31, 2012 Dec 31, 2011
Irrevocable lending commitments 125,673 127,995 Contingent liabilities 69,686 73,653
Total 195,359 201,648
Deutsche Bank Consolidated Financial Statements 69 Interim Report as of March 31, 2012 Other Financial Information (unaudited)
Other Contingencies
Litigation The Group operates in a legal and regulatory environment that exposes it to significant litigation risks. As a result, the Group is involved in litigation, arbitration and regulatory proceedings in Germany and in a number of jurisdictions outside Germany, including the United States, arising in the ordinary course of business. The Group’s material contingent liabilities the possibility of which is more than remote relate to the legal and regula-tory matters described below, some of which consist of a number of claims. In respect of certain of these mat-ters provisions have also been taken. The provision, if any, or the estimated loss in respect of each, where such an estimate can be made, has not been disclosed for individual matters because the Group has conclud-ed that such disclosure can be expected to seriously prejudice their outcome. Note 28 “Provisions” of the Group’s Financial Report 2011 describes how the Group estimates provisions and expected losses in respect of its contingent liabilities, and the uncertainties and limitations inherent in such process. For the Group’s signif-icant legal and regulatory matters where an estimate can be made, the Group currently estimates that, as of March 31, 2012, the aggregate future loss the possibility of which is more than remote is € 2.1 billion in excess of provisions for such matters.
The Group may settle litigation or regulatory proceedings prior to a final judgment or determination of liability. It may do so to avoid the cost, management efforts or negative business, regulatory or reputational conse-quences of continuing to contest liability, even when the Group believes it has valid defenses to liability. It may also do so when the potential consequences of failing to prevail would be disproportionate to the costs of set-tlement. Furthermore, the Group may, for similar reasons, reimburse counterparties for their losses even in situations where it does not believe that it is legally compelled to do so.
Kirch Litigation. In May 2002, Dr. Leo Kirch personally and as an assignee of two entities of the former Kirch Group, i.e., PrintBeteiligungs GmbH and the group holding company TaurusHolding GmbH & Co. KG, initiated legal action against Dr. Rolf-E. Breuer and Deutsche Bank AG alleging that a statement made by Dr. Breuer (then the Spokesman of Deutsche Bank AG’s Management Board) in an interview with Bloomberg television on February 4, 2002 regarding the Kirch Group was in breach of laws and resulted in financial damage.
On January 24, 2006, the German Federal Supreme Court sustained the action for the declaratory judgment only in respect of the claims assigned by PrintBeteiligungs GmbH. Such action and judgment did not require a proof of any loss caused by the statement made in the interview. PrintBeteiligungs GmbH is the only company of the Kirch Group which was a borrower of Deutsche Bank AG. Claims by Dr. Kirch personally and by TaurusHolding GmbH & Co. KG were dismissed. In May 2007, Dr. Kirch filed an action for payment of approx-imately € 1.3 billion plus interest as assignee of PrintBeteiligungs GmbH against Deutsche Bank AG and Dr. Breuer. On February 22, 2011, the District Court Munich I dismissed the lawsuit in its entirety. Dr. Kirch has filed an appeal against the decision. In these proceedings Dr. Kirch has to prove that such statement caused financial damages to PrintBeteiligungs GmbH and the amount thereof.

Deutsche Bank Consolidated Financial Statements 70 Interim Report as of March 31, 2012 Other Financial Information (unaudited)
On December 31, 2005, KGL Pool GmbH filed a lawsuit against Deutsche Bank AG and Dr. Breuer. The law-suit is based on alleged claims assigned from various subsidiaries of the former Kirch Group. KGL Pool GmbH seeks a declaratory judgment to the effect that Deutsche Bank AG and Dr. Breuer are jointly and severally liable for damages as a result of the interview statement and the behavior of Deutsche Bank AG in respect of several subsidiaries of the Kirch Group. In December 2007, KGL Pool GmbH supplemented this lawsuit by a motion for payment of approximately € 2.0 billion plus interest as compensation for the purported damages which two subsidiaries of the former Kirch Group allegedly suffered as a result of the statement by Dr. Breuer. On March 31, 2009, the District Court Munich I dismissed the lawsuit in its entirety. The plaintiff appealed the decision. The appellate court has begun taking evidence and recommended that the parties consider a settle-ment of all legal proceedings pending between Deutsche Bank and Dr. Kirch and related parties. Deutsche Bank holds the view that the claims have no basis and neither the causality of the interview statement for any damages nor the scope of the claimed damages has been sufficiently substantiated. Dr. Kirch passed away in July 2011. The death of Dr. Kirch has no impact on the proceedings. On March 1, 2012, after thorough review, Deutsche Bank did not accept an out-of-court settlement proposal.
Mortgage-Related and Asset-Backed Securities Matters. Deutsche Bank AG, along with certain affiliates (col-lectively referred to as “Deutsche Bank”), have received subpoenas and requests for information from certain regulators and government entities concerning its activities regarding the origination, purchase, securitization, sale and/or trading of mortgage loans, residential mortgage-backed securities (RMBS), collateralized debt obligations, asset-backed commercial paper and credit derivatives. Deutsche Bank is cooperating fully in response to those subpoenas and requests for information.
Deutsche Bank has been named as defendant in numerous civil litigations in various roles as issuer or under-writer in RMBS offerings. These cases include purported class action suits, actions by individual purchasers of securities, and actions by insurance companies that guaranteed payments of principal and interest for particu-lar tranches of securities offerings. Although the allegations vary by lawsuit, these cases generally allege that the RMBS offering documents contained material misrepresentations and omissions, including with regard to the underwriting standards pursuant to which the underlying mortgage loans were issued, or assert that vari-ous representations or warranties relating to the loans were breached at the time of origination.
Deutsche Bank and several current or former employees were named as defendants in a putative class action commenced on June 27, 2008, relating to two Deutsche Bank-issued RMBS offerings. Following a mediation, the court has preliminarily approved a settlement of the case. The settlement remains subject to certain terms and final court approval, with a final approval hearing currently scheduled for July 10, 2012.

Deutsche Bank Consolidated Financial Statements 71 Interim Report as of March 31, 2012 Other Financial Information (unaudited)
Deutsche Bank is a defendant in putative class actions relating to its role, along with other financial institutions, as underwriter of RMBS issued by various third-parties and their affiliates including Countrywide Financial Corporation, IndyMac MBS, Inc., Novastar Mortgage Corporation, and Residential Accredit Loans, Inc. These cases are in various stages up through discovery. On March 29, 2012, the court dismissed with prejudice and without leave to replead the putative Novastar Mortgage Corporation class action.
Deutsche Bank is a defendant in various non-class action lawsuits by alleged purchasers of, and counterpar-ties involved in transactions relating to, RMBS, and their affiliates, including Allstate Insurance Company, Asset Management Fund, Assured Guaranty Municipal Corp., Cambridge Place Investments Management Inc., the Federal Deposit Insurance Corporation (as conservator for Franklin Bank S.S.B.), the Federal Home Loan Bank of Boston, the Federal Home Loan Bank of San Francisco, the Federal Home Loan Bank of Seattle, the Federal Housing Finance Agency (as conservator for Fannie Mae and Freddie Mac), Mass Mutual Life Insur-ance Company, Moneygram Payment Systems, Inc., Phoenix Light SF Limited, RMBS Recovery Holdings 4, LLC and VP Structured Products, LLC., Sealink Funding Ltd., Stichting Pensioenfonds ABP, The Charles Schwab Corporation, The Union Central Life Insurance Company, The Western and Southern Life Insurance Co., and the West Virginia Investment Management Board. These civil litigations are in various stages up through discovery.
In the actions against Deutsche Bank solely as an underwriter of other issuers’ RMBS offerings, Deutsche Bank has contractual rights to indemnification from the issuers, but those indemnity rights may in whole or in part prove effectively unenforceable where the issuers are now in bankruptcy or otherwise defunct.
On February 6, 2012, the United States District Court for the Southern District of New York issued an order dismissing claims brought by Dexia SA/NV and Teachers Insurance and Annuity Association of America and their affiliates. The court dismissed some of the claims with prejudice and granted the plaintiffs leave to replead other claims.
A number of other entities have threatened to assert claims against Deutsche Bank in connection with various RMBS offerings and other related products, and Deutsche Bank has entered into agreements with a number of these entities to toll the relevant statutes of limitations. It is possible that these potential claims may have a material impact on Deutsche Bank.
On May 3, 2011, the United States Department of Justice (USDOJ) filed a civil action against Deutsche Bank AG and MortgageIT, Inc. in the United States District Court for the Southern District of New York. The USDOJ filed an amended complaint on August 22, 2011. The amended complaint, which asserts claims under the U.S. False Claims Act and common law, alleges that Deutsche Bank AG, DB Structured Products, Inc., MortgageIT, Inc. and Deutsche Bank Securities Inc. (DBSI) submitted false certifications to the Department of Housing and Urban Development’s Federal Housing Administration (FHA) concerning MortgageIT, Inc.'s compliance with FHA requirements for quality controls and concerning whether individual loans qualified for FHA insurance. As set forth in the amended complaint, the FHA has paid U.S.$ 368 million in insurance claims on mortgages that are allegedly subject to false certifications. The amended complaint seeks recovery of treble damages and indemnification of future losses on loans insured by FHA, and as set forth in the filings, the USDOJ seeks over U.S.$ 1 billion in damages. On September 23, 2011, the defendants filed a motion to dismiss the amended complaint. Following a hearing on December 21, 2011, the court granted the USDOJ leave to file a second amended complaint.

Deutsche Bank Consolidated Financial Statements 72 Interim Report as of March 31, 2012 Other Financial Information (unaudited)
Auction Rate Securities Litigation. Deutsche Bank AG and DBSI have been named as defendants in 21 actions asserting various claims under the federal securities laws and state common law arising out of the sale of auction rate preferred securities and auction rate securities (together, “ARS”). Of those 21 actions, five are pending and sixteen have been resolved and dismissed with prejudice. Deutsche Bank AG and DBSI were the subjects of a putative class action, filed in the United States District Court for the Southern District of New York, asserting various claims under the federal securities laws on behalf of all persons or entities who purchased and continue to hold ARS offered for sale by Deutsche Bank AG and DBSI between March 17, 2003 and Feb-ruary 13, 2008. In December 2010, the court dismissed the putative class action with prejudice. After initially filing a notice of appeal, the plaintiff voluntarily withdrew and dismissed the appeal in December 2011. Deutsche Bank AG was also named as a defendant, along with ten other financial institutions, in two putative class actions, filed in the United States District Court for the Southern District of New York, asserting violations of the antitrust laws. The putative class actions allege that the defendants conspired to artificially support and then, in February 2008, restrain the ARS market. On or about January 26, 2010, the court dismissed the two putative class actions. The plaintiffs have filed appeals of the dismissals.
Trust Preferred Securities Litigation. Deutsche Bank AG and certain of its affiliates and officers are the subject of a consolidated putative class action, filed in the United States District Court for the Southern District of New York, asserting claims under the federal securities laws on behalf of persons who purchased certain trust pre-ferred securities issued by Deutsche Bank and its affiliates between October 2006 and May 2008. Claims are asserted under Sections 11, 12(a)(2), and 15 of the Securities Act of 1933 that registration statements and prospectuses for such securities contained material misstatements and omissions. An amended and consoli-dated class action complaint was filed on January 25, 2010. On August 19, 2011, the court granted in part and denied in part the defendants’ motion to dismiss. Defendants have moved for reconsideration of the portion of the decision denying the motion to dismiss. On September 20, 2011, plaintiffs filed a second amended com-plaint, which no longer includes claims based on the October 2006 issuance of securities.
Interbank Offered Rates Matters. Deutsche Bank AG has received various subpoenas and requests for infor-mation from certain regulators and governmental entities in the United States and Europe, including the U.S. Department of Justice, the U.S. Commodity Futures Trading Commission, the U.S. Securities and Exchange Commission, and the European Commission, in connection with setting interbank offered rates for various currencies. These inquiries relate to various periods between 2005 and 2011. Deutsche Bank is cooperating with these investigations. In addition, a number of civil actions, including putative class actions, have been filed in federal courts in the United States against Deutsche Bank AG, an affiliate and numerous other banks on behalf of certain parties who allege that they transacted in LIBOR-based financial instruments and that the defendants manipulated, through various means, the U.S. dollar LIBOR rate and prices of U.S. dollar LIBOR-based derivatives in various markets. Claims for damages are asserted under various legal theories, including violations of the Commodity Exchange Act and the antitrust laws. The civil actions have been consolidated for pre-trial purposes in the United States District Court for the Southern District of New York. The litigations are in their early stages.

Deutsche Bank Consolidated Financial Statements 73 Interim Report as of March 31, 2012 Other Financial Information (unaudited)
Mortgage Repurchase Demands From 2005 through 2008, as part of Deutsche Bank’s U.S. residential mortgage loan business, Deutsche Bank sold approximately U.S.$ 84 billion of private label securities and U.S.$ 71 billion of loans through whole loan sales, including to U.S. government-sponsored entities such as the Federal Home Loan Mortgage Corporation and the Federal National Mortgage Association. Deutsche Bank has been presented with demands to repur-chase loans or indemnify purchasers, other investors or financial insurers with respect to losses allegedly caused by material breaches of representations and warranties. Deutsche Bank’s general practice is to pro-cess valid repurchase demands that are presented in compliance with contractual rights. Where Deutsche Bank believes no such valid basis for repurchase demands exists, Deutsche Bank rejects them and no longer considers them outstanding for Deutsche Bank’s tracking purposes.
As of March 31, 2012, Deutsche Bank has approximately U.S.$ 1.4 billion of outstanding mortgage repurchase demands (based on original principal balance of the loans). Against these outstanding demands, Deutsche Bank has established provisions that are not material and that Deutsche Bank believes to be adequate. There are other potential loan repurchase demands that, based on past experience, Deutsche Bank anticipates will be made but for which Deutsche Bank cannot reliably estimate the timing or level. Deutsche Bank also does not know whether its past success rate in rebutting such demands will be a good predictor of future success. Mortgage repurchase demands that are asserted via legal proceedings against Deutsche Bank, whether fol-lowing rejection by Deutsche Bank or otherwise, are classified under Operational/Litigation.
As of March 31, 2012, Deutsche Bank has completed repurchases and otherwise settled claims on loans with an original principal balance of approximately U.S.$ 2.4 billion. In connection with those repurchases and set-tlements, Deutsche Bank has obtained releases for potential claims on approximately U.S.$ 40.7 billion of loans sold by Deutsche Bank as described above.
Related Party Transactions
Transactions with related parties are made in the ordinary course of business and on substantially the same terms, including interest rates and collateral, as those prevailing for comparable transactions with other parties.
Transactions with Key Management Personnel Key management personnel are those persons having authority and responsibility for planning, directing and controlling the activities of Deutsche Bank Group, directly or indirectly. The Group considers the members of the Management Board as currently mandated and the Supervisory Board to constitute key management personnel for purposes of IAS 24. Among the Group’s transactions with key management personnel as of March 31, 2012, were loans and commitments of € 10 million and deposits of € 11 million. As of Decem-ber 31, 2011, there were loans and commitments of € 11 million and deposits of € 9 million among the Group’s transactions with key management personnel. In addition, the Group provides banking services, such as pay-ment and account services as well as investment advice, to key management personnel and their close family members.

Deutsche Bank Consolidated Financial Statements 74 Interim Report as of March 31, 2012 Other Financial Information (unaudited)
During 2010 and up to the first quarter of 2011, a member of key management personnel received payments from a Group company. At the time the contractual arrangement was closed the payor company was not in-cluded in the Group of consolidated companies.
Transactions with Subsidiaries, Associates and Joint Ventures Transactions between Deutsche Bank AG and its subsidiaries meet the definition of related party transactions. If these transactions are eliminated on consolidation, they are not disclosed as related party transactions. Transactions between the Group and its associated companies and joint ventures and their respective subsidi-aries also qualify as related party transactions.
Loans In the three months ended March 31, 2012, and in the year 2011 loans issued and guarantees granted to related parties developed as follows.
Associated companies and other related parties
in € m. Mar 31, 2012 Dec 31, 2011
Loans outstanding, beginning of period 5,158 4,329
Loans issued during the period 147 1,211
1 Loan repayments during the period 314 307 Changes in the group of consolidated companies − (13) Exchange rate changes/other (2) (62)
Loans outstanding, end of period
2, 3 4,989 5,158
Other credit risk related transactions: Allowance for loan losses 21 53 Provision for loan losses (0) 22 Guarantees and commitments 273 262 1 The amount of loans issued during 2011 is mainly related to the restructuring of a loan transaction. Related interest income earned amounted to € 230 million. 2 Interest income earned from loans outstanding amounts up to € 70 million as of March 31, 2012. 3 Loans past due were nil as of March 31, 2012, and December 31, 2011, respectively.
Deposits In the three months ended March 31, 2012, and in the year 2011 deposits received from related parties devel-oped as follows.
Associated companies and other related parties
in € m. Mar 31, 2012 Dec 31, 2011
Deposits, beginning of period 247 220
Deposits received during the period 157 258 Deposits repaid during the period 69 190 Changes in the group of consolidated companies (2) (41) Exchange rate changes/other (0) 0
Deposits, end of period 333 247

Deutsche Bank Consolidated Financial Statements 75 Interim Report as of March 31, 2012 Other Financial Information (unaudited)
Other Transactions Trading assets and positive market values from derivative financial transactions with associated companies amounted to € 294 million as of March 31, 2012, and € 221 million as of December 31, 2011. Trading liabilities and negative market values from derivative financial transactions with associated companies amounted to € 9 million as of March 31, 2012, and € 19 million as of December 31, 2011.
Transactions with Pension Plans The Group has business relationships with a number of its pension plans pursuant to which it provides financial services to these plans, including investment management. Pension funds may hold or trade Deutsche Bank AG shares or securities. As of March 31, 2012, transactions with these plans were not material for the Group.
Non-Current Assets and Disposal Groups Held for Sale
Within the balance sheet non-current assets and disposal groups held for sale are reported in other assets and other liabilities. This note provides further explanation on the nature and the financial impact of the non-current assets and disposal groups held for sale as of March 31, 2012.
Non-Current Assets and Disposal Groups Held for Sale at the Reporting Date Total assets and liabilities held for sale amounted to € 251 million (December 31, 2011: € 2.4 billion) and € 2 million as of March 31, 2012 (December 31, 2011: € 1.7 billion).
In the first quarter 2012, the Group classified a building being held as property and equipment within the Group Division Corporate Investments as held for sale. The classification as held for sale did not result in any impairment loss. The asset was sold as of April 2, 2012.
Additionally, the Group classified an investment in an associate within the Corporate Division Corporate Banking & Securities as held for sale in 2011 that is expected to be sold within one year. The classification as held for sale led to an initial impairment loss of € 2 million in 2011 and, due to a changed fair value less cost to sell, to a rever-sal of that impairment of € 2 million in the first quarter 2012 which were both recognized in other income.
As of March 31, 2012 and December 31, 2011, no unrealized net gains or losses relating to non-current assets and disposal groups classified as held for sale were recognized directly in accumulated other comprehensive income (loss).
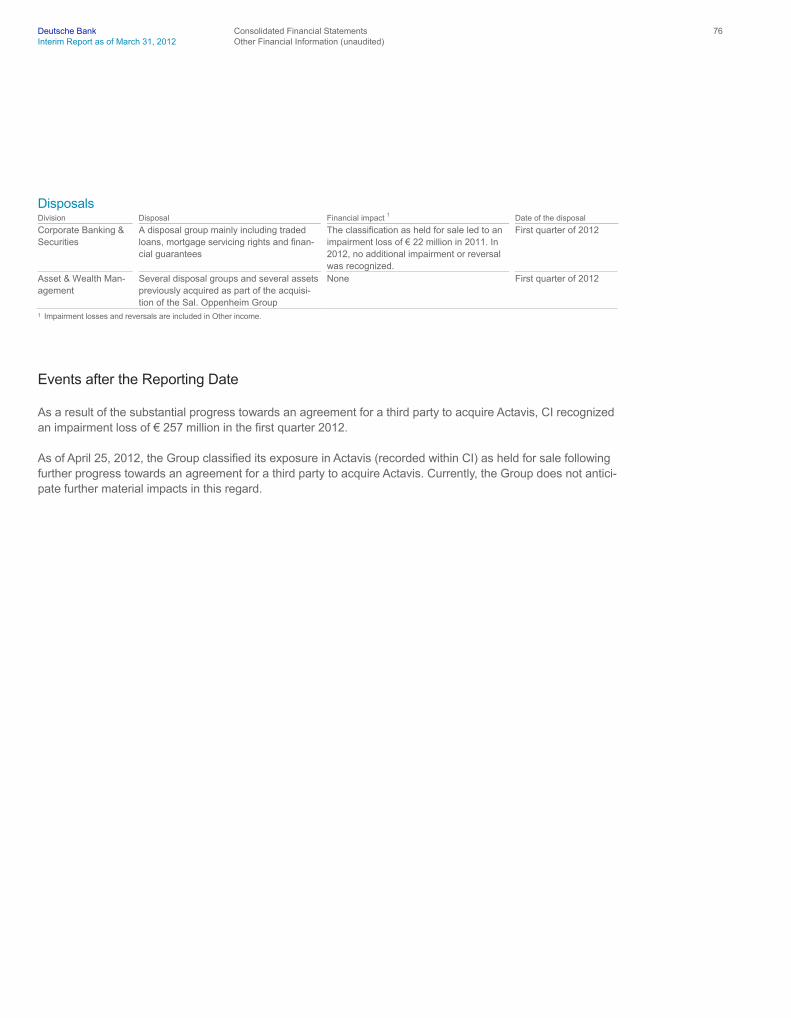
Deutsche Bank Consolidated Financial Statements 76 Interim Report as of March 31, 2012 Other Financial Information (unaudited)
Disposals Division Disposal Financial impact 1 Date of the disposal
Corporate Banking & Securities
A disposal group mainly including traded loans, mortgage servicing rights and finan-cial guarantees
The classification as held for sale led to an impairment loss of € 22 million in 2011. In 2012, no additional impairment or reversal was recognized.
First quarter of 2012
Asset & Wealth Man-agement
Several disposal groups and several assets previously acquired as part of the acquisi-tion of the Sal. Oppenheim Group
None First quarter of 2012
1 Impairment losses and reversals are included in Other income.
Events after the Reporting Date
As a result of the substantial progress towards an agreement for a third party to acquire Actavis, CI recognized an impairment loss of € 257 million in the first quarter 2012.
As of April 25, 2012, the Group classified its exposure in Actavis (recorded within CI) as held for sale following further progress towards an agreement for a third party to acquire Actavis. Currently, the Group does not antici-pate further material impacts in this regard.

Deutsche Bank Other Information (unaudited) 77 Interim Report as of March 31, 2012 Target Definitions
Target Definitions
This document and other documents the Group has published or may publish contain non-GAAP financial measures. Non-GAAP financial measures are measures of the Group’s historical or future performance, financial position or cash flows that contain adjustments that exclude or include amounts that are included or excluded, as the case may be, from the most directly comparable measure calculated and presented in accordance with IFRS in the Group’s financial statements. The Group refers to the definitions of certain adjust-ments as “target definitions” because the Group has in the past used and may in the future use the non-GAAP financial measures based on them to measure its financial targets.
The Group’s non-GAAP financial measures that relate to earnings use target definitions that adjust IFRS finan-cial measures to exclude certain significant gains (such as gains from the sale of industrial holdings, business-es or premises) and certain significant charges (such as charges from restructuring, impairments of intangible assets or litigation) if such gains or charges are not indicative of the future performance of the Group’s core businesses.
Pre-Tax Return on Average Active Equity (Target Definition) The over-the-cycle pre-tax return on average active equity non-GAAP financial measure is based on IBIT at-tributable to Deutsche Bank shareholders (target definition), as a percentage of the Group’s average active equity. Both are defined below.
IBIT attributable to Deutsche Bank Shareholders (Target Definition): The IBIT attributable to Deutsche Bank shareholders non-GAAP financial measure is based on income before income taxes attributable to Deutsche Bank shareholders (i.e., excluding pre-tax noncontrolling interests), adjusted for certain significant gains and charges as follows:
Three months ended
in € m. Mar 31, 2012 Mar 31, 2011
Income (loss) before income taxes (IBIT) 1,879 3,021 Less pre-tax noncontrolling interests (29) (89)
IBIT attributable to Deutsche Bank shareholders 1,850 2,932
Add (deduct): Certain significant gains (net of related expenses) − (236)
1 Certain significant charges − −
IBIT attributable to Deutsche Bank shareholders (target definition) 1,850 2,696 1 Positive impact of € 236 million related to the stake in Hua Xia Bank (PBC) for which equity method accounting was applied. The amount is based on its presentation
in the first quarter 2011. It included a gross gain of € 263 million, which was in part reduced by anticipated cost components of € 26 million that did not materialize later in 2011.
Other Information (unaudited)

Deutsche Bank Other Information (unaudited) 78 Interim Report as of March 31, 2012 Target Definitions
Average Active Equity: The Group calculates active equity to make comparisons to its competitors easier and refers to active equity in several ratios. However, active equity is not a measure provided for in IFRS and you should not compare the Group’s ratios based on average active equity to other companies’ ratios without con-sidering the differences in the calculation. The items for which the Group adjusts the average shareholders’ equity are average accumulated other comprehensive income (loss) excluding foreign currency translation (all components net of applicable taxes), as well as average dividends, for which a proposal is accrued on a quar-terly basis and which are paid after the approval by the Annual General Meeting following each year. Tax rates applied in the calculation of average active equity are those used in the financial statements for the individual items and not an average overall tax rate.
Three months ended
in € m. Mar 31, 2012 Mar 31, 2011
Average shareholders’ equity 54,293 49,471
Add (deduct): Average accumulated other comprehensive income excluding foreign currency translation, net of applicable tax
1 548 290 Average dividend accruals (784) (784)
Average active equity 54,056 48,977 1 The tax effect on average accumulated other comprehensive income (loss) excluding foreign currency translation was € (472) million for the three months ended
March 31, 2012. For the three months ended March 31, 2011, the tax effect was € (375) million.
Pre-tax return on average active equity (target definition) is presented below. For comparison, also presented are the pre-tax return on average shareholders’ equity, which is defined as IBIT attributable to Deutsche Bank shareholders (i.e., excluding pre-tax noncontrolling interests), as a percentage of average shareholders’ equity, and the pre-tax return on average active equity, which is defined as IBIT attributable to Deutsche Bank share-holders (i.e., excluding pre-tax noncontrolling interests), as a percentage of average active equity.
Three months ended
in % Mar 31, 2012 Mar 31, 2011
Pre-tax return on average active equity (target definition) 13.7 % 22.0 % Pre-tax return on average shareholders’ equity 13.6 % 23.7 % Pre-tax return on average active equity 13.7 % 23.9 %

Deutsche Bank Other Information (unaudited) 79 Interim Report as of March 31, 2012 Target Definitions
Leverage Ratio (Target Definition) As part of its balance sheet management, the Group uses an adjusted leverage ratio, which is calculated using a target definition for which adjustments are made to reported IFRS total assets and total equity. Such adjusted measures, which are non-GAAP financial measures, are described within this report in the section “Risk Report – Balance Sheet Management”.
Deutsche Bank Impressum 80 Interim Report as of March 31, 2012
Deutsche Bank Aktiengesellschaft Taunusanlage 12 60262 Frankfurt am Main Germany Telephone: +49 69 9 10-00 [email protected] Investor Relations: +49 69 9 10-3 80 80 [email protected] The Interim Report on the Internet: www.deutsche-bank.com/1Q2012
Cautionary statement regarding forward-looking statements
This report contains forward-looking statements. Forward-looking statements are statements that are not historical facts; they include statements about our beliefs and expectations and the assumptions underlying them. These statements are based on plans, estimates and projections as they are currently available to the management of Deutsche Bank. Forward-looking statements therefore speak only as of the date they are made, and we undertake no obligation to update publicly any of them in light of new information or future events.
By their very nature, forward-looking statements involve risks and uncertainties. A number of impor-tant factors could therefore cause actual results to differ materially from those contained in any forward-looking statement. Such factors include the condi-tions in the financial markets in Germany, in Europe, in the United States and elsewhere from which we derive a substantial portion of our trading revenues, potential defaults of borrowers or trading counterpar-ties, the implementation of our management agenda, the reliability of our risk management policies, procedures and methods, and other risks referenced in our filings with the U.S. Securities and Exchange Commission. Such factors are described in detail in our SEC Form 20-F of March 20, 2012, in the section “Risk Factors”. Copies of this document are available upon request or can be downloaded from www.deutsche-bank.com/ir.
Impressum


DBANK_Logomaske_Jahresbericht_Umschlag Hell.indd 1 18.02.12 15:28
2012May 31, 2012Annual General Meeting in the FesthalleFrankfurt am Main (Exhibition Center)
June 1, 2012Dividend payment
July 31, 2012Interim Report as of June 30, 2012
October 30, 2012Interim Report as of September 30, 2012
2013January 31, 2013�Preliminary�results�for�the�2012�financial�year
March 21, 2013Annual Report 2012 and Form 20-F
April 30, 2013Interim Report as of March 31, 2013
May 23, 2013 Annual General Meeting in the FesthalleFrankfurt am Main (Exhibition Center)
May 24, 2013Dividend payment
July 30, 2013Interim Report as of June 30, 2013
October 29, 2013Interim Report as of September 30, 2013
The cover photo shows our shareholder Dr. June Rin in Singapore, where she was photographed for the Annual Review 2011. More information�on�our�annual�reporting�and�statements�made�by�representatives�of�our�stakeholders�can�be�found� under www.deutsche-bank.com /11.