Embed Size (px)
Citation preview

Interim Report
1 January 2016 – 31 March 2016
Eesti Energia Aulepa Wind Park in Noarootsi, Estonia
Eesti Energia Q1 2016 Interim Report, 1 January – 31 March | 2 |
Contents
Summary of Q1 Results ................................................................................................................................................ 3
Summary of Eesti Energia ............................................................................................................................................ 5
Key Figures and Ratios ................................................................................................................................................ 6
Operating Environment ................................................................................................................................................. 7
Financial Results ........................................................................................................................................................ 11
Sales Revenues and EBITDA ................................................................................................................................. 11
Electricity ................................................................................................................................................................. 12
Distribution .............................................................................................................................................................. 15
Shale Oil ................................................................................................................................................................. 17
Other Products and Services .................................................................................................................................. 19
Cash Flows ................................................................................................................................................................. 20
Investment .................................................................................................................................................................. 21
Financing .................................................................................................................................................................... 24
Outlook for FY 2016 .................................................................................................................................................... 25
Condensed Consolidated Interim Income Statement and Statement of Comprehensive Income ............................. 26
Condensed Consolidated Interim Statement of Financial Position ............................................................................ 27
Condensed Consolidated Interim Statement of Cash Flows ...................................................................................... 28
Condensed Consolidated Interim Statement of Changes in Equity ........................................................................... 29
Notes to the Condensed Interim Consolidated Financial Statements ........................................................................ 30
1. Accounting Policies ............................................................................................................................................. 30
2. Financial Risk Management ............................................................................................................................... 31
3. Segment Reporting ............................................................................................................................................. 34
4. Seasonality of Operating Profit ........................................................................................................................... 36
5. Property, Plant and Equipment ........................................................................................................................... 36
6. Derivative Financial Instruments......................................................................................................................... 37
7. Share Capital and Dividends .............................................................................................................................. 37
8. Earnings per Share ............................................................................................................................................. 37
9. Nominal Value and Amortised Cost of Borrowings............................................................................................. 38
10. Cash Generated From Operations ................................................................................................................... 39
11. Provisions ......................................................................................................................................................... 40
12. Related Party Transactions .............................................................................................................................. 41
13. Effects of Changes in Condensed Consolidated Interim Income Statement ................................................... 42
Glossary ...................................................................................................................................................................... 43

Eesti Energia Q1 2016 Interim Report, 1 January – 31 March | 3 |
Summary of Q1 Results
Dear reader
The first quarter of 2016 was somewhat a period of
opposites. In the cold of January, our power plants
set a number of consecutive electricity production
records of the independence period – at the peak
time we supplied to the grid over 2,100 MW of
electricity per hour. This was tangible proof of how
necessary Eesti Energia’s power generation
capacities are for the region and allowed to export
massive quantities of electricity to both Finland and
Latvia. However, in February electricity prices were
very low, mostly because of exceptionally warm
weather.
The first quarter also saw the launch of the NordBalt
submarine cable that links the Lithuanian and
Swedish power systems and further integrates the
Baltic region with the Nordic electricity market. On the
one hand, the cable provides the Baltic countries with
Scandiavia’s cheap nuclear and hydro energy which
reduces congestion across the Baltics. On the other
hand, the submarine power link allows us to increase
electricity sales to Latvia as it reduces long-term
network overload on the border between Estonia and
Latvia. Interconnections between Estonia and Latvia
and sufficient transmission capacities are essential
for electricity export. Hopefully, by 2020 there will be
additional transmission capacities between Estonia
and Latvia. In the first quarter, the average electricity
price in the Estonian area of the Nord Pool power
exchange was 31.8 €/MWh, 2% lower than a year
ago.
At the beginning of the year, the oil markets were
oversupplied and the world market price of oil on
which the sales price of our shale oil depends
plunged to the past 12 years’ lowest level – a barrel
of Brent crude cost 23.7 euros. In addition to the oil
industry, this hit the Estonian oil shale industry. In
March, the government decided to respond to the
situation by lowering the resource and environmental
charges levied on oil shale in order to maintain the oil
shale industry’s contribution to public revenue. The
change in legislation, which takes effect in July, will
lower our break-even cost. It will help us overcome
the hard times and retain jobs and production
capacities until market prices recover. Although in
March the oil price rallied somewhat, the average
price for the quarter remained at 30.5 euros, which is
still 37% weaker than a year ago and times lower
than the price level before the end of 2014.
Despite the harsh environment, Eesti Energia has
remained a profitable company. We ended the first
quarter of 2016 with sales revenues of 197 million
euros, a 10% decrease compared with the same
period last year. We generated EBITDA (earnings
before interest, tax, depreciation and amortisation) of
60 million euros and earned a net profit of 19 million
euros. Compared with the first quarter of 2015,
EBITDA declined by 31% and net profit by 64%. The
decrease in sales revenues is mainly attributable to
weaker electricity and shale oil revenues resulting
from the prices of both products having been low for
a long time. However, first quarter profit decreased
also due to by some one-off transactions which we
did not have this year.
Eesti Energia’s first quarter electricity sales revenue
amounted to 90 million euros. Altogether, we sold in
the retail and wholesale markets 2,016 GWh of
electricity, 8% less than a year ago. In the months
following the record-breaking beginning of the year,
we have pursued our usual production model – in
hours where the prices are higher we sell the
maximum quantities of electricity to the power
exchange and in hours where the prices are low we
reduce the load of the Narva power plants so as not
to weaken our performance indicators.
We have increased our electricity sales in Latvia and
Lithuania where we operate under the Enefit brand.
In the first quarter, our electricity sales in Latvia and
Lithuania totalled 446 GWh, a 31% improvement year
over year, and our market share in both countries as
well as the whole Baltic region grew. Moreover, one

Eesti Energia Q1 2016 Interim Report, 1 January – 31 March | 4 |
of the biggest successes was the winning of a
contract for supplying electricity to the city of Riga by
our Latvian subsidiary.
Our first quarter shale oil sales totalled 34 thousand
tonnes, a 51% decrease compared with the same
period last year. Sales volume was smaller due to
lower oil prices, which made it more reasonable to
increase shale oil inventories. Our shale oil output
was 67 thousand tonnes, 21% smaller than a year
ago. We took advantage of the low world market
price time period by scheduling oil plant maintenance
there. During the quarter, our new Enefit280 oil plant
increased its output to 38 thousand tonnes and for
the first time contributed more than half of our total
shale oil output.
Eesti Energia’s capital expenditures have decreased
because a period of major capital outlays has
reached its final phase. In the first quarter, the largest
capital investments were made in the quality of the
distribution network. We spent 18 million euros on
renovating existing and building new substations and
power lines, and continued installing smart meters.
By the end of the quarter, smart meters accounted for
85% of all the power meters of Elektrilevi, the
subsidiary that operates the distribution network.
Transition to smart meters will be completed this
year, which means that Estonia will have one of the
smartest power networks in the world. A smarter
network benefits both the network operator that can
make more precise and smarter investments and the
consumers who do not have to submit the reading
and can better manage their electricity consumption.
At the Auvere power plant, the pre-delivery tests of
the generating unit continued until February, after
which electrostatic precipitators were adjusted to
achieve the exceptionally low emission levels of the
design specifications. Pre-delivery tests of the power
plant will continue in the second quarter. Final
delivery and acceptance of the power plant has also
been scheduled for the second quarter.
In recent years the situation in the energy sector has
changed radically and we carried out several
streamlining projects. Last January we launched the
Industry 3.5 programme with a view to reviewing all
of Eesti Energia’s core processes and identifying
opportunities for increasing efficiency through
digitalisation. We expect the programme to provide
important input for our strategy.
In the near term, energy prices will remain volatile
and we must be able to cope with it. We will continue
development of our oil and electricity cogeneration
technology because it is the most efficient oil shale
processing technology in the world. New Enefit-
technology based investments will depend, above all,
on the recovery of the market. We are one of the
largest renewable energy producers in the Baltics
and have also development ambitions in that area.
Hando Sutter
CEO and Chairman of the Management Board of
Eesti Energia

Eesti Energia Q1 2016 Interim Report, 1 January – 31 March | 5 |
Summary of Eesti Energia
Eesti Energia is an international energy company
that operates in the unified electricity market of
the Baltic and Nordic countries. Its sole
shareholder is the Republic of Estonia.
Eesti Energia offers energy solutions ranging from
electricity, heat and fuel production to sales,
customer service and ancillary energy services. Eesti
Energia sells electricity to the Baltic retail customers
and the wholesale market and Group entity Elektrilevi
distributes electricity to customers in Estonia. Outside
Estonia, the Group operates under the Enefit brand.
With its approximately 5,900 employees, Eesti
Energia is one of the largest employers in Estonia.

Eesti Energia Q1 2016 Interim Report, 1 January – 31 March | 6 |
Key Figures and Ratios
Q1
2016 Q1
2015 Change
Total electricity sales, of which GWh 2,016 2,188 -7.8%
wholesale sales GWh 243 631 -61.4%
retail sales GWh 1,773 1,556 +13.9%
Electricity distributed GWh 1,941 1,789 +8.5%
Shale oil sales th t 34 70 -51.0%
Heat sales GWh 549 460 +19.3%
Distribution grid losses % 4.8 5.3 -0.5pp
Average number of employees No. 5,873 6,545 -10.3%
Sales revenues m€ 197.0 219.8 -10.4%
EBITDA m€ 60.3 87.8 -31.4%
Operating profit m€ 25.0 52.8 -52.6%
Net profit m€ 19.4 54.7 -64.5%
Investments m€ 31.7 52.4 -39.5%
Cash flow from operating activities m€ 33.0 162.6 -79.7%
FFO m€ 57.4 83.3 -31.0%
Non-current assets m€ 2,547.1 2,537.6 +0.4%
Equity m€ 1,589.6 1,661.5 -4.3%
Net debt m€ 792.1 727.7 +8.8%
Net debt / EBITDA* times 3.3 2.3 +44.7%
FFO* / net debt times 0.27 0.30 -9.3%
FFO* / interest cover* times 5.7 5.8 -3.3%
EBITDA* / interest cover* times 6.3 8.6 -26.3%
Leverage % 33.3 30.5 +2.8pp
ROIC* % 1.2 8.0 -6.7pp
EBITDA margin % 30.6 40.0 -9.4pp
Operating profit margin % 12.7 24.0 -11.3pp
Definitions of ratios and terms are explained in the Glossary section of the report, page 43
* rolling 12 months result

Eesti Energia Q1 2016 Interim Report, 1 January – 31 March | 7 |
Operating Environment
In Q1 2016, energy prices were lower than a year
earlier. The business activities of Eesti Energia are
connected with the Nordic region and global energy
markets as well. Oil prices continue to be low, the
market is oversupplied and demand is weaker than
expected. In Q1, prices on the Nord Pool power
exchange were low due to warmer than usual air
temperature and cheap Swedish energy supplied to
the Baltic countries via the NordBalt power cable
linking Lithuania and Sweden that was opened in
February.
According to the projections of the International
Monetary Fund (IMF), the world economy will sustain
growth in line with the previous years but growth is
becoming more fragile. The IMF forecasts that in
2016 global growth will be 3.2% (+0.1pp compared
with 2015), developed countries will grow by 1.9% (at
the same rate as last year) and emerging market and
developing economies will grow by 4.1% (+0.1pp).
The US economy is expected to grow by 2.4% (at the
same rate as last year) and the growth forecast for
the euro area is 1.5% (-0.1pp).
Liquid Fuels Prices
In Q1 2016, the average Brent crude oil price was
30.5 €/bbl (-36.5%, -17.5 €/bbl compared with the
same period last year).
Average price Q1 2016
Q1 2015
Change
Brent crude oil €/bbl 30.5 48.0 -36.5%
Fuel oil (1% sulphur content)
€/t 126.5 250.5 -49.5%
Fuel oil 1% crack spread
€/bbl -11.9 -9.7 +22.7%
Euro exchange rate
EUR/USD 1.1041 1.1268 -2.0%
After trending downward for over a year, Brent crude
hit a new low on 20 January 2016 when it fell to
23.7 €/bbl, its weakest level since 2004. In January
the average price of Brent crude was 28.3 €/bbl and
in February it did not change substantially. At the end
of the quarter, the price of Brent crude recovered
slightly and the average price for March was
34.2 €/bbl.
In January, the price of Brent crude was driven down
by factors which have had the strongest impact on
the market during the past year: low demand in
advanced industrial countries and abundant supply
from OPEC and other producers. At the end of the
month, chilly weather in Europe and the USA
increased energy consumption, pushing the crude oil
price above 30 €/bbl.
In February, OPEC announced that it would launch
diplomatic efforts involving Russia in order to limit
global oil output. On 16 February, Saudi Arabia,
Qatar, Venezuela and Russia announced that oil
production would be maintained at the level of
January and would not be increased. In response to
the news, the oil price rallied, closing at 33.2 €/bbl at
the end of the month.
In March, the average crude oil price was the period’s
highest (34.2 €/bbl), primarily thanks to the
production limitation announcement made by OPEC
and its partners in February.
In Q1, the average price of fuel oil (1% sulphur
content) was 126.5 €/t, 49.5% (-124.0 €/t) weaker
than a year ago. Similarly to the oil price, fuel oil hit
its recent years’ lowest level in January when its
average price dropped to 115.5 €/t. In Q1 2016, the
crack spread which measures the difference between
the prices of Brent crude oil and the fuel oil extracted
from it was 2.2 €/bbl wider than a year ago. In
January and February, the crack spread narrowed
because fuel oil imports from Russia declined due to
colder weather which increased local demand. At the
same time, arbitrage opportunities to Asia increased.
In March, the crack spread widened (-13.3 €/bbl)
because the price of fuel oil did not grow at the same
rate as that of Brent crude due to seasonal factors:
the heating season was coming to an end, demand
was weakening, and the need for air conditioning and
cruise vessels’ fuel consumption had not yet started

Eesti Energia Q1 2016 Interim Report, 1 January – 31 March | 8 |
to grow. Moreover, in the last weeks of March
arbitrage opportunities to Singapore were limited
owing to abundant inventories in the region.
Emission Allowance Prices
In Q1, the average price of CO2 emission allowance
futures maturing in December 2016 was 21.5% lower
than in 2015. During the quarter, the average price
dropped from 6.9 €/t in January to 5.0 €/t in March.
CO2 Emission Allowance Prices
Average price (€/t) Q1
2016 Q1
2015 Change
CO2 December 2013 5.6 7.2 -21.5%
CO2 December 2014 5.7 7.3 -22.1%
One of the reasons for the price decline is the
general downturn in the oil and energy markets which
also influences natural gas. When the price of natural
gas whose carbon dioxide emissions are lower than
those of traditional fossil fuels decreases, its use for
energy production increases, which reduces demand
for CO2 emission allowances.
The carbon market was also influenced by the fact
that in February the EU countries allocated free
emission allowances, providing market players with
allowances for free emission of 535 million tonnes of
CO2. This was done to help the EU industrial
enterprises maintain their competitiveness in
comparison with companies operating in countries
with more lenient environmental requirements.
Electricity Prices
In Q1 2016, the average Nord Pool system price fell
by 14.7% (-4.1 €/MWh) compared to Q1 2015.
Electricity prices dropped in both the Nordic and the
Baltic price areas although in January exceptionally
cold weather raised electricity consumption to recent
years’ highest level. In February, demand for
electricity decreased due to warmer than usual
weather; in addition, the newly-launched NordBalt
undersea cable that connects the Lithuanian and
Swedish power systems began transmitting energy
even though it was still officially in the test phase. As
a result, in February the electricity price in Latvia and
Lithuania dropped to a historic low of 29.7 €/MWh.
Although in March prices in all Nord Pool market
areas rose, they still remained exceptionally low.
Electricity Prices on Nord Pool (NP) Electricity
Exchange
Average price (€/MWh) Q1
2016 Q1
2015 Change
System price 24.0 28.1 -14.7%
Finland 30.4 32.1 -5.2%
Estonia 31.8 32.5 -2.0%
Latvia 36.7 37.1 -1.1%
Lithuania 37.1 37.1 +0.0%
0
127
254
381
508
635
0
20
40
60
80
100
2014 2015 2016
€/t€/bbl
Liquid Fuels Prices
Brent crude (€/bbl) Fuel oil 1% (€/t)
-15
-12
-9
-6
-3
0
2014 2015 2016
€/bbl
Fuel Oil Crack Spread
Fuel oil 1% vs Brent crack spreadSource: Thomson Reuters
2014 2015 2016
0
2
4
6
8
10
Price for December 2016 futurePrice for December 2017 future
Source: Thomson Reuters
Prices of CO2 Emission Allowances, €/t

Eesti Energia Q1 2016 Interim Report, 1 January – 31 March | 9 |
In Q1, the level of the Nordic hydro resources was
substantially above that of a year ago and the
historical median (+10 percentage points).
In 2015, heavy precipitation and above-average
water quantities resulting from mountain snowmelt
raised the Nordic hydro resources to their recent
decades’ highest level. The high level of water stored
in the reservoirs by the end of last year is also
reflected in the figures for Q1 2016. In March, the
difference from Q1 2015 and the historical median
decreased.
In Q1 2016, the average Finnish electricity price
exceeded the Swedish one by 6.7 €/MWh (Q1 2015:
3.8 €/MWh). Similarly to previous periods, Finland’s
electricity production fell short of its domestic
consumption. In Q1, the average electricity price in
Estonia was 1.4 €/MWh higher than in Finland;
compared with the same time last year, the price gap
widened by 1.0 €/MWh.
In January 2016, cold weather increased the average
electricity price in the Estonian price area of the Nord
Pool power exchange to 37.6 €/MWh, the highest
level since October 2014 when the average price was
40.2 €/MWh. Exceptionally, in January the average
electricity price in Estonia was lower than the one in
Finland which was 37.8 €/MWh. Since 2013 when the
Estonian electricity market was fully opened, this has
occurred in five months. The difference is attributable
to strong electricity exports from Estonia to Finland,
which in January totalled 49.7 GWh, more than twice
the quantity supplied from Estonia to Finland in 2015
(24.5 GWh). From February, the price difference
between Estonia and Finland normalised and the
average electricity price in Estonia became higher
than in Finland: by 2.2 €/MWh in February and
2.3 €/MWh in March.
In Q1 2016, the average price gap between the
Estonian and Latvian price areas was 4.8 €/MWh
with the price higher in Latvia. Compared with a year
ago, the price gap widened by 0.2 €/MWh. In contrast
to January when the average electricity price in
Estonia was 12.4 €/MWh lower than in Latvia, since
February the prices have been similar. In February,
the NordBalt power link between Lithuania and
Sweden began operating in a stable mode, supplying
Lithuania, and through Lithuania also Latvia, with the
cheaper Swedish nuclear and hydro energy. Thanks
to warm weather, in February the Latvian and
Lithuanian electricity price dropped to 29.7 €/MWh, a
historic low for the area. In March, the NordBalt
power cable which was still in the test phase
continued to keep prices in the Latvian and
Lithuanian price areas low. In the middle of March,
there was a cable outage, which increased electricity
prices in both Latvia and Lithuania; the price in
Lithuania was further increased by the limitation of
transmission capacity between Latvia and Lithuania,
undertaken to prevent overload. In March, the
average electricity price in Latvia was 29.9 €/MWh
and in Lithuania 30.8 €/MWh.
020406080
100
1 6 11 16 21 26 31 36 41 46 51Historical median (1992-2014)Year 2015Year 2016 Source: Thomson Reuters
Week Levels of Nordic Water Reservoirs, % of Maximum
2014 2015 2016
0
25
50
75
NP Estonia NP Latvia
NP Finland NP system priceSource: Thomson Reuters
Monthly Average Electricity Prices, €/MWh

Eesti Energia Q1 2016 Interim Report, 1 January – 31 March | 10 |
In Q1, Eesti Energia’s clean dark spread (CDS) in the
NP Estonia electricity price was 5.4 €/MWh
(-0.3 €/MWh, -4.5% compared with a year ago)1. The
electricity price declined by 0.6 €/MWh, the impact of
the change in CO2 and oil shale costs was
+0.4 €/MWh mainly due to lower CO2 price.
1 CDS calculation methodology has been adjusted in Q1 2016 by
taking into account oil shale costs used in electricity wholesale bidding strategy
The Estonian and Latvian retail electricity markets
have been fully open since the beginning of 2013 and
2015 respectively, which means that there is free
competition and market prices apply. In Q1 2016, the
Lithuanian electricity market was partly open to
competition. All companies in Lithuania purchased
electricity from the open market but household
consumers did not have to do so. According to
estimates, in Q1 2016 around 71% of the Lithuanian
electricity market (in terms of consumption volume)
was open to competition.
36 3542 38 32 30 30 32 32
9 9 158 6 2 0.5 2 5
Q12014
Q2 Q3 Q4 Q12015
Q2 Q3 Q4 Q12016
NP Estonia CDSSource: Thomson Reuters, Eesti Energia
Eesti Energia Clean Dark Spread (CDS) in NP Estonia Electricity Price, €/MWh
2,4
2,0
1,9
0,8 Estonia's open market
Latvia's open market
Lithuania's open market
Regulated market inLithuania
Electricity Consumption in the Baltic Market in Q1 2016, TWh
Source: Eesti Energia estimate
89% of consumption
on openmarket
Eesti Energia Q1 2016 Interim Report, 1 January – 31 March | 11 |
Financial Results
Sales Revenues and EBITDA
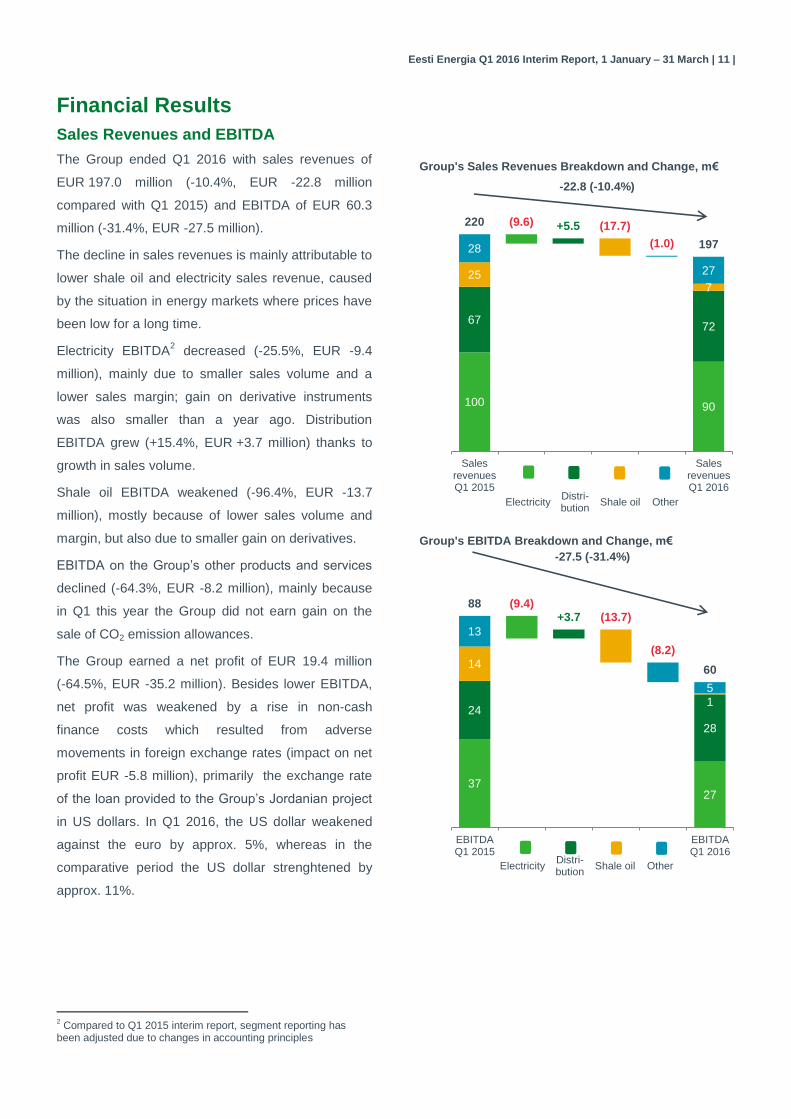
The Group ended Q1 2016 with sales revenues of
EUR 197.0 million (-10.4%, EUR -22.8 million
compared with Q1 2015) and EBITDA of EUR 60.3
million (-31.4%, EUR -27.5 million).
The decline in sales revenues is mainly attributable to
lower shale oil and electricity sales revenue, caused
by the situation in energy markets where prices have
been low for a long time.
Electricity EBITDA2 decreased (-25.5%, EUR -9.4
million), mainly due to smaller sales volume and a
lower sales margin; gain on derivative instruments
was also smaller than a year ago. Distribution
EBITDA grew (+15.4%, EUR +3.7 million) thanks to
growth in sales volume.
Shale oil EBITDA weakened (-96.4%, EUR -13.7
million), mostly because of lower sales volume and
margin, but also due to smaller gain on derivatives.
EBITDA on the Group’s other products and services
declined (-64.3%, EUR -8.2 million), mainly because
in Q1 this year the Group did not earn gain on the
sale of CO2 emission allowances.
The Group earned a net profit of EUR 19.4 million
(-64.5%, EUR -35.2 million). Besides lower EBITDA,
net profit was weakened by a rise in non-cash
finance costs which resulted from adverse
movements in foreign exchange rates (impact on net
profit EUR -5.8 million), primarily the exchange rate
of the loan provided to the Group’s Jordanian project
in US dollars. In Q1 2016, the US dollar weakened
against the euro by approx. 5%, whereas in the
comparative period the US dollar strenghtened by
approx. 11%.
2 Compared to Q1 2015 interim report, segment reporting has
been adjusted due to changes in accounting principles
100 90
6772
257
28
27
+5.5(9.6) (17.7)
(1.0)
220
197
0
50
100
150
200
250
SalesrevenuesQ1 2015
SalesrevenuesQ1 2016
Group's Sales Revenues Breakdown and Change, m€
-22.8 (-10.4%)
ElectricityDistri-bution
Shale oil Other
3727
24
28
14
1
13
5
+3.7(9.4)
(13.7)
(8.2)
88
60
-5
15
35
55
75
95
EBITDAQ1 2015
EBITDAQ1 2016
Group's EBITDA Breakdown and Change, m€
-27.5 (-31.4%)
ElectricityDistri-bution
Shale oil Other

Eesti Energia Q1 2016 Interim Report, 1 January – 31 March | 12 |
Electricity
Electricity sales revenue in Q1 2016 amounted to
EUR 90.4 million (-9.6%, EUR -9.6 million). In Q1
2016, Eesti Energia sold 2,016 GWh of electricity
(-7.8%, -171 GWh), retail sales accounting for
1,773 GWh (+13.9%, +217 GWh) and wholesale
sales for 243 GWh (-61.4%, -388 GWh) of the total.
The average sales price of electricity including gain
on derivative instruments (but excluding renewable
energy subsidies and municipal waste gate fees) was
42.7 €/MWh (-1.3%, -0.5 €/MWh). The average sales
price of electricity excluding gain on derivative
instruments (and subsidies and municipal waste gate
fees) was 41.7 €/MWh (+5.1%, +2.0 €/MWh). Gain
on derivative instruments accounted for 1.0 €/MWh
(-72.8%, -2.6 €/MWh) of the average sales price.
Total gain on derivative instruments amounted to
EUR 2.0 million (-75.0%, EUR -5.8 million).
In the wholesale segment, electricity sales volume
contracted due to changes in the Group’s electricity
pricing strategy as well as low market prices
(electricity price in the Estonian price area of the
Nord Pool power exchange was 2% lower than a
year ago). In the retail segment, sales volumes in
Latvia and Lithuania grew primarily through stronger
sales in the large customer segment and in Estonia
because of cold winter weather at the beginning of
the year.
In Estonia, retail sales of electricity amounted to
1,327 GWh (+9.1%, +111.2 GWh). In terms of
customers’ electricity consumption volume, in Q1
2016 Eesti Energia’s market share in Estonia was
60% (-2 percentage points compared with Q1 2015)3.
Market share decline is related to changes in large
customer segment.
At 1 April 2016, Estonian customers purchased
electricity from Eesti Energia at around 456,000
consumption points, a decrease of around 1,000
during the quarter, mostly due to shrinkage in the
number of residential customers. Universal service
was consumed at around 102,600 consumption
points, 900 less than at the beginning of Q1.
In Latvia and Lithuania, the Group operates under the
Enefit brand. As Eesti Energia does not own
3 According to the Estonian TSO Elering
43.332.5
42.731.8
0
25
50
75
Average electricitysales price*
NP Estoniaaverage electricity
price
Q1 2015 Q1 2016
-0.6 (-2.0%)-0.5 (-1.3%)Average Sales Price, €/MWh
95 86
100 90
0
Q1 2015 Q1 2016
Subsidies and waste gate fees
Sales revenues (excl. subsidies andwaste gate fees)
-9.6 (-9.6%)Electricity Sales Revenue, m€
1.6 1.8
0.6 0.2
2.2 2.0
0
1
2
3
4
Q1 2015 Q1 2016
Retail sales Wholesale sales
-0.2 (-7.8%)Electricity Sales Volume, GWh
* Total average sales price of electricity product (including retail sales, wholesale sales and gain on derivatives).Average sales price excludes subsidies for renewable energy and municipal waste gate fees
46%
% of sales revenues
45%
% of EBITDA
Share of electricity product in Group's sales revenues and EBITDA

Eesti Energia Q1 2016 Interim Report, 1 January – 31 March | 13 |
substantial generation capacities in Latvia and
Lithuania it must buy electricity from the power
exchange in order to meet its sales commitments. In
Q1 2016, prices in the Estonian and the Latvian and
Lithuanian price areas remained divergent (on
average, the Latvian exchange price was 4.8 €/MWh
higher than the Estonian one). Due to the price
difference, in Q1 2016 Eesti Energia incurred border
crossing expenses of EUR 2.2 million (+9.2%,
EUR +0.2 million). In Q1 2016, open market retail
sales in Latvia and Lithuania totalled 446.4 GWh
(+30.9%, +105.4 GWh). In Q1 2016, Eesti Energia’s
market shares in Latvia and Lithuania were 15% and
6% respectively, up 3 percentage points and 2
percentage points on Q1 2015 respectively. In both
countries, the Group’s market share has grown
mainly through the addition of new customers, which
has also increased sales volumes. At the end of Q1
2016, Latvian and Lithuanian customers purchased
electricity from Eesti Energia at approx. 17,800
consumption points, an increase of around 700
(+4%) during the quarter.
The Group’s total market share in the Baltic retail
electricity market rose to 27%, 1 percentage point up
year over year.
In Q1 2016, the Group generated 2,175 GWh of
electricity (-5.3%, -121 GWh). Electricity production
decreased because the pricing strategy of electricity
sold to the power exchange changed and market
prices were low. However, in Q1 2016 the Group
generated more electricity in hours when the market
prices were higher, taking maximum advantage of
the peak time sales potential.
In Q1 2016, electricity generated from renewable
sources amounted to 83.7 GWh (-13.2%, -12.7
GWh). Around half of it was produced at wind farms
(43.8 GWh, -41.3%, -30.8 GWh). Wind energy output
declined due to less favourable wind conditions.
Production of renewable energy from biodegradable
waste and biofuels grew by 19.2 GWh (+100.7%).
Electricity output eligible to renewable energy and
efficient cogeneration subsidies totalled 79.1 GWh
(-23.5%, -24.3 GWh). Renewable energy and
efficient cogeneration subsidies received by the
Group totalled EUR 3.9 million (-22.8%, EUR -1.1
million).
Key Figures of Electricity Product
Q1 2016 Q1 2015
Return on fixed assets* % 6.9 11.4
Electricity EBITDA €/MWh 13.5 16.7
* Excluding impairment of generation assets in December 2013 and 2015
Electricity EBITDA for Q1 2016 was EUR 27.3
million, decreaseing 25.5% or EUR -9.4 million year-
on-year.
The impact of margin change was EUR -4.3 million
(-2.1 €/MWh). Average electricity sales revenue grew
by 1.7 €/MWh (impact on EBITDA EUR +3.5 million).
The average sales price of electricity excluding
renewable energy subsidies and municipal waste
gate fees (and gain on derivative instruments) grew
by 2.0 €/MWh; subsidies decreased by 0.4 €/MWh.
Higher variable costs lowered EBITDA by EUR 7.8
million. Variable costs grew mostly through a rise in
CO2 emission charges, brought about by growth in
the average price.
The decrease in electricity sales volume (-8%)
lowered EBITDA by EUR 4.3 million.
The change in fixed costs improved electricity
EBITDA by EUR 4.0 million. The main contributors
were lower repair and labour costs (+3.1 million and
+4.3 million respectively). The impact of the fixed
cost component which is linked to inventory change
was EUR -3.7 million.
36.6
27.3+4.0
+1.1
(4.3)(4.3) (5.8)
0
10
20
30
40
50
EBITDAQ1 2015
Marginimpact
onEBITDA
Volumeimpact
onEBITDA
Changein
fixedcosts
Gain onderivatives
Other EBITDAQ1 2016
Electricity EBITDA Development, m€
-9.4 (-25.5%)

Eesti Energia Q1 2016 Interim Report, 1 January – 31 March | 14 |
Realised gain on derivative instruments decreased by
EUR 5.8 million year over year.
Other impacts on electricity EBITDA (EUR +1.1
million in total) resulted mainly from the following: the
value of derivative instruments changed (impact EUR
+1.4 million), in the comparative period the Group
reduced the provisions made for the Latvian and
Lithuanian electricity portfolios (impact EUR -0.6
million) and in Q1 2016 the Group recognised a
smaller amount of environmental protection
provisions (impact EUR +0.3 million).

Eesti Energia Q1 2016 Interim Report, 1 January – 31 March | 15 |
Distribution
Distribution sales revenue for Q1 2016 was
EUR 72.1 million (+8.2%, EUR +5.5 million) and
distribution sales volume amounted to 1,941 GWh
(+8.5%, +152.4 GWh). The growth in sales volume is
mainly attributable to the weather in January which
was, on average, colder than in the previous year.
Network losses totalled 89.6 GWh or 4.3% (Q1 2015:
104.0 GWh or 5.3%). Network losses have
decreased through more accurate measuring
achieved by the installation of smart and balance
meters, and more effective monitoring of
consumption along with the detection of illegal and
unmetered consumption.
In Q1 016, the average distribution tariff was
37.1 €/MWh (-0.3%, -0.1 €/MWh).
The average duration of unplanned interruptions was
27 minutes (Q1 2015: 30.5 minutes) and the average
duration of planned interruptions was 20 minutes (Q1
2015: 17 minutes). The latter indicator increased
because in the reporting period the Group replaced
more bare conductors with insulated overhead cables
and installed more balance meters than a year ago.
Outages of the low-voltage network can be reduced
by replacing regular overhead lines with weather-
proof cables. In addition, the number of network
interruptions is strongly influenced by weather
conditions.
Key Figures of Distribution Product
Q1 2016 Q1 2015
Return on fixed assets % 6.9 6.7
Distribution losses GWh 89.6 104.0
SAIFI index 0.35 0.36
SAIDI (unplanned) index 27.0 30.5
SAIDI (planned) index 20.0 17.0
Adjusted RAB mln € 729.2 690.5
37.2 37.1
05
10152025303540
-0.1 (-0.3%)
Average Distribution Tariff, €/MWh
67 72
0
20
40
60
80
Q1 2015 Q1 2016
+5.5 (+8.2%)
Distributon Sales Revenue, m€
1.8 1.9
0
3
+0.2 (+8.5%)
Distribution Volume, TWh
37%
% of sales revenues
46%
% of EBITDA
Share of distribution product in Group's sales revenues and EBITDA

Eesti Energia Q1 2016 Interim Report, 1 January – 31 March | 16 |
Distribution EBITDA for Q1 2016 amounted to
EUR 28.0 million, increasing 15.4% or EUR +3.7
million year-on-year.
Distribution margin remained more or less at the
same level as in Q1 2015, its impact on distribution
EBITDA was EUR +0.1 million (+0.1 €/MWh).
Distribution sales volume grew by 9%, its impact on
EBITDA was EUR +3.1 million.
The impact of a change in fixed costs was EUR +0.5
million, mostly because the head office costs which
are allocated to the distribution segment decreased.
24.228.0
+0.1 +3.1 +0.5
0
10
20
30
40
50
EBITDAQ1 2015
Marginimpact
onEBITDA
Volumeimpact
onEBITDA
Change infixed costs
EBITDAQ1 2016
Distribution EBITDA Development, m€
+3.7 (+15.4%)

Eesti Energia Q1 2016 Interim Report, 1 January – 31 March | 17 |
Shale Oil
Shale oil sales revenue in Q1 2016 amounted to
EUR 7.0 million (-71.5%, EUR -17.7 million). In Q1
2016, Eesti Energia sold 34.2 thousand tonnes of
shale oil (-51.0%, -35.5 thousand tonnes). Sales
volume decreased in connection with the low world
market prices of oil; due to unattractive market prices
it was more reasonable to increase shale oil
inventories.
Shale oil sales revenue declined because both sales
volume and the average sales price decreased. In Q1
2016, the average sales price of shale oil was
206.1 €/t (-41.9%, -148.3 €/t). The average sales
price was supported by gain on derivative
instruments of 68.6 €/t (-45.1 €/t), EUR 2.3 million in
total (-70.4%, EUR -5.6 million). Excluding the impact
of derivative instruments, the average sales price of
shale oil declined to 137.5 €/t (-42.9%, -103.2 €/t)
which is less compared to the world market price of
the reference product, heavy fuel oil (fell by 124 €/t
year over year). The decrease in the average price of
shale oil was also counterbalanced by the sale of
shale oil gasoline at a price higher than in the
comparative period.
The Group’s shale oil output for Q1 2016 was 66.5
thousand tonnes (-21.5%, -18.2 thousand tonnes).
The output of the new Enefit280 oil plant grew to 38.2
thousand tonnes (+35.4%, +10.0 thousand tonnes)
through an increase in load and operational reliability.
The output of the Enefit140 oil plant decreased year
over year (-49.9%, -28.2 thousand tonnes), mostly
due to maintenance works brought forward into Q1
2016.
Key Performance Indicators of Shale Oil Product
Q1 2016 Q1 2015
Return on fixed assets % 4.1 27.3
Shale oil EBITDA €/t 15.2 204.6
Shale oil EBITDA for Q1 2016 was EUR 0.5 million,
decreasing 96.4% or EUR -13.7 million year-on-year.
354
250206
127
050
100150200250300350400
Average shale oilsales price
Average price ofheavy fuel oil
(1%)
-124.0 (-49.5%)-148.3 (-41.9%)
Average Shale Oil Sales Price, €/t
24.7
7.0
05
1015202530
Q1 2015 Q1 2016
-17.7 (-71.5%)
Shale Oil Sales Revenue, m€
70
34
01020304050607080
-35.5 (-51.0%)
Shale Oil Sales Volume, '000 tonnes
14.3
0.5
+2.9
(3.6)(4.5)
(5.6)
(3.0)
0
EBITDAQ1 2015
Marginimpact
onEBITDA
Volumeimpact
onEBITDA
Changein
fixedcosts
Gain onderivatives
Other EBITDAQ1 2016
Shale Oil EBITDA Development, m€
-13.7 (-96.4%)
4%
% of sales revenues
1%
% of EBITDA
Share of shale oil product in Group's sales revenues and EBITDA
Eesti Energia Q1 2016 Interim Report, 1 January – 31 March | 18 |
Margin decrease had a EUR -3.6 million (-105 €/t)
impact on EBITDA. The average sales price declined
by 103 €/t, which had a EUR -3.5 million impact on
EBITDA. Higher variable costs lowered EBITDA by
EUR 0.1 million.
The decrease in sales volume had an impact of
EUR -4.5 million; sales volume fell by 51%.
The impact of a change in fixed costs was EUR +2.9
million, resulting mainly from the fixed cost
component which is linked to inventory change.
Gain on shale oil derivatives decreased by EUR 5.6
million year over year.
Other impacts on shale oil EBITDA were EUR -3.0
million, consisting mostly of a change in the value of
derivative instruments (impact EUR -3.1 million)and
the recognition of smaller environmental protection
provisions (impact EUR +0.1 million).

Eesti Energia Q1 2016 Interim Report, 1 January – 31 March | 19 |
Other Products and Services
Sales revenues from other products and services
totalled EUR 27.4 million (-3.4%, EUR -1.0 million) in
Q1 2016.
EBITDA on other products and services amounted
to EUR 4.5 million (-64.3%, EUR -8.2 million).
Heat sales volume grew by 19.3% (+89.0 GWh) and
heat sales revenue increased by EUR 0.6 million
(+3.1%). Heat EBITDA grew by EUR 1.3 million, fuel
costs decreased considerably.
Revenue from sales of natural gas declined by
EUR 1.5 million (-26.1%) due to a decrease in the
average sales price (-38%) even though sales
volume increased (+19%). The fall in the sales price
of gas is mainly attributable to the downtrend in the
market price of oil because in Eastern Europe the
sales prices of natural gas are generally linked to the
oil price.
Impact of sale of surplus CO2 emission allowances in
Q1 2015 was EUR -8.3 million, other impacts on
EBITDA totalled EUR -1.2 million.
19 20
6 4
2 2
28 27
05
1015202530
Q1 2015 Q1 2016
Other sales
Technology Industries'products sales revenue
Sales of natural gas
Sales of heat
Sales Revenues From Other Products and Services, m€
-1.0 (-3.4%)
12.7
4.5
+1.3 (8.3)
(1.2)
0
5
10
15
20
OtherEBITDAQ1 2015
Heat CO2emission
allowances
Other OtherEBITDAQ1 2016
Other Products and Services EBITDA Development, m€
-8.2 (-64.3%)
14%
% of sales revenues
8%
% of EBITDA
Share of other products and services in Group's sales revenues and EBITDA
Eesti Energia Q1 2016 Interim Report, 1 January – 31 March | 20 |
Cash Flows
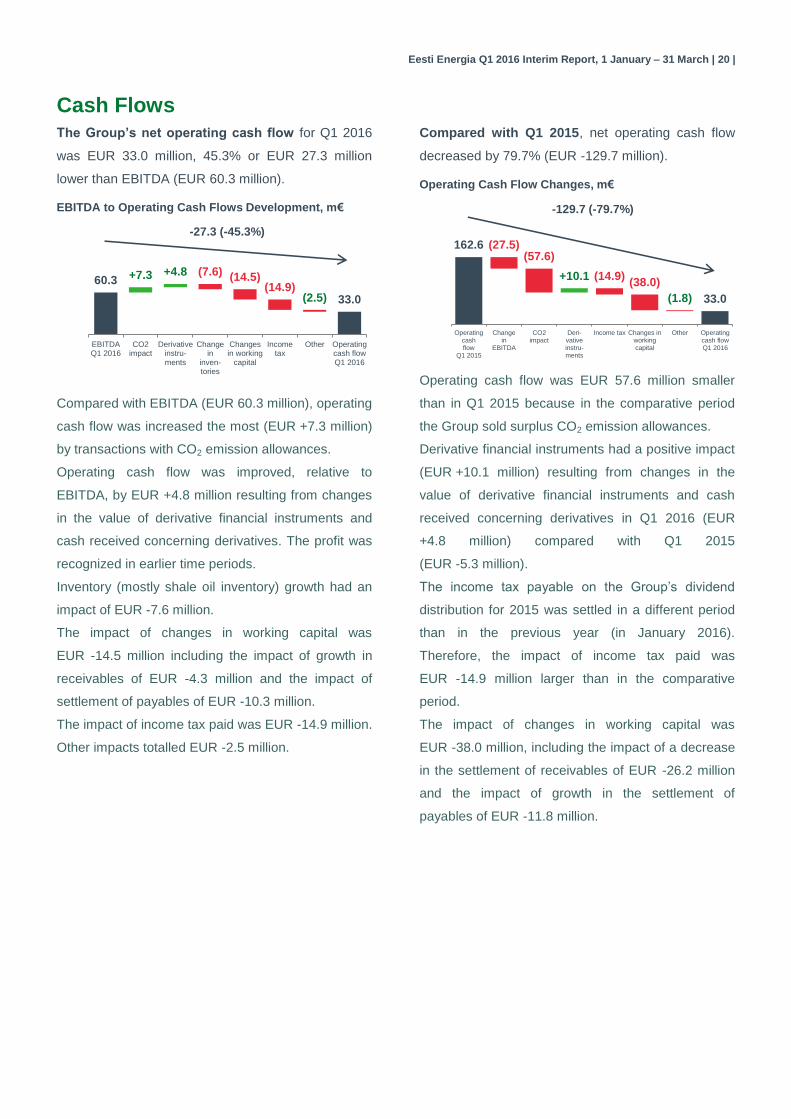
The Group’s net operating cash flow for Q1 2016
was EUR 33.0 million, 45.3% or EUR 27.3 million
lower than EBITDA (EUR 60.3 million).
Compared with EBITDA (EUR 60.3 million), operating
cash flow was increased the most (EUR +7.3 million)
by transactions with CO2 emission allowances.
Operating cash flow was improved, relative to
EBITDA, by EUR +4.8 million resulting from changes
in the value of derivative financial instruments and
cash received concerning derivatives. The profit was
recognized in earlier time periods.
Inventory (mostly shale oil inventory) growth had an
impact of EUR -7.6 million.
The impact of changes in working capital was
EUR -14.5 million including the impact of growth in
receivables of EUR -4.3 million and the impact of
settlement of payables of EUR -10.3 million.
The impact of income tax paid was EUR -14.9 million.
Other impacts totalled EUR -2.5 million.
Compared with Q1 2015, net operating cash flow
decreased by 79.7% (EUR -129.7 million).
Operating cash flow was EUR 57.6 million smaller
than in Q1 2015 because in the comparative period
the Group sold surplus CO2 emission allowances.
Derivative financial instruments had a positive impact
(EUR +10.1 million) resulting from changes in the
value of derivative financial instruments and cash
received concerning derivatives in Q1 2016 (EUR
+4.8 million) compared with Q1 2015
(EUR -5.3 million).
The income tax payable on the Group’s dividend
distribution for 2015 was settled in a different period
than in the previous year (in January 2016).
Therefore, the impact of income tax paid was
EUR -14.9 million larger than in the comparative
period.
The impact of changes in working capital was
EUR -38.0 million, including the impact of a decrease
in the settlement of receivables of EUR -26.2 million
and the impact of growth in the settlement of
payables of EUR -11.8 million.
60.3
33.0
+7.3 +4.8
(2.5)
(7.6) (14.5)(14.9)
0
50
100
150
EBITDAQ1 2016
CO2impact
Derivativeinstru-ments
Changein
inven-tories
Changesin working
capital
Incometax
Other Operatingcash flowQ1 2016
EBITDA to Operating Cash Flows Development, m€
-27.3 (-45.3%)162.6
33.0
+10.1
(1.8)
(27.5)(57.6)
(14.9)(38.0)
0
100
200
300
Operatingcashflow
Q1 2015
Changein
EBITDA
CO2impact
Deri-vativeinstru-ments
Income tax Changes inworkingcapital
Other Operatingcash flowQ1 2016
Operating Cash Flow Changes, m€
-129.7 (-79.7%)

Eesti Energia Q1 2016 Interim Report, 1 January – 31 March | 21 |
Investment
In Q1 2016, the Group’s investments totalled
EUR 31.7 million (-39.5%, EUR -20.7 million).
Investments decreased mostly in connection with the
Auvere power plant project coming to completion
(-80.6%, EUR -5.3 million). Maintenance and repair
investments (excl. distribution) totalled EUR 4.0
million (-61.1%, EUR -6.3 million), decreasing mostly
at mining (EUR -4.3 million) and Narva power plants
(EUR -2.1 million) subsidiaries. In Q1 2016, the
largest capital investments were made in the
distribution network in an amount of EUR 17.7 million
(+7.1%, EUR +1.2 million).
* Actual capex impacted by monthly clearing of costs related to commissioning (mainly by electricity sales revenues)
Construction of the 300 MW Power Plant in
Auvere
In summer 2011, Eesti Energia started to build a
modern circulating fluidised bed (CFB) power plant in
Auvere. The new plant can use biofuel alongside oil
shale (to the extent of 50%), which helps reduce its
emissions to the level of a contemporary gas-fired
plant. The maximum annual net generation of the
Auvere power plant is 2.2 TWh. As support for its
construction, the European Commission permitted
Estonia to allocate to Eesti Energia 17.7 million
tonnes of free CO2 emission allowances for the
period 2013-2020. Of this amount, 5 million tonnes
was received in April 2014, 4.3 million tonnes in April
2015 and 3.6 million tonnes in April 2016.
Tests of the generating unit continued until February
2016. In March, the generating unit was shut down
for around a month to improve the efficiency of
electrostatic precipitators. The down time was also
used for other work such as maintenance and
adjustment of the cleaning systems of the boiler’s
heating surfaces.
The tests required for the delivery and acceptance of
the Auvere power plant will continue in April. The
power plant is expected to be taken into commercial
use in Q2 2016, when all tests have been completed.
The total budgeted cost of the project (including the
fuel feeding system) is EUR 638 million. By the end
of Q1 2016, EUR 567 million (89%) of this had been
invested.
17 18
7
10
4
66
6
5
52
32
0
25
50
75
Q12015
Q12016
Longwall mining
DeNOx equipment
Capitalised interest
Other developm. projects
Maintenance investments
Auvere 300 MW power plant
Electricity network
Capex Breakdown by Projects, m€
-20.7 (-39.6%)
28
7
19
22
3
1
3
52
32
0
10
20
30
40
50
60
Q12015
Q12016
Other
Shale oil
Distribution
Electricity
Investment Breakdown by Products, m€
-20.7 (-39.6%)
567 71
4
15
638
Until end Q1 2016 Future
Deadline
Q2 2016Auvere power
plant*
Main Ongoing Projects, m€
Construction of stacks
Electrostatic precipitators
Q2 2016
Q2 2016

Eesti Energia Q1 2016 Interim Report, 1 January – 31 March | 22 |
Reduction of NOx Emissions at Eesti Power Plant
The EU Industrial Emissions Directive that took effect
in January 2011 provides that starting from 2016 the
concentrations of nitrogen oxides (NOx) in the waste
gases released by large combustion plants may not
exceed 200 mg/Nm3. In 2013, one boiler of the Eesti
power plant was supplied with a NOx capture
(DeNOx) system which reduced its NOx emissions
almost two-fold, bringing them in compliance with the
new limit. In 2014, the Group decided to equip
another seven boilers of four generating units with
DeNOx systems. In the same year, work was
completed on the second boiler of generating unit 3
and both boilers of generating unit 6 were supplied
with DeNOx systems.
In 2015, generating unit 6 was successfully adjusted
and unit 5 was supplied with DeNOx systems.
Testing of the systems installed to generating unit 4
began in November and was completed in January
2016.
The project completed in Q1 2016 and today the
DeNOx systems of the four generating are already in
commercial use. The total cost of the project was
EUR 22 million.
Improvement of Network Quality
In Q1 2016, investments in maintaining and
improving the quality of the distribution network
totalled EUR 17.7 million compared with EUR 16.5
million in Q1 2015. During the quarter, 48 substations
and 421 kilometres of network cables were built (46
substations and 290 kilometres of network in Q1
2015).
In 2013-2016, distribution network operator Elektrilevi
will install remote reading meters at all consumption
points in Estonia. Implementation of the remote
reading system, which releases the consumer from
the obligation to submit the reading, is required by
law. In the future, the system can also be used to
determine network quality and profile loads more
accurately.
In Q1 2016, 38 thousand remote reading meters
were installed and 47 thousand meters were
switched over to the remote reading system as part
of the remote reading project. By the end of the
quarter, 536 thousand new hourly smart meters had
been installed and 87% of the meters had been
switched over to the remote reading system in the
framework of the remote reading project. Meters with
remote reading capability accounted for 85% of all of
Elektrilevi’s power meters.
Implementation of Longwall Mining
Eesti Energia is implementing longwall mining at its
Estonia mine. Under the longwall technology, the
costs of oil shale mining are lower than under the
previously applied room-and-pillar technology
because road way construction volumes are smaller.
The method is similar to conventional room-and-pillar
mining where pillars support the overlying strata but
mining takes place along a long work face that may
extend to 700 metres in place of the conventional 200
metres. Preparations for the project began in 2014.
The longwall mining project is running on schedule.
In Q1, two feeder-crushers and an underground
loader machine were delivered. According to plan,
project-related work will be completed in 2016.
Production operations under the new technology
started up in January 2016 and full capacity should
be achieved at the beginning of 2017 when the
additional oil shale output should amount to
approximately 0.8 million tonnes per year. The total
cost of the project is EUR 21 million. By the end of
Q1 2016, EUR 18.2 million (87%) of this had been
invested.
Preliminary Development of Electricity and Shale
Oil Projects in Jordan
Eesti Energia owns 65% of its electricity and shale oil
production projects in Jordan. The Group’s project
partners are YTL Power International Berhad from
Malaysia with a 30% interest and Near East
Investment from Jordan with a 5% interest.
Eesti Energia Q1 2016 Interim Report, 1 January – 31 March | 23 |
In January 2016, the Group and its partners signed
financing agreements of USD 1.623 billion with
Chinese banks. The guarantee to be provided to the
loan must also be approved by the Chinese ministry
of finance. In Q1 2016, the main focus of the project’s
development activities was on meeting the
preliminary requirements imposed by the financing
agreements of the electricity project. For successful
completion of the project, it is necessary to obtain
various permits, sign different agreements and meet
other requirements. Among other things, the project
partners completed the negotiations and signed a
subcontracting agreement for the mine.
The planned net capacity of the first Jordanian oil
shale power plant which is scheduled for completion
in 2019 is 470 MW.
The Group is planning to sell most of its stake in the
Jordanian electricity project in 2016.
The plan for the preliminary development of the oil
project will be reviewed in more detail when the
electricity project’s financing activities have been
completed.
Preliminary Development of the US Shale Oil
Production Project
In March 2011, Eesti Energia acquired an oil shale
resource in Uintah County, Utah (USA), which is
currently estimated to contain 6 billion (metric) tonnes
of oil shale (based on “best” in-place estimate)4. In
Utah, Eesti Energia operates under the name of
Enefit American Oil.
By March 2016, the Environmental Impact Statement
required for the project had received all the
necessary approvals from the US Bureau of Land
Management and in April it was published in the
Federal Register. Public hearings for the discussion
of the statement are expected to be completed in
June.
4 Measured resource 3.5 billion (metric) tonnes, indicated resource
2.3 billion tonnes, and inferred resource 0.2 billion tonnes of oil shale.

Eesti Energia Q1 2016 Interim Report, 1 January – 31 March | 24 |
Financing
Eesti Energia’s main sources of debt capital are the
international bond market and investment loans from
the European Investment Bank (EIB). In addition,
liquidity loan and guarantee facilities have been
obtained from regional banks.
At the end of Q1 2016, the total nominal value of the
Group’s borrowings was EUR 1,017.8 million (at the
end of 2015: EUR 1,018.5 million). The amortised
cost of borrowings was EUR 952.9 million (at the end
of 2015: EUR 951.8 million). At the reporting date,
long-term borrowings comprised Eurobonds listed on
the London Stock Exchange with a nominal value of
EUR 758.3 million and loans from the EIB with a
nominal value of EUR 259.5 million.
In Q1, the Group made EIB loan repayments of
EUR 0.7 million in line with the agreed schedule.
There were no other changes in borrowings.
At the end of Q1 2016, the Group’s liquid assets
stood at EUR 160.8 million. In addition, the Group
had available undrawn loans of EUR 220 million. The
figure comprises bilateral revolving credit facilities of
EUR 150 million in aggregate, signed with two
regional banks (SEB and Pohjola), which will mature
in July 2020, and a long-term loan agreement signed
with EIB in the amount of EUR 70 million.
At the end of Q1 2016, the weighted average interest
rate of Eesti Energia’s borrowings was 2.92%, i.e. the
same as at the end of 2015. The Group has
predominantly locked the risk resulting from
fluctuations in the base interest rate (for 82% of
borrowings the base interest rate is locked until
maturity, for 13% until July 2016 and 5% of
borrowings have floating rates). All borrowings are
denominated in euros.
At the end of Q1 2016, the Group’s credit ratings
were at the level of BBB (Standard & Poor’s) and
Baa2 (Moody’s). In February 2016, rating agency
Moody’s announced that it was going to review the
rating due to low energy prices and in April it
downgraded Eesti Energia’s credit rating to Baa3
(stable outlook). In February, rating agency Standard
& Poor’s also announced that for similar reasons it
had changed the outlook of Eesti Energia’s credit
rating from stable to negative.
The Group’s net debt as at the end of Q1 2016
amounted to EUR 792.1 million (EUR +0.1 million
compared to the end of 2015) and net debt to
EBITDA ratio was 3.3 (3.0 at the end of 2015). The
objective of Eesti Energia’s financing policy is to
maintain the net debt to EBITDA ratio below 3.5.
Under its loan agreements, Eesti Energia has
undertaken to comply with certain financial
covenants. At the end of Q1 2016, the Group’s
financial indicators complied with all contractual
covenants.
Net Debt to EBITDA Ratio and Financial Leverage
152 106
500
19 19
17164
12448 18
518
12 12 120
150
300
450
600
750
'16 '17 '18 '19 '20 '21 '22 '23 '24 '25 '26
EIB Eurobond
Debt Maturity, m€
159.8 160.8+33.0 (31.2)
(0.7)
0
100
200
300
Liquid assets12/31/2015
Operatingcashflow
Investmentcashflow*
Otherfinancing
cashflow
Liquid assets03/31/2016
Liquidity Development in Q1 2016, m€
* excl. changes in deposits and other financial assets
+1.1 (+0.7%)
2.33.0
3.3
30%34% 33%
0%
8%
16%
24%
32%
40%
0
1
2
3
4
5
Q1 2015 Q4 2015 Q1 2016
Net debt/EBITDA Financial leverage (right sc.)
Net Debt/EBITDA, times Financial Leverage, %
Eesti Energia Q1 2016 Interim Report, 1 January – 31 March | 25 |
Outlook for FY 2016
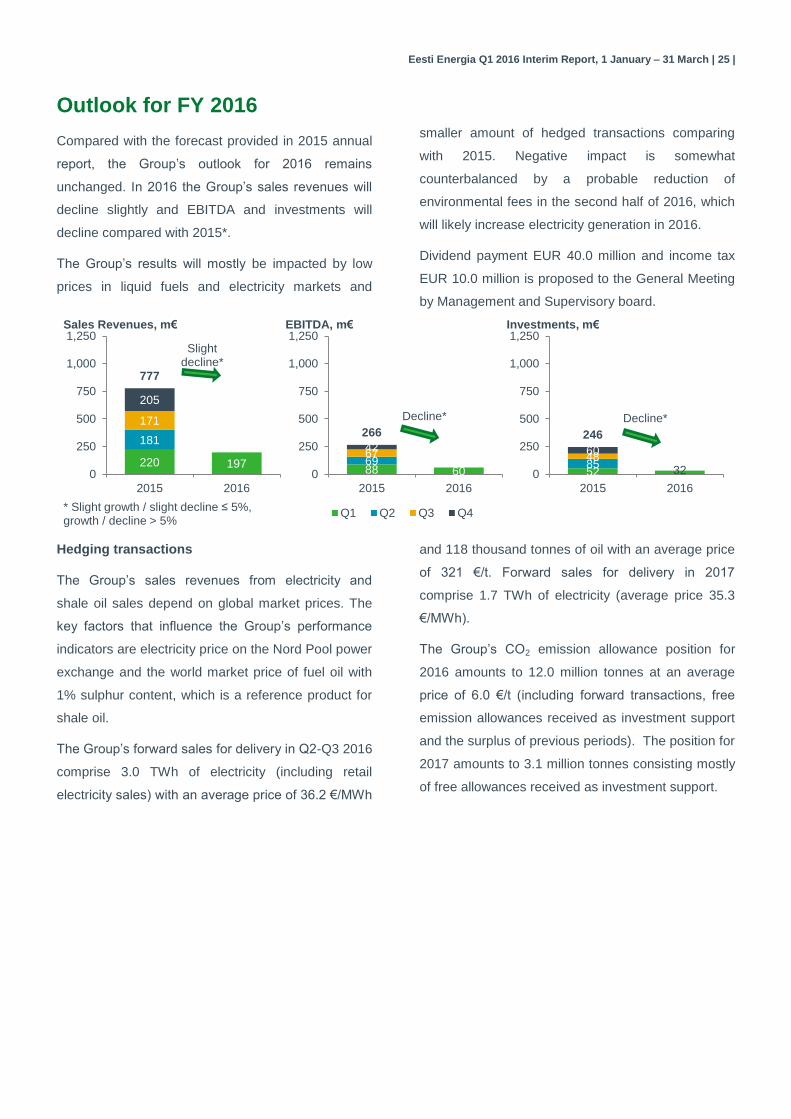
Compared with the forecast provided in 2015 annual
report, the Group’s outlook for 2016 remains
unchanged. In 2016 the Group’s sales revenues will
decline slightly and EBITDA and investments will
decline compared with 2015*.
The Group’s results will mostly be impacted by low
prices in liquid fuels and electricity markets and
smaller amount of hedged transactions comparing
with 2015. Negative impact is somewhat
counterbalanced by a probable reduction of
environmental fees in the second half of 2016, which
will likely increase electricity generation in 2016.
Dividend payment EUR 40.0 million and income tax
EUR 10.0 million is proposed to the General Meeting
by Management and Supervisory board.
Hedging transactions
The Group’s sales revenues from electricity and
shale oil sales depend on global market prices. The
key factors that influence the Group’s performance
indicators are electricity price on the Nord Pool power
exchange and the world market price of fuel oil with
1% sulphur content, which is a reference product for
shale oil.
The Group’s forward sales for delivery in Q2-Q3 2016
comprise 3.0 TWh of electricity (including retail
electricity sales) with an average price of 36.2 €/MWh
and 118 thousand tonnes of oil with an average price
of 321 €/t. Forward sales for delivery in 2017
comprise 1.7 TWh of electricity (average price 35.3
€/MWh).
The Group’s CO2 emission allowance position for
2016 amounts to 12.0 million tonnes at an average
price of 6.0 €/t (including forward transactions, free
emission allowances received as investment support
and the surplus of previous periods). The position for
2017 amounts to 3.1 million tonnes consisting mostly
of free allowances received as investment support.
220 197
181
171
205
777
0
250
500
750
1,000
1,250
2015 2016
Slightdecline*
Sales Revenues, m€
88 60696742
266
0
250
500
750
1,000
1,250
2015 2016
Q1 Q2 Q3 Q4
Decline*
EBITDA, m€
52 32854860
246
0
250
500
750
1,000
1,250
2015 2016
Decline*
Investments, m€
* Slight growth / slight decline ≤ 5%, growth / decline > 5%

Eesti Energia Q1 2016 Interim Report, 1 January – 31 March | 26 |
Condensed Consolidated Interim Income Statement and Statement of Comprehensive Income
CONDENSED CONSOLIDATED INTERIM INCOME STATEMENT 3 months 12 months Note
in million EUR 1 January - 31
March 1 April - 31
March
2016 2015 2015/16 2014/15
Revenue 197.0 219.8 753.9 873.3 3
Other operating income 4.8 6.5 14.5 25.9
Government grants 0.1 - 0.4 0.3
Change in inventories of finished goods and work-in-progress 5.2 4.1 29.1 (3.4)
Raw materials and consumables used (95.9) (90.7) (331.8) (364.0)
Payroll expenses (33.3) (34.9) (138.0) (142.8)
Depreciation, amortisation and impairment (35.3) (35.0) (208.8) (129.7)
Other operating expenses (17.6) (17.0) (90.0) (72.6)
OPERATING PROFIT 25.0 52.8 29.3 187.0
Financial income 0.1 1.4 4.9 4.9
Financial expenses (5.6) 0.5 (16.6) (2.8)
Net financial income (expense) (5.5) 1.9 (11.7) 2.1
Profit from associates using equity method (0.1) - 2.5 (2.4)
PROFIT BEFORE TAX 19.4 54.7 20.1 186.7
CORPORATE INCOME TAX EXPENSE - - (14.9) (23.7)
PROFIT FOR THE PERIOD 19.4 54.7 5.2 163.0
Equity holder of the Parent Company 19.3 54.8 5.0 163.3
Non-controlling interest 0.1 (0.1) 0.2 (0.3)
Basic earnings per share (euros) 0.03 0.09 0.01 0.26 8
Diluted earnings per share (euros) 0.03 0.09 0.01 0.26 8
CONDENSED CONSOLIDATED STATEMENT OF COMPREHENSIVE INCOME
3 months 12 months
in million EUR 1 January - 31
March 1 April - 31
March
2016 2015 2015/16 2014/15
PROFIT FOR THE PERIOD 19.4 54.7 5.2 163.0
Other comprehensive income
Items that may be reclassified subsequently to profit or loss:
Revaluation of hedging instruments (0.7) (17.4) (13.5) (28.0)
Currency translation differences attributable to foreign subsidiaries (1.0) 6.0 (1.7) 10.7
Other comprehensive income for the period (1.7) (11.4) (15.2) (17.3)
TOTAL COMPREHENSIVE INCOME FOR THE PERIOD 17.7 43.3 (10.0) 145.7
Equity holder of the Parent Company 17.6 43.4 (10.2) 146.0
Non-controlling interest 0.1 (0.1) 0.2 (0.3)

Eesti Energia Q1 2016 Interim Report, 1 January – 31 March | 27 |
Condensed Consolidated Interim Statement of Financial Position
in million EUR 31 March 31 December Note
ASSETS 2016 2015 2015
Non-current assets
Property, plant and equipment 2,470.9 2,426.6 2,473.9 5
Intangible assets 39.3 70.3 41.1
Investments in associates 2.5 2.0 4.6
Derivative financial instruments - 1.2 - 6
Long-term receivables 34.4 37.5 32.9
Total non-current assets 2,547.1 2,537.6 2,552.5
Current assets
Inventories 79.5 46.7 71.9
Greenhouse gas allowances 33.5 74.0 33.5
Trade and other receivables 107.7 98.5 99.8
Derivative financial instruments 25.4 61.2 40.3 6
Deposits not recognised as cash equivalents - 144.0 -
Cash and cash equivalents 160.8 62.5 159.8
Total current assets 406.9 486.9 405.3
Total assets 2,954.0 3,024.5 2,957.8 3
EQUITY
Capital and reserves attributable to equity holder of the Parent Company
Share capital 621.6 621.6 621.6 7
Share premium 259.8 259.8 259.8
Statutory reserve capital 62.1 59.0 62.1
Hedge reserve 16.1 29.6 16.8
Unrealised exchange rate differences 10.0 11.7 11.0
Retained earnings 618.8 678.8 599.5
Total equity and reserves attributable to equity holder of the Parent Company
1,588.4 1,660.5 1,570.8
Non-controlling interest 1.2 1.0 1.1
Total equity 1,589.6 1,661.5 1,571.9
LIABILITIES
Non-current liabilities
Borrowings 933.6 927.3 932.5 9
Other payables 1.1 2.0 1.2
Derivate financial instruments - 1.8 - 6
Deferred income 172.5 163.1 171.4
Provisions 31.3 32.5 31.0 11
Total non-current liabilities 1,138.5 1,126.7 1,136.1
Current liabilities
Borrowings 19.3 6.9 19.3 9
Trade and other payables 142.5 161.8 179.0
Derivative financial instruments 12.1 0.9 11.8 6
Provisions 52.0 66.7 39.7 11
Total current liabilities 225.9 236.3 249.8
Total liabilities 1,364.4 1,363.0 1,385.9
Total liabilities and equity 2,954.0 3,024.5 2,957.8

Eesti Energia Q1 2016 Interim Report, 1 January – 31 March | 28 |
Condensed Consolidated Interim Statement of Cash Flows
3 months 12 months Note
in million EUR 1 January - 31 March 1 April - 31 March
2016 2015 2015/16 2014/15
Cash flows from operating activities
Cash generated from operations 47.9 162.7 236.3 394.6 10
Interest and loan fees paid (0.1) (0.1) (44.0) (37.3)
Interest received 0.1 - 0.5 0.7
Corporate income tax paid (14.9) - (14.9) (23.5)
Net cash generated from operating activities 33.0 162.6 177.9 334.5
Cash flows from investing activities
Purchase of property, plant and equipment and intangible assets
(39.6) (62.2) (202.3) (233.7)
Proceeds from connection and other fees 2.7 2.7 14.1 11.6
Proceeds from sale of property, plant and equipment 0.3 0.8 2.5 2.4
Net change in deposits not recognised as cash equivalents - (104.0) 144.0 (7.0)
Net change in cash with limited usage 4.8 4.3 1.1 (0.2)
Loans granted (1.5) - (4.4) (5.0) 12
Dividends received from long-term financial investments 2.0 - 3.9 1.7
Proceeds from disposal of subsidiary - - - 4.7
Proceeds from repurchase of shares and liquidation of associate
- - - 11.6
Net cash used in investing activities (31.3) (158.4) (41.1) (213.9)
Cash flows from financing activities
Received long-term loans - - 30.4 0.5
Repayments of bank loans (0.7) (0.7) (6.9) (1.4)
Repayments of other loans - - (0.1) (0.1)
Acquisition of non-controlling interest in a subsidiary - (1.2) - (1.2)
Dividends paid - - (61.9) (93.6)
Net cash used in financing activities (0.7) (1.9) (38.5) (95.8)
Net cash flows 1.0 2.3 98.3 24.8
Cash and cash equivalents at the beginning of the period 159.8 60.2 62.5 37.7
Cash and cash equivalents at the end of the period 160.8 62.5 160.8 62.5
Net increase/(-)decrease in cash and cash equivalents 1.0 2.3 98.3 24.8

Eesti Energia Q1 2016 Interim Report, 1 January – 31 March | 29 |
Condensed Consolidated Interim Statement of Changes in Equity
in million EUR
Attributable to equity holder of the Parent Company Non-
control-ling inte-rest
Total
Share capi-
tal (Note
7)
Share pre-
mium
Statu-tory legal
reserve
Other re-
serves
Retained
earnings
Total
Equity as at 31 December 2014 621.6 259.8 59.0 52.7 624.0 1,617.1 2.3 1,619.4
Profit for the period - - - - 54.8 54.8 (0.1) 54.7
Other comprehensive income for the period - - - (11.4) - (11.4) - (11.4)
Total comprehensive income for the period
- - - (11.4) 54.8 43.4 (0.1) 43.3
Acquisition of non-controlling interest of subsidiary
- - - - - - (1.2) (1.2)
Total transactions with owners of the company, recognised directly in equity
- - - - - - (1.2) (1.2)
Equity as at 31 March 2015 621.6 259.8 59.0 41.3 678.8 1,660.5 1.0 1,661.5
Equity as at 31 December 2015 621.6 259.8 62.1 27.8 599.5 1,570.8 1.1 1,571.9
Profit for the period - - - - 19.3 19.3 0.1 19.4
Other comprehensive income for the period - - - (1.7) - (1.7) - (1.7)
Total comprehensive income for the period
- - - (1.7) 19.3 17.6 0.1 17.7
Total transactions with owners of the company, recognised directly in equity
- - - - - - - -
Equity as at 31 March 2016 621.6 259.8 62.1 26.1 618.8 1,588.4 1.2 1,589.6

Eesti Energia Q1 2016 Interim Report, 1 January – 31 March | 30 |
Notes to the Condensed Interim Consolidated Financial Statements
1. Accounting Policies
These condensed consolidated interim financial
statements have been prepared in accordance with
International Financial Reporting
Standards (IFRS) and International Financial
Reporting Interpretations Committee (IFRIC)
interpretations as adopted by the European Union.
These consolidated interim condensed financial
statements are prepared in accordance with IAS
34 "Interim Financial Reporting". The consolidated
condensed interim financial statements should be
read in conjunction with the annual financial
statements for the year ended 31 December 2015,
which have been prepared in accordance with IFRSs
as adopted by the EU.
Accounting policies and presentation of financial
statements applied to this interim report were
consistent with Athose used in financial statements
for the financial year that ended on 31 December
2015.
New International Financial Reporting Standards,
amendments to previously published standards and
International Financial Reporting Interpretations
Committee interpretations that became mandatory for
the Group from 1 January 2016 did not have any
impact on the Group's accounting policies and
financial statements.
The preparation of interim financial statements
requires management to make judgements,
estimates and assumptions that affect the application
of accounting policies and the reported amounts of
assets and liabilities, income and expense. Actual
results may differ from these estimates. In preparing
these condensed consolidated interim financial
statements, the significant judgements made by
management in applying the Group’s accounting
policies and the key sources of estimation uncertainty
were the same as those that applied to the
consolidated financial statements for the year ended
31 December 2015.
According to the Management Board the interim
report prepared for the period 1 January 2016 - 31
March 2016 presents a true and fair view of the
financial position, the cash flows and the results of
operations of Eesti Energia AS and its subsidiaries
(Group).
The information contained in the interim financial
statements has not been audited or otherwise verified
by auditors.
Eesti Energia Q1 2016 Interim Report, 1 January – 31 March | 31 |
2. Financial Risk Management
2.1. Financial Risk Factors
The Group’s activities expose it to a variety of
financial risks: market risk (including currency risk,
fair value interest rate risk, cash flow interest rate
risk and price risk), credit risk and liquidity risk. The
condensed interim financial statements do not
include all financial risk management information and
disclosures required in the annual financial
statements; they should be read in conjunction with
the Group's annual financial statements as at 31
December 2015. There have been no material
changes in any risk management policies compared
to the previous year end.
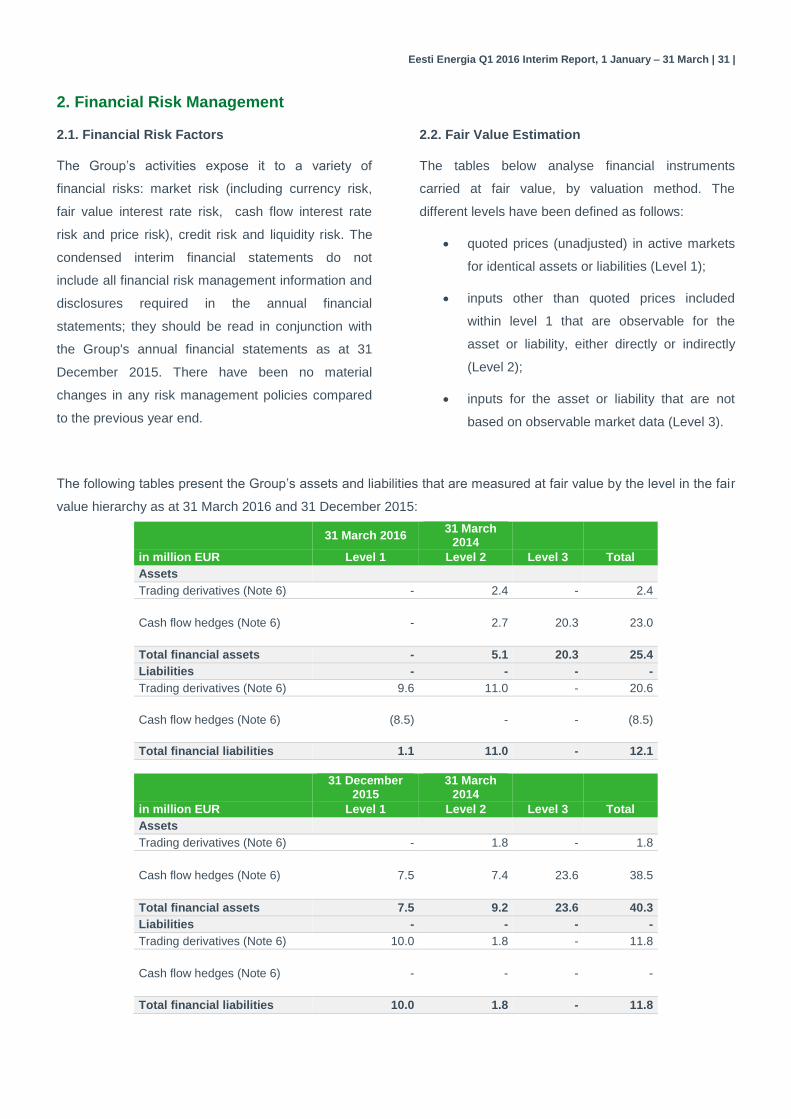
2.2. Fair Value Estimation
The tables below analyse financial instruments
carried at fair value, by valuation method. The
different levels have been defined as follows:
quoted prices (unadjusted) in active markets
for identical assets or liabilities (Level 1);
inputs other than quoted prices included
within level 1 that are observable for the
asset or liability, either directly or indirectly
(Level 2);
inputs for the asset or liability that are not
based on observable market data (Level 3).
The following tables present the Group’s assets and liabilities that are measured at fair value by the level in the fair
value hierarchy as at 31 March 2016 and 31 December 2015:
31 March 2016 31 March
2014
in million EUR Level 1 Level 2 Level 3 Total
Assets
Trading derivatives (Note 6) - 2.4 - 2.4
Cash flow hedges (Note 6) - 2.7 20.3 23.0
Total financial assets - 5.1 20.3 25.4
Liabilities - - - -
Trading derivatives (Note 6) 9.6 11.0 - 20.6
Cash flow hedges (Note 6) (8.5) - - (8.5)
Total financial liabilities 1.1 11.0 - 12.1
31 December
2015 31 March
2014
in million EUR Level 1 Level 2 Level 3 Total
Assets
Trading derivatives (Note 6) - 1.8 - 1.8
Cash flow hedges (Note 6) 7.5 7.4 23.6 38.5
Total financial assets 7.5 9.2 23.6 40.3
Liabilities - - - -
Trading derivatives (Note 6) 10.0 1.8 - 11.8
Cash flow hedges (Note 6) - - - -
Total financial liabilities 10.0 1.8 - 11.8

Eesti Energia Q1 2016 Interim Report, 1 January – 31 March | 32 |
2. Financial Risk Management, cont.
2.2. Fair Value Estimation, cont.
Valuation techniques and inputs used on
measurement in level 1
The fair value of financial instruments traded in active
markets is based on quoted market prices at the
balance sheet date. A market is regarded as active if
quoted prices are readily and regularly available from
an exchange, dealer, broker, industry group, pricing
service, or regulatory agency, and those prices
represent actual and regularly occurring market
transactions on an arm’s length basis. The quoted
market price used for financial assets held by the
Group is the current bid price. In level 1 are classified
the Group’s electricity derivatives that have been
cleared in Nasdaq OMX.
Valuation techniques and inputs used on
measurement in level 2
The fair value of financial instruments that are not
traded in an active market is determined using
valuation techniques. These valuation techniques
maximise the use of observable market data where it
is available and rely as little as possible on entity
specific estimates. An instrument is included in level
2 if all the significant inputs required to establish the
fair value of the instrument are observable. If one or
more significant inputs are not based on observable
market data, an instrument is included in level 3. The
value of trading derivatives and cash flow hedges are
found using notations of Nasdaq OMX, ICE, Platt’s
European Marketscan and Nymex.
The fair value of forward, swap and future
contracts is determined using forward prices
at the balance sheet date, with the resulting
value discounted back to present value.
Valuation techniques and inputs used on
measurement in level 3
All instruments in Level 3 are options. The fair value
of options is found using analytical solution of
Turnbull-Wakeman Asian-type option pricing, inputs
for which include the futures price, the strike price,
volatility of the underlying, the risk free interest rate,
time to maturity, time to the beginning of average
period, the already realised average futures price
during the average period.
The following table represents the changes in Level 3
instruments for the period 1 January – 31 March
2016:
in million EUR Cash flow
hedges Total
Opening balance at 1 January 2016 23.6 23.6
Gains(+) and losses(-) recognised in profit or loss 2.9 2.9
Gains(+) and losses(-) recognised in other comprehensive income (1.4) (1.4)
Settlements (receipts-/payments+) (4.8) (4.8)
Closing balance at 31 March 2016 20.3 20.3
Total gains(+) or losses(-) for the period included in profit or loss for assets held at the end of the reporting period under “Other operating income/expenses”
0.9 0.9
Change in unrealised gains(+) or losses(-) for the period included in profit or loss for assets held at the end of the reporting period - -

Eesti Energia Q1 2016 Interim Report, 1 January – 31 March | 33 |
2. Financial Risk Management, cont.
2.3. Fair Value of Financial Assets and Liabilities Measured at Amortised Cost
The fair value of bonds and bank loans:
in million EUR 31 March 31 December
2016 2015
Nominal value of bonds 758.3 758.3
Market value of bonds on the basis of quoted sales price 795.1 789.7
Nominal value of bank loans with fixed interest rate 210.4 210.4
Fair value of bank loans with fixed interest rate 222.2 223.1
Nominal value of bank loans with floating interest rate 49.1 49.8
Fair value of bank loans with floating interest rate 49.1 49.8
The bonds are denominated in euros and listed on the London Stock Exchange. The fair value of the bonds is
based on the input that is within level 1 of the fair value hierarchy; the fair value of bank loans with fixed interest
rate is based on the cash flows discounted using input that is within level 3 of the fair value hierarchy.
Management estimates that the fair value of the loans with a floating interest rate at the end of reporting and
comparative period does not differ from their carrying amounts as the risk margins have not changed.
Other financial assets and liabilities of which fair value is approximate to their carrying amount:
Trade and other receivables
Deposits not recognised as cash equivalents
Cash and cash equivalents
Trade and other payables
Eesti Energia Q1 2016 Interim Report, 1 January – 31 March | 34 |
3. Segment Reporting
For the purposes of monitoring the Group's
performance and making management decisions, the
Management Board uses product-based reporting.
The Group has determined main products and
services, i.e. value-creating units that
generateexternal revenues and profit, and has built
up a methodology of allocation of revenues and
expenses, and assets to the products.
The Group has distinguished three main products
and services, which are presented as separately
reportable segments, and a number of minor
products and services that are presented together as
"Other segments”:
1. Electricity (production and sale of electricity
generated from renewable and non-
renewable sources, and electricity trading);
2. Distribution (sale of electricity distribution
network services on regulated market);
3. Shale oil (production and sale of liquid fuels);
4. Other segments (including production and
sale of heat, sale of oil-shale, construction of
electrical network, power engineering
equipment and services, sale of old metal,
ash of oil-shale, other products and
services).
Other segments include co-products which individual
share of the Group's revenue and EBITDA is
immaterial. Non of these co-products meet the
quantitative thresholds that would require reporting
separate information.
Segment revenues include revenues from external
customers only, generated by the sale of respective
products or services.
All operating expenses of the Group are allocated to
the products and services to which they relate. If a
product (eg electricity) is created by several Group
entities in a vertically integrated chain, then the
related expenses include the production cost of each
entity involved in preparation of the product (eg the
cost of electricity includes the cost of oil shale used
for its production). Group overheads are allocated to
products and services proportionally to the services
provided.
The Management Board assesses the performance
of the segments primarily based on EBITDA and it
also monitors operating profit. Finance income and
expenses, and income tax are not allocated to the
segments.
The Group's assets are allocated to the segments
based on the same proportion as the related
expenses. Liabilities are not allocated to the
segments as they are managed centrally by the
Group’s finance department.
As the segments are based on externally sellable
products and services (as opposed to legal entities),
there are no transactions between segments to be
eliminated.
For Distribution segment, the sales prices need to be
approved by the Estonian Competition Authority as
stipulated by the Electricity Market Act of Estonia.
The Estonian Competition Authority has an
established methodology for approving the prices that
considers the costs necessary to fulfil the legal
obligations and ensures justified profitability on
invested capital. Generally, the Estonian Competition
Authority considers the annual average carrying
amount of non-current assets plus 5% of external
sales revenue as invested capital. The rate for
justified profitability is the Company's weighted
average cost of capital (WACC). The sales prices for
all other segments are not regulated by the law.

Eesti Energia Q1 2016 Interim Report, 1 January – 31 March | 35 |
3. Segment Reporting, cont.
Revenue
The revenue from external customers reported to the management board of the Parent Company is measured in
a manner consistent with that in the consolidated income statement.
in million EUR 1 January - 31 March 1 January - 31 March
2016 2015
Revenue from external
customers
Revenue from external
customers*
Electricity 90.4 100.1
Distribution 72.1 66.6
Shale oil 7.0 24.7
Other 27.4 28.4
Total 197.0 219.8
EBITDA
in million EUR 1 January - 31 March 1 January - 31 March
2016 2015
EBITDA EBITDA*
Electricity 27.3 36.6
Distribution 28.0 24.2
Shale oil 0.5 14.3
Other 4.5 12.7
Total 60.3 87.8
Depreciation and amortisation (35.3) (35.0)
Net financial income (expense) (5.5) 1.9
Profit from associates using equity method (0.1) -
Profit before tax 19.4 54.7
ASSETS
in million EUR 31 March 2016 31 December 2015
Assets Assets
Electricity 1,219.4 1,236.1
Distribution 978.7 968.8
Shale oil 357.7 360.4
Other 398.3 392.5
Total 2,954.0 2,957.8
* In connection with the adjustment of the methodology the comparative figures have been changed compared to the data disclosed
in the interim report as at 31 March 2015
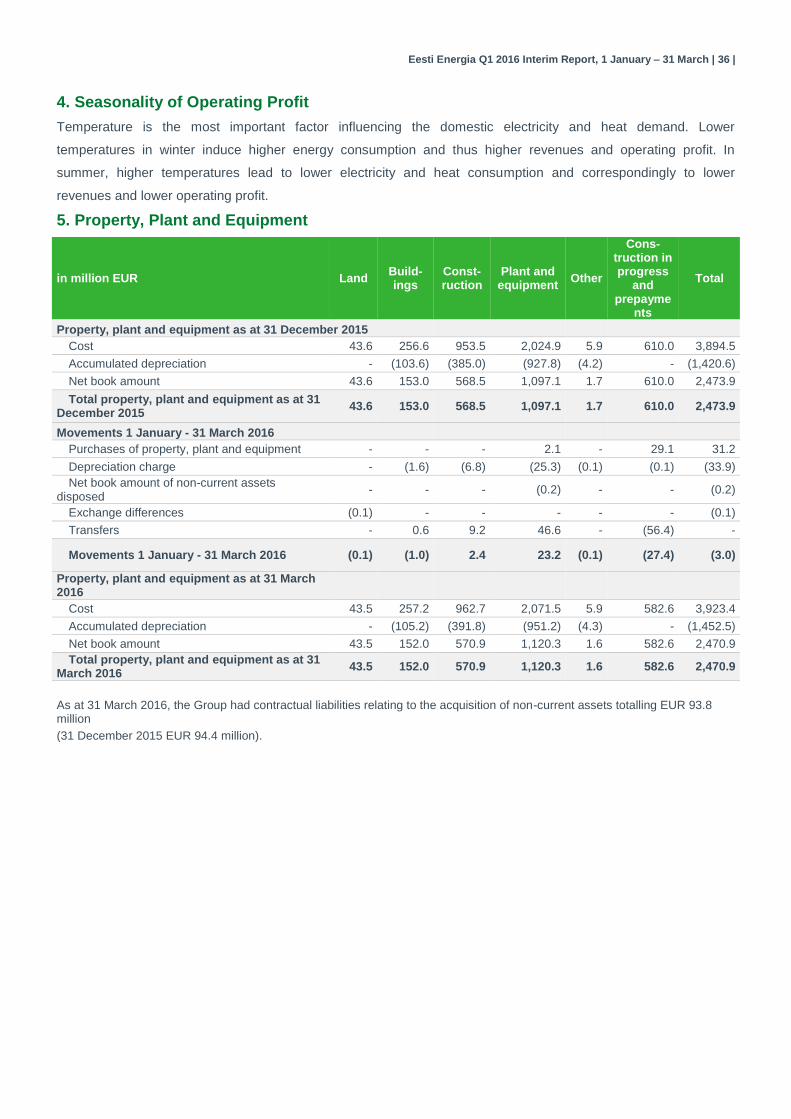
Eesti Energia Q1 2016 Interim Report, 1 January – 31 March | 36 |
4. Seasonality of Operating Profit
Temperature is the most important factor influencing the domestic electricity and heat demand. Lower
temperatures in winter induce higher energy consumption and thus higher revenues and operating profit. In
summer, higher temperatures lead to lower electricity and heat consumption and correspondingly to lower
revenues and lower operating profit.
5. Property, Plant and Equipment
in million EUR Land Build-ings
Const-ruction
Plant and equipment
Other
Cons-truction in progress
and prepayme
nts
Total
Property, plant and equipment as at 31 December 2015
Cost 43.6 256.6 953.5 2,024.9 5.9 610.0 3,894.5
Accumulated depreciation - (103.6) (385.0) (927.8) (4.2) - (1,420.6)
Net book amount 43.6 153.0 568.5 1,097.1 1.7 610.0 2,473.9
Total property, plant and equipment as at 31 December 2015
43.6 153.0 568.5 1,097.1 1.7 610.0 2,473.9
Movements 1 January - 31 March 2016
Purchases of property, plant and equipment - - - 2.1 - 29.1 31.2
Depreciation charge - (1.6) (6.8) (25.3) (0.1) (0.1) (33.9)
Net book amount of non-current assets disposed
- - - (0.2) - - (0.2)
Exchange differences (0.1) - - - - - (0.1)
Transfers - 0.6 9.2 46.6 - (56.4) -
Movements 1 January - 31 March 2016 (0.1) (1.0) 2.4 23.2 (0.1) (27.4) (3.0)
Property, plant and equipment as at 31 March 2016
Cost 43.5 257.2 962.7 2,071.5 5.9 582.6 3,923.4
Accumulated depreciation - (105.2) (391.8) (951.2) (4.3) - (1,452.5)
Net book amount 43.5 152.0 570.9 1,120.3 1.6 582.6 2,470.9
Total property, plant and equipment as at 31 March 2016
43.5 152.0 570.9 1,120.3 1.6 582.6 2,470.9
As at 31 March 2016, the Group had contractual liabilities relating to the acquisition of non-current assets totalling EUR 93.8 million
(31 December 2015 EUR 94.4 million).
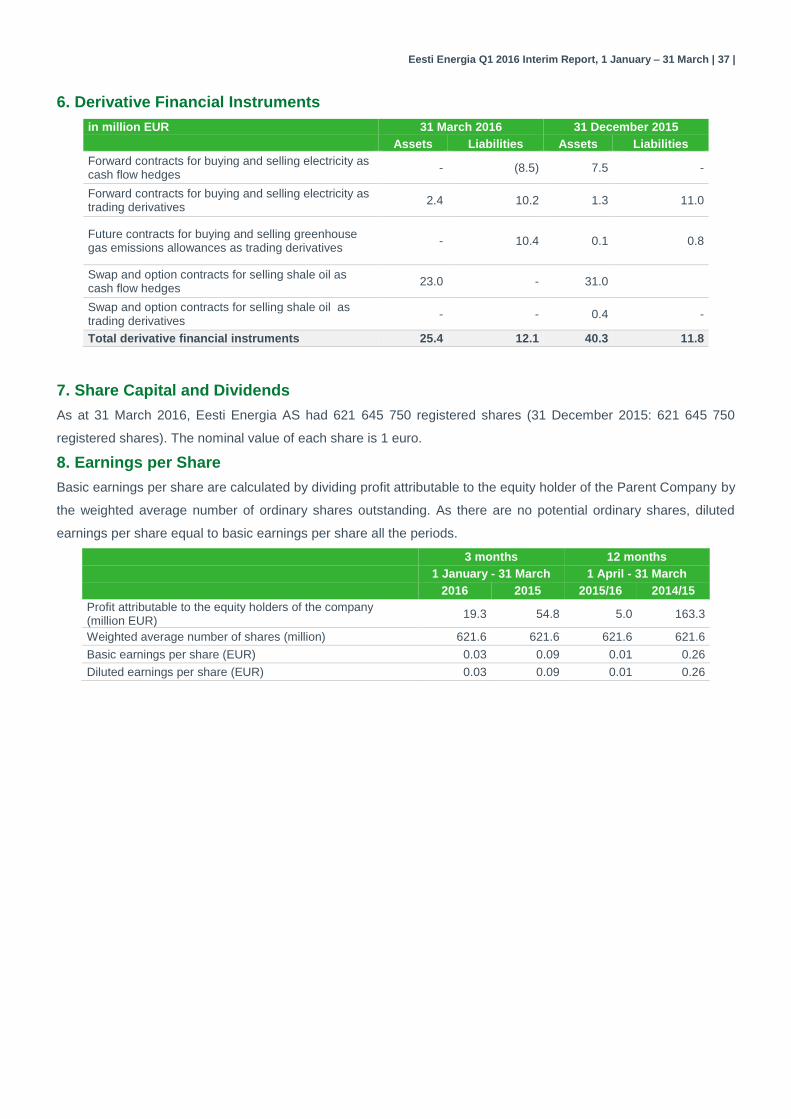
Eesti Energia Q1 2016 Interim Report, 1 January – 31 March | 37 |
6. Derivative Financial Instruments
in million EUR 31 March 2016 31 December 2015
Assets Liabilities Assets Liabilities
Forward contracts for buying and selling electricity as cash flow hedges
- (8.5) 7.5 -
Forward contracts for buying and selling electricity as trading derivatives
2.4 10.2 1.3 11.0
Future contracts for buying and selling greenhouse gas emissions allowances as trading derivatives
- 10.4 0.1 0.8
Swap and option contracts for selling shale oil as cash flow hedges
23.0 - 31.0
Swap and option contracts for selling shale oil as trading derivatives
- - 0.4 -
Total derivative financial instruments 25.4 12.1 40.3 11.8
7. Share Capital and Dividends
As at 31 March 2016, Eesti Energia AS had 621 645 750 registered shares (31 December 2015: 621 645 750
registered shares). The nominal value of each share is 1 euro.
8. Earnings per Share
Basic earnings per share are calculated by dividing profit attributable to the equity holder of the Parent Company by
the weighted average number of ordinary shares outstanding. As there are no potential ordinary shares, diluted
earnings per share equal to basic earnings per share all the periods.
3 months 12 months
1 January - 31 March 1 April - 31 March
2016 2015 2015/16 2014/15
Profit attributable to the equity holders of the company (million EUR)
19.3 54.8 5.0 163.3
Weighted average number of shares (million) 621.6 621.6 621.6 621.6
Basic earnings per share (EUR) 0.03 0.09 0.01 0.26
Diluted earnings per share (EUR) 0.03 0.09 0.01 0.26

Eesti Energia Q1 2016 Interim Report, 1 January – 31 March | 38 |
9. Nominal Value and Amortised Cost of Borrowings
in million EUR
31 March 2016 31 December 2015
Nominal value
Amortised cost
Nominal value
Amortised cost
Short- term borrowings
Current portion of long-term bank loans 19.3 19.3 19.3 19.3
Total short-term borrowings 19.3 19.3 19.3 19.3
Long- term borrowings
Bank loans 240.2 240.0 240.9 240.6
Bonds issued 758.3 693.6 758.3 691.9
Total long- term borrowings 998.5 933.6 999.2 932.5
Total borrowings 1,017.8 952.9 1,018.5 951.8
As at 31 March 2016 the Group had undrawn loan
facilities of EUR 220.0 million (31 December 2015:
EUR 220.0 million), the figure includes bilateral
liquidity loan agreements with floating interest rate of
EUR 150 million in aggregate, with SEB and Pohjola
bank contracted in July 2015, which will mature in
five years (July 2020).
In October 2013 the Group contracted investment
loan agreement with EIB of EUR 100.0 million. The
loan can be taken into use until October 2016 and as
of 31 March 2016 EUR 30.0 million had been drawn.
The interest rate will be agreed when the loan is
taken into use.

Eesti Energia Q1 2016 Interim Report, 1 January – 31 March | 39 |
10. Cash Generated From Operations
in million EUR
3 months 12 months
1 January - 31 March 1 April - 31 March
2016 2015 2015/16 2014/15
Profit before tax 19.4 54.7 20.1 186.7
Adjustments
Depreciation and impairment of property, plant and equipment 33.9 33.7 203.3 124.0
Amortisation of intangible assets 1.4 1.3 5.5 5.7
Deferred income from connection and other service fees (1.7) (1.6) (6.6) (6.2)
Gain on disposal of subsidiaries - - - (3.4)
Gain on disposal of property, plant and equipment (0.2) (0.4) (1.4) (1.3)
Amortisation of government grant received to purchase non-current assets
(0.1) (0.1) (0.3) (0.2)
Profit/loss from associates using equity method 0.1 - (2.5) 2.4
Unpaid/unsettled gain/loss on derivatives 14.5 (2.2) 32.9 (27.9)
Loss from doubtful loan receivables - - 11.0 -
Foreign exchange gain/loss from lending in foreign currency 1.5 (4.1) 1.8 (7.3)
Interest expense on borrowings 3.7 3.4 13.2 9.0
Interest and other financial income (0.1) (1.4) (4.9) (4.9)
Adjusted net profit before tax 72.4 83.3 272.1 276.6
Net change in current assets relating to operating activities
Change in receivables related to operating activities 3.5 16.3 2.8 4.1
Change in inventories (7.6) (5.9) (32.8) 0.9
Net change in other current assets relating to operating activities (17.7) 75.9 24.6 114.7
Total net change in current assets relating to operating activities (21.8) 86.3 (5.4) 119.7
Net change in current liabilities relating to operating activities
Change in provisions 12.4 (7.2) (17.0) (15.6)
Change in trade payables (6.9) 1.1 (7.7) 10.7
Net change in liabilities relating to other operating activities (8.2) (0.8) (5.7) 3.2
Total net change in liabilities relating to operating activities (2.7) (6.9) (30.4) (1.7)
Cash generated from operations 47.9 162.7 236.3 394.6

Eesti Energia Q1 2016 Interim Report, 1 January – 31 March | 40 |
11. Provisions
Opening Recognition Interest Use Closing balance
balance and reversal charge 31 March 2016
in million EUR 31 December of Short-term Long-term
2015 provisions provision provision
Environmental protection provisions 28.3 0.1 0.2 (0.7) 5.2 22.7
Provision for termination of mining operations 0.7 - - - - 0.7
Employee related provisions 6.6 - - (1.0) 1.1 4.5
Provision for dismantling cost of assets 3.3 - 0.1 - - 3.4
Provision for greenhouse gas emissions 28.3 13.7 - - 42.0 -
Provision for obligations arising from treaties 3.5 0.2 - - 3.7 -
Total provisions 70.7 14.0 0.3 (1.7) 52.0 31.3

Eesti Energia Q1 2016 Interim Report, 1 January – 31 March | 41 |
12. Related Party Transactions
The sole shareholder of Eesti Energia AS is the Republic of Estonia. In preparing the Group's financial statements,
the related parties include associates, members of the management and supervisory boards of the parent
company, and other companies over which these persons have significant influence.
Related parties also include entities under the control or significant influence of the state.
in million EUR 1 January - 31 March
2016 2015
Transactions with associates
Purchase of goods and services 4.4 5.8
Proceeds from sale of goods and services 0.2 0.3
Financial income - 1.3
Loans granted 1.5 -
in million EUR
31 March 2016 31 December 2015
Receivables from associates and payables to associates
Receivables 43.8 44.2
incl long-term loan receivables 43.6 42.5
Allowance for doubtful loan receivables (11.0) (11.0)
Payables 4.1 4.8
incl long-term payables 1.1 1.1
Upon premature termination of the service contract with a member of the Management Board, the service
contracts stipulate the payment of 3 months' remuneration as termination benefits. During the period 1 January - 31
March 2016 remuneration to management and supervisory boards amounted to EUR 0.6 million.
In purchasing and selling network services, the prices set by the Estonian Competition Authority are used. All
othertransactions are concluded using agreed prices.
The sales of electricity, network services and heat to the entities over which the state has control or significant
influence have been taken place under normal business activity. The Group has performed in the reporting and
comparative period purchase and sales transactions in the material amounts with Elering AS, which is fully state-
owned enterprise.
in million EUR 1 January - 31 March
2016 2015
Transactions with Elering AS Group
Purchase of goods and services 31.3 29.7
Purchase of property, plant and equpiment and prepayments 0.1 0.2
Sale of goods and services (incl. renewable energy grant) 5.6 6.8
Sale of property, plant and equipment - 0.4
in million EUR
31 March 2016 31 December 2015
Receivables from Elering AS and payables to Elering AS
Receivables 2.0 3.4
Payables 18.5 18.4

Eesti Energia Q1 2016 Interim Report, 1 January – 31 March | 42 |
13. Effects of Changes in Condensed Consolidated Interim Income Statement
In the current interim report the sales revenue of greenhouse gas allowances and the cost of the allowances sold
are presented in net amount which is different from the presentation in the interim report of 2015 Q1. Because of
that some reclassifications have been made retrospectively between the the income statement' lines. The
information about the changes is disclosed in the table below:
CONDENSED CONSOLIDATED INTERIM INCOME STATEMENT 3 months
in million EUR 1 January - 31 March
2015
changed before difference
Other operating income 6.5 69.9 (63.4)
Raw materials and consumables used (90.7) (154.1) 63.4
CONDENSED CONSOLIDATED INTERIM INCOME STATEMENT 12 kuud
in million EUR 1 April - 31 March
2014/15
changed before difference
Other operating income 25.9 89.3 (63.4)
Raw materials and consumables used (364.0) (427.4) 63.4

Eesti Energia Q1 2016 Interim Report, 1 January – 31 March | 43 |
Glossary
1 MWh – 1 megawatt hour. The unit of energy generated (or
consumed) in one hour by a device operating at a constant power
of 1 MW (megawatt).
1,000,000 MWh = 1,000 GWh = 1 TWh.
Circulating fluidised bed (CFB) technology – Circulating
fluidised bed combustion technology whereby larger (unburnt)
particles are returned to the furnace.
Clean Dark Spread (CDS) – Eesti Energia’s margin between the
price of electricity (in NP Estonia) and oil shale costs and CO2
costs (taking into account the price of CO2 allowance futures
maturing in December and the amount of CO2 emitted in the
generation of a MWh of electricity).
CO2 emission allowance – According to the European Union
Emissions Trading System (ETS), one emission allowance gives
the holder the right to emit one tonne of carbon dioxide (CO2). The
limit on the total number of emission allowances available gives
them a monetary value.
EBITDA margin – Earnings before interest, taxes, depreciation
and amortisation divided by revenues.
FFO – Funds from operations. Cash flow from operations,
excluding changes in working capital.
Financial leverage – Net debt divided by the sum of net debt and
equity.
Level of water reservoirs – The largest part of the Nordic
countries’ electricity generation is based on hydro power whose
output depends on the level of water reservoirs.
Liquidity – Amount of liquid assets. Sum of cash and cash
equivalents, short term financial investments and deposits with a
maturity of more than 3 months
Net debt – Debt obligations (amortised) less cash and cash
equivalents (incl. bank deposits with maturities exceeding 3
months), units in money market funds and investments in fixed
income bonds.
Network losses – The amount of electricity delivered to
customers is somewhat smaller than the amount supplied from
power plants to the network because during transfer a part of
electricity in the power lines and transformers converts into heat.
To a lesser extent, network losses are caused by power theft and
incorrect measuring. The network operator has to compensate
energy losses and for this a corresponding amount of electricity
has to be purchased every hour.
NP system price – The price on the Nord Pool power exchange
that is calculated on the basis of all purchase and sale bids without
taking into account transmission capacity limitations.
Oil shale resource estimates – Outside Estonia, oil shale
resources with high economic potential have been estimated
based on exploration results, without taking into consideration any
modifying factors. In Estonia, in conformity with the earth’s crust
regulation and resource exploration practice, relevant technical,
environmental and socio-economic modifying factors are taken into
consideration. Resource records are kept based on the
environmental register’s list of deposits. Oil shale resources are
classified into the following categories: measured, indicated and
inferred, in the order of decreasing geological confidence
Position hedged with forward transactions – The average price
and the corresponding amount of electricity and shale oil sold and
emission allowances purchased in the future is previously fixed.
RAB – Regulated Asset Base, which represents the value of
assets used to provide regulated services.
Return on Fixed Assets (ROFA) – Operating profit (rolling 12
months) divided by average fixed assets excluding assets under
construction (allocated to specific product).
ROIC – Return on Invested Capital, calculated by dividing
operating profit by average invested capital
SAIDI – System Average Interruption Duration Index. The sum of
all customer interruption durations in minutes divided by the total
number of customers served.
SAIFI – System Average Interruption Frequency Index. The total
number of customer interruptions divided by the total number of
customers served.
Variable profit – Profit after deducting variable costs from sales
revenues