Embed Size (px)
Citation preview
INTERIM REPORT First 3 months 2011/12 1 October 2011 to 31 December 2011
AURUBIS
CONTENTS
CONTENTS
I. Highlights 3
II. Overview of Group key figures 4
III. Interim Group management report for the first three months 2011/12 5
1. Copper market 5
2. Results of operations, financial position and net assets 6
3. Business Units 9
- Business Unit Primary Copper 9
- Business Unit Recycling / Precious Metals 11
- Business Unit Copper Products 12
4. Human resources 14
5. Research and development 14
6. Aurubis shares 14
7. Corporate governance 14
8. Operating and strategic measures for corporate development 15
9. Risk and opportunity management 15
10. Outlook 15
IV. Interim consolidated financial statements for the first three months 2011/12 17
Consolidated balance sheet 17
Consolidated income statement 19
Consolidated statement of comprehensive income 20
Consolidated cash flow statement 21
Consolidated statement of changes in equity 22
Selected notes to the financial statements 23
Consolidated segment reporting 24
V. Dates and contacts 26
INTERIM REPORT FOR THE FIRST THREE MONTHS 2011/12 2–
HIGHLIGHTS
I. HIGHLIGHTS Aurubis AG generated earnings before taxes (EBT) of € 190 million (€ 135 million in the prior year 2010/11) in the first quarter of fiscal year 2011/12 on the basis of IFRS. The operating EBT amounts to € 86 million and is therefore significantly up on the comparable prior-year quarter (EBT € -21 million), which was burdened by extraordinary effects.
Hamburg, 14 February 2012 – Aurubis AG’s (Aurubis) revenues increased to € 3,151 million (€ 2,732 million in the prior year) despite a lower average copper price of US$ 7,489/t (US$ 8,634/t in the prior year). The increase in revenues is due in particular to the integration of Luvata. Furthermore, higher precious metal prices overcompensated for declining copper prices. Earnings before taxes (IFRS) rose from € 135 million in the prior year to € 190 million in the current fiscal year. At € 86 million, operating earnings before taxes improved considerably compared to the prior-year quarter (€ -21 million), which was burdened by extraordinary effects. Apart from the good situation of significant markets, highlights included the increased concentrate throughput and the higher sulphuric acid output.
Net cash flow is at a low level, which is typical in the first quarter. At € 19 million, it nevertheless rose distinctly compared to the prior year (€ -137 million).
The copper market was influenced by the ongoing financial crisis in Europe, the economic trend and seasonal factors. The fundamental situation nonetheless supported the copper price well overall. The copper price trend was volatile, but the effects were not serious.
The average settlement copper price for the quarter was US$ 7,489/t on the LME (US$ 8,982/t in the prior quarter). The closing price for the quarter under review was US$ 7,554/t. Gold and silver were in demand on the markets again as investments to hedge risks. Their prices remained at a high level. The high for gold was valued at just under US$ 57,900/kg, for silver at about US$ 1,125/kg. Year-end prices in 2011 were US$ 50,600/kg for gold and US$ 906/kg for silver.
The supply situation for copper concentrates and recycling materials for our plants was good. Mine strikes in Indonesia and South America had an effect on the spot market for copper concentrates. Treatment charges in spot transactions fell to new lows as a result, but this did not directly affect Aurubis. On the copper scrap market, spot transactions suffered due to decreasing copper prices. Aurubis was barely affected by this either, as we were already well stocked. Other recycling materials also remained readily available. Demand for sulphuric acid was good at first but then faced initial demand decreases.
In addition to continued cautious scheduling activities in customer industries, markets for copper products were also subject to seasonal influences at the end of the calendar year. Demand weakened considerably and we recorded lower sales volumes.
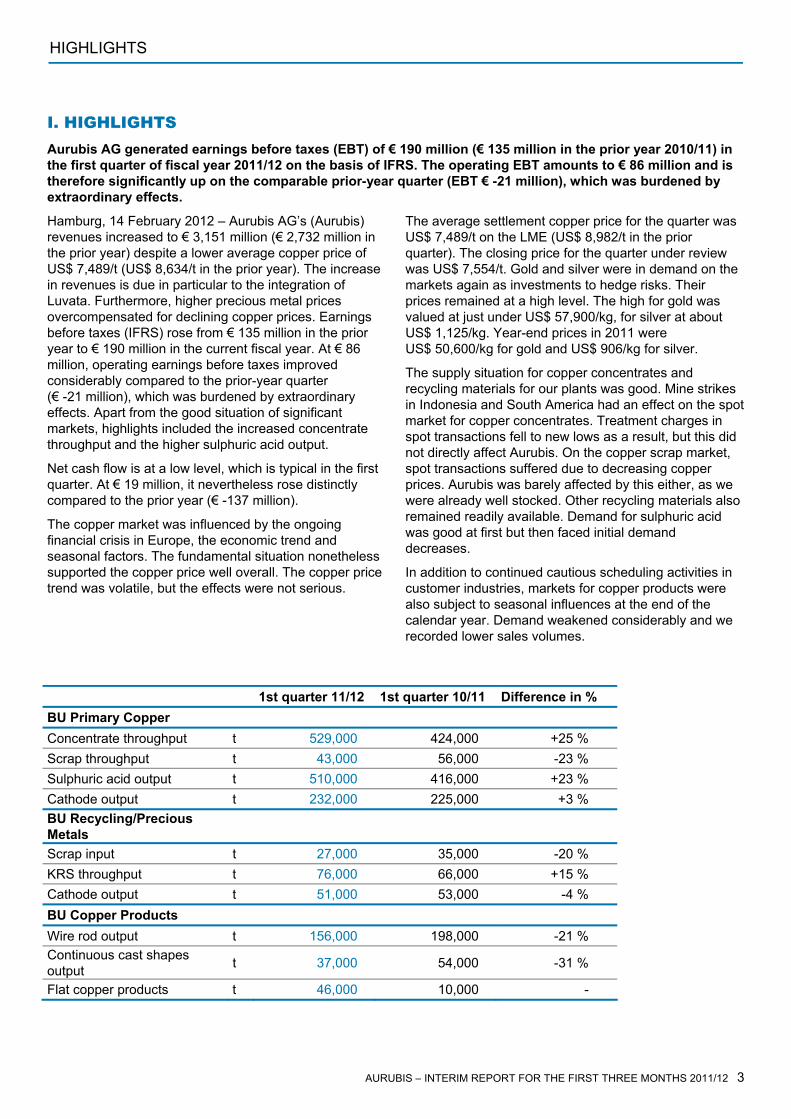
1st quarter 11/12 1st quarter 10/11 Difference in % BU Primary Copper Concentrate throughput t 529,000 424,000 +25 % Scrap throughput t 43,000 56,000 -23 % Sulphuric acid output t 510,000 416,000 +23 % Cathode output t 232,000 225,000 +3 % BU Recycling/Precious Metals
Scrap input t 27,000 35,000 -20 % KRS throughput t 76,000 66,000 +15 % Cathode output t 51,000 53,000 -4 % BU Copper Products Wire rod output t 156,000 198,000 -21 % Continuous cast shapes output t 37,000 54,000 -31 %
Flat copper products t 46,000 10,000 -
AURUBIS – INTERIM REPORT FOR THE FIRST THREE MONTHS 2011/12 3
GROUP KEY FIGURES
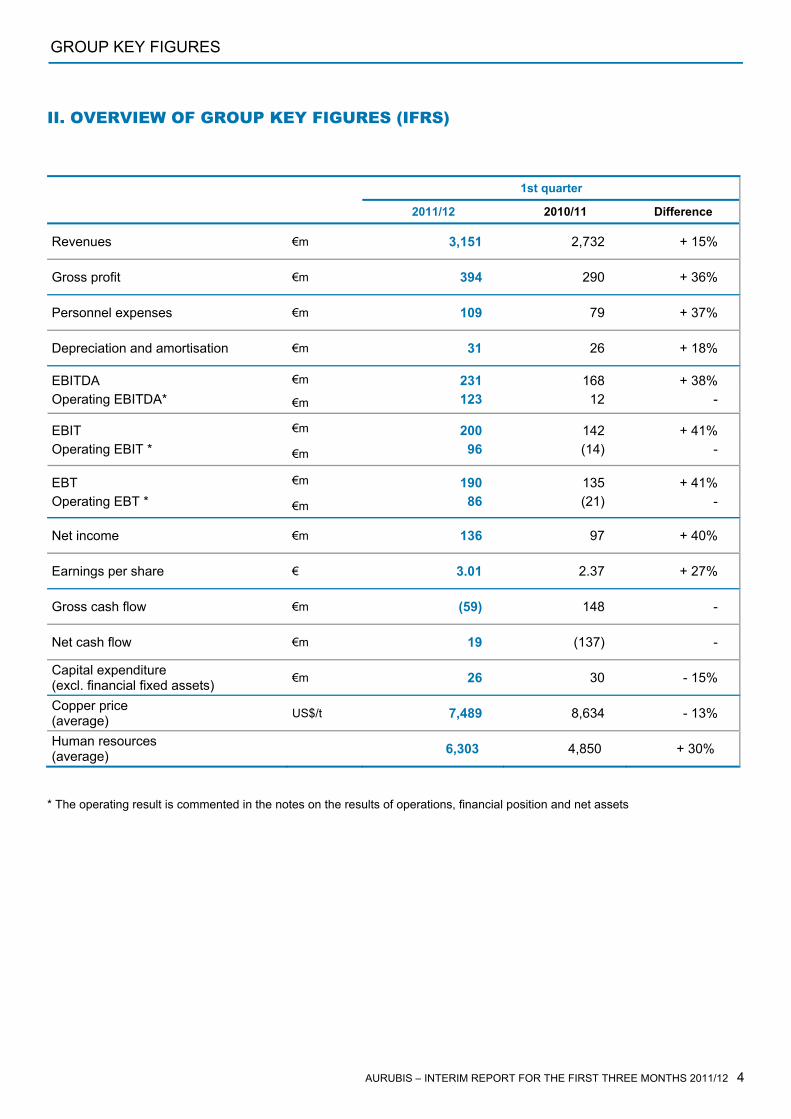
II. OVERVIEW OF GROUP KEY FIGURES (IFRS) 1st quarter
2011/12 2010/11 Difference
Revenues €m 3,151 2,732 + 15%
Gross profit €m 394 290 + 36%
Personnel expenses €m 109 79 + 37%
Depreciation and amortisation €m 31 26 + 18%
€m EBITDA Operating EBITDA* €m
231 123
168 12
+ 38% -
€m EBIT Operating EBIT * €m
200 96
142 (14)
+ 41% -
€m EBT Operating EBT * €m
190 86
135 (21)
+ 41% -
Net income €m 136 97 + 40%
Earnings per share € 3.01 2.37 + 27%
Gross cash flow €m (59) 148 -
Net cash flow €m 19 (137) -
Capital expenditure (excl. financial fixed assets) €m 26 30 - 15%
Copper price (average) US$/t 7,489 8,634 - 13%
Human resources (average) 6,303 4,850 + 30%
* The operating result is commented in the notes on the results of operations, financial position and net assets
AURUBIS – INTERIM REPORT FOR THE FIRST THREE MONTHS 2011/12 4
AURUBIS
INTERIM GROUP MANAGEMENT REPORT FOR THE FIRST THREE MONTHS 2011/12
III. INTERIM GROUP MANAGEMENT REPORT FOR THE FIRST THREE MONTHS 2011/12
1. COPPER MARKET
Institutional investors continued to have an influence on the copper market. Their transactions were characterised by growing risk aversion and year-end adjustments.
The trend on the international copper market in the first quarter of fiscal year 2011/12 was accompanied by the ongoing financial crisis in Europe, global economic doubts and seasonal influences. The highest price of the quarter was US$ 8,040/t
(27 October 2011), while the lowest was US$ 6,785/t (4 October 2011).
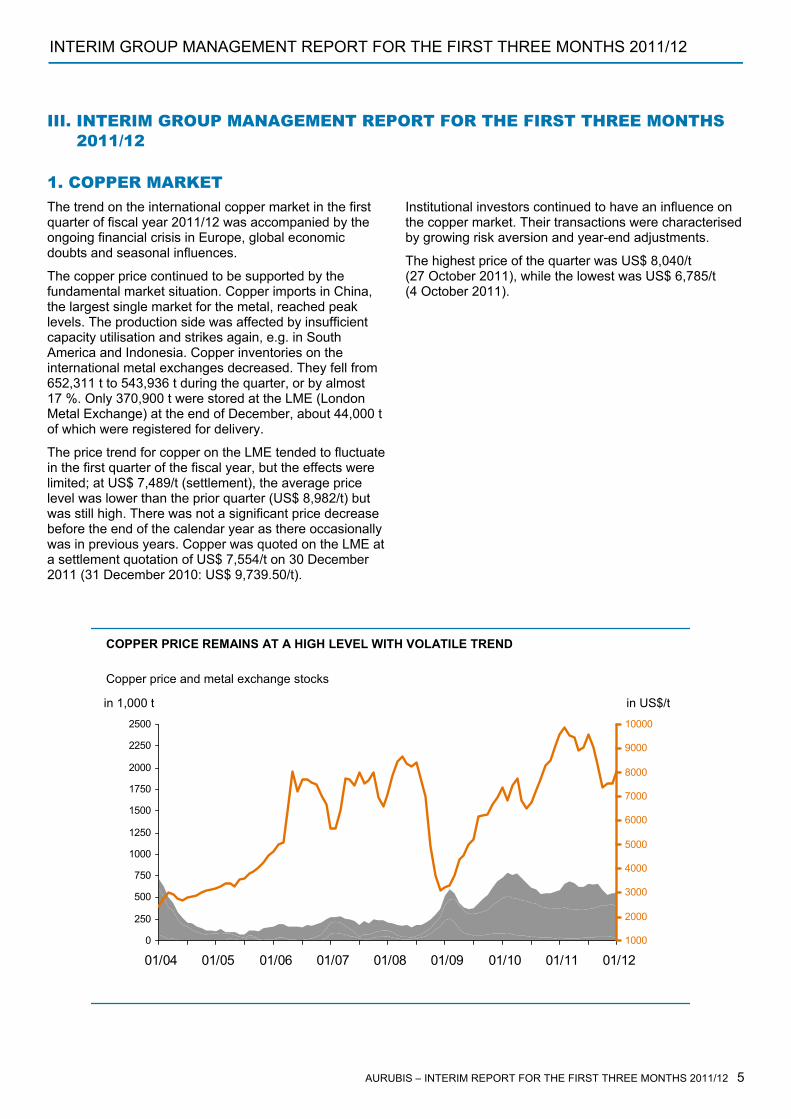
The copper price continued to be supported by the fundamental market situation. Copper imports in China, the largest single market for the metal, reached peak levels. The production side was affected by insufficient capacity utilisation and strikes again, e.g. in South America and Indonesia. Copper inventories on the international metal exchanges decreased. They fell from 652,311 t to 543,936 t during the quarter, or by almost 17 %. Only 370,900 t were stored at the LME (London Metal Exchange) at the end of December, about 44,000 t of which were registered for delivery.
The price trend for copper on the LME tended to fluctuate in the first quarter of the fiscal year, but the effects were limited; at US$ 7,489/t (settlement), the average price level was lower than the prior quarter (US$ 8,982/t) but was still high. There was not a significant price decrease before the end of the calendar year as there occasionally was in previous years. Copper was quoted on the LME at a settlement quotation of US$ 7,554/t on 30 December 2011 (31 December 2010: US$ 9,739.50/t).
Copper price and metal exchange stocks
COPPER PRICE REMAINS AT A HIGH LEVEL WITH VOLATILE TREND
0
250
500
750
1000
1250
1500
1750
2000
2250
2500
01/04 01/05 01/06 01/07 01/08 01/09 01/10 01/11 01/121000
2000
3000
4000
5000
6000
7000
8000
9000
10000
in US$/tin 1,000 t
INTERIM REPORT FOR THE FIRST THREE MONTHS 2011/12 5–
INTERIM GROUP MANAGEMENT REPORT FOR THE FIRST THREE MONTHS 2011/12
2. RESULTS OF OPERATIONS, FINANCIAL POSITION AND NET ASSETS The Aurubis Group reports in accordance with International Financial Reporting Standards (IFRS).
In order to portray the Aurubis Group’s operating success independently of valuation influences from the use of the average cost method in inventory valuation in accordance with IAS 2, from copper price-related valuation effects on inventories and from purchase price allocations, primarily on property, plant and equipment,
and for internal control starting in fiscal year 2010/11, the results of operations are initially presented on the basis of the operating result and expanded by the results of operations, financial position and net assets in accordance with IFRS in a second part.
The following table shows the calculation of the operating result of the first three months of fiscal year 2011/12 and the operating result in the comparable prior-year period.
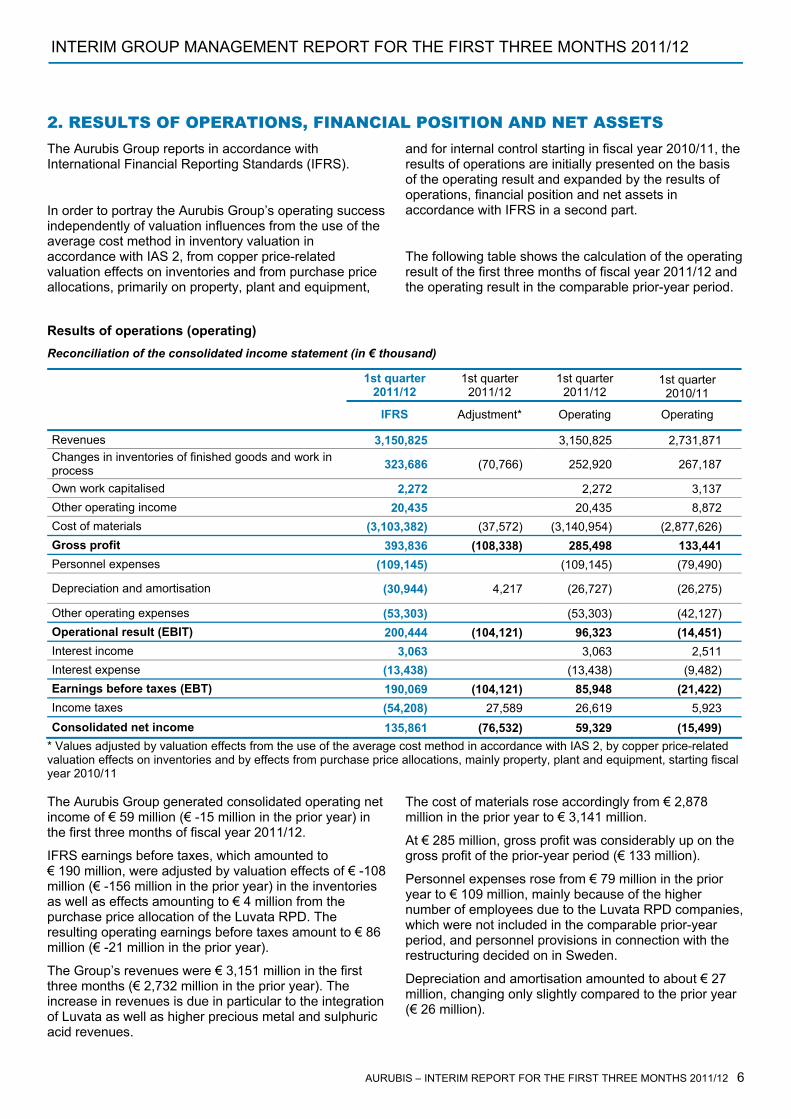
Results of operations (operating) Reconciliation of the consolidated income statement (in € thousand)
1st quarter 2011/12
1st quarter 2011/12
1st quarter 2011/12
1st quarter 2010/11
IFRS Adjustment* Operating Operating
Revenues 3,150,825 3,150,825 2,731,871 Changes in inventories of finished goods and work in process 323,686 (70,766) 252,920 267,187
Own work capitalised 2,272 2,272 3,137 Other operating income 20,435 20,435 8,872 Cost of materials (3,103,382) (37,572) (3,140,954) (2,877,626) Gross profit 393,836 (108,338) 285,498 133,441 Personnel expenses (109,145) (109,145) (79,490)
Depreciation and amortisation (30,944) 4,217 (26,727) (26,275)
Other operating expenses (53,303) (53,303) (42,127) Operational result (EBIT) 200,444 (104,121) 96,323 (14,451) Interest income 3,063 3,063 2,511 Interest expense (13,438) (13,438) (9,482) Earnings before taxes (EBT) 190,069 (104,121) 85,948 (21,422) Income taxes (54,208) 27,589 26,619 5,923 Consolidated net income 135,861 (76,532) 59,329 (15,499)
* Values adjusted by valuation effects from the use of the average cost method in accordance with IAS 2, by copper price-related valuation effects on inventories and by effects from purchase price allocations, mainly property, plant and equipment, starting fiscal year 2010/11 The Aurubis Group generated consolidated operating net income of € 59 million (€ -15 million in the prior year) in the first three months of fiscal year 2011/12.
IFRS earnings before taxes, which amounted to € 190 million, were adjusted by valuation effects of € -108 million (€ -156 million in the prior year) in the inventories as well as effects amounting to € 4 million from the purchase price allocation of the Luvata RPD. The resulting operating earnings before taxes amount to € 86 million (€ -21 million in the prior year).
The Group’s revenues were € 3,151 million in the first three months (€ 2,732 million in the prior year). The increase in revenues is due in particular to the integration of Luvata as well as higher precious metal and sulphuric acid revenues.
The cost of materials rose accordingly from € 2,878 million in the prior year to € 3,141 million.
At € 285 million, gross profit was considerably up on the gross profit of the prior-year period (€ 133 million).
Personnel expenses rose from € 79 million in the prior year to € 109 million, mainly because of the higher number of employees due to the Luvata RPD companies, which were not included in the comparable prior-year period, and personnel provisions in connection with the restructuring decided on in Sweden.
Depreciation and amortisation amounted to about € 27 million, changing only slightly compared to the prior year (€ 26 million).
AURUBIS – INTERIM REPORT FOR THE FIRST THREE MONTHS 2011/12 6
INTERIM GROUP MANAGEMENT REPORT FOR THE FIRST THREE MONTHS 2011/12
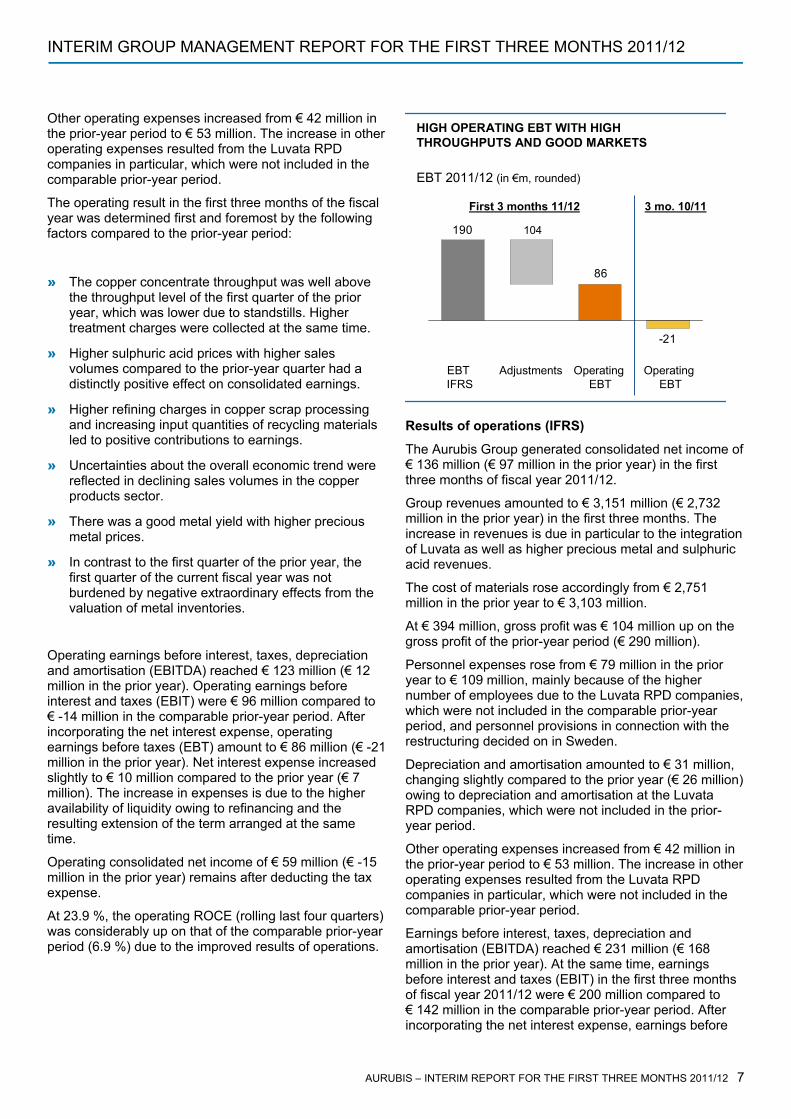
HIGH OPERATING EBT WITH HIGH THROUGHPUTS AND GOOD MARKETS
EBT 2011/12 (in €m, rounded)
190 104
86
-21
First 3 months 11/12
OperatingEBT
Adjustments OperatingEBT
EBT IFRS
3 mo. 10/11
Other operating expenses increased from € 42 million in the prior-year period to € 53 million. The increase in other operating expenses resulted from the Luvata RPD companies in particular, which were not included in the comparable prior-year period.
The operating result in the first three months of the fiscal year was determined first and foremost by the following factors compared to the prior-year period:
» The copper concentrate throughput was well above the throughput level of the first quarter of the prior year, which was lower due to standstills. Higher treatment charges were collected at the same time.
» Higher sulphuric acid prices with higher sales volumes compared to the prior-year quarter had a distinctly positive effect on consolidated earnings.
» Higher refining charges in copper scrap processing and increasing input quantities of recycling materials led to positive contributions to earnings.
» Uncertainties about the overall economic trend were reflected in declining sales volumes in the copper products sector.
» There was a good metal yield with higher precious metal prices.
» In contrast to the first quarter of the prior year, the first quarter of the current fiscal year was not burdened by negative extraordinary effects from the valuation of metal inventories.
Operating earnings before interest, taxes, depreciation and amortisation (EBITDA) reached € 123 million (€ 12 million in the prior year). Operating earnings before interest and taxes (EBIT) were € 96 million compared to € -14 million in the comparable prior-year period. After incorporating the net interest expense, operating earnings before taxes (EBT) amount to € 86 million (€ -21 million in the prior year). Net interest expense increased slightly to € 10 million compared to the prior year (€ 7 million). The increase in expenses is due to the higher availability of liquidity owing to refinancing and the resulting extension of the term arranged at the same time.
Operating consolidated net income of € 59 million (€ -15 million in the prior year) remains after deducting the tax expense.
At 23.9 %, the operating ROCE (rolling last four quarters) was considerably up on that of the comparable prior-year period (6.9 %) due to the improved results of operations.
Results of operations (IFRS)
The Aurubis Group generated consolidated net income of € 136 million (€ 97 million in the prior year) in the first three months of fiscal year 2011/12.
Group revenues amounted to € 3,151 million (€ 2,732 million in the prior year) in the first three months. The increase in revenues is due in particular to the integration of Luvata as well as higher precious metal and sulphuric acid revenues.
The cost of materials rose accordingly from € 2,751 million in the prior year to € 3,103 million.
At € 394 million, gross profit was € 104 million up on the gross profit of the prior-year period (€ 290 million).
Personnel expenses rose from € 79 million in the prior year to € 109 million, mainly because of the higher number of employees due to the Luvata RPD companies, which were not included in the comparable prior-year period, and personnel provisions in connection with the restructuring decided on in Sweden.
Depreciation and amortisation amounted to € 31 million, changing slightly compared to the prior year (€ 26 million) owing to depreciation and amortisation at the Luvata RPD companies, which were not included in the prior-year period.
Other operating expenses increased from € 42 million in the prior-year period to € 53 million. The increase in other operating expenses resulted from the Luvata RPD companies in particular, which were not included in the comparable prior-year period.
Earnings before interest, taxes, depreciation and amortisation (EBITDA) reached € 231 million (€ 168 million in the prior year). At the same time, earnings before interest and taxes (EBIT) in the first three months of fiscal year 2011/12 were € 200 million compared to € 142 million in the comparable prior-year period. After incorporating the net interest expense, earnings before
AURUBIS – INTERIM REPORT FOR THE FIRST THREE MONTHS 2011/12 7
INTERIM GROUP MANAGEMENT REPORT FOR THE FIRST THREE MONTHS 2011/12
taxes amount to € 190 million (€ 135 million in the prior year). Net interest expense increased slightly to € 10 million compared to the prior-year period (€ 7 million). The increase in expenses is due to the higher availability of liquidity owing to refinancing and the resulting extension of the term arranged at the same time.
Net assets (operating)
The difference between fixed assets in accordance with IFRS and operating fixed assets amounted to € -86 million as at 31 December 2011; the difference between inventories in accordance with IFRS and operating inventories was € -507 million. Operating fixed assets thus amounted to € 1,021 million, operating inventories to € 1,805 million. At the same time, the difference has an effect in equity of € -414 million and in deferred tax liabilities of € -179 million.
Consolidated net income of € 136 million (€ 97 million in the prior year) remains after deducting the tax expense.
Net assets (IFRS) Total assets increased from € 4,333 million as at the end of the past fiscal year to € 4,538 million as at 31 December 2011 due to the build-up of inventories together with increased precious metal prices.
Financial position and capital expenditure (IFRS)
Because of the higher earnings and the improvement in the working capital trend compared to the prior-year period, the cash inflow from operating activities (net cash flow) was at a substantially higher level at € 19 million (€ -137 million in the prior year).
The Group’s equity rose from € 1,740 million as at the end of the last fiscal year to € 1,870 million as at 31 December 2011, mainly because of the consolidated net income of € 136 million in the first three months. Overall, the equity ratio of 41.2 % is considerably up on the comparable prior-year figure (34.1 % in the prior year).
A free cash flow of € -21 million results for the first three months of 2011/12 after deducting investments in fixed assets from the net cash flow, compared to a free cash flow of € -167 million in the prior-year period.
Cash outflow from investing activities totalled € -36 million compared to € -27 million in the prior-year period. Borrowings increased only slightly from € 729 million as
at 30 September 2011 to € 737 million as at 31 December 2011. Current liabilities amounted to € 54 million as at 31 December 2011 and non-current liabilities were € 683 million. At 14 % at the end of the quarter, gearing is at the same level compared to the end of the last fiscal year.
The cash outflow from financing activities amounted to € -3 million compared to a cash inflow of € 175 million in the first three months of the prior year. The cash inflow in the prior year was mainly due to the increased use of existing credit lines at banks.
On 31 December 2011 cash and cash equivalents amounting to € 471 million were available to the Group.
AURUBIS INTERIM REPORT FOR THE FIRST THREE MONTHS 2011/12 8–
INTERIM GROUP MANAGEMENT REPORT FOR THE FIRST THREE MONTHS 2011/12
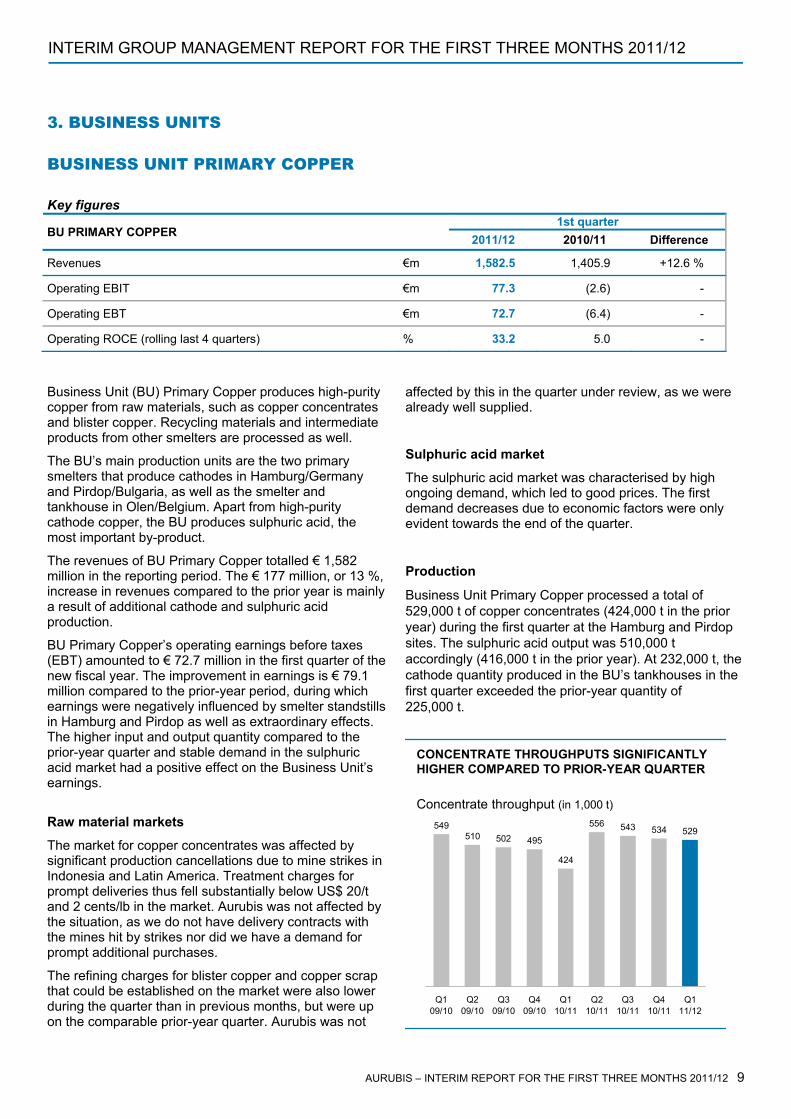
3. BUSINESS UNITS BUSINESS UNIT PRIMARY COPPER Key figures
Business Unit (BU) Primary Copper produces high-purity copper from raw materials, such as copper concentrates and blister copper. Recycling materials and intermediate products from other smelters are processed as well.
The BU’s main production units are the two primary smelters that produce cathodes in Hamburg/Germany and Pirdop/Bulgaria, as well as the smelter and tankhouse in Olen/Belgium. Apart from high-purity cathode copper, the BU produces sulphuric acid, the most important by-product.
The revenues of BU Primary Copper totalled € 1,582 million in the reporting period. The € 177 million, or 13 %, increase in revenues compared to the prior year is mainly a result of additional cathode and sulphuric acid production.
BU Primary Copper’s operating earnings before taxes (EBT) amounted to € 72.7 million in the first quarter of the new fiscal year. The improvement in earnings is € 79.1 million compared to the prior-year period, during which earnings were negatively influenced by smelter standstills in Hamburg and Pirdop as well as extraordinary effects. The higher input and output quantity compared to the prior-year quarter and stable demand in the sulphuric acid market had a positive effect on the Business Unit’s earnings.
Raw material markets
The market for copper concentrates was affected by significant production cancellations due to mine strikes in Indonesia and Latin America. Treatment charges for prompt deliveries thus fell substantially below US$ 20/t and 2 cents/lb in the market. Aurubis was not affected by the situation, as we do not have delivery contracts with the mines hit by strikes nor did we have a demand for prompt additional purchases.
The refining charges for blister copper and copper scrap that could be established on the market were also lower during the quarter than in previous months, but were up on the comparable prior-year quarter. Aurubis was not
affected by this in the quarter under review, as we were already well supplied.
Sulphuric acid market
The sulphuric acid market was characterised by high ongoing demand, which led to good prices. The first demand decreases due to economic factors were only evident towards the end of the quarter.
Production
Business Unit Primary Copper processed a total of 529,000 t of copper concentrates (424,000 t in the prior year) during the first quarter at the Hamburg and Pirdop sites. The sulphuric acid output was 510,000 t accordingly (416,000 t in the prior year). At 232,000 t, the cathode quantity produced in the BU’s tankhouses in the first quarter exceeded the prior-year quantity of 225,000 t.
1st quarter BU PRIMARY COPPER 2011/12 2010/11 Difference
Revenues €m 1,582.5 1,405.9 +12.6 %
Operating EBIT €m 77.3 (2.6) -
Operating EBT €m 72.7 (6.4) -
Operating ROCE (rolling last 4 quarters) % 33.2 5.0 -
CONCENTRATE THROUGHPUTS SIGNIFICANTLY HIGHER COMPARED TO PRIOR-YEAR QUARTER
Concentrate throughput (in 1,000 t)
549510 502 495
424
556 543 534 529
Q109/10
Q209/10
Q309/10
Q409/10
Q110/11
Q210/11
Q310/11
Q410/11
Q111/12
AURUBIS – INTERIM REPORT FOR THE FIRST THREE MONTHS 2011/12 9
INTERIM GROUP MANAGEMENT REPORT FOR THE FIRST THREE MONTHS 2011/12
Hamburg
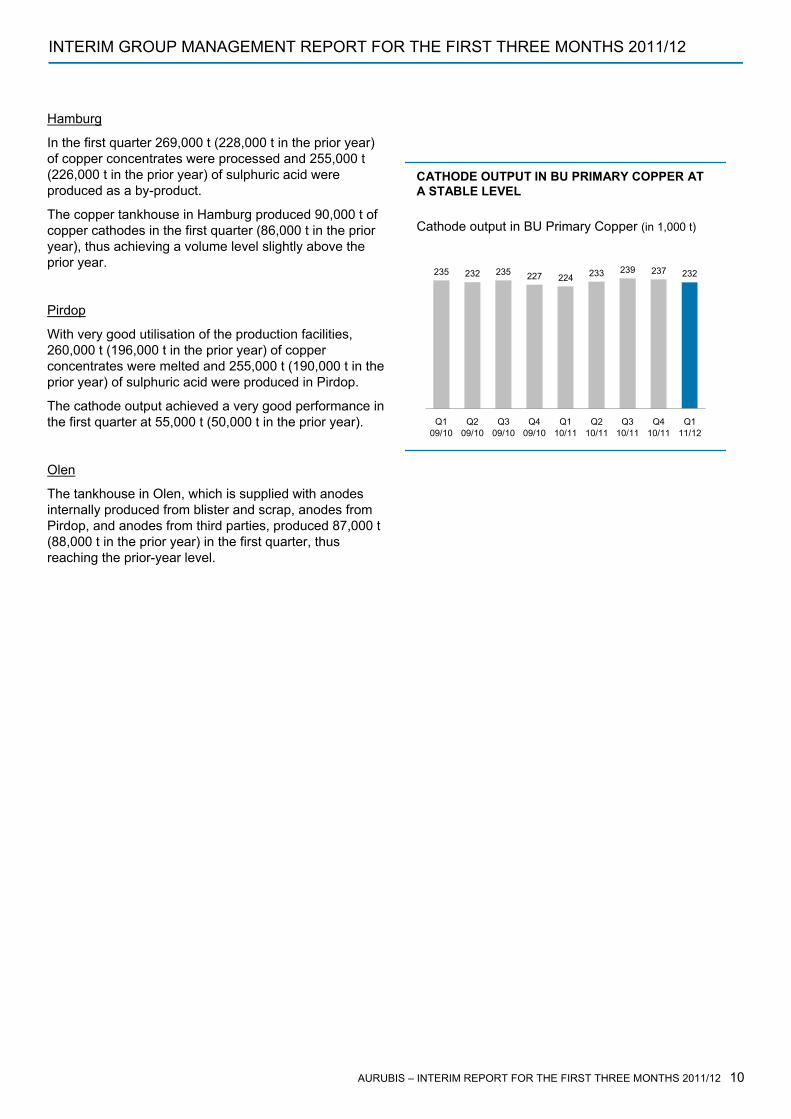
In the first quarter 269,000 t (228,000 t in the prior year) of copper concentrates were processed and 255,000 t (226,000 t in the prior year) of sulphuric acid were produced as a by-product.
The copper tankhouse in Hamburg produced 90,000 t of copper cathodes in the first quarter (86,000 t in the prior year), thus achieving a volume level slightly above the prior year.
Pirdop
With very good utilisation of the production facilities, 260,000 t (196,000 t in the prior year) of copper concentrates were melted and 255,000 t (190,000 t in the prior year) of sulphuric acid were produced in Pirdop.
The cathode output achieved a very good performance in the first quarter at 55,000 t (50,000 t in the prior year).
Olen
The tankhouse in Olen, which is supplied with anodes internally produced from blister and scrap, anodes from Pirdop, and anodes from third parties, produced 87,000 t (88,000 t in the prior year) in the first quarter, thus reaching the prior-year level.
CATHODE OUTPUT IN BU PRIMARY COPPER AT A STABLE LEVEL
Cathode output in BU Primary Copper (in 1,000 t)
235 232 235 227 224 233 239 237 232
Q109/10
Q209/10
Q309/10
Q409/10
Q110/11
Q210/11
Q310/11
Q410/11
Q111/12
AURUBIS – INTERIM REPORT FOR THE FIRST THREE MONTHS 2011/12 10
INTERIM GROUP MANAGEMENT REPORT FOR THE FIRST THREE MONTHS 2011/12 OPERATIVE SEGMENTE
BUSINESS UNIT RECYCLING / PRECIOUS METALS Key figures
In BU Recycling/Precious Metals, high-purity copper cathodes are produced from a variety of recycling raw materials and precious metals are extracted from primary and secondary raw materials. The main production sites are the Group’s recycling centre in Lünen and the secondary smelter and precious metal production facilities in Hamburg.
Revenues reached an accumulated total of € 1,202 million for the first three months, therefore increasing by 18 % (€ 1,015 million in the prior year) due especially to precious metal prices. The BU’s operating earnings before taxes (EBT) indicate a profit of € 27.1 million, which is € 30.7 million more than the prior year (€ -3.6 million), which was burdened by extraordinary effects as reported. The very good result is due to all plants’ high throughput performance with satisfactory treatment charges. Despite a scheduled anode furnace standstill in Lünen, the increased throughput of complex raw materials in the KRS in particular had a positive effect.
Raw material markets
The overall high material availability in Europe and North America promoted the full utilisation of all production sites with copper scrap and other recycling materials. In the course of the quarter, falling copper quotations temporarily led to a slight supply shortage and to delivery delays. However, the business situation remained good overall.
The supply situation for other recycling materials such as electronic scrap, alloy scrap and industrial residues stayed at a good level. The processing capacities were supplied accordingly with good refining charges.
Production
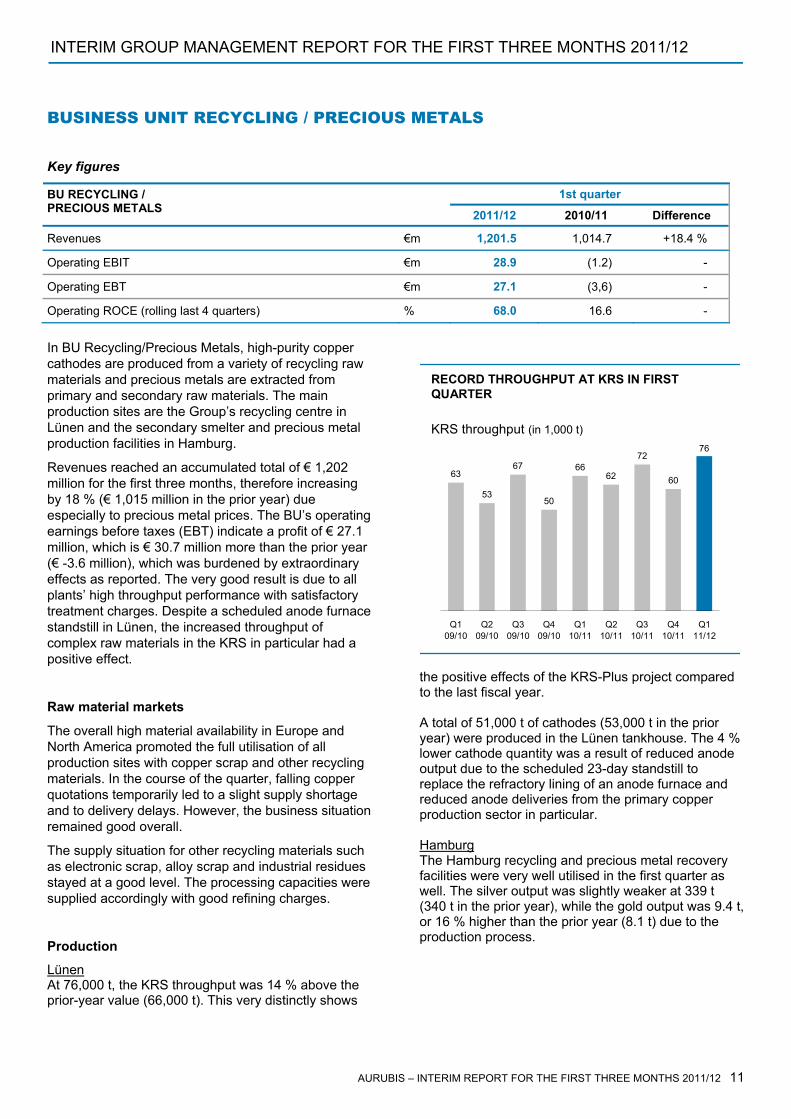
Lünen At 76,000 t, the KRS throughput was 14 % above the prior-year value (66,000 t). This very distinctly shows
the positive effects of the KRS-Plus project compared to the last fiscal year. A total of 51,000 t of cathodes (53,000 t in the prior year) were produced in the Lünen tankhouse. The 4 % lower cathode quantity was a result of reduced anode output due to the scheduled 23-day standstill to replace the refractory lining of an anode furnace and reduced anode deliveries from the primary copper production sector in particular. Hamburg The Hamburg recycling and precious metal recovery facilities were very well utilised in the first quarter as well. The silver output was slightly weaker at 339 t (340 t in the prior year), while the gold output was 9.4 t, or 16 % higher than the prior year (8.1 t) due to the production process.
1st quarter BU RECYCLING / PRECIOUS METALS 2011/12 2010/11 Difference
Revenues €m 1,201.5 1,014.7 +18.4 %
Operating EBIT €m 28.9 (1.2) -
Operating EBT €m 27.1 (3,6) -
Operating ROCE (rolling last 4 quarters) % 68.0 16.6 -
RECORD THROUGHPUT AT KRS IN FIRST QUARTER
KRS throughput (in 1,000 t)
63
53
67
50
6662
72
60
76
Q109/10
Q209/10
Q309/10
Q409/10
Q110/11
Q210/11
Q310/11
Q410/11
Q111/12
AURUBIS – INTERIM REPORT FOR THE FIRST THREE MONTHS 2011/12 11
INTERIM GROUP MANAGEMENT REPORT FOR THE FIRST THREE MONTHS 2011/12
BUSINESS UNIT COPPER PRODUCTS
Key figures
In BU Copper Products, copper cathodes primarily produced internally are processed into continuous cast wire rod, shapes, rolled products and specialty products. The main production sites are Hamburg (Germany), Olen (Belgium), Avellino (Italy), Emmerich (Germany), Stolberg (Germany), Pori (Finland), Zutphen (Netherlands) and Buffalo (USA).
BU Copper Products achieved revenues of € 2,049 million (€ 1,984 million in the prior year) in the first quarter. Operating earnings before taxes amounted to € -2.8 million (€ -1.4 million in the prior year) in the first three months. This decrease is a result of a one-time provision for social costs in connection with the closing of the production site in Sweden and a general demand decrease in Europe.
Product markets
The first quarter of the fiscal year exhibited the typical seasonal decrease in sales at the end of the calendar year. This trend was intensified by uncertainties related to the European debt crisis.
The markets for continuous cast copper wire rod were supported by continued stable demand from the automotive sector (cable and systems for on-board power supplies). Orders from energy and installation cable producers were weak due to seasonal factors and remained under the yearly average in the last few weeks of the year. The fact that the urgently needed German grid expansions are being addressed more slowly than planned had an effect in this regard. The trend in rod demand for specialty cable was satisfactory in contrast. Business activity in the enamelled wire sector was unsatisfactory, especially in Southern Europe, as demand from the domestic industry for white and brown goods decreased. This trend also spread to parts of Central and Northern Europe towards the end of the reporting period.
The markets for semis, primary products and shapes made of copper materials were not able to avoid the weaker environment either. Demand for high-quality products proved to be robust in comparison, although the
usual seasonal decreases were evident at the end of the year as well. Export business rose in some sectors.
The markets for rolled copper products in Europe exhibited a declining tendency in the reporting period. The European sites lost about 15 % of their delivery volume compared to the prior year. In contrast, the volume increased by 15 % in the North American market due to strong demand, but also the bankruptcy of one competitor. Incoming orders have stabilised again in the meantime, so an improvement is expected in the second quarter.
The sales volume of shaped wires, which was mainly delivered to the European market, also decreased by 15 % due to demand.
Production
Rod (wire rod)
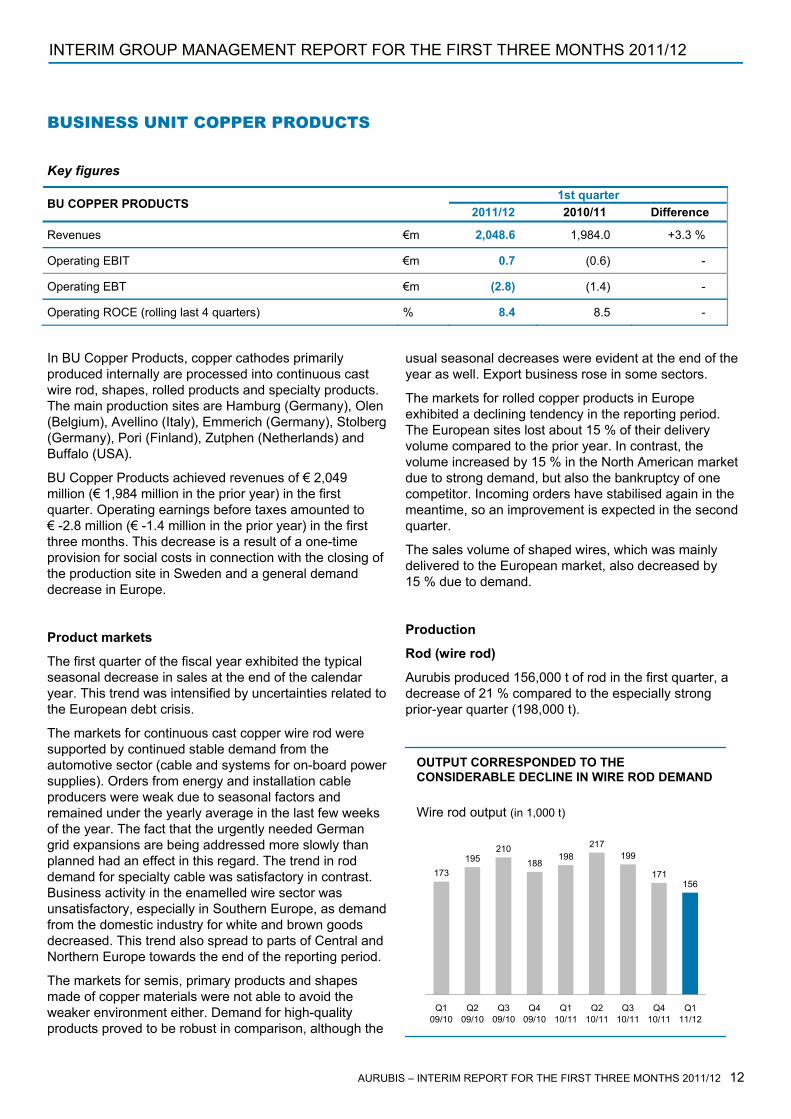
Aurubis produced 156,000 t of rod in the first quarter, a decrease of 21 % compared to the especially strong prior-year quarter (198,000 t).
1st quarter BU COPPER PRODUCTS 2011/12 2010/11 Difference
Revenues €m 2,048.6 1,984.0 +3.3 %
Operating EBIT €m 0.7 (0.6) -
Operating EBT €m (2.8) (1.4) -
Operating ROCE (rolling last 4 quarters) % 8.4 8.5 -
OUTPUT CORRESPONDED TO THE CONSIDERABLE DECLINE IN WIRE ROD DEMAND
173195
210188
198217
199
171156
Q109/10
Q209/10
Q309/10
Q409/10
Q110/11
Q210/11
Q310/11
Q410/11
Q111/12
Wire rod output (in 1,000 t)
AURUBIS – INTERIM REPORT FOR THE FIRST THREE MONTHS 2011/12 12
INTERIM GROUP MANAGEMENT REPORT FOR THE FIRST THREE MONTHS 2011/12
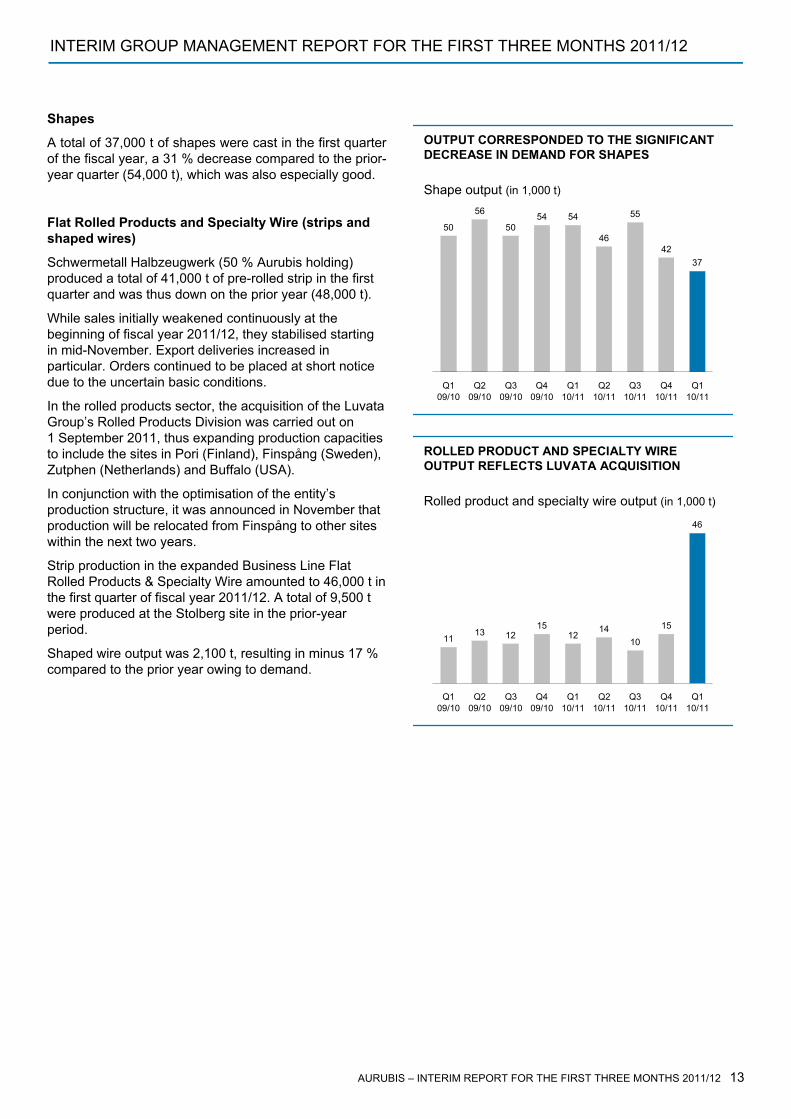
Shapes OUTPUT CORRESPONDED TO THE SIGNIFICANT DECREASE IN DEMAND FOR SHAPES
50
56
5054 54
46
55
4237
Q109/10
Q209/10
Q309/10
Q409/10
Q110/11
Q210/11
Q310/11
Q410/11
Q110/11
Shape output (in 1,000 t)
A total of 37,000 t of shapes were cast in the first quarter of the fiscal year, a 31 % decrease compared to the prior-year quarter (54,000 t), which was also especially good.
Flat Rolled Products and Specialty Wire (strips and shaped wires)
Schwermetall Halbzeugwerk (50 % Aurubis holding) produced a total of 41,000 t of pre-rolled strip in the first quarter and was thus down on the prior year (48,000 t).
While sales initially weakened continuously at the beginning of fiscal year 2011/12, they stabilised starting in mid-November. Export deliveries increased in particular. Orders continued to be placed at short notice due to the uncertain basic conditions.
In the rolled products sector, the acquisition of the Luvata Group’s Rolled Products Division was carried out on 1 September 2011, thus expanding production capacities to include the sites in Pori (Finland), Finspång (Sweden), Zutphen (Netherlands) and Buffalo (USA).
ROLLED PRODUCT AND SPECIALTY WIRE OUTPUT REFLECTS LUVATA ACQUISITION
1113 12
1512
1410
15
46
Q109/10
Q209/10
Q309/10
Q409/10
Q110/11
Q210/11
Q310/11
Q410/11
Q110/11
Rolled product and specialty wire output (in 1,000 t)In conjunction with the optimisation of the entity’s production structure, it was announced in November that production will be relocated from Finspång to other sites within the next two years.
Strip production in the expanded Business Line Flat Rolled Products & Specialty Wire amounted to 46,000 t in the first quarter of fiscal year 2011/12. A total of 9,500 t were produced at the Stolberg site in the prior-year period.
Shaped wire output was 2,100 t, resulting in minus 17 % compared to the prior year owing to demand.
AURUBIS – INTERIM REPORT FOR THE FIRST THREE MONTHS 2011/12 13

INTERIM GROUP MANAGEMENT REPORT FOR THE FIRST THREE MONTHS 2011/12
4. HUMAN RESOURCES The Aurubis Group had a total of 6,304 employees at the end of the first quarter (4,850 in the prior year).
The increase in the number of employees is due in particular to the integration of the former Luvata Rolled Products Division and various capital expenditure measures for expansion focused on the Hamburg and Lünen sites.
The Aurubis Group employees are spread out over the following countries: Germany (3,554), Bulgaria: (812), USA (639), Belgium (475), Sweden (223), Finland (194), Netherlands (158), Italy (133), Switzerland (46), England (28), Slovakia (14), China (9), France (3), Singapore (3), Thailand (2), Korea (2), Russia (2), Japan (2), Turkey (2), Spain (1), Taiwan (1) and Vietnam (1).
Group-wide, 56 % of the workforce is thus employed in Germany and 44 % at other locations worldwide.
Personnel expenses have increased by € 29.7 million to € 109 million compared to the prior year, mainly because of the higher number of employees due to the Luvata RPD companies, which were not included in the comparable prior-year period, and personnel provisions in connection with the restructuring decided on in Sweden.
5. RESEARCH AND DEVELOPMENT In research and development for the BUs Primary Copper and Recycling/Precious Metals, the focus during the reporting period was on a number of projects to investigate new processes to continue improving the metal yield. Furthermore, investments were made in the operation of a pilot facility in secondary copper production, which is testing a new procedure to reduce throughput times of precious metal-bearing raw materials.
The extensive and complex trials in the pilot facility for improving the properties of iron silicate products in primary copper production continued successfully.
The start-up of the new production facility for gold recovery confirmed or even exceeded all results of the pilot phase.
6. AURUBIS SHARES In the first quarter of fiscal year 2011/12 the international stock markets were still under the influence of the European debt crisis and uncertainty about the further trend in the global economy. The downgrading of several European countries’ credit rating by rating agencies and the pressure of the financial markets led to a rising interest burden for these countries, which further weighed
on their growth prospects. The banking sector was also strained by these developments. Financial securities were under pressure on the exchanges due to the resulting loss of trust. In addition to more pessimistic economic prospects, concerns that distortions of the financial sector could be transferred to the real economy ultimately burdened other shares as well.
Despite the fairly volatile market environment, Aurubis shares increased by 7.9%, developing somewhat better than the MDAX and the DAX, which rose by 6.7% and 7.2%, respectively.
Aurubis shares started fiscal year 2011/12 at a price of € 37.56 (Xetra) on 3 October 2011. On 4 October 2011 they reached the low of the reporting period at € 35.83. However, they quickly recovered as the quarter went on, reaching a high of € 42.96 for the period on 11 November 2011. Aurubis shares ended the quarter at € 41.20 on 30 December 2011.
The average daily trading volume on Xetra decreased in the first quarter to 171,000 shares following 284,000 shares in the previous quarter.
7. CORPORATE GOVERNANCE The Executive Board and the Supervisory Board propose that the unappropriated earnings of € 105,041,901.74 reported in the adopted financial statements of Aurubis AG as at 30 September 2011 be used to pay a dividend to the shareholders of € 1.20 per no-par-value share that is entitled to participate in dividends, i.e. a total of € 53,948,067.60 on the subscribed capital of € 115,089,210.88, and that the amount of € 51,093,834.14 be carried forward.
Dr Ernst J. Wortberg stepped down as Chairman of the Supervisory Board at the end of the reporting year 2010/11 after 10 years in the position. Prof. Dr Heinz Jörg Fuhrmann was elected Chairman of the Supervisory Board effective 1 October 2011.
Chief Executive Officer Dr Bernd Drouven resigned from the Company’s Executive Board on 31 December 2011. Mr Peter Willbrandt was appointed Chief Executive Officer of the Company effective 1 January 2012.
We would like to thank Dr Wortberg and Dr Drouven for their successful service to the Company.
AURUBIS – INTERIM REPORT FOR THE FIRST THREE MONTHS 2011/12 14

INTERIM GROUP MANAGEMENT REPORT FOR THE FIRST THREE MONTHS 2011/12
8. OPERATING AND STRATEGIC MEASURES FOR CORPORATE DEVELOPMENT
Cost reduction and continuous improvement
Maintaining a competitive cost position is crucial in order to ensure Aurubis’ competiveness on the international raw material procurement markets and the sales markets for copper products. Various ongoing products are targeted at cost reduction and improving the Group’s competitive advantage. The efficiency and productivity improvement project at the Pirdop site in Bulgaria was successfully transferred to a sustainable, continuous improvement programme.
Strategic initiatives
As part of the strategic initiative to expand the copper product sector, the integration of the new entities into the Aurubis Group is the focus of our strategy implementation following the acquisition of Luvata’s Rolled Products Division on 1 September 2011. We already achieved important milestones in the first quarter of the fiscal year. Since the ownership transfer, all of the new entities have carried out their reporting via the central consolidation and reporting system. Last but not least, we have implemented the new management organisation and introduced measures to optimise the production structure. For example, teams have worked together with the sites to identify synergy potential and start implementation measures. Furthermore, we intend to close the production site in Finspång (Sweden) in the next two years and relocate production to other Group sites.
Concentration in the complex profiles sector
In order to increase profitability in the complex profiles sector, we intend to concentrate production at just one site. The plan is to move the plants in Yverdon-Les-Bains (Switzerland) to Olen (Belgium). The Swiss site is not profitable due mainly to high logistics costs, factor costs and not least the unfavourable trend in the €/CHF exchange rate. A sales office will remain, and the other 35 employees will be offered jobs in the Group.
9. RISK AND OPPORTUNITY
MANAGEMENT The Aurubis Group’s raw material supply was secured in the first quarter of fiscal year 2011/12. Copper concentrates were readily available overall. Because of our long-term contracts for concentrate deliveries, we were not affected by temporary supply fluctuations on the spot market caused by factors such as strikes in the mining industry. A sufficient copper scrap quantity was
available, though the occasionally lower copper price led to restraint on the supply side.
Demand for sulphuric acid remained at a good level in the reporting period. All of the acid that Aurubis produced in the course of the primary copper production process was sold at good prices. Aside from weaker demand due to seasonal factors typical in the first quarter, customers’ more cautious ordering tendencies were very noticeable in the markets for copper products.
The utilisation of our copper production capacities remained at a high level. The continued focus on our working capital management and the positive business position resulted in a good liquidity situation. Trade accounts receivable were largely covered by trade credit insurance. No significant bad debts were registered in the reporting period.
We limited risks from the volatile euro/US dollar exchange rate with appropriate hedging transactions. We countered the influences of fluctuating metal prices with suitable metal price hedging.
We have recognised the increased risk of an electricity blackout due to the energy turnaround in Germany and have introduced measures to limit damage to our facilities if this occurs.
10. OUTLOOK Raw material markets
A recovery of the market is expected soon after the re-commissioning of the Freeport Mine in Indonesia following strikes. Treatment charges under long-term contracts will be much higher in the market than in the prior year.
We are already well supplied with copper concentrates for the current year. In the markets for blister copper and recycling materials, we also expect an improvement in the supply, as long as the metal prices remain at a good level.
Copper quotations, which are more stable again, and the mild winter in the first quarter supported the market supply in the past few weeks perceptibly. We also expect the positive situation to continue in the next few months with sufficient refining charges.
From today’s perspective, we view the full supply of recycling materials for the Aurubis Group as secure.
Copper market The copper market has been in an orientation phase at the beginning of 2012. In light of uncertainty in the economic environment, there is no consistent opinion about ongoing expectations. The economic trend in the key countries with high copper demand is viewed
AURUBIS – INTERIM REPORT FOR THE FIRST THREE MONTHS 2011/12 15
INTERIM GROUP MANAGEMENT REPORT FOR THE FIRST THREE MONTHS 2011/12
differently. In Germany, the Federal Government has corrected its economic growth prediction downward, but at the same time, German companies’ mood has improved for the third month in a row. For China, expectations that the economic growth dynamics will continue are good until the change in political leadership in autumn 2012. This is supported by a relaxed loan policy.
Physical transactions were still affected by seasonal influences in January. Economic activity decreased in China towards the end of the month due to the New Year’s festivities there, while economic activity started up slowly in the Western world. The next few weeks will determine the physical copper demand. The continued reduction in LME copper stocks is noticeable. Quantities are flowing first and foremost towards Asia. LME copper inventories fell by about 30,000 t to 342,000 t in January alone; additional deliveries amounting to 75,000 t were planned at this point in time.
The basis for continued high copper prices is thus in place, especially since there have been technical disruptions and volume cancellations on the production side at two larger copper smelters in the Far East.
The copper price on the LME increased significantly during the first few weeks of the year. In January it rose from a monthly low of US$ 7,471/t to over US$ 8,300/t in some cases.
Copper production
We assume that the concentrate processing quantities will remain at the level of the first three months. Processing quantities are thus expected to be slightly up on the prior-year level for the entire fiscal year. For copper cathode production, we expect the volume to be at the high prior-year level.
We anticipate full utilisation of our Lünen recycling units for the rest of the fiscal year.
Product markets
Copper products
From today’s perspective, demand for products from Business Line Rod & Shapes will recover again compared to the weak quarter under review. Additional growth impulses could arise from German industry’s good export activities. However, the central requirement for further growth is that governments are able to reduce the uncertainty resulting from the European debt crisis step by step in the next several weeks.
Incoming orders have stabilised in Business Line Flat Rolled Products & Specialty Wire, strengthened by the former Luvata companies, so an improvement in the market situation can be expected for the second quarter.
Sulphuric acid
Sulphuric acid demand will likely be oriented towards the uncertain economic situation in the next few months. The price level has weakened compared to the previous quarters.
Expected earnings
We also expect a good situation for our procurement markets for the rest of the fiscal year. Overall, we view the copper market as well supported despite economic uncertainties and expect volatile yet high ongoing copper prices. On the sales markets, especially for sulphuric acid and copper products, we are confronted with the effects of subdued economic expectations and doubts regarding the further development of the financial crisis. This will be reflected in the future business trend. Currently, we do not expect the results of the very good first quarter to continue to this extent. Nevertheless, we anticipate a satisfactory annual result overall on the basis of this good quarterly result.
AURUBIS – INTERIM REPORT FOR THE FIRST THREE MONTHS 2011/12 16
AURUBIS
INTERIM CONSOLIDATED FINANCIAL STATMENTS FOR THREE MONTHS 2011/12
IV. INTERIM CONSOLIDATED FINANCIAL STATEMENTS FOR THE FIRST THREE MONTHS OF FISCAL YEAR 2011/12
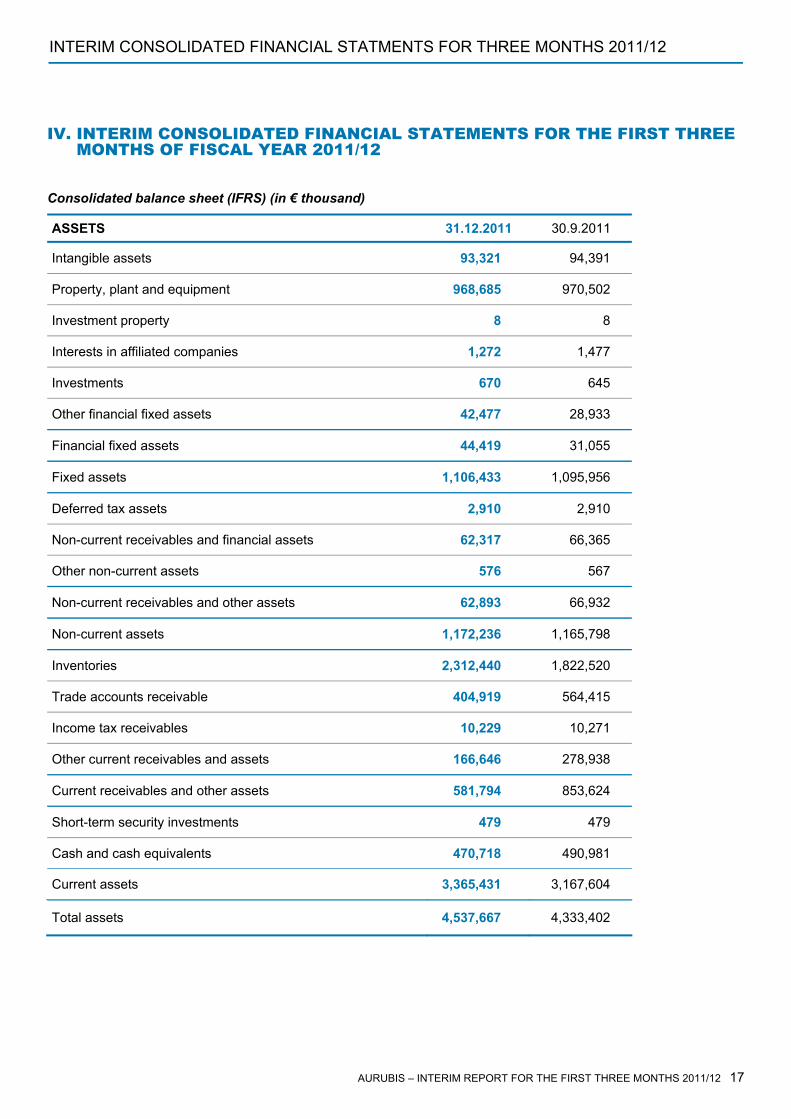
Consolidated balance sheet (IFRS) (in € thousand)
ASSETS 31.12.2011 30.9.2011
Intangible assets 93,321 94,391
Property, plant and equipment 968,685 970,502
Investment property 8 8
Interests in affiliated companies 1,272 1,477
Investments 670 645
Other financial fixed assets 42,477 28,933
Financial fixed assets 44,419 31,055
Fixed assets 1,106,433 1,095,956
Deferred tax assets 2,910 2,910
Non-current receivables and financial assets 62,317 66,365
Other non-current assets 576 567
Non-current receivables and other assets 62,893 66,932
Non-current assets 1,172,236 1,165,798
Inventories 2,312,440 1,822,520
Trade accounts receivable 404,919 564,415
Income tax receivables 10,229 10,271
Other current receivables and assets 166,646 278,938
Current receivables and other assets 581,794 853,624
Short-term security investments 479 479
Cash and cash equivalents 470,718 490,981
Current assets 3,365,431 3,167,604
Total assets 4,537,667 4,333,402
INTERIM REPORT FOR THE FIRST THREE MONTHS 2011/12 17–
INTERIM CONSOLIDATED FINANCIAL STATMENTS FOR THREE MONTHS 2011/12
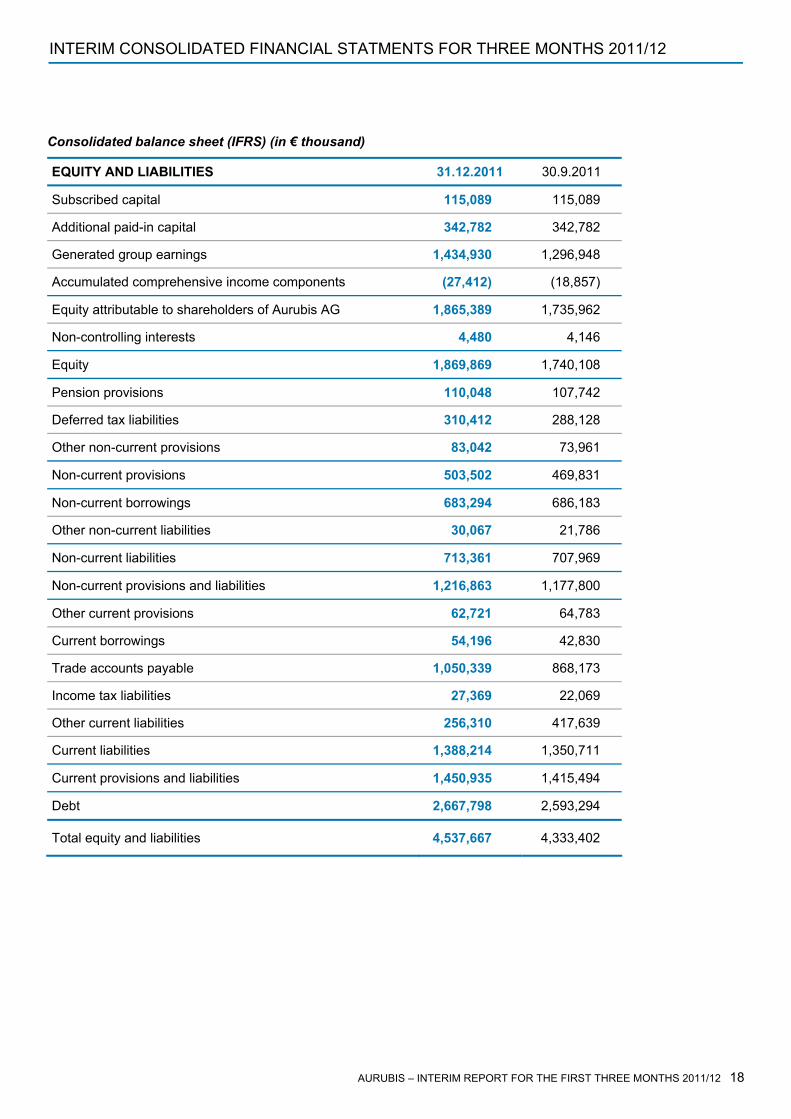
Consolidated balance sheet (IFRS) (in € thousand)
EQUITY AND LIABILITIES 31.12.2011 30.9.2011
Subscribed capital 115,089 115,089
Additional paid-in capital 342,782 342,782
Generated group earnings 1,434,930 1,296,948
Accumulated comprehensive income components (27,412) (18,857)
Equity attributable to shareholders of Aurubis AG 1,865,389 1,735,962
Non-controlling interests 4,480 4,146
Equity 1,869,869 1,740,108
Pension provisions 110,048 107,742
Deferred tax liabilities 310,412 288,128
Other non-current provisions 83,042 73,961
Non-current provisions 503,502 469,831
Non-current borrowings 683,294 686,183
Other non-current liabilities 30,067 21,786
Non-current liabilities 713,361 707,969
Non-current provisions and liabilities 1,216,863 1,177,800
Other current provisions 62,721 64,783
Current borrowings 54,196 42,830
Trade accounts payable 1,050,339 868,173
Income tax liabilities 27,369 22,069
Other current liabilities 256,310 417,639
Current liabilities 1,388,214 1,350,711
Current provisions and liabilities 1,450,935 1,415,494
Debt 2,667,798 2,593,294
Total equity and liabilities 4,537,667 4,333,402
AURUBIS – INTERIM REPORT FOR THE FIRST THREE MONTHS 2011/12 18
INTERIM CONSOLIDATED FINANCIAL STATMENTS FOR THREE MONTHS 2011/12
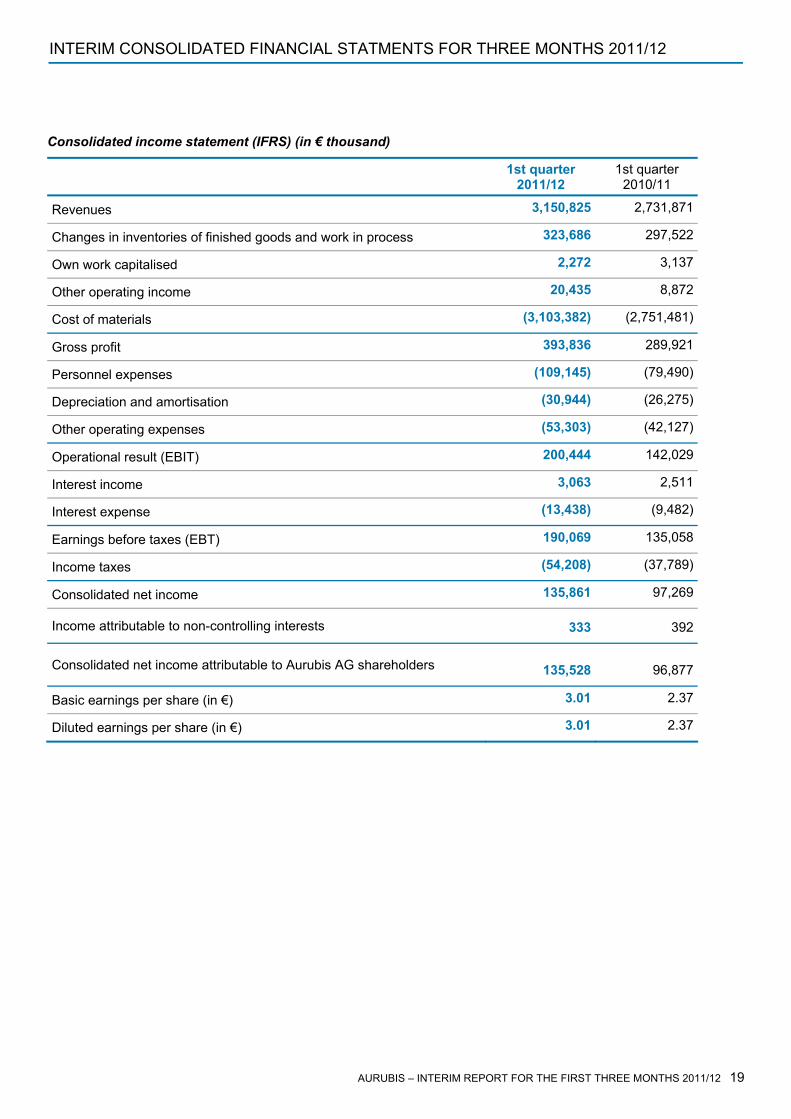
Consolidated income statement (IFRS) (in € thousand)
1st quarter 2011/12
1st quarter 2010/11
2,731,871Revenues 3,150,825
297,522Changes in inventories of finished goods and work in process 323,686
3,137Own work capitalised 2,272
8,872Other operating income 20,435
(2,751,481)Cost of materials (3,103,382)
289,921Gross profit 393,836
(79,490)Personnel expenses (109,145)
(26,275)Depreciation and amortisation (30,944)
(42,127)Other operating expenses (53,303)
142,029Operational result (EBIT) 200,444
2,511Interest income 3,063
(9,482)Interest expense (13,438)
135,058Earnings before taxes (EBT) 190,069
(37,789)Income taxes (54,208)
97,269Consolidated net income 135,861
Income attributable to non-controlling interests 333 392
Consolidated net income attributable to Aurubis AG shareholders 135,528 96,877
2.37Basic earnings per share (in €) 3.01
2.37Diluted earnings per share (in €) 3.01
AURUBIS – INTERIM REPORT FOR THE FIRST THREE MONTHS 2011/12 19
INTERIM CONSOLIDATED FINANCIAL STATMENTS FOR THREE MONTHS 2011/12
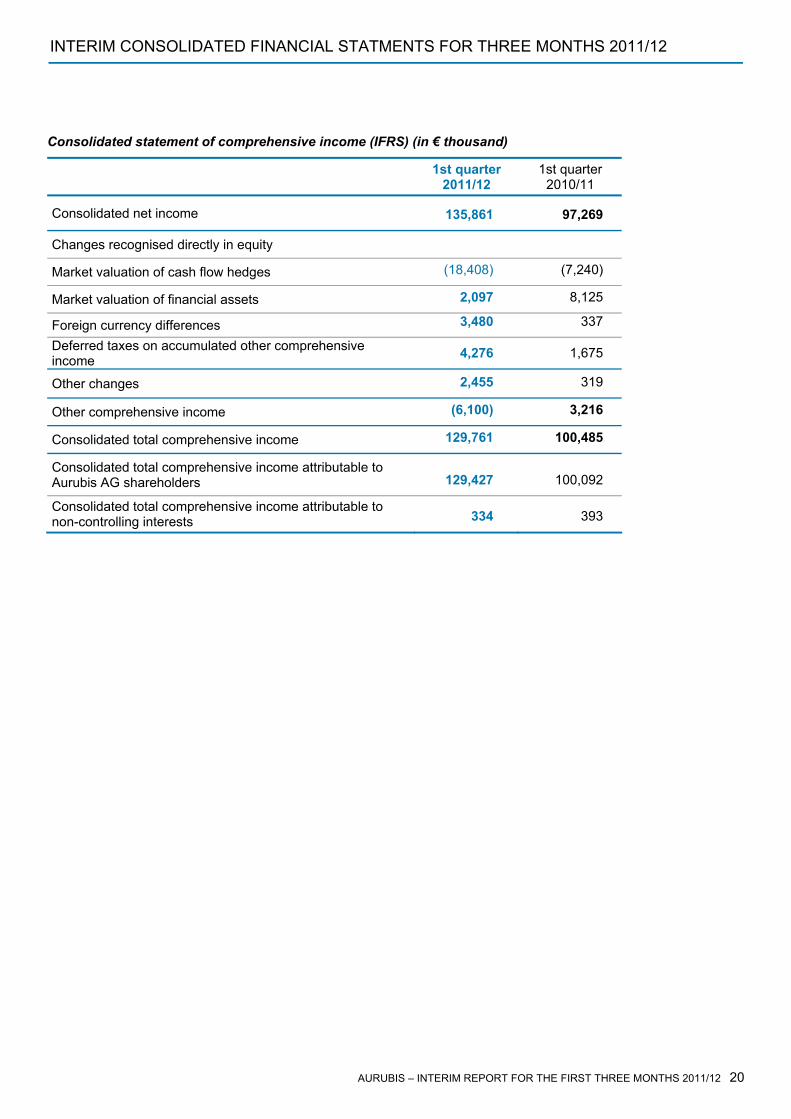
Consolidated statement of comprehensive income (IFRS) (in € thousand)
1st quarter 2011/12
1st quarter 2010/11
Consolidated net income 135,861 97,269
Changes recognised directly in equity
Market valuation of cash flow hedges (18,408) (7,240)
8,125 Market valuation of financial assets 2,097
337 Foreign currency differences 3,480
Deferred taxes on accumulated other comprehensive income 4,276 1,675
319 Other changes 2,455
Other comprehensive income (6,100) 3,216
Consolidated total comprehensive income 129,761 100,485
Consolidated total comprehensive income attributable to Aurubis AG shareholders 129,427 100,092
Consolidated total comprehensive income attributable to non-controlling interests 334 393
AURUBIS – INTERIM REPORT FOR THE FIRST THREE MONTHS 2011/12 20
INTERIM CONSOLIDATED FINANCIAL STATMENTS FOR THREE MONTHS 2011/12
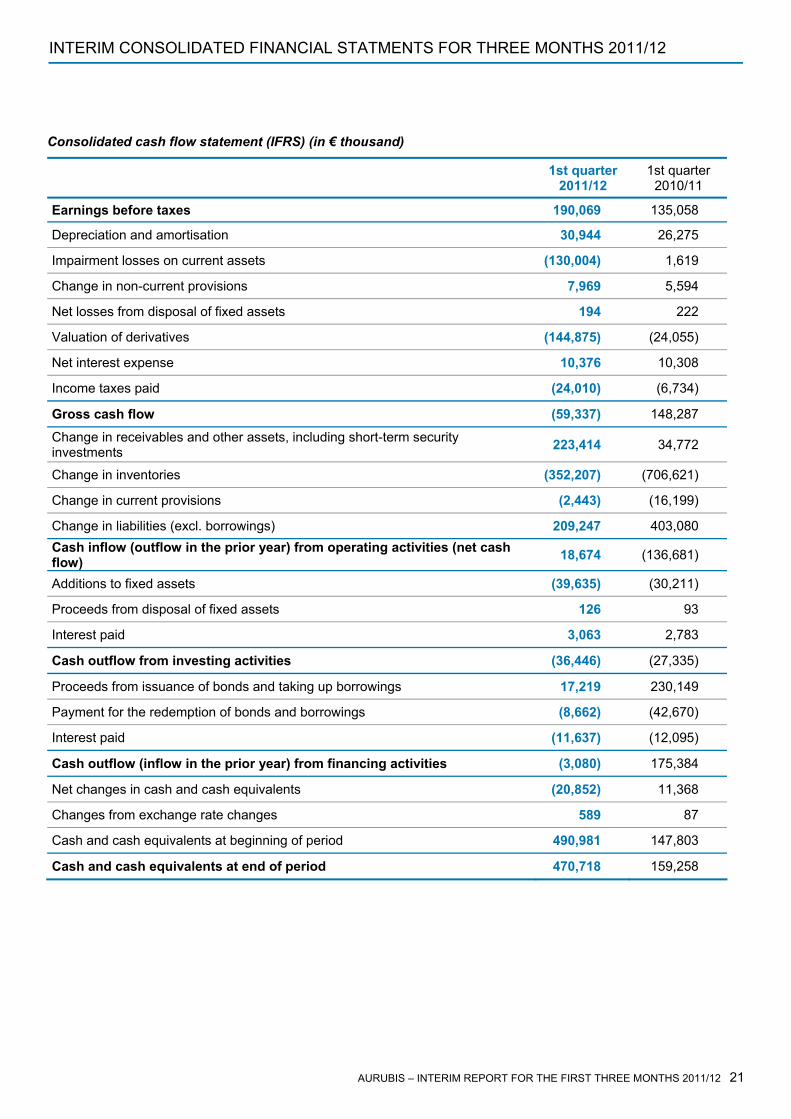
Consolidated cash flow statement (IFRS) (in € thousand)
1st quarter 2011/12
1st quarter 2010/11
Earnings before taxes 190,069 135,058
Depreciation and amortisation 30,944 26,275
Impairment losses on current assets (130,004) 1,619
Change in non-current provisions 7,969 5,594
Net losses from disposal of fixed assets 194 222
Valuation of derivatives (144,875) (24,055)
Net interest expense 10,376 10,308
Income taxes paid (24,010) (6,734)
Gross cash flow (59,337) 148,287
Change in receivables and other assets, including short-term security investments 223,414 34,772
Change in inventories (352,207) (706,621)
Change in current provisions (2,443) (16,199)
Change in liabilities (excl. borrowings) 209,247 403,080 Cash inflow (outflow in the prior year) from operating activities (net cash flow) 18,674 (136,681)
Additions to fixed assets (39,635) (30,211)
Proceeds from disposal of fixed assets 126 93
Interest paid 3,063 2,783
Cash outflow from investing activities (36,446) (27,335)
Proceeds from issuance of bonds and taking up borrowings 17,219 230,149
Payment for the redemption of bonds and borrowings (8,662) (42,670)
Interest paid (11,637) (12,095)
Cash outflow (inflow in the prior year) from financing activities (3,080) 175,384
Net changes in cash and cash equivalents (20,852) 11,368
Changes from exchange rate changes 589 87
Cash and cash equivalents at beginning of period 490,981 147,803
Cash and cash equivalents at end of period 470,718 159,258
AURUBIS – INTERIM REPORT FOR THE FIRST THREE MONTHS 2011/12 21
KONZERN-ZWISCHENABSCHLUSSERSTES HALBJAHR 2010/11INTERIM CONSOLIDATED FINANCIAL STATMENTS FOR THREE MONTHS 2011/12
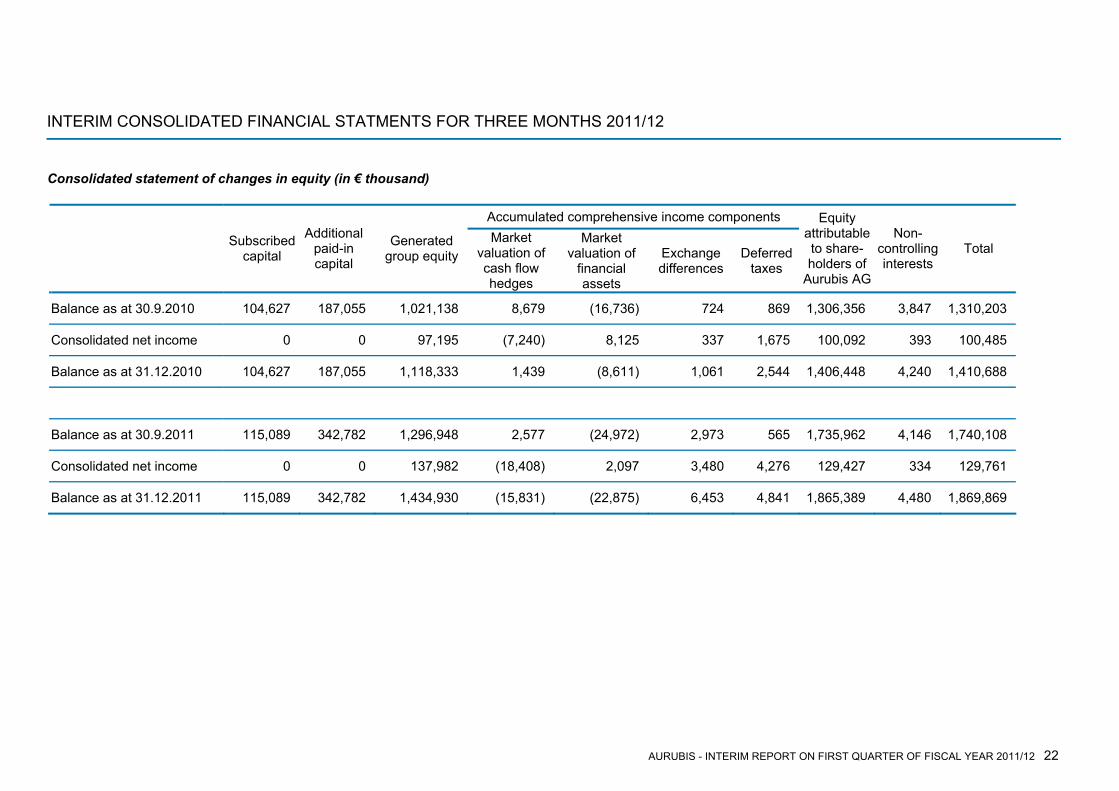
Consolidated statement of changes in equity (in € thousand)
Accumulated comprehensive income components Equity attributable to share-holders of
Aurubis AG
Additional paid-in capital
Non-controlling interests
Market valuation of cash flow hedges
Market valuation of
financial assets
Generated group equity
Subscribed capital Total Exchange
differences Deferred
taxes
Balance as at 30.9.2010 104,627 187,055 1,021,138 8,679 (16,736) 724 869 1,306,356 3,847 1,310,203
Consolidated net income 0 0 97,195 (7,240) 8,125 337 1,675 100,092 393
100,485
Balance as at 31.12.2010 104,627 187,055 1,118,333 1,439 (8,611) 1,061 2,544 1,406,448 4,240 1,410,688
Balance as at 30.9.2011 115,089 342,782 1,296,948 2,577 (24,972) 2,973 565 1,735,962 4,146
1,740,108
Consolidated net income 0 0 137,982 (18,408) 2,097 3,480 4,276 129,427 334 129,761
Balance as at 31.12.2011 115,089 342,782 1,434,930 (15,831) (22,875) 6,453 4,841 1,865,389 4,480 1,869,869
AURUBIS - INTERIM REPORT ON FIRST QUARTER OF FISCAL YEAR 2011/12 22
INTERIM CONSOLIDATED FINANCIAL STATMENTS FOR THREE MONTHS 2011/12
Selected notes to the consolidated financial statements
The accompanying interim group report of Aurubis AG includes interim consolidated financial statements and a Group management report in accordance with the stipulations of the German Securities Trading Act. The consolidated financial statements have been prepared in accordance with International Financial Reporting Standards (IFRS) for interim reporting as applicable in the EU. The accounting policies of the financial statements as at 30 September 2011 have been applied without amendment, with the exception of accounting standards that are to be applied for the first time. The interim consolidated financial statements and the interim Group management report for the first three months of fiscal year 2011/12 have not been reviewed by the auditors.
Standards to be applied for the first time
The amendments to IFRS 7 “Disclosures – Transfers of Financial Assets” that were adopted by the European Union in November 2011 in European law and are applicable for fiscal years beginning on or after 1 July 2011 will be applied in the annual financial statements for 2011/12.
Significant events following the balance sheet date
Aurubis intends to relocate the production of complex profiles to just one site in order to increase profitability in this sector. The plan is to move the plants in Yverdon-Les-Bains (Switzerland) to Olen (Belgium) and integrate them into the existing production plants. The process is expected to conclude this year.
AURUBIS - INTERIM REPORT ON FIRST QUARTER OF FISCAL YEAR 2011/12 23
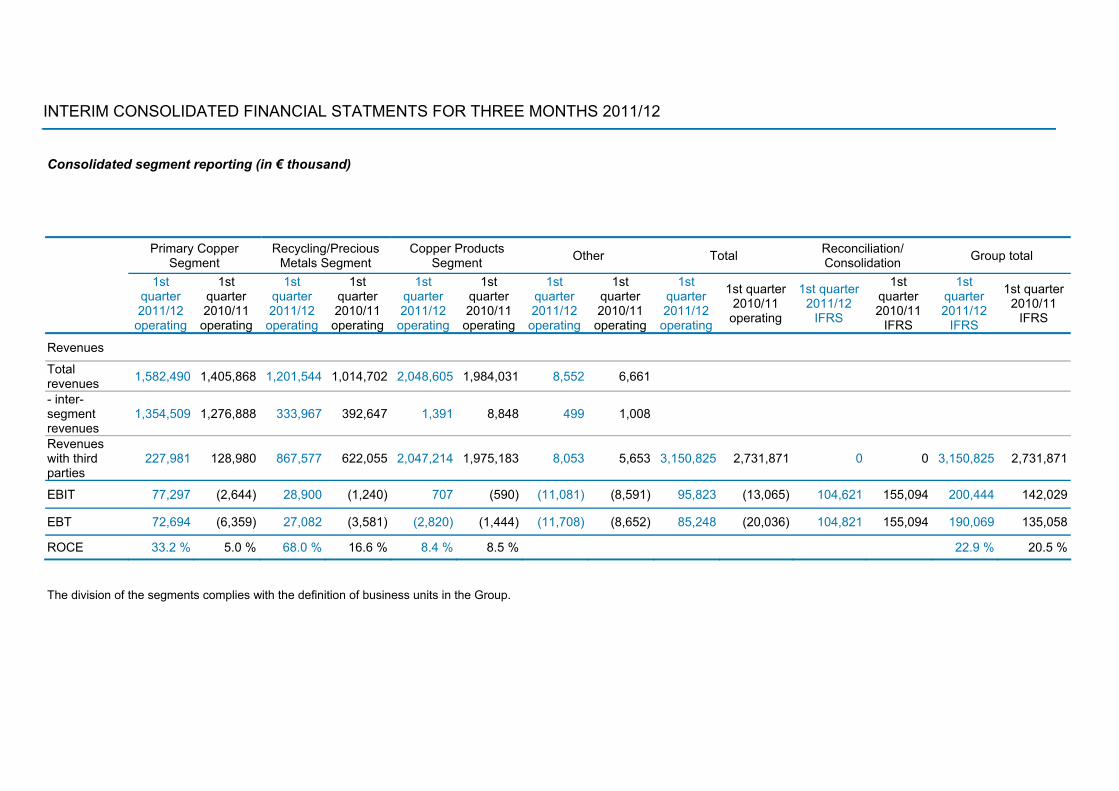
Consolidated segment reporting (in € thousand)
The division of the segments complies with the definition of business units in the Group.
Primary Copper Segment
Recycling/Precious Metals Segment
Copper Products Segment Other Total Reconciliation/
Consolidation Group total
1st quarter 2011/12
operating
1st quarter 2010/11
operating
1st quarter 2011/12
operating
1st quarter 2010/11
operating
1st quarter 2011/12
operating
1st quarter 2010/11
operating
1st quarter 2011/12
operating
1st quarter 2010/11
operating
1st quarter 2011/12
operating
1st quarter 2010/11
operating
1st quarter 2011/12
IFRS
1st quarter 2010/11
IFRS
1st quarter 2011/12
IFRS
1st quarter 2010/11
IFRS
Revenues
Total revenues 1,582,490 1,405,868 1,201,544 1,014,702 2,048,605 1,984,031 8,552 6,661
- inter-segment revenues
1,354,509 1,276,888 333,967 392,647 1,391 8,848 499 1,008
Revenues with third parties
227,981 128,980 867,577 622,055 2,047,214 1,975,183 8,053 5,653 3,150,825 2,731,871 0 0 3,150,825 2,731,871
EBIT 77,297 (2,644) 28,900 (1,240) 707 (590) (11,081) (8,591) 95,823 (13,065) 104,621 155,094 200,444 142,029
EBT 72,694 (6,359) 27,082 (3,581) (2,820) (1,444) (11,708) (8,652) 85,248 (20,036) 104,821 155,094 190,069 135,058
ROCE 33.2 % 5.0 % 68.0 % 16.6 % 8.4 % 8.5 % 22.9 % 20.5 %
INTERIM CONSOLIDATED FINANCIAL STATMENTS FOR THREE MONTHS 2011/12
INTERIM CONSOLIDATED FINANCIAL STATMENTS FOR THREE MONTHS 2011/12
Hamburg, 14 February 2012
Aurubis AG
The Executive Board
Peter Willbrandt Dr Stefan Boel Erwin Faust Dr Michael Landau
Disclaimer: Forward-looking statements This information contains forward-looking statements based on current assumptions and forecasts. Various known and unknown risks, uncertainties and other factors could have the impact that the actual future results, financial situation or developments differ from the estimates given here. We assume no liability to update forward-looking statements.
AURUBIS – INTERIM REPORT FOR THE FIRST THREE MONTHS 2011/12 25
DATES AND CONTACTS
V. DATES AND CONTACTS
FINANCIAL CALENDAR
Annual General Meeting 2012 1 March 2012
Dividend payment 2012 2 March 2012
Interim report on the first half-year 2011/12 14 May 2012
Interim report on the first nine months 2011/12 14 August 2012
INVESTOR RELATIONS CONTACTS
Angela Seidler Head Tel. +49 40 7883-3178 e-mail: [email protected]
Dieter Birkholz Tel. +49 40 7883-3969 e-mail: [email protected]
Ken Nagayama Tel. +49 40 7883-3179 e-mail: [email protected]
GROUP COMMUNICATIONS CONTACTS
Michaela Hessling Head Tel. +49 40 7883-3053 e-mail: [email protected]
Matthias Trott Tel. +49 40 7883-3037 e-mail: [email protected]
AURUBIS – INTERIM REPORT FOR THE FIRST THREE MONTHS 2011/12 26