Embed Size (px)
Citation preview

International Institute for Applied Systems Analysis Registration number: ZVR 524808900
International Institute for Applied Systems Analysis Schlossplatz 1 A-2361 Laxenburg, Austria
Tel: +43 2236 807 342Fax: +43 2236 71313
E-mail: [email protected]: www.iiasa.ac.at
Interim Reports on work of the International Institute for Applied Systems Analysis receive onlylimited review. Views or opinions expressed herein do not necessarily represent those of theInstitute, its National Member Organizations, or other organizations supporting the work.
Interim Report IR-12-007
Historical diffusion of mobile phones and its impact on energy demand: Findings and outlook
Nuno Bento
Approved by
Arnulf Grubler Transitions to New Technologies (TNT) Program
May 21, 2012

ii
Contents
1. Introduction ........................................................................................................... 1
2. Fast and intense development of the market after the nineties .............................. 3
3. Affordability of mobile service and handsets as a driver of demand .................... 7
4. The global diffusion of mobile phones: a logistic model approach ...................... 7
5. Estimating the energy capacity of mobile phones worldwide with the help of a field experiment .......................................................................................................... 10
6. Outlook of the energy needs of mobile phones for the coming years ................. 14
7. How fast can the production of mobile phones be scaled up to enable a rapid growth in demand? ..................................................................................................... 17
8. Conclusion ........................................................................................................... 23
Appendix: Methodologies for calculating Lorenz curves for different technologies . 25
Supplementary material .............................................................................................. 26
References .................................................................................................................. 26

iii
Abstract
Few technologies in history have diffused as intensively and fast as mobile phones, changing the way people interact in society in a matter of years. Rapid spatial diffusion has been another feature of the growth, improving communication in low income countries and raising the life standards of the poor. While demand already shows signs of saturation in developed countries, the potential for growth remains important in other countries. Impacts on energy consumption are assessed by combining the inputs from a real field measurement with an estimated demand from a logistic model. Even though the energy consumed in phone charging is not very significant (6-8 TWh), this demand can be substantially higher when the infrastructure needs and the large capacity of new smartphones are included. Finally, it is shown that the capacity produced of cellular phones reached a level that is comparable to the scale of diffusion of supply energy technologies with similar rates of diffusion.
Keywords: technological change; diffusion; economies of scale; mobile phones.

iv
Acknowledgments
Grateful acknowledgement is made to the International Institute for Applied Systems Analysis for a grant in support of the research on which this article is based. The author would also like to thank Arnulf Grübler, Charlie Wilson, Jonathan Koomey, Peter May-Ostendorp, Niels Schulz, Narasimha Rao, Keywan Riahi, and Pat Wagner.

v
About the Authors
Nuno Bento was Postdoctorate Scholar at the International Institute of Applied Systems Analysis (IIASA), Austria, between February 2011 and March 2012. He is currently an Invited Assistant Professor of Sustainable Development at the University of Porto School of Economics (FEP), Portugal. In 2010, Nuno received his Ph.D. degree in Economics from the University of Grenoble, France, following a research on new energy technologies conducted at the Laboratoire d'Economie de la Production et de l'Intégration Internationale (LEPII-EPE-CNRS).

1
Historical diffusion of mobile phones and its impact on energy demand: Findings and outlook
Nuno Bento
1. Introduction
Cellular phones constitute the largest electronic market, having experienced an explosive diffusion in the past two decades, with annual sales of 1.6 billion units in 2010 which is a growth of 32 % compared with 2009 (Gartner, 2011).1 In 2011 there were over 400 million shipments per quarter, almost as much as the number of devices sold annually seven years before (In-Stat/MDR, 2004).
Mobile phones, together with computers, form the backbone of the information and communication technology (ICT) sector, which is at the center of the fifth long wave growth after the beginning of the industrial revolution (Perez, 2002; Freeman & Louçã, 2001; Ayres, 1990). The recent ICT paradigm is probably the most inclusive in history. The number of mobile phone subscribers reached 5.3 billion worldwide in 2010, of which 1.6 billion are in China and India (ITU, 2011). On the other hand, the growing use of mobile phones and ICT may reduce greenhouse gas (GHG) emissions in other sectors by providing solutions that substitute travel, transport, physical products and so forth (Berkhout & Hertin, 2004). However, the direction of that relation is not always clear. For instance, in some cases telecommunications are more complementary to travel demand than substitute (Choo & Mokhtarian, 2007; Hilty et al., 2006).
A mobile phone (also referred to hereafter as cellular phone or cell phone) is a wireless instrument that allows communication by radiowave within a geographic area covered by a cellular network system. The network is operated by a telephone company that connects it to the public telephone network (Encyclopædia Britannica, 1992).2 The origins of the radiophone go back to Reginal Fassenden’s invention of radio transmission, and shore-to-ships demonstrations in the United States during the Second World War. In 1973 Martin Cooper from Motorola made the first mobile phone call using a heavy prototype model. The first commercially automated cellular network was launched in Japan by NTT in 1979, followed by the Nordic Mobile Telephone (NMT) system in Denmark, Finland, Norway and Sweden in 1981. A similar network started operating in Chicago in the United Sates in 1983, and then countless systems have emerged in the rest of the world.
1 For a complete overview of global statistics on mobile phones, see : http://mobithinking.com/mobile-marketing-tools/latest-mobile-stats . 2 For a good review of the history of the mobile phone, see Encyclopedia Britannica (1992) and http://en.wikipedia.org/wiki/History_of_mobile_phones#Emergence_of_automated_mobile_phone_services (last accessed in 9/1/2012)

2
The first person-to-person short message service (SMS) was sent in Finland in 1993. Since then the technology has improved substantially, both technically and ergonomically, broadening the set of services provided by mobile phones (Windrum, Diaz, & Filiou, 2009). Modern phones include features such as email, internet access, short-range wireless communications (e.g., Bluetooth), photography, and music player. The new category of phones known as smartphones feature general computing capabilities that allow them to send and receive large amounts of information and run more complex applications. This technological progress was possible thanks to a new generation of phones and networks supporting higher speed connections and greater data transfers. The 4G is the fourth generation of cellular phone mobile communications standards which was recently launched in several countries, promising a speed of data transfer one order of magnitude higher than the previous generation.
The diffusion of mobile phones has had a strong influence in many dimensions of peoples’ lives, being used for different purposes, such as personal or professional communication and assistance in the event of an emergency. Because of the simple system architecture, needing the installation of base stations connected to a central office, a broad coverage of people and area can be reached with relatively low costs compared to a fixed telephone network. Therefore cellular phones penetrate more easily into areas where landlines and Internet are not available, providing access to communication for those who live in poor and remote regions. They are thus able to diffuse in the least developed countries as well, contributing to the local economy by stimulating commercial activity and the creation of thousands of jobs in the selling and repairing of the handsets (UNCTAD, 2011).
New forms of mobile phone use are growing in importance. This is the case of mobile money, such as mobile banking, financial transactions by secured SMS text message or direct mobile billing, which are more and more used, mainly in Africa and Asia-Pacific region, reaching more than 40 million users (GSM Association, 2012). Mobile money is important for people and businesses as it reduces transaction costs, facilitates payments, and improves security. However the lack of service availability remains an important barrier to mobile uptake in the least developed countries, with more than 30% of the population being out of reach of mobile signal, and an even higher share in rural areas (UNCTAD report 2011).
This paper studies almost three decades of cellular phones diffusion, from the early networks in Scandinavia and Japan to the present. The research aims to understand the dynamics of cellular phone growth and its energy impacts: What is the trend in the use of mobile phones? What are the energy needs of the devices? And how does the growth of production compare with other technologies?
The paper is organized around five points. The first point presents briefly the story of the mobile phone and its development in the market, showing quantitatively the extent of the technological change. Secondly, the growth is analyzed with the help of an empirical model, which emphasizes the fast and intensive diffusion. The third point investigates the energy requirements of the diffusion through the examination of the needs per phone. The fourth point discusses the prospects for mobile phone growth in the coming decades, and the impact in terms of energy usage. Finally the last point analyses production dynamics, and compares the scale of growth with other technologies.

3
2. Fast and intense development of the market after the nineties
In the absence of data on global mobile phones in use, the number of cellular phone subscriptions was taken as a proxy of the real number of devices in operation (Figure 1).
Figure 1 The evolution of mobile phone subscriptions globally and in selected regions (semi-log axis)
Source: ITU World Telecommunication (ITU, 2011).
Three phases can be identified in the growth of the number of mobile phones in use:
‐ in the late 1970s mobile phones first penetrated the market in Scandinavian countries and Japan;
‐ in the 1990s growth accelerated in the developed countries with the exception of the U.S., where the diffusion was very intense after the first half of the 1980s, becoming shortly after the leading country in terms of the number of subscriptions;
‐ after the year 2000 growth stabilized in developed countries, while global subscriptions kept growing pushed by diffusion in developing countries (included in “Others”).
The last point is more clearly shown by comparing the diffusion in the United States, which was for a long time the world’s largest cellular phone market, with the recent growth in China and India. Even though the diffusion started a decade later in China and afterwards in India, the former caught up with the U.S. in the early 2000s, while subscriptions in India passed the US numbers in 2007. Thus worldwide growth is now being led by China and India, with 859 and 752 billion subscriptions in 2010 respectively, comparing with 279 billion in the US (ITU, 2011).
The growth of mobile phones is concomitant with the reduction in the number of fixed telephone subscriptions (Figure 2). As the evidence suggests, cell phone radiotelephony

4
is gradually replacing landline communication almost everywhere in the world, though the latter is still important for business, DSL broadband access support, and in low-income economies where low tariffs continue to make fixed phones more attractive than mobile services (UNCTAD, 2011).
Figure 2 The number of fixed telephone and mobile phone subscriptions per 100 inhabitants between 2000 and 2010
Note: The graph is plotted accordingly to the logit transform. The division of the market share (F) by the remaining share (1-F) yields a straight line when plotted on a logarithmic scale. Source: ITU World Telecommunication (ITU, 2011).
The increasing diffusion of mobile phones has a major potential for poverty relief whenever it provides access to those living in poor and remote communities who are unreachable by landline connections. By improving the life conditions of the least developed population, mobile communication contributes to reducing the inequalities between rich and poor countries. Figure 3 presents a measure of the inequality of mobile phones subscriptions in comparison with other goods for a group of 27 countries (including developed and developing nations) covering roughly 60% of the world population.
5
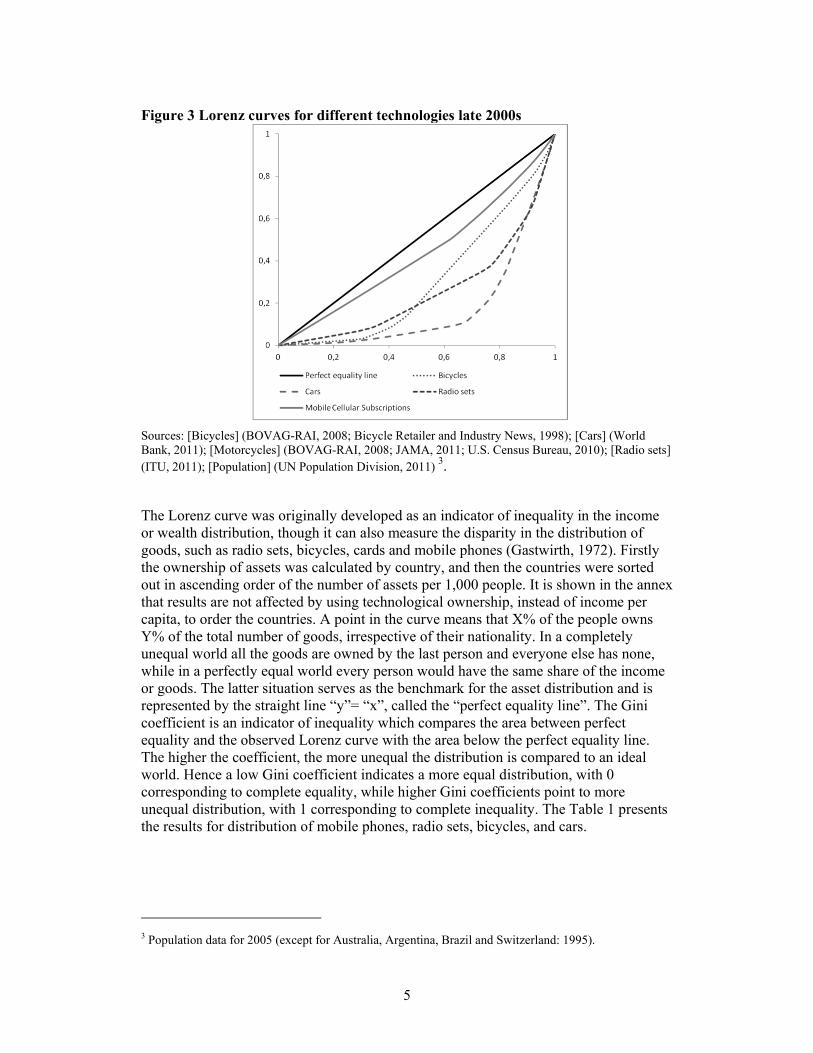
Figure 3 Lorenz curves for different technologies late 2000s
Sources: [Bicycles] (BOVAG-RAI, 2008; Bicycle Retailer and Industry News, 1998); [Cars] (World Bank, 2011); [Motorcycles] (BOVAG-RAI, 2008; JAMA, 2011; U.S. Census Bureau, 2010); [Radio sets] (ITU, 2011); [Population] (UN Population Division, 2011) 3.
The Lorenz curve was originally developed as an indicator of inequality in the income or wealth distribution, though it can also measure the disparity in the distribution of goods, such as radio sets, bicycles, cards and mobile phones (Gastwirth, 1972). Firstly the ownership of assets was calculated by country, and then the countries were sorted out in ascending order of the number of assets per 1,000 people. It is shown in the annex that results are not affected by using technological ownership, instead of income per capita, to order the countries. A point in the curve means that X% of the people owns Y% of the total number of goods, irrespective of their nationality. In a completely unequal world all the goods are owned by the last person and everyone else has none, while in a perfectly equal world every person would have the same share of the income or goods. The latter situation serves as the benchmark for the asset distribution and is represented by the straight line “y”= “x”, called the “perfect equality line”. The Gini coefficient is an indicator of inequality which compares the area between perfect equality and the observed Lorenz curve with the area below the perfect equality line. The higher the coefficient, the more unequal the distribution is compared to an ideal world. Hence a low Gini coefficient indicates a more equal distribution, with 0 corresponding to complete equality, while higher Gini coefficients point to more unequal distribution, with 1 corresponding to complete inequality. The Table 1 presents the results for distribution of mobile phones, radio sets, bicycles, and cars.
3 Population data for 2005 (except for Australia, Argentina, Brazil and Switzerland: 1995).

6
Table 1 Gini coefficients of mobile phones and other technologies
Source: [Bicycles] (BOVAG-RAI, 2008; Bicycle Retailer and Industry News, 1998); [Cars] (World Bank, 2011); [Motorcycles] (BOVAG-RAI, 2008; JAMA, 2011; U.S. Census Bureau, 2010); [Radio sets] (ITU, 2011); [Population] (UN Population Division, 2011).
An interesting finding from the Lorenz curve analysis is that mobile phones have become the most democratic technology, surpassing radio sets, which were long considered the most popular technology. In fact mobile phones present the lowest Gini coefficient (13.83%) compared to bicycles (39.7%) and radio sets (49.1%). As a matter of comparison, in the last decade the lowest income Gini coefficient was 25% for Sweden in 2000 and the highest 67% for South Africa in 2006.4 Figure 4 presents the evolution of cellular phone distribution in the last decade.
Figure 4 Comparison of the cell phone ownership in 2000 and 2010 (n=27 countries)
In the last ten years there was an enormous evolution in the access to mobile communication. The number of subscribers is attaining saturation in developed countries, as discussed later. The disparity in the ownership of mobile phones has been reduced with the increasing use of cellular phones in countries with the lowest incomes. The Gini index passed from 63.5 % in 2000 to 13.83 % ten years later. In spite of the novelty and fast diffusion, mobile phones have had an enormous impact in almost all
4 World Bank GINI index, http://data.worldbank.org/indicator/SI.POV.GINI, accessed on December 27, 2011.
0
0.25
0.5
0.75
1
0 0.2 0.4 0.6 0.8 1
Cumulative share of goods
Cumulative share of population
Perfect equality line 2000 2010
(n = 27 countries) Gini index (in %) Rank Cell phones 13.83 1st Bicycles 39.7 2nd
Radio sets 49.1 3rd
Cars 64.9 4rd

7
subgroups of the population. This was possible because costs did not inhibit the expansion of demand, especially in low-income countries.
3. Affordability of mobile service and handsets as a driver of demand
The decreasing price of handsets and mobile phone services has been a decisive factor in the growth of demand. According to a Nokia study about the affordability of mobile communications, between 2005 and 2010 the global average price for the monthly mobile basket aimed at a low-income user decreased to $11.46, a 14 %decline. At the same time, the decline of the handset price alone was an even higher of 43 %, while its share in the mobile price basket passed from 11% to 7% (Nokia Siemens Networks, 2009).5 Hence the price of the equipment is becoming less of a barrier to diffusion in low income countries. However, most of the devices in developing countries are low-end handsets with minimal features, and the high price of the new smartphones prevents the adoption of those phones (UNCTAD, 2011). Just 13.2% of the world’s mobile phones are smartphones, while this share exceeds 30% in countries like the U.S., Germany or Britain, and 50% in Finland and Sweden (O’Brien, 2012). This question must be addressed in order to promote the access to Internet in those countries, and to avoid the increase of disparities between developed and developing regions in the information and telecommunication age. A recent study reported that the top 1% of mobile users consume half of world’s traffic, while 10% of users are consuming 90 % of wireless bandwidth (64% of users were using a laptop, and a third were using a smartphone). In 2009, the top 3 % of heavy users had generated 40% of network traffic (O’Brien, 2012).
4. The global diffusion of mobile phones: a logistic model approach
The former section demonstrates that mobile phones show signs of saturation in developed countries, while experiencing an intense growth in other regions of the world. In the following points the diffusion of cellular phones is analyzed with the help of a logistic model - see Box 1 for a presentation of the model.
Box 1 Empirical analysis based on logistic curves The research uses logistic growth models to fit actual data in order to identify patterns in the historical growth of mobile phones. The examination of simple growth rates would be quite volatile and influenced by short-term variations. Instead, fitting data with logistic functions can more reliably identify long term tendencies when technology penetration follows a regular pattern.6 There is a wide range of evidence supporting the use of the three-parameter logistic function to represent long term technological transitions, namely in the energy and transport field (Grübler, 1999, 1998; Marchetti & Nakicenovic, 1979). This function is inspired by the logistic model (Fisher & Pry, 1971)—a S-shaped model assuming symmetry around the inflection point—representing technological diffusion as follows: 5 Data and comparisons from Nokia 2011 study ‘Total Cost of Ownership’ cited in UNCTAD (2011). 6 Other models, such as the Gompertz or Sharif-Kabir, can also be used though the logistic function fits the data better and thus was chosen for this study. See Grubler (1998) for more details about diffusion models. Various diffusion models were tested with the help of the Logistic Substitution Model (LSM II) software developed in-house at the International Institute of Applied Systems Analysis (IIASA) which is also available online at http://www.iiasa.ac.at/Research/TNT/WEB/Software/LSM2/lsm2-index.html?sb=3
8
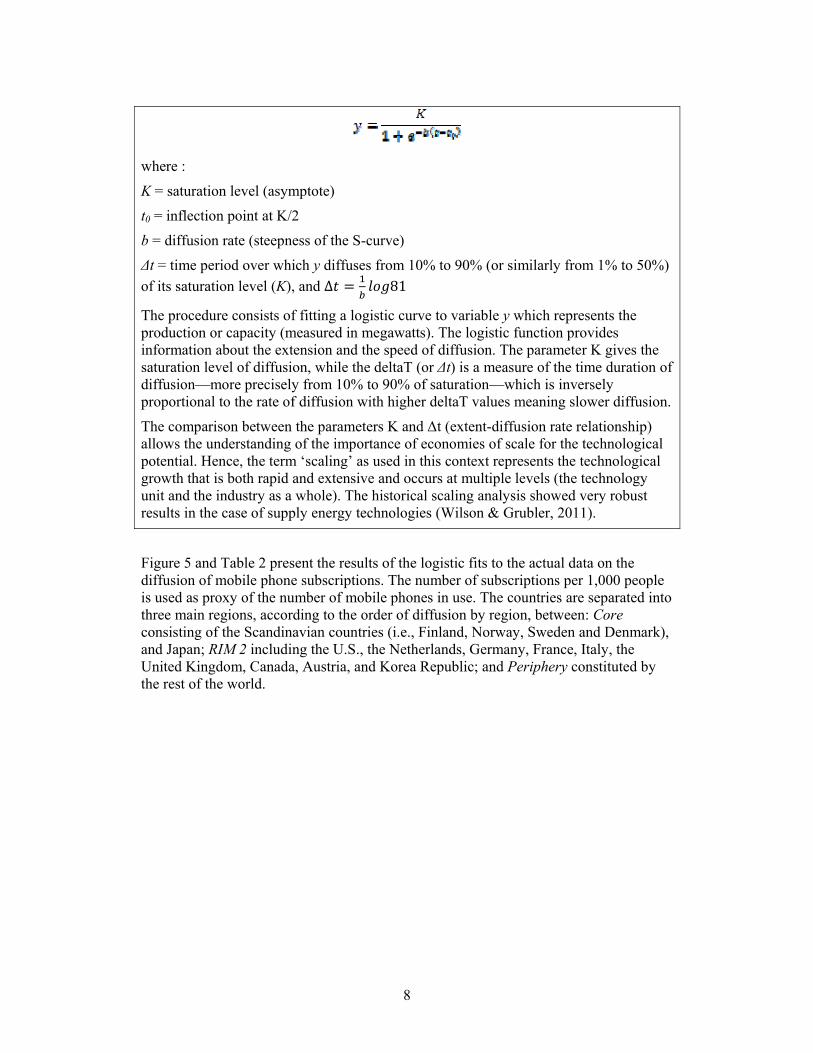
where :
K = saturation level (asymptote)
t0 = inflection point at K/2
b = diffusion rate (steepness of the S-curve)
Δt = time period over which y diffuses from 10% to 90% (or similarly from 1% to 50%)
of its saturation level (K), and ∆ 81
The procedure consists of fitting a logistic curve to variable y which represents the production or capacity (measured in megawatts). The logistic function provides information about the extension and the speed of diffusion. The parameter K gives the saturation level of diffusion, while the deltaT (or Δt) is a measure of the time duration of diffusion—more precisely from 10% to 90% of saturation—which is inversely proportional to the rate of diffusion with higher deltaT values meaning slower diffusion.
The comparison between the parameters K and Δt (extent-diffusion rate relationship) allows the understanding of the importance of economies of scale for the technological potential. Hence, the term ‘scaling’ as used in this context represents the technological growth that is both rapid and extensive and occurs at multiple levels (the technology unit and the industry as a whole). The historical scaling analysis showed very robust results in the case of supply energy technologies (Wilson & Grubler, 2011).
Figure 5 and Table 2 present the results of the logistic fits to the actual data on the diffusion of mobile phone subscriptions. The number of subscriptions per 1,000 people is used as proxy of the number of mobile phones in use. The countries are separated into three main regions, according to the order of diffusion by region, between: Core consisting of the Scandinavian countries (i.e., Finland, Norway, Sweden and Denmark), and Japan; RIM 2 including the U.S., the Netherlands, Germany, France, Italy, the United Kingdom, Canada, Austria, and Korea Republic; and Periphery constituted by the rest of the world.

9
Figure 5 The diffusion of mobile phone subscriptions: Actual data and fits (dashed lines)
Table 2 Parameters of the fit curves Actual %K K t0 Δt R2
Core - Gompertz fit 93% 1309 1998 16,1 99,84% Rim 2 - Gompertz fit 92% 1237 2000 12,9 99,58%
Periphery - Logistic fit 64% 1154 2008 12,6 99,96% Global - Logistic fit 61% 1271 2008 15,4 99,91%
The parameters of the fit curves clearly confirm that the growth of mobile phone subscriptions per 1,000 people is attaining saturation in both Core and Rim 2 regions, while it is far from saturation in the other countries. The number of subscriptions tends to saturate around 1.3 subscriptions per capita in developed countries of the Core and Rim 2 areas. The current value in the Periphery is around 0.8 contracts per capita, still far from saturation, which was estimated around 1.2 subscriptions per capita.
The estimated asymptotes are very high with more than one contract per capita. That confirms the enormous success of mobile phones in attaining a large share of the population. Nevertheless, people may use more than one cell phone, especially in developed countries, for several reasons: personal and business use; low-tariff calls (contracts with different operators may lower the cost of communication with interlocutors using other networks); intense use of cellular phones; travel; changing of country; etc. In addition the recent success of dual SIM card phones in developing countries, allowing adherents to use different operators at the same time (Gartner, 2011; UNCTAD, 2011), reveals the limits of the assumption that people uses as many cell phones as the number of subscriptions. However it is not likely that these considerations affect the accuracy of the scale of the numbers.
10
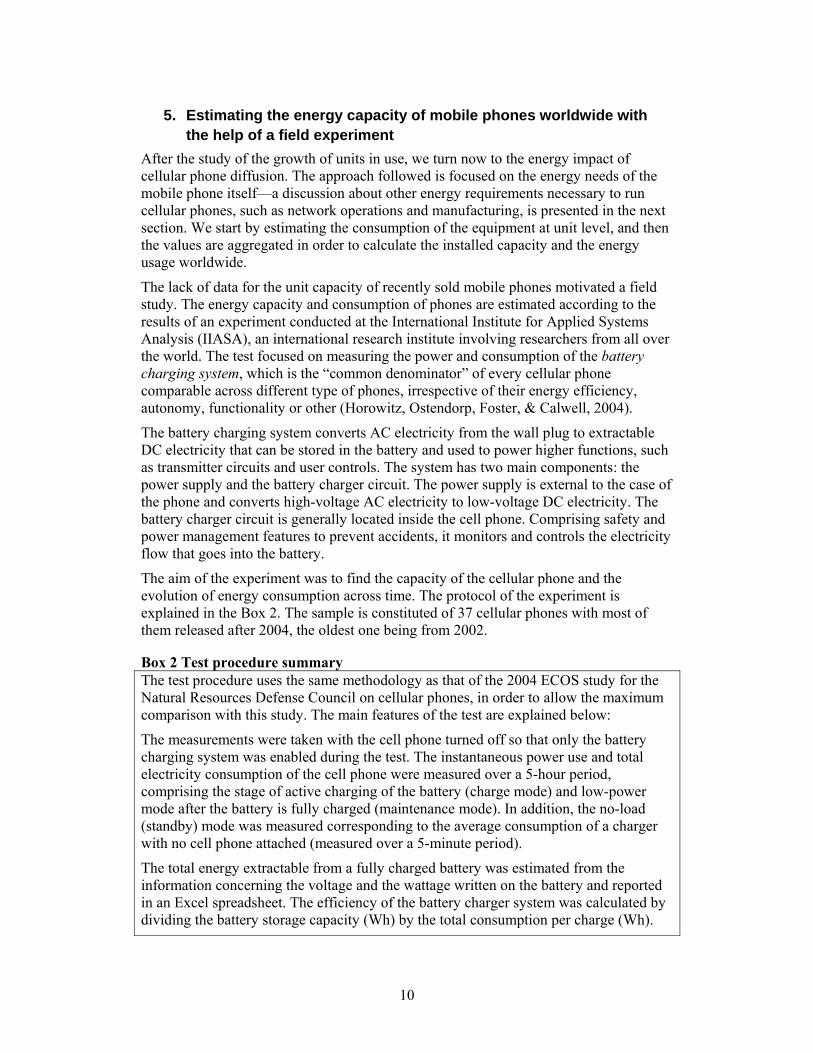
5. Estimating the energy capacity of mobile phones worldwide with the help of a field experiment
After the study of the growth of units in use, we turn now to the energy impact of cellular phone diffusion. The approach followed is focused on the energy needs of the mobile phone itself—a discussion about other energy requirements necessary to run cellular phones, such as network operations and manufacturing, is presented in the next section. We start by estimating the consumption of the equipment at unit level, and then the values are aggregated in order to calculate the installed capacity and the energy usage worldwide.
The lack of data for the unit capacity of recently sold mobile phones motivated a field study. The energy capacity and consumption of phones are estimated according to the results of an experiment conducted at the International Institute for Applied Systems Analysis (IIASA), an international research institute involving researchers from all over the world. The test focused on measuring the power and consumption of the battery charging system, which is the “common denominator” of every cellular phone comparable across different type of phones, irrespective of their energy efficiency, autonomy, functionality or other (Horowitz, Ostendorp, Foster, & Calwell, 2004).
The battery charging system converts AC electricity from the wall plug to extractable DC electricity that can be stored in the battery and used to power higher functions, such as transmitter circuits and user controls. The system has two main components: the power supply and the battery charger circuit. The power supply is external to the case of the phone and converts high-voltage AC electricity to low-voltage DC electricity. The battery charger circuit is generally located inside the cell phone. Comprising safety and power management features to prevent accidents, it monitors and controls the electricity flow that goes into the battery.
The aim of the experiment was to find the capacity of the cellular phone and the evolution of energy consumption across time. The protocol of the experiment is explained in the Box 2. The sample is constituted of 37 cellular phones with most of them released after 2004, the oldest one being from 2002.
Box 2 Test procedure summary The test procedure uses the same methodology as that of the 2004 ECOS study for the Natural Resources Defense Council on cellular phones, in order to allow the maximum comparison with this study. The main features of the test are explained below:
The measurements were taken with the cell phone turned off so that only the battery charging system was enabled during the test. The instantaneous power use and total electricity consumption of the cell phone were measured over a 5-hour period, comprising the stage of active charging of the battery (charge mode) and low-power mode after the battery is fully charged (maintenance mode). In addition, the no-load (standby) mode was measured corresponding to the average consumption of a charger with no cell phone attached (measured over a 5-minute period).
The total energy extractable from a fully charged battery was estimated from the information concerning the voltage and the wattage written on the battery and reported in an Excel spreadsheet. The efficiency of the battery charger system was calculated by dividing the battery storage capacity (Wh) by the total consumption per charge (Wh).

11
In addition, the mobile phone users were asked about the number of times per week they charged their devices, and if they waited until the battery was empty to charge it again. When they did not wait until the battery was empty, an average charge of three-quarters of the battery was assumed. This information allowed the estimation of the weekly consumption of the phone and, consequently, the annual consumption, by multiplying that value by 52 weeks.
The results of the experiment are shown in the Figures 6-7. The difference between the rated power and the measured maximum power of the charging system was another reason for the realization of the experiment. The rated power is typically several times the actual power used, and the electricity used by these devices is determined by the mix of modes of charge—when plugged in but not charging without a phone connected there is one power level, when plugged in and charging there is another power level, and when plugged in and connected to a cell phone but not charging (i.e., the battery is full) there is usually another power level. Figure 6 shows the results for the rated and measured capacity of mobile phones. The average maximum rated power was 34 Watts (12) and the average maximum measured power 4.5 W (1.15)—standard deviation in brackets, measured by the input power of the charger.
Figure 6 Rated versus measured maximum power of the mobile phones
The evolution of the maximum capacity of the cellular phones across the time shows a gradual increase, with a growth rate of 4.5 % per year after 2002 (Figure 7). The capacity trend found in the trials confirms the results of the ECOS’ 2004 study for the years between 2002 and 2003. In later years smartphones contributed significantly to the upward trend in measured power capacity.

12
Figure 7 Maximum measured capacities of cellular phones by year of the device
* Smartphones on empty dots.
Manufacturers have been adding more functions to the cellular phones. Smartphones are the latest example of “convergence devices,” concentrating a multiplicity of functions such as web browser, GPS, digital camera, MP3 player, among many others. The ever-increasing speed of connections afforded by the fourth-generation (4G) cellular phone networks allows fast data transfers, enlarging the variety of services that can be supplied by a mobile phone, for example videoconferences, file downloads, e-mail service, streaming video. The introduction of more functions into the device, together with higher rates of data transfers, increases the power needs of the cellular phone.
The energy efficiency of cellular phones observed during the last decade was recently reversed with the diffusion of smartphones. The consumption of mobile phones per charge knew a rebound in the past 2 to 3 years passing from 2-6 to 6-18 Wh, averaging 10 Wh during this period (Figure 8–left). The annual consumption was calculated by asking users about their habits in terms of phone charging, especially the number of times they charged their devices (Figure 8– right). The average annual consumption of the 37 phones was 1.2 kWh (standard deviation: 720), though with high variations between observations, as is shown by the standard deviation. Smartphones are clearly reversing the efficiency trend, pushing it towards 2.5-3 kWh. However, it is likely that the average consumption was higher for old mobile phones due to the poor standby performance of chargers.7
7 Malmodin et al. (2011) reported 3 kWh/year citing a review of life-cycle analysis (LCA) of mobile phone carried out by Ericsson/Sony Ericsson using both available and internal data from 1995 to 2009, while Horowitz et al. (2004) found an average power use of 6 kWh/year by phones sold between 2002 and 2004 – though using very pessimistic assumptions concerning usage and charging of the phones, for instance assuming 12 hours per day of standby (charger left plugged in without being connected to the cell phone).

13
Figure 8 Average consumption of cellular phones per recharge and annually by year of the device *
* Smartphones on empty dots.
The energy needs of mobile phones worldwide can therefore be estimated with the information on the number of phones (using subscriptions as a proxy) and the power capacity and consumption at unit level. The measured maximum power of the phones was estimated at 4.5-6 W, which multiplied by 5.4 billion phones, translates into 24-32 GW of worldwide installed capacity. On the other hand, the average consumption per phone of 1.13-1.5 kWh multiplied by all the phones in use gives a global consumption of 6-8 TWh. That is equivalent to the production of a 1 GW nuclear reactor running a year-round. Thus the energy demand of mobile phones is relatively modest in spite of the huge number of devices in use. Nevertheless the consumption of the end use equipment is just one part of the energy demand, which also include the energy required to run the networks, and that can be substantially higher than the consumption of the devices – as discussed in the next point.

14
6. Outlook of the energy needs of mobile phones for the coming years
What is the energy consumption of cellular phones in use? How much electricity will mobile phones need in the future? This point addresses these questions in a quantitative manner with the help of the parameters of the logistic fits that were found in the past points, as well as possible scenarios for the evolution of the capacity of phones in the future.
The existing number of mobile phones can be converted into capacity through the multiplication of the number of devices in use by the average capacity of the phones calculated in the previous point. The capacity per thousand inhabitants by region is presented in the Figure 9, showing actual data and fits. The parameters of the fits are shown in the Table 3, as well as the calculation of the respective total capacity.
Figure 9 Capacity of mobile phones in use per 1,000 inhabitants, by region, actual data and fits (dashed lines)
See parameters and types of fits in the Table 3.
The capacity of cellular phones in use is attaining saturation in the Core region with 5.9 kW per thousand subscribers, which is the highest level among all regions. It is also approaching saturation in the Rim 2 area, but the diffusion of mobile phones still has a great potential in the Periphery. In addition, the total capacity per region was calculated by multiplying the estimated saturation of the capacity per thousand subscriptions by the population, when 99% of the asymptote is attained—that year is found from the parameters of the logistic curve.8 Present population and forecast numbers are from the United Nations (UN Population Division, 2011).
8 In case of logarithmic fit, the year when 99% of the saturation level is attained (99%T) is calculated by adding Δtto the inflexion point. Because of the symmetry of the logistic curve, Δt is equivalent to the number of years between 10% and 90% or 50% and 99% of the diffusion potential. In case the fit is a Gompertz curve, the 99%T was found directly by extending the trend.

15
Table 3 Parameters of the fits of the cellular phones capacity t0 Δt 99%T
Population (at 99%T)
K Capacity saturation Fit
units Year # of years Year Thousand units (a)
KW per 1,000 inhab. (b)
MW [(a x b)/1000]
Type
GLOBAL 2008 15 2023 7867734 5.7 44996 logistic
CORE 1998 16 2023 150432 5.9 886 Gompertz
RIM 2 2000 13 2019 719977 5.6 4007 Gompertz
PERIPHERY 2008 13 2020 6781726 5.2 35226 logistic
The global capacity of cellular phones is expected to saturate around 45 GW with nearly 10 billion units in use. That number compares with the current 34-32 GW of capacity calculated in the previous section through the number of existing subscribers. The maximum potential (35 GW) is to be attained in the Periphery area, which is basically composed of minor OECD and developing countries, including China and India. If the energy usage per phone is going to be the same as in our sample, i.e., around 1.5 kWh/year, the annual consumption of mobile phones (on charging) would be 16 TWh worldwide, double the present figure. Most of the energy demand will come from the Periphery, especially from developing countries (Figure 10).
Figure 10 Distribution of the energy demand from phone charging by region (2000-2030)
This is a first optimal approximation of the consumption of cellular phones, though it gives an incomplete picture of the energy needs that are required to support mobile communication. Firstly, the penetration of smartphones in the market is raising the energy needs of the phone, which may have a sizeable impact on energy demand. Secondly, a more systematic approach must take into account the consumption of mobile phone networks in order to produce more accurate estimates of the energy consumption.

16
Figure 11 estimates the impact of the increasing share of smartphones on the energy demand, compared with the scenario where all new mobile are from the normal type with no additional energy needs (4.5 W/phone). Two scenarios were considered for the wattage of the smartphones: the first one takes into account the average power of mobile phones from 2010 that were measured in the field trial (5 W/phone); and the second one takes the same average but for smartphones from 2011 (6.2 W/phone). Even though energy needs are rising to power more functionalities of the phone and faster data transfer, it is reasonable to assume that the average wattage of the phone will not be much different from the value found for 2011, unless there is an unpredictable technological jump in batteries that dramatically raises the density of electricity storage. Additionally, the share of smartphones in the market is assumed to grow at the same rate as in the previous two years, attaining 60% of sales in 2030, and 40% of the phones in use by that time. This assumption is cautious considering that the diffusion of smartphones may follow a logistic path similar to mobile phones in the past, rather than a linear growth.
Figure 11 The impact of smartphones in terms of additional energy consumption*
* linear growth of smartphone share in the market is assumed up to 2030.
Global capacity rises to 50 GW in 2030 in the scenario where smartphones have the 2010 wattage, or up to 55 GW if the 2011 wattage is assumed instead. In terms of energy use, the penetration of the new generation of phones would increase the energy demand for charging from 13-16 TWh (Figure 10) to 20 TWh in 2030, 4-7 TWh more than in the scenarios with no distinction between cell phones (Figure 12).

17
Figure 12 Scenarios for the annual energy demand from phone charging
On the other hand, the energy required by the infrastructure is also indispensable for mobile communication and must be added to the estimates of the cell phone charging demand. The annual energy usage of mobile phone networks was elsewhere calculated at 16 kWh/phone (Malmodin et al., 2010).9 This figure includes electricity used by the networks and buildings, and does not include energy consumption in operator activities, such as fuel for vehicles, or diesel consumption by base stations at off-grid sites. Therefore the energy consumed by cellular phones and their infrastructure is estimated at between 93 and 94 TWh.10, 11 That is a more realistic value of the energy needs of the sector, and is far from negligible. Nevertheless, a complete perspective of the needs of mobile phones would have included, in addition, the energy used during the manufacturing stage of the phone, which may be higher than the operating needs in the lifetime of the device, though subject to more uncertainty. An entire life cycle analysis of cellular phones is out of the scope of this study. There are already some estimates (Malmodin et al., 2010), though more analyses are needed in the future. The following point investigates the growth of production of mobile phones, and how it compares with other technologies.
7. How fast can the production of mobile phones be scaled up to enable a rapid growth in demand?
The former points estimated the growth in the capacity and energy needs of cell phones. The dynamics of production that allowed such a fast and intensive diffusion will now be investigated, and compared with other technologies. The recent diffusion of smartphones points to a new technological pathway marked by more powerful devices, providing improved services to the user, but also higher energy requirements. 9 The authors used data from previous life cycle analyses (LCA) performed for the ICT sector, telecom operators’ environmental reports, and internal data from an equipment manufacturer (Ericsson). 10 The product of the number of subscribers multiplied by the sum of the average consumption per phone and the energy requirements of the network per subscriber: 5,34bn * (1.13 to 1.5 + 16) = 92.9 to 93.98 TWh. 11 This figure compares with the direct energy use of Internet and phone systems in 2006 for the US, which was 85 and 5.1 TWh, respectively (Taylor & Koomey, 2008).
0
5
10
15
20
2000
2003
2006
2009
2012
2015
2018
2021
2024
2027
2030
Annual Energy Demand from Cell Phones (2000‐2030), in TWh
Assuming 2.4 kWh/yrper smartphone (avg.2011)Assuming 1.8 kWh/yrper smartphone
No discrimination ofphones (avg. 1.5kWh/yr)No discrimination ofphones (avg. 1.2kWh/yr)
18
The analysis follows the methodology that was applied to describe the scaling dynamics of supply energy technologies (Wilson & Grubler, 2011). Scaling is a term used to designate the increase in size or performance capacity of a technology (Wilson, 2009). Up-scaling may lead to the reduction in average costs or economies of scale, while the growth in cumulative production generates learning that further decreases costs.12 However, cost reductions may be relative to the role of technologies in producing considerably more service, rather than lower use price in absolute terms (Nordhaus, 1997). A typical example is the lighting technology, where the introduction of several innovations led to significant reductions in the average cost of lumen per energy input in the past, but at the same time there was an upward shift in the average price of lighting fuel (Fouquet, 2008). In the case of mobile phones, the new functions that manufacturers have added to the phone provide multiple services to the user, such as email access, camera, MP3 player, with a marginal increase in the cost of use of the device. In both cases technological change contributed to improve welfare independently of changes in operational costs.
The scaling dynamics approach is a descriptive procedure that investigates the historical diffusion of technologies through the study of their cumulative production, both in terms of numbers and capacity. As such this methodology uses logistic growth functions to fit cumulative production data series, and uses the parameters of the fit curves as its main input (Marchetti & Nakicenovic, 1979). The use of those parameters is subject to criteria of accuracy (minimum R2 = 95%) and reliability (minimum 60% of estimated asymptote reached by data) following Wilson (2009).
The main goal is to find regularities in the rapid and extensive technological growth occurring at multiple levels (unit capacity, unit numbers and industry capacity). Another aim is to analyze the number of subscribers, to account for spatial diffusion from the initial market of commercialization (‘Core’) through to subsequent (‘Rim 2’) and then final markets (‘Periphery’). Global data is disaggregated into regions defined by the sequence of the diffusion (Grubler, 1998). Thus Scandinavian countries and Japan are the Core countries, where the first commercial mobile phone networks were installed; the major OECD countries, including the United States, are in the Rim 2 area; and the rest of the world, including India and China, is the Periphery.
With regard to metrics, unit numbers and energy conversion capacity (in MW) are used, the latter being a common metric of both unit and industry level growth (Wilson, 2009; Wilson & Grubler, 2011). The unit level growth comprises the average size or capacity of additional units, and the maximum size or capacity of additional units. Those values were found in the field trials reported above. The industry level growth is investigated in terms of the cumulative total number of all units, and converted into cumulative capacity using the average capacity of phones.
Data on production is more difficult to find and less reliable than on subscribers. We used publically available data on cellular phones shipments from private consulting companies (mostly from Gartner) specialized in information technology. For the purposes of this analysis, it was assumed that all the phones were produced and sold in the same year. This assumption is unlikely to affect the results since we are looking at 12 Economies of scale and learning economies are two different effects that should be analyzed separately: the former deals with the reduction of average costs after an increase in production factors at the same rate; the latter refers to the economies obtained from an increased cumulative production.

19
the diffusion in the long-term. Figure 13 shows the evolution of the share of manufacturers, by brand and by region of origin. Best fit interpolation was used whenever real data was not available (Figure 13, below).
Figure 13 Evolution of the market share of major cellular phone manufacturers
Source: Gartner – Press releases (2006-2011); In-Stat/MDR (2004).

20
Figure 14 Comparing the total number of subscriptions with the estimated production of mobile phones between 1978 and 2010
Production has progressively increased in Rim 2 and Periphery, catching up lately with the share in Core lately. In fact the first manufacturer in the Core (Nokia) is losing share to producers from Rim 2 (e.g., Samsung) and to new brands appearing in Periphery, some of them especially active in the smartphone market (e.g., HTC, ZTE). In order to validate the estimations, the global production of cell phones was confronted with the total number of subscriptions (Figure 14). The shape of the curve of the estimated production closely follows the one of the subscriptions, thus showing the link between subscriptions and cell phones production. However, the number of subscriptions is generally five times larger than the number of cell phones produced over a year. One possible explanation is that the lifetime of a handset was in average 3 years during the period, and each phone sold is likely to be used with more than one subscription.

21
Figure 15 Cumulative production of cellular phones: actual data and logistic fits (dashed lines). Semi-log axis.
Table 4 Parameters of the logistic curves Cumulative Production in Million Units Cumulative Production in MW
Actual %K K t0 Δt R2 Actual %K K t0 Δt R2
Core 52% 8807 2010 17 99,97% 52% 39635 2010 17 99,97%
Rim 2 58% 6012 2009 14 99,99% 58% 27055 2009 14 99,99%
Periphery 23% 8757 2014 15 99,73% 23% 39408 2014 15 99,73%
Global 48% 20747 2010 16 99,99% 48% 93364 2010 16 99,99%

22
The evolution of cumulative production of cellular phones by region and the respective logistic fits, both in unit numbers and capacity, is shown in Figure 15. The unit capacity of phones has been kept constant across time and equal to the average capacity found in the field trials (4.5 Watts, see above) because of the variability of the values during the period covered by the experiment.
The logistic functions exhibit R2 higher than 99%, fitting well the diffusion curves of cell phones (Table 4). In the Core region the expansion of production was fast, with a deltaT of 17 years. The inflection point of the logistic curve occurred slightly before 2010, with an asymptote (K) estimated at 8.8 billion units or 40 GW of produced capacity. Actual cumulative production in the last year for which there is data available (2010), was more than 10 billion units. That is greater than 50% but lower than 60%, which has been defined as the minimum criteria of reliability, so results for the Core should be taken with caution. At the global level production is still in the exponential phase of the logistic curve (less than 50% of K), as it is in the Periphery, where the logistic fits are shown in the figure only for indicative purpose.
It is particularly interesting to confront the duration of diffusion with the expansion of production in industry level, as this indicates how the scale of diffusion of cellular phones compares with other technologies. A strong correlation was found between the duration of up-scaling at the unit level and the expansion of production at industry level in supply energy technologies (Wilson, 2009). Mobile phones are a type of technology for which unit capacity remains stable over a long period, despite the recent up-scaling motivated by the arrival of smartphones in the market – though this effect was left out of the analysis because it is a relatively recent development. Another example is Compact Fluorescent Light Bulbs (CFL) technology, where average wattage remained stable around 18 W since its first commercialization in the early 1980s (Wilson & Grubler, 2011; Wilson, 2009).
Figure 16 Duration and scale of diffusion relationship for different technologies in the Core region
Note: Normalizing raw data for the extent of the energy system (left-hand graph) allows comparing scaling dynamics between technologies that diffuses at different moments in time. The procedure consists to divide the saturation (K in MW) by the primary energy (in EJ) consumption of the energy system at the year t0. The final result is an index number without any significance other than to order technologies according to their impact on the energy system. Source: author (cell phones); Wilson & Grubler (2011); Wilson (2009).

23
The scale of growth of mobile phone production, both in unit numbers and industry capacity, was notable and comparable to the development of other supply and end-use energy technologies (Figure 16). This is a significant finding because it shows that it was possible to attain similar capacity levels of technologies like nuclear power plants or coal power plants, during a shorter period of time, through the intensive production of small scale unit size devices.
8. Conclusion
In spite of the broadly recognized success of the diffusion of mobile phones, the real extent of the growth and the energy impacts, as well as the dynamics of production development, remained uncertain.
It was demonstrated that cellular phones were produced and sold so intensively that they became the most popular technology, attaining indifferently rich and developing countries, and surpassing radio sets as the most used technology within a decade and half. The number of subscribers is currently greater than the population in both the Core and Rim 2 areas, while it reaches only half of the population in the Periphery, though here it is rapidly catching up with the world average. In fact there are already more subscribers in China or India than in the United States, where the number of subscribers was for a long time the highest in the world, which underlines the democratic nature of the technology.
A field experiment in a real context was conducted to improve our knowledge of the evolution of unit capacity and consumption per phone across time. The results showed a gradual improvement in energy efficiency, as well as a decrease in the size or capacity of the phone (in wattage) between 2005 and 2009 – although the trend was recently reversed with the arrival of smartphones in the market. Hence it was possible to calculate the global capacity of mobile phones in operation, estimated between 24 and 32 GW, and the energy needed for charging all devices in use globally, which was evaluated at 6-8 TWh per year. Nevertheless, the diffusion of smartphones, which need more energy to provide a large variety of services, and the inclusion of the energy used by the networks necessary for the operation of cellular phones, raises significantly the estimates of the energy demand. Those factors taken together will bring the annual demand of energy from mobile phones to 94 TWh by 2030.
The diffusion of cellular phones was only possible because of the changes at the production level that enabled the spectacular development of demand. The share of manufacturers from the Core is currently threatened by the increasing production in other areas, especially in the Periphery. The growth in local demand and the technological change towards smartphones set a favorable context for the expansion of new manufacturers. At the global level, the production of mobile phones is still far from saturation. The growth of production was so significant that it allowed cell phones to reach levels of industry capacity comparables to those of supply energy technologies, even without up-scaling at unit level, showing that a small and diffuse technology can achieve high market penetration rates quickly.
In the following years it is expected that more powerful smartphones will shift up the installed capacity of phones, as well as the energy demands from mobile communication. That up-scaling at the unit level may change the conditions of diffusion and further enhance the ultimate potential of cumulative produced capacity of mobile

24
phones. In addition, it would be important to investigate trends of energy efficiency of cellular phones across time, particularly in terms of the service provided (e.g., talk time, data transfer) by the same amount of energy.

25
Appendix: Methodologies for calculating Lorenz curves for different technologies
The Lorenz curve is generally used to evaluate the discrepancies in income distribution. As so the income groups were ordered according to their levels of income, from the poorest to the wealthiest. In this study Lorenz curves were used to present the inequality in the use and penetration of several mass-marketed technologies. The following figures show Lorenz curves that were built using different assumptions to sorting out the countries (see Figure A.1).
A.1 Lorenz curves built according to different methodologies
The Lorenz curve used in the main text (top-center) was represented by sorting out the countries in ascending order of the ownership of the goods. Purchase power is an important determinant of technological ownership, and thus poor countries are likely to show lower rates of technological adoption. Nonetheless it can be argued that this figure gives just a perspective of the penetration of technologies, rather than of the inequality of the distribution of goods.
It was decided to compare the results with other Lorenz curves, which were built by sorting out countries according to their levels of income per capita – here measured by GDP per capita at purchasing power parity (PPP) with constant dollars of 2005 (graph

26
on the bottom-left). Countries are compared in the basis of representative citizens in order to assess if the poorest are using relatively more or less of a particular technology than the wealthiest. The results though remain practically unchanged when one passed from one assumption to another.
A third Lorenz curve was built by correcting the revenue per capita of the inequalities in income distribution. This was done by dividing the GDP per capita (PPP, constant $05) by the Gini index (available on the World Bank’s website). A higher average income value can hide strong disparities in income distribution which may handicap the penetration of the technology in the market. Still, the results are not affected by that assumption. In conclusion: there is enough evidence to support Lorenz curves built by using technological ownership instead of income distribution, and they can assess the popularity of a technology and its use by the poorest.
Supplementary material
The spreadsheets containing the data series and all the analysis can be found at http://webarchive.iiasa.ac.at/~bento/Cellphones_Supplementary%20material.xlsx
References
Ayres, R. U. (1990). Technological transformations and long waves. Part I. Technological Forecasting and Social Change, 37(1), 1–37.
Berkhout, F., & Hertin, J. (2004). De-materialising and re-materialising: Digital technologies and the environment. Futures, 36, 903–920.
Bicycle Retailer and Industry News. (1998). Statistics. Obtido de http://www.docstoc.com/docs/78211696/STATISTICS
BOVAG-RAI. (2008). Mobility in Figures - Two-wheelers 2008/2009 (p 62). Amsterdam: BOVAG-RAI Mobility Foundation. Obtido de http://www.bovag-cijfers.nl/bovag_cijfers_auto_en_2008.html
Choo, S., & Mokhtarian, P. L. (2007). Telecommunication and travel demand and supply: Aggregate sctructural equation models for the US. Transportation Research Part A: Policy and Practice, 41(1), 4.
Encyclopædia Britannica. (1992). The New Encyclopædia Britannica. Macropedia (15th Edition., Vol. 28). Encyclopædia Britannica, Inc.
Fouquet, R. (2008). Heat, Power and Light - Revolutions in Energy Services (Cheltenham.). Edward Elgar.
Freeman, C., & Louçã, F. (2001). As times goes by. From the Industrial Revolutions to the Information Revolution. Oxford: Oxford University Press.
Gartner. (2011). Gartner Says Sales of Mobile Devices Grew 5.6 Percent in Third Quarter of 2011; Smartphone Sales Increased 42 Percent. Press Releases. Obtido de http://www.gartner.com/it/page.jsp?id=1848514
Gastwirth, J. L. (1972). The Estimation of the Lorenz Curve and Gini Index. The Review of Economics and Statistics, 54(3), 306–316.
Grubler, A. (1998). Technology and Global Change. Cambridge: Cambridge University Press.

27
GSM Association. (2012). GSMA Mobile Money & Wireless Intelligence. Obtido de www.wirelessintelligence.com/mobile-money
Hilty, L. M., Arnfalk, P., Erdmann, L., Goodman, J., Lehmann, M., & Wäger, P. A. (2006). The relevance of information and communication technologies for environmental sustainability - A prospective simulation study. Environmental Modelling and Software, 21, 1618–1629.
Horowitz, N., Ostendorp, P., Foster, S., & Calwell, C. (2004). Cellular Phones: Advancements in Energy Efficiency and Opportunities for Energy Savings. Natural Resources Defense Council. Obtido de http://www.nrdc.org/air/energy/energyeff/cellphones.pdf
In-Stat/MDR. (2004). Riding the Growth Curve: Annual Mobile Handset Forecast. Report details. Obtido de www.instat.com/press.asp?Sku=IN0401700WH&ID=1031
ITU. (2011). ITU World Telecommunication / ICT Indicators Database 2011. International Telecommunication Union, United Nations. Obtido de http://www.itu.int/ITU-D/ict/publications/world/world.html
JAMA. (2011). Online database. Japan Automobiles Manufacturers Association. Obtido de http://www.jama-english.jp/about/org.html
Malmodin, J., Moberg, Å., Lundén, D., Finnveden, G., & Lövehagen, N. (2010). Greenhouse Gas Emissions and Operational Electricity Use in the ICT and Entertainment & Media Sectors. Journal of Industrial Ecology, 14(5), 770–790. doi:10.1111/j.1530-9290.2010.00278.x
Marchetti, C., & Nakicenovic, N. (1979). The dynamics of energy systems and the logistic substitution model. Laxenburg, Austria: IIASA.
Nokia Siemens Networks. (2009). Expanding Horizons. Obtido de http://www.nokia.com/NOKIA_COM_1/Corporate_Responsibility/Society_/Expanding_Horizons/Expanding_Horizons_NEW/pdf/Expanding_Horizons_Q2_2009.pdf
Nordhaus, W. D. (1997). Do real output and real wage measures capture reality? The history of lighting suggests not. The Economics of New Goods (Breshnahan, T.F. and R. Gordon.). Chicago: Chicago University Press.
O’Brien, K. J. (2012, Janeiro 5). Top 1% of Mobile Users Use Half of World’s Wireless Bandwidth. The New York Times. Obtido de http://www.nytimes.com/2012/01/06/technology/top-1-of-mobile-users-use-half-of-worlds-wireless-bandwidth.html?_r=2&scp=1&sq=dataconsumption%20&st=cse
Perez, C. (2002). Technological Revolutions and financial Capital: The Dynamics of Bubbles and Golden Ages. Cheltenham: Edward Elgar.
Taylor, C., & Koomey, J. (2008). Estimating Energy Use and CarbonEmissions from Internet Advertising (Working Paper). IMC2.
U.S. Census Bureau. (2010). Online database. Obtido de www.census.gov/compendia/statab/2010/tables/10s1062.xls
UN Population Division. (2011). World Population Prospects, the 2010 Revision. United Nations. Obtido de http://esa.un.org/unpd/wpp/Documentation/pdf/WPP2010_Highlights.pdf
UNCTAD. (2011). Information Economy Report 2011: ICTs as an Enabler for Private Sector Development. Geneva: United Nations, United Nations Conference on Trade and Development.

28
Wilson, C. (2009). Meta-analysis of unit and industry level scaling dynamics in energy technologies and climate change mitigation scenarios. Laxenburg, Austria: International Institute for Applied Systems Analysis (IIASA).
Wilson, C., & Grubler, A. (2011). Lessons from the history of technology and global change for the emerging clean technology cluster (Interim Report No. IR-11-001). Laxenburg, Austria: IIASA.
Windrum, P., Diaz, C., & Filiou, D. (2009). Exploring the relationship between technical and service characteristics. Journal of Evolutionary Economics, 19(4), 567–588. doi:10.1007/s00191-009-0143-y
World Bank. (2011). Online database. World Bank.