Embed Size (px)
Citation preview
The G5 Entertainment group is a developer and publisher of high quality casual and free-to-play games for tablets and smartphones, that are distributed through iPhone, iPad, Android, Mac and Windows application stores. G5 Entertainment´s portfolio includes popular games like Mahjong Journey, Farm Clan, The Secret Society, Virtual City Playground and Supermar-ket Mania. G5 Entertainment AB is listed on Nasdaq Stockholm since 2014.
Interim report Jan-Jun 2015
INTERIM REPORT JANUARY – JUNE 2015
The G5 Entertainment group is a developer and publisher of high quality casual and free-to-play games for tablets and smartphones, that are distributed through iPhone, iPad, Android, Mac and Windows application stores. G5 Entertainment´s portfolio includes popular games like Mahjong Journey, Farm Clan, The Secret Society, Virtual City Playground and Supermar-ket Mania. G5 Entertainment AB is listed on Nasdaq Stockholm since 2014.
Interim report Jan-Jun 2015
April-June 2015
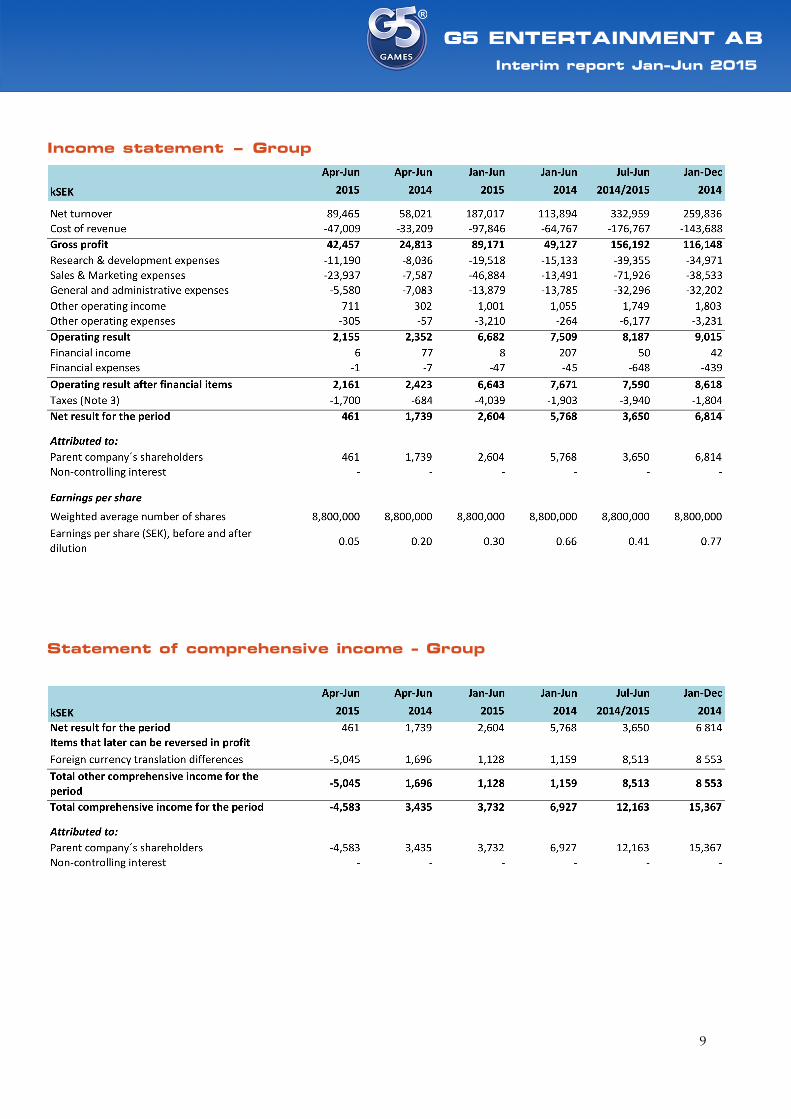
Consolidated revenue for the period was 89,465 (58,021) kSEK, an increase of 54 per cent compared to 2014.
EBIT for the period was 2,155 (2,352) kSEK.
Net result for the period was 461 (1,739) kSEK.
Earnings per share for the period before and after dilution was SEK 0.05 (0.20).
Cash flow before financing activities during the period was -7,051 (-9,365) kSEK.
January-June 2015
Consolidated revenue for the period was 187,017 (113,894) kSEK, an increase of 64 per cent compared to 2014.
EBIT for the period was 6,682 (7,509) kSEK.
Net result for the period was 2,604 (5,768) kSEK.
Earnings per share for the period before and after dilution was 0.30 (0.66) SEK.
Cash flow before financing activities during the period was -2,101 (-2,178) kSEK.
Important events during the second quarter
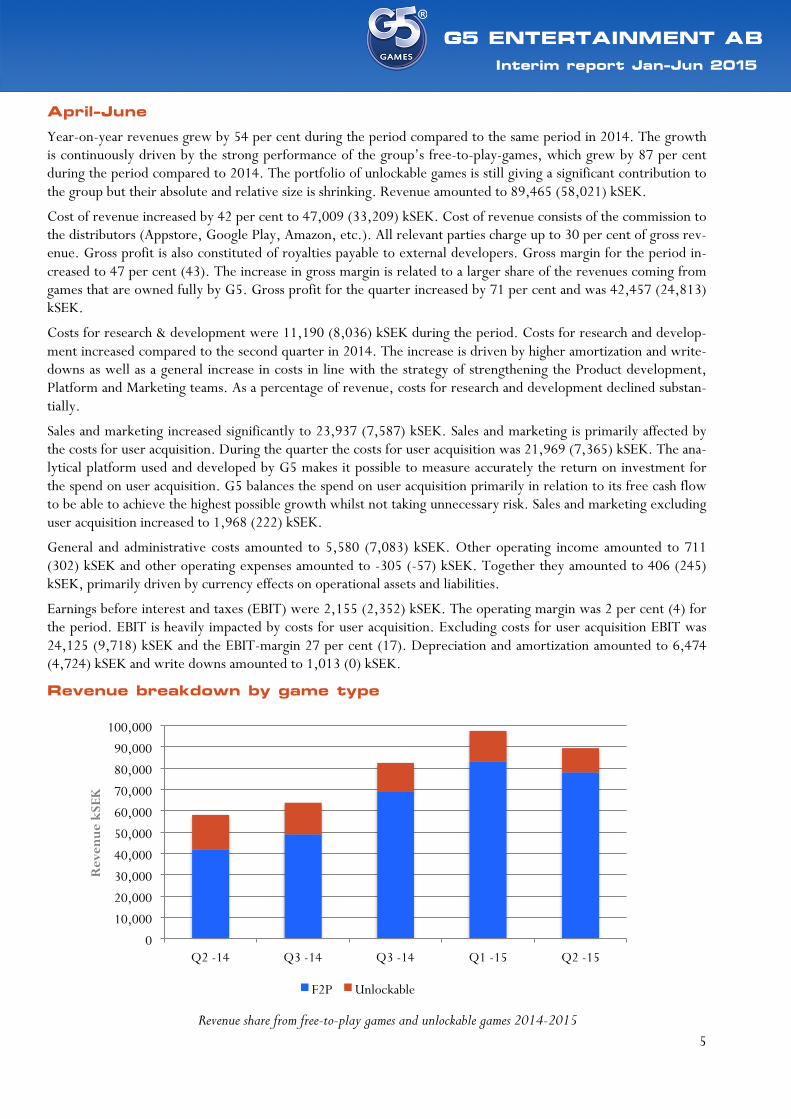
Revenue from free-to-play games grew 87 per cent compared to the second quarter 2014 and accounted for 87 per cent (72) of total revenue in the quarter.
The accumulated number of downloads of the group’s games (not counting updates) surpassed 220 million.
After the Annual General Meeting on May 22, 2015, the Board of G5 decided to offer a total of 145,000 warrants to existing employees.
G5 Entertainment signed an agreement with the developer of the game Brave Tribe to acquire all interest, in-tellectual property, and assets in the game. G5 Entertainment originally published the game as a 3rd party game, and brought the game to iOS, Android, and Amazon application stores. The purchase price will be funded from the company’s cash flow.
Stefan Wikstrand has been appointed Chief Financial Officer and deputy CEO. Stefan started his position on the 1st of June 2015. Stefan is 34 years old and previously worked at Tradedoubler AB (publ).
Important events after the end of the period
The management has reduced user acquisition (UA) spending in the third quarter to demonstrate the assump-tion that the revenue will remain stable and the growth will continue with even lower level of UA spending. While it is the plan for the quarter to work with lower UA budget, the management reserves the option to increase the new lower level of UA spending in case of new game releases that require justified initial mar-keting spend.

3
Interim report Jan-Jun 2015
Comments by the Chief Executive Officer
G5 CONTINUES TO DELIVER HIGH GROWTH
The management is satisfied with the results of the 2nd quarter. The group continued to deliver high top line growth year-on-year, but revenue has declined slightly from the first quarter. We had some headwind from cur-rency exchange rates and seasonality, as fewer new players have entered the mobile ecosystem during the second quarter compared to the first quarter. Also, some older licensed games performed below their usual levels due to hiccups in 3rd party update deliveries. The situation however has improved since the end of the quarter.
G5’S OWN FREE-TO-PLAY GAMES ARE DRIVING GROWTH
Free-to-play games in the company’s portfolio continued to be the driving force behind the growth, with G5’s own games leading the growth in the quarter. With the acquisition of the intellectual property rights in Brave Tribe (now Farm Clan), G5 owns 5 out of 10 best performing free-to-play games in its portfolio. Mahjong Jour-ney became a highlight of the quarter in terms of growth, rising substantially in store chart positions, gaining audi-ence and growing revenue every month.
INTENSIVE PRODUCT DEVELOPMENT
During the quarter G5 continued intensive work on new free-to-play games for publishing before the end of the year, both G5-owned and licensed from 3rd parties. The work on improving and adding new content to the exist-ing portfolio also continued successfully. Our operations in Kharkov continue uninterrupted in the “business as usual” mode. INCREASING EARNINGS POTENTIAL
In the quarter, G5 had an “EBIT before user acquisition (UA)” of 24.1 mSEK compared to 9.7 mSEK one year ago. This line is the “pool” that the management can allocate between UA budget and EBIT, on a daily basis, with high precision. It shows the potential for EBIT, when/if the company decides to partially or substantially reduce its UA spending. The strategy is to maximize this “pool” before the management decides to reduce the investment in UA for reasons such as showing higher earnings, balancing growth with cash flow abilities or other reasons.
REDUCED UA SPENDING IN THE THIRD QUARTER
The management continues to be committed to investment in high growth, but we are also looking to demon-strate that the growth can continue with lower UA spending on some specific games. We are looking to show it in the third quarter. The reduced UA spending in the third quarter may be counter-balanced by the releases of new games if we feel such releases need substantial justified UA spend around the time of launch. That said, the man-agement remains focused on achieving high organic growth with the help of UA spending, while balancing it with cash flow abilities in the short term, and profitability in the longer term.
Stockholm, July 23, 2015
Vlad Suglobov, Chief Executive Officer, co-founder
4
Interim report Jan-Jun 2015
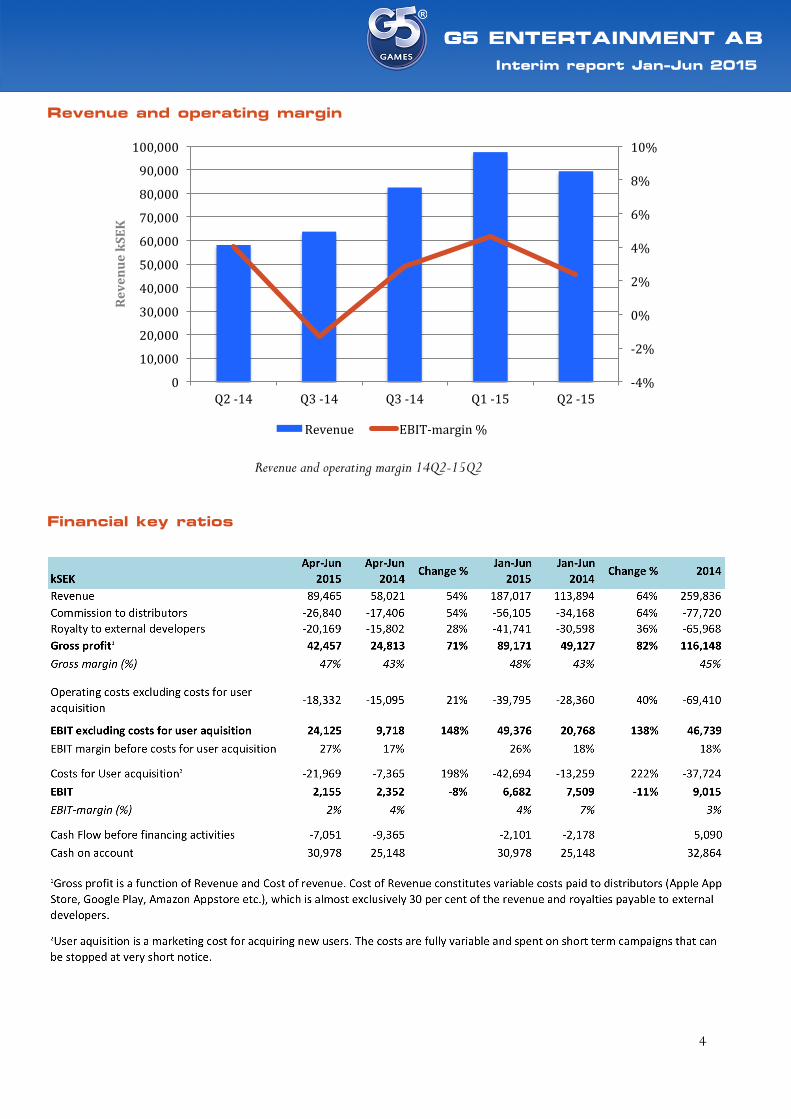
Revenue and operating margin
Revenue and operating margin 14Q2-15Q2
Financial key ratios
-‐4%
-‐2%
0%
2%
4%
6%
8%
10%
0
10,000
20,000
30,000
40,000
50,000
60,000
70,000
80,000
90,000
100,000
Q2 -‐14 Q3 -‐14 Q3 -‐14 Q1 -‐15 Q2 -‐15
Revenue kSEK
Revenue EBIT-‐margin %
5
Interim report Jan-Jun 2015
April-June
Year-on-year revenues grew by 54 per cent during the period compared to the same period in 2014. The growth is continuously driven by the strong performance of the group’s free-to-play-games, which grew by 87 per cent during the period compared to 2014. The portfolio of unlockable games is still giving a significant contribution to the group but their absolute and relative size is shrinking. Revenue amounted to 89,465 (58,021) kSEK. Cost of revenue increased by 42 per cent to 47,009 (33,209) kSEK. Cost of revenue consists of the commission to the distributors (Appstore, Google Play, Amazon, etc.). All relevant parties charge up to 30 per cent of gross rev-enue. Gross profit is also constituted of royalties payable to external developers. Gross margin for the period in-creased to 47 per cent (43). The increase in gross margin is related to a larger share of the revenues coming from games that are owned fully by G5. Gross profit for the quarter increased by 71 per cent and was 42,457 (24,813) kSEK.
Costs for research & development were 11,190 (8,036) kSEK during the period. Costs for research and develop-ment increased compared to the second quarter in 2014. The increase is driven by higher amortization and write-downs as well as a general increase in costs in line with the strategy of strengthening the Product development, Platform and Marketing teams. As a percentage of revenue, costs for research and development declined substan-tially.
Sales and marketing increased significantly to 23,937 (7,587) kSEK. Sales and marketing is primarily affected by the costs for user acquisition. During the quarter the costs for user acquisition was 21,969 (7,365) kSEK. The ana-lytical platform used and developed by G5 makes it possible to measure accurately the return on investment for the spend on user acquisition. G5 balances the spend on user acquisition primarily in relation to its free cash flow to be able to achieve the highest possible growth whilst not taking unnecessary risk. Sales and marketing excluding user acquisition increased to 1,968 (222) kSEK.
General and administrative costs amounted to 5,580 (7,083) kSEK. Other operating income amounted to 711 (302) kSEK and other operating expenses amounted to -305 (-57) kSEK. Together they amounted to 406 (245) kSEK, primarily driven by currency effects on operational assets and liabilities.
Earnings before interest and taxes (EBIT) were 2,155 (2,352) kSEK. The operating margin was 2 per cent (4) for the period. EBIT is heavily impacted by costs for user acquisition. Excluding costs for user acquisition EBIT was 24,125 (9,718) kSEK and the EBIT-margin 27 per cent (17). Depreciation and amortization amounted to 6,474 (4,724) kSEK and write downs amounted to 1,013 (0) kSEK.
Revenue breakdown by game type
Revenue share from free-to-play games and unlockable games 2014-2015
0 10,000 20,000 30,000 40,000 50,000 60,000 70,000 80,000 90,000
100,000
Q2 -14 Q3 -14 Q3 -14 Q1 -15 Q2 -15
Rev
enue
kSE
K
F2P Unlockable
6
Interim report Jan-Jun 2015
January-June
Year-on-year revenues grew by 64 per cent during the interim period, driven by the strong growth for the group’s free-to-play-games. Revenues amounted to 187,017 (113,894) kSEK. Revenue from free-to-play-games grew by 107 per cent during the period compared to 2014.
The group’s costs of revenue were 97,846 (64,767) kSEK during the period. Cost of revenue increased by 51 per cent compared to the same period last year. Gross margin increased to 48 per cent (43) due to a relative increase in sales from games owned by G5.
Operating costs increased significantly compared to the same period last year. The increase is primarily driven by the costs for user acquisition, which amounted to 42,694 (13,259) kSEK. Excluding costs for user acquisition the operating costs amounted to 39,795 (28,360) kSEK. The increase in costs is in accordance with the strategy of strengthening Product development, Platform and Marketing teams to manage the current and future portfolio of free to play games. In addition exchange rate differences on operational assets and liabilities has impacted the pe-riod negatively compared to the same period last year.
EBIT was 6,682 (7,509) kSEK. The EBIT-margin was 4 per cent (7) for the period. Adjusted for investments in user acquisition EBIT amounted to 49,376 (20,768) kSEK corresponding to an EBIT-margin of 26 per cent (18). Depreciation and amortization amounted to 12,217 (9,074) kSEK for the interim period and write-downs affect-ed the period with 1,013 (0) kSEK.
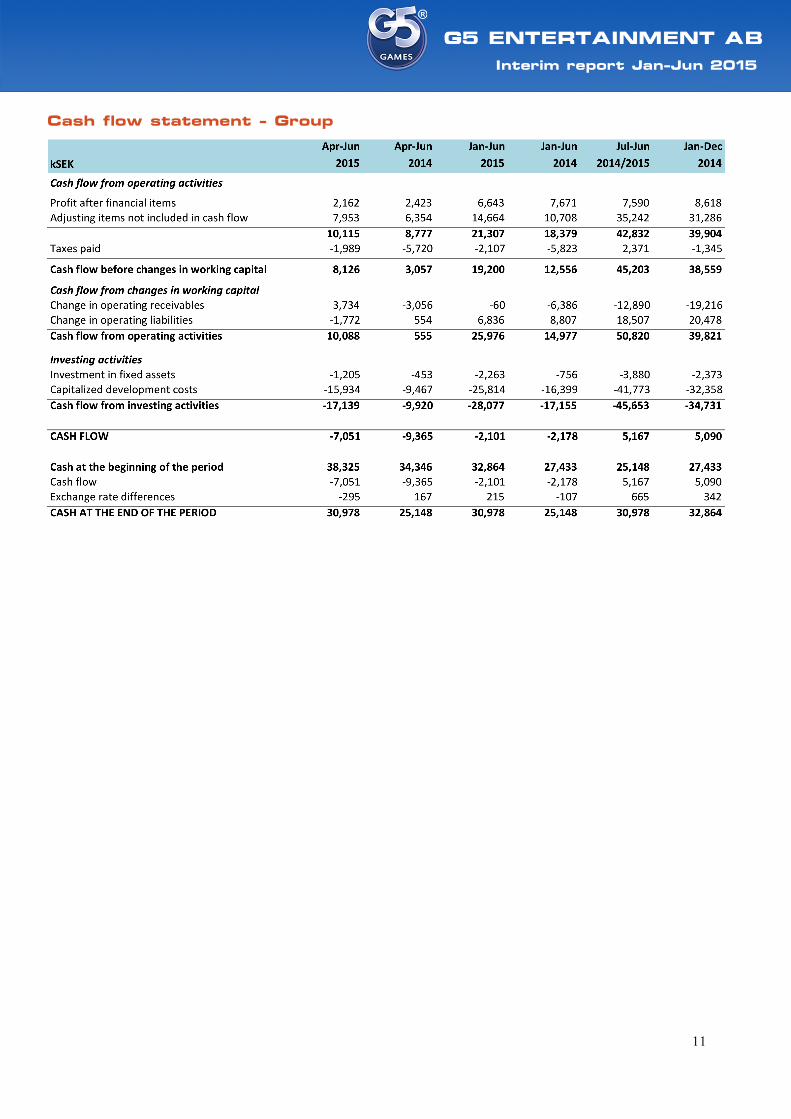
Cash flow
During the second quarter, the group had an operating cash flow before changes in working capital of 8,126 (3,057) kSEK. Changes in working capital impacted the cash flow positively with 1,962 (-2,502) kSEK while capi-talized development costs were high in the quarter and impacted the cash flow negatively with -15,934 (-9,467) kSEK. The group currently has an intensive development period aimed at a number of releases in the second half of the year. It was also impacted by the purchase of all rights to Brave Tribe. Cash flow for the quarter amounted to -7,051 (-9,365) kSEK.
For the interim period cash flow before changes in working capital amounted to 19,200 (12,556) kSEK. Cash flow amounted to -2,101 (-2,178) kSEK.
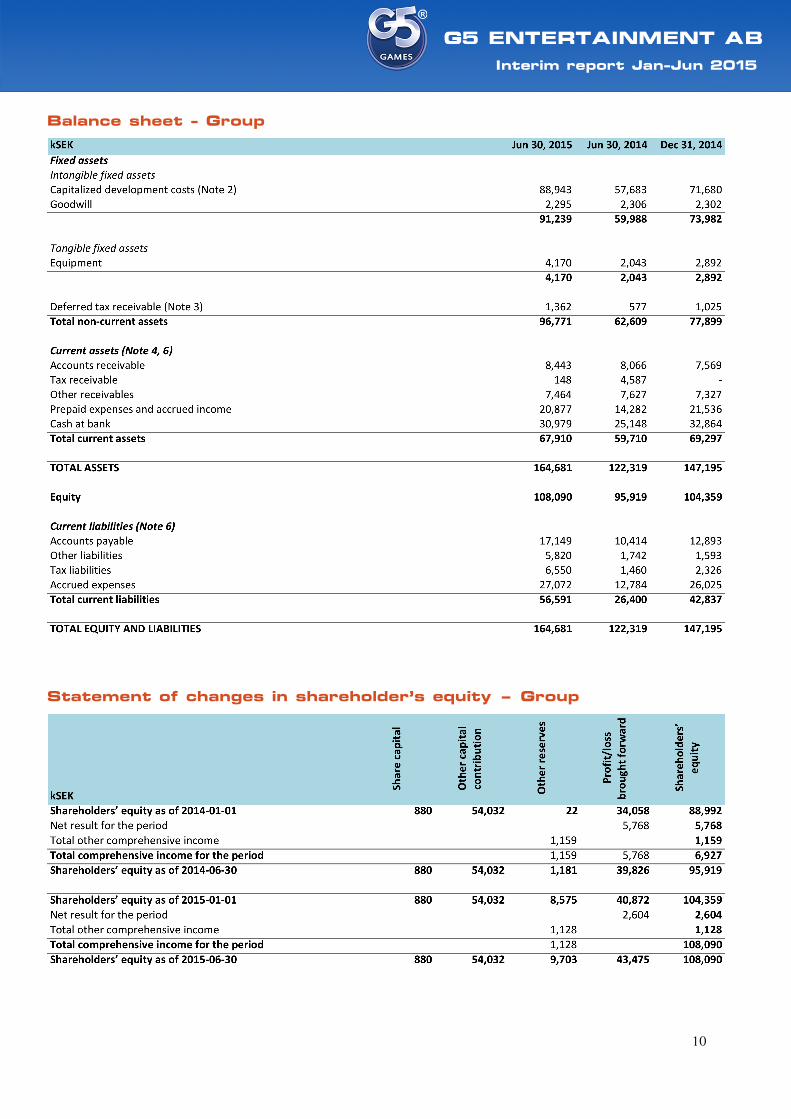
Available cash on June 30, 2015 amounted to 30,978 (25,148) kSEK.
Financial position
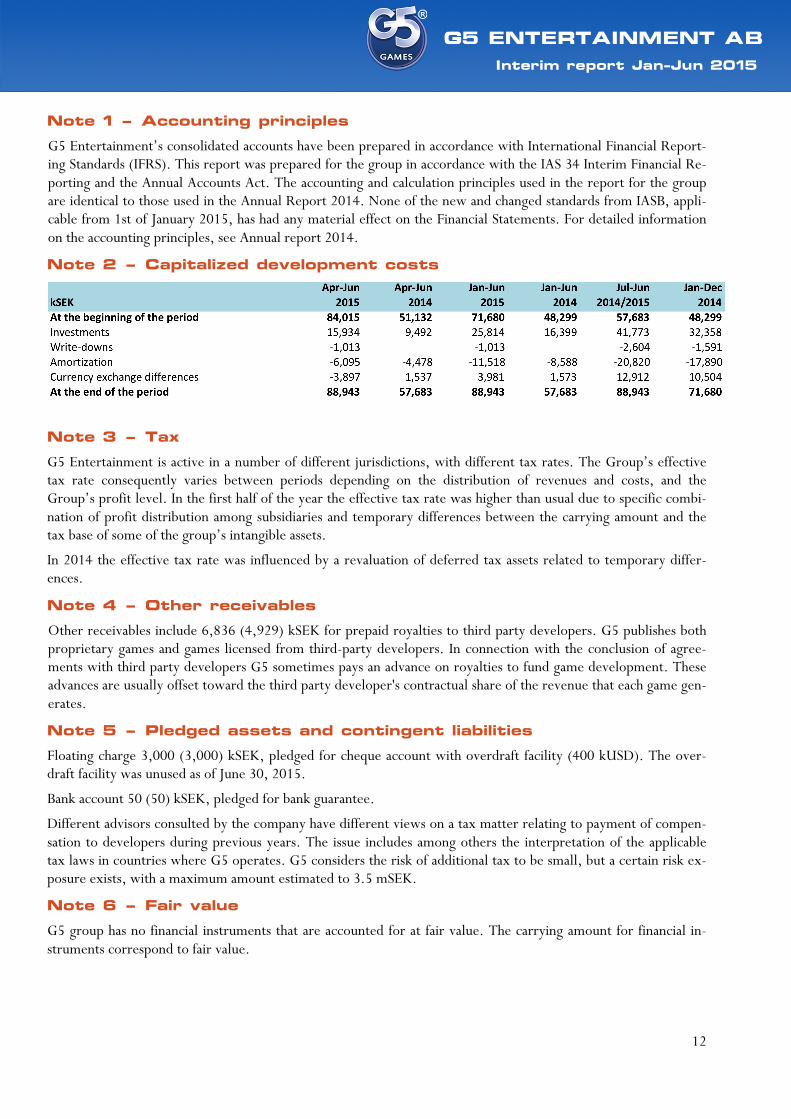
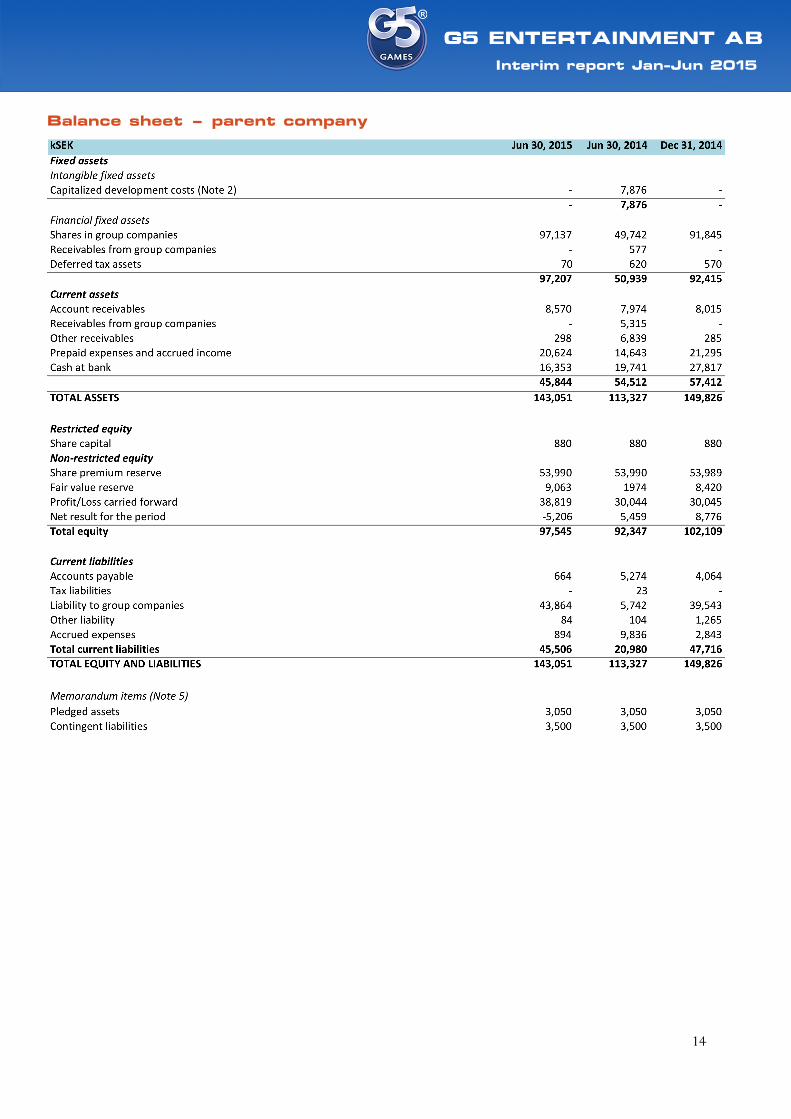
The company’s publishing strategy is based on having a certain number of different games in the portfolio, in or-der to maximize potential and reduce risk. Some of these games become very successful and profitable, while a few other games may fail in the market. Capitalized development expenses for unsuccessful games will then have to be written down. Over time, the company however expects such write-downs to be more than compensated for by the revenue and profits produced by very successful games in the portfolio. Intangible assets, which pri-marily are constituted of capitalized expenses on the games portfolio, amounted to 88,943 (57,683) kSEK. Im-pairment need in the portfolio is tested on a quarterly basis. A thorough review of the input parameters is done on a yearly basis.
Consolidated equity amounted to 108,090 (95,919) kSEK, which equals SEK 12.28 per share (10,90) and the eq-uity/asset ratio is 66 per cent (78).
Cash on hand amounted to 30,979 (25,148) kSEK
The group has no interest bearing debt.
7
Interim report Jan-Jun 2015
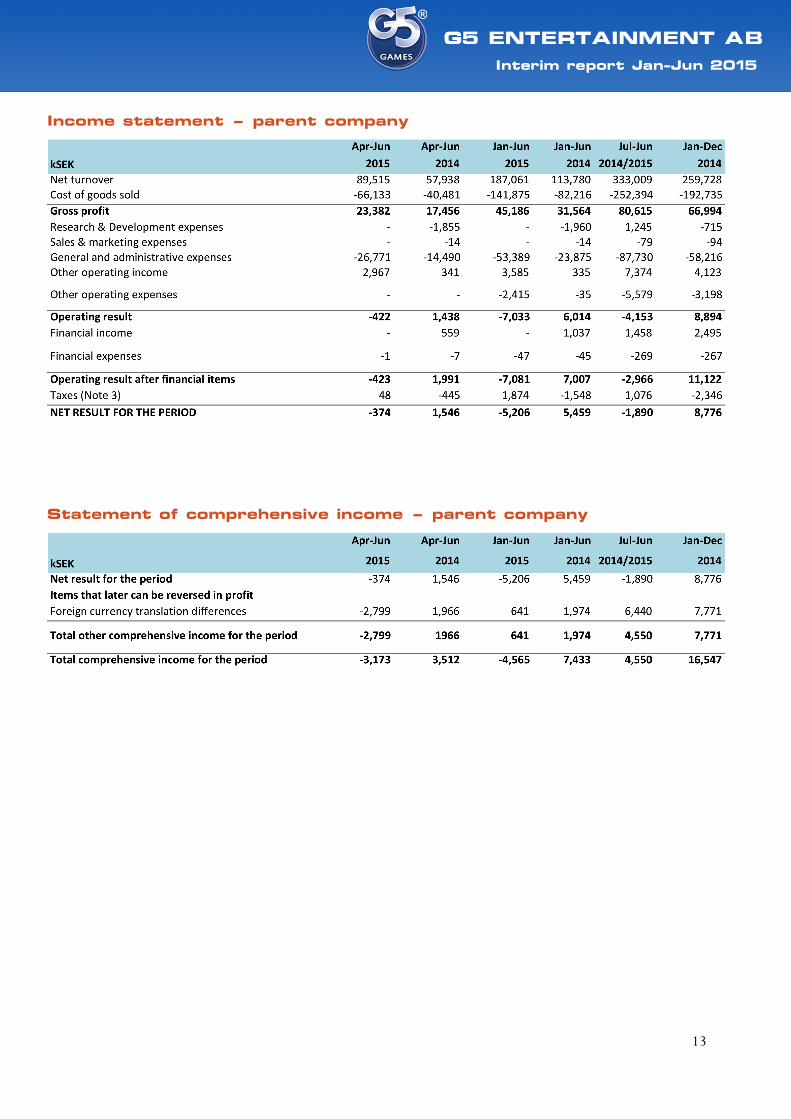
Parent company
The parent company revenues increased in line with the group. The parent company is the counterparty for al-most all revenue from the application stores where G5 sells their products. The costs consist mainly of payments to one of the subsidiaries in Malta that holds the rights for the games in the portfolio. Over time, the transactions should generate a surplus for the parent company, but during shorter periods some imbalances may occur.
The financial position of the parent company is solid, as for the group.
New reporting format
From the first quarter 2015, G5 Entertainment started reporting revenues including commission to distributors and is subsequently reporting commission to distributors as cost of revenue. The change in revenue recognition is in line with how most other public companies in this industry report.
In addition G5 Entertainment started reporting its income statement in a functional income statement format. Operational costs are classified as Cost of revenue, Research & development, Sales & marketing, and General & administrative expenses. This change was made, both because a functionally divided lineup is expected to provide a more transparent picture of G5’s profit developments, and to get a better comparability with other public com-panies in the industry in which the company operates. A number of such companies are using functional income statements.
Comparison figures for 2014 have been adjusted to reflect the changes. More information regarding the changes in reporting format can be found in the Interim report January-March 2015.
Outlook
G5 Entertainment does not publish forecasts.
Risk assessment
G5 Entertainment is, like all companies, exposed to various kinds of risks in its operations. Among the most nota-ble are risks related to the dependency on certain strategic partners, delays in the release of new games, currency exchange risks, changes in technology, dependency on key employees, and tax as well as political risks due to the multi-national nature of the group’s operations. Risk management is an integral part of G5 Entertainment’s man-agement. The risks are described in greater detail in the 2014 annual report.
The risks described for the group can also have an indirect effect on the parent company.
Related-party transactions
During the period no significant related-party transactions have taken place.
Upcoming report dates
Interim report, January-September 2015 November 6, 2015
Year-end report 2015 February 23, 2016
Forward-looking statements
This report may contain statements concerning, among other things, G5 Entertainment’s financial position and performance as well as statements on market conditions that may be forward-looking. G5 Entertainment believes that the expectations reflected in such forward-looking statements are based on reasonable assumptions. Howev-er, forward-looking statements involve inherent risks and uncertainties and actual results or outcomes may differ materially from those expressed. Forward-looking statements relate only to the date they were made and, other than as required by applicable law, G5 Entertainment undertakes no obligation to update any of them in light of new information or future events.
Inquiries
Vlad Suglobov, CEO, [email protected] Stefan Wikstrand, CFO, phone +46 76 00 11 11 5
8
Interim report Jan-Jun 2015
Assurance
The Board of Directors and the CEO declare that the interim report provides a true and fair overview of the Par-ent Company's and the Group’s operations, financial position and results of operations as well as describing the
material risks and uncertainties facing the Parent Company and other companies in the Group.
Stockholm, July 23, 2015
Petter Nylander
Chairman of the Board
Annika Andersson Pär Sundberg Jeffrey Rose Vlad Suglobov
Board member Board member Board member CEO & Board member
Note: G5 Entertainment AB (publ) is required to make the information in this interim report public in compliance with the Swedish Securities Market Act. The information was submitted for publication on July 24, 2015 at 07.30.
This interim report has not been subject to review by the company´s auditors.
Note: This report is published in Swedish and English. In the event of any difference between the English version and the Swe-dish original, the Swedish version shall prevail.
9
Interim report Jan-Jun 2015
Income statement – Group
Statement of comprehensive income - Group
10
Interim report Jan-Jun 2015
Balance sheet - Group
Statement of changes in shareholder’s equity – Group
11
Interim report Jan-Jun 2015
Cash flow statement - Group
12
Interim report Jan-Jun 2015
Note 1 – Accounting principles
G5 Entertainment’s consolidated accounts have been prepared in accordance with International Financial Report-ing Standards (IFRS). This report was prepared for the group in accordance with the IAS 34 Interim Financial Re-porting and the Annual Accounts Act. The accounting and calculation principles used in the report for the group are identical to those used in the Annual Report 2014. None of the new and changed standards from IASB, appli-cable from 1st of January 2015, has had any material effect on the Financial Statements. For detailed information on the accounting principles, see Annual report 2014.
Note 2 – Capitalized development costs
Note 3 – Tax
G5 Entertainment is active in a number of different jurisdictions, with different tax rates. The Group’s effective tax rate consequently varies between periods depending on the distribution of revenues and costs, and the Group’s profit level. In the first half of the year the effective tax rate was higher than usual due to specific combi-nation of profit distribution among subsidiaries and temporary differences between the carrying amount and the tax base of some of the group’s intangible assets.
In 2014 the effective tax rate was influenced by a revaluation of deferred tax assets related to temporary differ-ences.
Note 4 – Other receivables
Other receivables include 6,836 (4,929) kSEK for prepaid royalties to third party developers. G5 publishes both proprietary games and games licensed from third-party developers. In connection with the conclusion of agree-ments with third party developers G5 sometimes pays an advance on royalties to fund game development. These advances are usually offset toward the third party developer's contractual share of the revenue that each game gen-erates.
Note 5 – Pledged assets and contingent liabilities
Floating charge 3,000 (3,000) kSEK, pledged for cheque account with overdraft facility (400 kUSD). The over-draft facility was unused as of June 30, 2015.
Bank account 50 (50) kSEK, pledged for bank guarantee.
Different advisors consulted by the company have different views on a tax matter relating to payment of compen-sation to developers during previous years. The issue includes among others the interpretation of the applicable tax laws in countries where G5 operates. G5 considers the risk of additional tax to be small, but a certain risk ex-posure exists, with a maximum amount estimated to 3.5 mSEK.
Note 6 – Fair value
G5 group has no financial instruments that are accounted for at fair value. The carrying amount for financial in-struments correspond to fair value.
13
Interim report Jan-Jun 2015
Income statement – parent company
Statement of comprehensive income – parent company
14
Interim report Jan-Jun 2015
Balance sheet – parent company
15
Interim report Jan-Jun 2015
Glossary
FINANCIAL STATEMENT
Cost of revenue consists of direct expenses incurred in order to generate revenue from the company’s games. This primarily includes commission to distributors and royalties to external developers.
Research & development expenses primarily consist of salaries, bonuses and benefits for the company’s de-velopers. In addition, research and development expenses include outside services, as well as allocated facilities and other overhead costs. Costs associated with maintaining the company’s computer software and associated in-frastructure are expensed as incurred. Development costs up to soft release of the company’s games that are di-rectly attributable to the design and testing of the company’s identifiable and unique games are recognized as in-tangible assets, and amortized within research and development expense over a 24-month period.
Sales & marketing expenses primarily consist of user acquisition expenses. Sales and marketing also includes salaries, bonuses, and benefits for the company’s sales and marketing staff, as well as consulting fees. In addition, sales and marketing expenses include general marketing, branding, advertising and public relations costs.
General & administrative expenses primarily consist of salaries, bonuses, and benefits for the company’s ex-ecutive, finance, legal, information technology, human resources and other administrative employees, as well as support staff. It also includes outside consulting, legal and accounting services, insurance as well as facilities and other overhead costs not allocated to other areas across the business. In addition, general and administrative ex-penses include all of the company’s depreciation expenses.
OPERATIONAL TERMS
PC Personal computer
MAC Personal computer sold by Apple Inc.
iOS Operating system for iPad, iPhone, and Apple TV
Android Operating system for smartphones and tablets
G5 Entertainment AB is a developer and publisher of high quality downloadable games for iOS, Android, Kindle Fire, Mac, and Windows devices. G5 develops and publishes games that are family-friendly, easy to learn, and targeted at the widest audience of experienced and novice players. G5’s portfolio includes a number of popular games like Survivors: The Quest™, Mahjong Journey™, The Secret Society™, Virtual City®, Special Enquiry Detail® and Supermarket Mania®. G5 Entertainment AB is listed on Nasdaq Stockholm since 2014.
G5 ENTERTAINMENT AB (publ) RIDDARGATAN 18, 114 51 STOCKHOLM SWEDEN
PHONE: +46 84 11111 5 FAX: +46 84 1111 65
E-MAIL: [email protected] ORG.NR. 556680-8878
HTTP://WWW.G5E.SE