Embed Size (px)
Citation preview

INTERIM REPORT
JANUARY-JUNE 2015

2 / 33
PKC Group Plc INTERIM REPORT 6 August 2015 8.15 a.m.
PKC GROUP Q2/2015:GROUP EBITDA BEFORE NON-RECURRING ITEMS UP 22%, DRIVEN BY CONTINUED IMPROVEMENTIN WIRING SYSTEMS SEGMENT
APRIL - JUNE 2015 HIGHLIGHTS· Revenue increased 8.7% on the comparison period (4-6/2014), totalling EUR 223.9 million (EUR 206.0
million). The changes in consolidation exchange rates increased the revenue by approximately +13%.· EBITDA before non-recurring items increased 21.5% on the comparison period (4-6/2014), totalling EUR
15.7 million (EUR 12.9 million) and 7.0% (6.3%) of revenue.· Wiring Systems business segment’s EBITDA before non-recurring items increased 22.2% on the
comparison period (4-6/2014), totalling EUR 16.5 million (EUR 13.5 million) and 7.9% (7.1%) ofrevenue.
· Operating profit before non-recurring items increased 33.2% on the comparison period (4-6/2014),totalling EUR 8.1 million (EUR 6.1 million) and 3.6% (3.0%) of revenue.
· Diluted earnings per share were EUR -0.06 (EUR 0.11) including the impact of EUR 5.4 million (EUR 1.5million) non-recurring items in operating profit.
· Cash flow after investments was EUR 1.6 million (EUR 7.4 million).
JANUARY - JUNE 2015 HIGHLIGHTS· Revenue increased 9.8% on the comparison period (1-6/2014), totalling EUR 450.4 million (EUR 410.0
million). The changes in consolidation exchange rates increased the revenue by approximately +12%.· EBITDA before non-recurring items increased 31.2% on the comparison period (1-6/2014), totalling EUR
32.4 million (EUR 24.7 million) and 7.2% (6.0%) of revenue.· Wiring Systems business segment’s EBITDA before non-recurring items increased 26.4% on the
comparison period (1-6/2014), totalling EUR 31.8 million (EUR 25.2 million) and 7.7% (6.6%) ofrevenue.
· Operating profit before non-recurring items increased 51.2% on the comparison period (1-6/2014),totalling EUR 17.3 million (EUR 11.4 million) and 3.8% (2.8%) of revenue.
· Diluted earnings per share were EUR 0.12 (EUR 0.15) including the impact of EUR 5.9 million (EUR 4.2million) non-recurring items in operating profit.
· Cash flow after investments was EUR -30.2 million (EUR -11.0 million).
PKC GROUP’S OUTLOOK FOR 2015· PKC Group estimates that with prevailing exchange rates 2015 revenue will be higher than previous
year level, and that comparable EBITDA will be higher than in 2014. In 2014, PKC’s revenue was EUR829.5 million and comparable EBITDA before non-recurring items was EUR 48.6 million*. Revenue andEBITDA estimates are based on current business structure.

3 / 33
KEY FIGURES* 4-6/15 4-6/14Change
% 1-6/15 1-6/14Change
% 1-12/14EUR 1,000 (unless otherwise noted)Revenue 223,886 205,966 +8.7 450,380 410,023 +9.8 829,516EBITDA** 15,708 12,926 +21.5 32,441 24,732 +31.2 48,572% of revenue 7.0 6.3 7.2 6.0 5.9Operating profit** 8,118 6,095 +33.2 17,268 11,421 +51.2 21,384% of revenue 3.6 3.0 3.8 2.8 2.6Non-recurring items -5,361 -1,465 -5,943 -4,200 -28,362Operating profit (loss) 2,757 4,631 -40.5 11,324 7,221 +56.8 -6,978% of revenue 1.2 2.2 2.5 1.8 -0.8Profit (loss) before taxes 1,397 3,871 -63.9 9,182 5,225 +75.7 -10,528Net profit (loss) for thereport period -1,388 2,593 -153.5 2,972 3,501 -15.1 -29,051Earnings per share (EPS),EUR -0.06 0.11 -153.4 0.12 0.15 -15.3 -1.21Cash flow after investments 1,550 7,390 -79.0 -30,245 -10,965 175.8 20,699ROCE,% 12.8 7.8 7.7Gearing, % 21.1 14.0 -5.6Average number ofpersonnel 19,848 19,246 +3.1 19,766 19,026 +3.9 19,640
* PKC Group has reclassified certain financial items and operating expenses as of the beginning of 2015.Comparison periods have been adjusted accordingly. The changes to revenue and operating profit (loss)are minor and have no impact on the net profit (loss) for the period or shareholders’ equity. The changesare presented in detail in the table section of the interim report Q1/2015.** before non-recurring items
MATTI HYYTIÄINEN, PRESIDENT & CEO:
”Revenue in the second quarter increased on the comparison period by 8.7% and was EUR 223.9 million. InNorth America and Europe, production of heavy-duty trucks grew on the comparison period and on the firstquarter of the current year. However, production volumes of medium-duty trucks in North America and inEurope declined in comparison with both the comparison period and first quarter. In Brazil, production volumescontinued to decline in comparison with the comparison period but were higher than in the first quarter’sholiday season.
PKC's operating profit before non-recurring items increased on the comparison period by 33.2% and was EUR8.1 million. In North America, the largest production unit in Acuna, Mexico was hit by a tornado in May causingproduction stoppage that had negative impact on the unit’s profitability. In Europe, the ongoing productionreorganisation continued to encumber profitability but progressed as planned apart from some productiontransfers that have been delayed due to customers’ approval processes. In Brazil despite low productionvolumes, actions to improve operating profit are taking effect although operations remained loss-making. Themedium term outlook for truck market in Brazil is weak and therefore we have decided to close Curitiba factoryand consolidate all production to Campo Alegre factory.
PKC 2018 strategy is proceeding. The acquisition of Groclin’s Wiring & Controls business that was announcedin February has been finalised and business shall be consolidated into PKC Group as of 1 July 2015.Customers and personnel have reacted positively to the acquisition. Also the establishment of Chinese jointventure with Huakai announced in March has proceeded quickly and it is estimated that the company startsoperations in Q3/2015.

4 / 33
In North America the full-year production volume forecasts for trucks are slightly weaker than previousestimation. The demand in North America has stabilised. In Europe, the production volumes in the second halfof the year are estimated to fall slightly short of first half’s volumes taking into account the holiday seasonproduction stoppages. In Brazil, production volume estimates have been further decreased.
PKC's strong market position is a result of our personnel’s commitment to high-quality customer service. I wishto thank all PKC personnel for their good performance.”
OPERATING ENVIRONMENT
Wiring Systems Business
PKC Group’s key customers operate in the commercial vehicle industry which products are investmentgoods and as such their demand is highly correlated to the general economic situation. Economic activitycontinued on a good level in North America during the report period. The growth of the European economyhas continued to be low and deflationary and political risks still exist. The European Central Bank’squantitative easing, lower oil prices and increased export competitiveness have increased the optimismslightly which has been jeopardized by the recent events in Greece. In Brazil and Russia, the economicgrowth has slowed down and the economies are in recession. China’s economic indicators have continuedto weaken which has also been reflected in strong decline of the share prices in China recently.
PKC Group’s functional currency the euro has depreciated against the US dollar during the report period andwas on average clearly weaker than during the comparison period. During the second quarter, however, theeuro was more stable against the US dollar compared to the first quarter of the year. During the reportingperiod the Brazilian real has depreciated in relation to the euro. US dollar has continued to strengthenagainst Mexican peso and was on a significantly stronger level than in the comparison period. The Russianrouble strengthened until April, but has since depreciated somewhat. Majority of PKC Group’s Russianmanufacturing output is being exported. The price of key raw material, copper, increased in the beginning ofthe year, but returned to its longer term declining trend during the second quarter due to lowering demand inChina and due to recent general slump in commodity prices. On average the customer sales prices areupdated with a 3-5 month delay on the basis of copper price changes.
Vehicle production,Europe, units 4-6/15 4-6/14
Change% 1-3/15
Change% 1-12/14
Heavy duty trucks 83,835 76,735 +9.3 82,260 +1.9 308,799Medium duty trucks 18,795 19,274 -2.5 20,395 -7.8 73,564
Source: LMC Automotive Q2/2015
European truck demand has started to recover but is still below the normal replacement level.
Vehicle production,North America, units 4-6/15 4-6/14
Change% 1-3/15
Change% 1-12/14
Heavy duty trucks 89,066 73,788 +20.7 79,394 +12.2 297,499Medium duty trucks 57,249 60,044 -4.7 57,797 -0.9 227,148Light vehicles(Pick-up & SUV) 2,465,367 2,313,970 +6.5 2,249,841 +9.6 8,884,232
Source: LMC Automotive Q2/2015
Record freight volumes continue to drive the demand for heavy duty trucks. In addition to the replacementinvestment, the expansion of transportation capacity has boosted the truck demand.

5 / 33
Vehicle production,Brazil, units 4-6/15 4-6/14
Change% 1-3/15
Change% 1-12/14
Heavy duty trucks 19,849 25,132 -21.0 16,260 +22.1 101,617Medium duty trucks 7,255 7,454 -2.7 7,043 +3.0 35,892
Source: LMC Automotive Q2/2015
In Brazil the weak economic situation continues to have a strong negative impact on the demand for trucks.
Electronics Business
Global caution among companies towards industrial investment exerted a negative impact on the demand forelectronics products. The demand for renewable-energy and energy saving products including smart gridsolutions on the market decreased slightly compared to the second quarter of previous year. The marketdemand for telecommunications related products remained on the comparison period’s level.
REVENUE AND FINANCIAL PERFORMANCE
April-June 2015
Revenue in April-June amounted to EUR 223.9 million (EUR 206.0 million), up 8.7% on the same period ayear earlier. The changes in consolidation exchange rates increased the revenue by approximately +13%.The revenue in North America included some negative impact due to light vehicle program build-outs wherea major individual program ended in December 2014 which was not compensated in local currency byincreased revenue to truck customers. In Europe the revenue increased, while the revenue in Brazildecreased significantly due to poor market conditions. The revenue in the Electronics business segmentdecreased from seasonally very high numbers in the first quarter and was at the level of the same quarter ayear earlier.
During the report period EUR -5.4 million (EUR -1.5 million) in non-recurring items were recognised. Non-recurring items consist of restructuring expenses in South America (EUR 5.0 million) related to the closure ofCuritiba factory and expenses related to Group’s strategic reorganisation (EUR 0.4 million). Non-cash non-recurring items were EUR -0.8 million (EUR 0.1 million). EBITDA before non-recurring items was EUR 15.7million (EUR 12.9 million) and 7.0% (6.3%) of revenue. Operating profit before non-recurring items and PPAdepreciation and amortisation related to acquisitions totalled EUR 10.4 million (EUR 8.1 million), accountingfor 4.6% of revenue (3.9%). Operating profit totalled EUR 2.8 million (EUR 4.6 million), accounting for 1.2%of revenue (2.2%). Operating profit was improved by lower losses in Brazil and positive translation impactarising from exchange rates. In North America the increase of labour force within overheated job marketresulted in suboptimal productivity and premium freight expenses. Favourable Mexican peso depreciation didnot compensate additional labour and freight expenses. In Europe and South America the developmentprogram continues. In South America, the production capacity will be further adjusted by closing the Curitibafactory and by consolidating all production capacity in Brazil to Campo Alegre factory by the end of secondquarter of 2016. Total depreciation and amortisation amounted to EUR 8.4 million (EUR 6.7 million),including EUR 0.8 million in non-recurring items (EUR -0.1 million). PPA depreciation and amortisationamounted to EUR 2.3 million (EUR 2.0 million).
Financial items were EUR -1.4 million (EUR -0.8 million). Financial items include foreign exchangedifferences totalling EUR -0.2 million (EUR 0.0 million). Profit before taxes was EUR 1.4 million (EUR 3.9million). Income tax of the report period amounted to EUR 2.8 million (EUR 1.3 million). The effective tax ratecontinued to be impacted by PKC Group’s high exposure to North America and losses in Brazil, on the otherhand, whereby no deferred tax assets are no longer being recognized. Net profit for the report period totalledEUR -1.4 million (EUR 2.6 million). Earnings per share were EUR -0.06 (EUR 0.11).
Wiring Systems Business
Revenue generated by the Wiring Systems business in the report period amounted to EUR 209.2 million(EUR 191.3 million), or 9.4% more than in the comparison period. The changes in consolidation exchange

6 / 33
rates increased the revenue by approximately +14%. The revenue in North America included some negativeimpact due to light vehicle program build-outs where a major individual program ended in December 2014which was not compensated in local currency by increased revenue to truck customers. In Europe therevenue increased, while the revenue in Brazil decreased significantly due to poor market conditions. Thesegment’s share of the consolidated revenue was 93.5% (92.9%).
During the report period EUR -5.0 million (EUR -0.9 million) in non-recurring items were recognised. Non-recurring items consist of restructuring expenses in South America related to the closure of Curitiba factory.Non-cash non-recurring items were EUR -0.8 million (EUR 0.1 million). EBITDA before non-recurring itemswas EUR 16.5 million (EUR 13.5 million) and 7.9% (7.1%) of revenue. Operating profit before non-recurringitems was EUR 9.4 million (EUR 7.0 million), equivalent to 4.5% of the segment’s revenue (3.7%). Operatingprofit was EUR 4.4 million (EUR 6.2 million), equivalent to 2.1% of the segment’s revenue (3.2%). Operatingprofit was improved by lower losses in Brazil and positive translation impact arising from exchange rates. InNorth America the increase of labour force within overheated job market resulted in suboptimal productivityand premium freight expenses. Favourable Mexican peso depreciation did not compensate additional labourand freight expenses. In Europe and South America the development program continues. In South America,the production capacity will be further adjusted by closing the Curitiba factory and by consolidating allproduction capacity in Brazil to Campo Alegre factory by the end of second quarter of 2016.
Electronics Business
Revenue generated by the Electronics business was at the same level as on the comparison period at EUR14.7 million (EUR 14.7 million). The segment’s share of the consolidated revenue was 6.5% (7.1%). Duringthe report and comparison period no non-recurring items were recognised. EBITDA before non-recurringitems was EUR 0.7 million (EUR 0.8 million) and 4.7% (5.2%) of revenue. Operating profit was EUR 0.2million (EUR 0.4 million), equivalent to 1.7% of the segment’s revenue (2.8%).
January-June 2015
Revenue in January-June amounted to EUR 450.4 million (EUR 410.0 million), up 9.8% on the same perioda year earlier. The changes in consolidation exchange rates increased the revenue by approximately +12%.The revenue in North America included some negative impact due to light vehicle program build-outs wherea major individual program ended in December 2014 which was not compensated in local currency byincreased revenue to truck customers. In Europe the revenue increased, while the revenue in Brazildecreased significantly due to poor market conditions. The revenue in the Electronics business segmentdeveloped favourably during the reporting period.
During the report period EUR -5.9 million (EUR -4.2 million) in non-recurring items were recognised. Non-recurring items consist of restructuring expenses in South America (EUR 5.0 million) related to the closure ofCuritiba factory and expenses related to Group’s strategic reorganisation (EUR 0.9 million). Non-cash non-recurring items were EUR -0.8 million (EUR 0.1 million). EBITDA before non-recurring items was EUR 32.4million (EUR 24.7 million) and 7.2% (6.0%) of revenue. Operating profit before non-recurring items and PPAdepreciation and amortisation related to acquisitions totalled EUR 21.9 million (EUR 15.5 million), accountingfor 4.9% of revenue (3.8%). Operating profit totalled EUR 11.3 million (EUR 7.2 million), accounting for 2.5%of revenue (1.8%). Operating profit was improved by lower losses in Brazil and by positive translation impactarising from exchange rates. In addition, improved profitability in the Electronics business improvedconsolidated operating profit. In North America the increase of labour force within overheated job market hasresulted in suboptimal productivity and premium freight expenses, which were not compensated byfavourable Mexican peso depreciation. In Europe and South America the development program continues. InSouth America, the production capacity will be further adjusted by closing the Curitiba factory and byconsolidating all production capacity in Brazil to Campo Alegre factory by the end of second quarter of 2016.Total depreciation and amortisation amounted to EUR 16.0 million (EUR 13.2 million), including EUR 0.8million in non-recurring items (EUR -0.1 million). PPA depreciation and amortisation amounted to EUR 4.7million (EUR 4.1 million).
Financial items were EUR -2.1 million (EUR -2.0 million). Financial items include foreign exchangedifferences totalling EUR 0.1 million (EUR -0.1 million). Profit before taxes was EUR 9.2 million (EUR 5.2

7 / 33
million). Income tax of the report period amounted to EUR 6.2 million (EUR 1.7 million). The effective tax ratecontinued to be impacted by PKC Group’s high exposure to North America and losses in Brazil, on the otherhand, whereby no deferred tax assets are no longer being recognized. Net profit for the report period totalledEUR 3.0 million (EUR 3.5 million). Earnings per share were EUR 0.12 (EUR 0.15).
Wiring Systems Business
Revenue generated by the Wiring Systems business in the report period amounted to EUR 414.9 million(EUR 379.9 million), or 9.2% more than in the comparison period. The changes in consolidation exchangerates increased the revenue by approximately +13%. The revenue in North America included some negativeimpact due to light vehicle program build-outs where a major individual program ended in December 2014which was not compensated in local currency by increased revenue to truck customers. In Europe therevenue increased, while the revenue in Brazil decreased significantly due to poor market conditions. Thesegment’s share of the consolidated revenue was 92.1% (92.7%).
During the report period EUR -5.0 million (EUR -3.0 million) in non-recurring items were recognised. Non-recurring items consist of restructuring expenses in South America related to the closure of Curitiba factory.Non-cash non-recurring items were EUR -0.8 million (EUR 0.1 million). EBITDA before non-recurring itemswas EUR 31.8 million (EUR 25.2 million) and 7.7% (6.6%) of revenue. Operating profit before non-recurringitems was EUR 17.6 million (EUR 12.6 million), equivalent to 4.2% of the segment’s revenue (3.3%).Operating profit was EUR 12.5 million (EUR 9.6 million), equivalent to 3.0% of the segment’s revenue(2.5%). Operating profit was improved by lower losses in Brazil and by positive translation impact arisingfrom exchange rates. In North America the increase of labour force within overheated job market hasresulted in suboptimal productivity and premium freight expenses, which were not compensated byfavourable Mexican peso depreciation. In Europe and South America the development program continues. InSouth America, the production capacity will be further adjusted by closing the Curitiba factory and byconsolidating all production capacity in Brazil to Campo Alegre factory by the end of second quarter of 2016.
Electronics Business
Revenue generated by the Electronics business increased by 17.8% to EUR 35.5 million (EUR 30.1 million).The segment’s share of the consolidated revenue was 7.9% (7.3%). Especially the revenue of own productsincreased during the reporting period. During the report and comparison period no non-recurring items wererecognised. EBITDA before non-recurring items was EUR 3.5 million (EUR 2.0 million) and 9.9% (6.6%) ofrevenue. Operating profit was EUR 2.7 million (EUR 1.3 million), equivalent to 7.5% of the segment’srevenue (4.3%). Profitability was improved due to higher share of own products in the revenue during thereporting period.
FINANCIAL POSITION AND CASH FLOW
Consolidated total assets on 30 June 2015 amounted to EUR 468.5 million (EUR 445.5 million). At the closeof the report period, interest-bearing liabilities totalled EUR 125.7 million (EUR 101.2 million), whichconsisted of non-current interest-bearing debt of EUR 101.2 million and current interest-bearing debt of EUR24.5 million. Current interest-bearing liabilities consisted of the issuance of commercial papers. PKC Grouphas a domestic commercial paper program whereby PKC Group regularly issues short term notes. Inaddition, the group has a committed, un-utilized credit facility of EUR 90.0 million. PKC Group selectivelyutilizes also non-recourse factoring arrangements with some customers. At the close of the report period theoutstanding amount was EUR 33.9 million (EUR 19.9 million).
The effective average interest rate of the interest-bearing debt including the expenses of the unutilized creditfacility was at the close of the report period 3.1% (4.0%). The Group’s equity ratio was 32.6% (41.9%) whichwas negatively impacted by large non-recurring items and additional taxes during second half of 2014. Netinterest-bearing liabilities totalled EUR 32.2 million (EUR 26.2 million) and gearing was 21.1% (14.0%).
PKC Group uses derivatives to hedge risks arising from changes in some key foreign exchange rates,interest rates and copper price. At the end of the report period nominal value of copper derivatives (forwardcontracts) was EUR 3.4 million (EUR 4.4 million). The Group utilizes euro-denominated interest rate swaps

8 / 33
to maintain the targeted level for interest rate fixing term. Based on the currently outstanding interest rateswap the Group receives fixed rate interest until September 2018 and pays floating interest based on Euriborsix months rate. The nominal value of the interest rate swap was EUR 50.0 million (EUR 75.0 million) at theclose of the report period. At the end of the report period the nominal amount of currency forwards was EUR93.3 million (EUR 30.2 million).
Inventories amounted to EUR 94.1 million (EUR 82.2 million). Current receivables totalled EUR 123.7 million(EUR 125.5 million). Net cash from operating activities was EUR -25.2 million (EUR 0.1 million) and cashflow after investments during the report period was EUR -30.2 million (EUR -11.0 million). The core networking capital (inventories, trade receivables and trade payables) decreased from the end of previousquarter by EUR 7.0 million. Total net working capital at the end of June 2015 was EUR 59.8 million (EUR78.2 million) representing a decrease of EUR 2.5 million during the quarter, while in the comparison quarterthe decrease was EUR 3.3 million. Total net working capital includes the recording of additional EUR 8.3million tax liability in the third quarter 2014 and some liabilities related to non-recurring items in Europe,South America and North America which were recorded in 2014 and 2015 and are to be paid during 2015and 2016. Cash and cash equivalents amounted to EUR 93.5 million (EUR 75.0 million).
CAPITAL EXPENDITURE
During the report period, the Group’s gross capital expenditure totalled EUR 5.4 million (EUR 11.5 million),representing 1.2% of revenue (2.8%). Gross capital expenditure is geographically divided as follows: NorthAmerica 54.8% (33.7%), Europe 38.8% (44.2%), APAC 3.4% (11.7%) and South America 3.0% (10.4%).The capital expenditure consisted of regular maintenance investments into production machinery andequipment during the report period.
PKC estimates that in the medium term, the Group's replacement investment level is close to its annualdepreciation and amortisation level excluding PPA related depreciation and amortization, and impairmentlosses. The Group’s depreciation, amortisation and impairment losses amounted to EUR 16.0 million (EUR13.2 million) in the report period. Excluding PPA related depreciation and amortisation, and impairmentlosses it amounted to EUR 10.5 million (EUR 9.3 million).
RESEARCH & DEVELOPMENT
Research and development costs totalled EUR 4.7 million (EUR 4.1 million), representing 1.0% (1.0%) of theconsolidated revenue. At the end of report period 146 (154) people worked in product development,excluding production development and process development personnel.
In its product strategy, product development in PKC’s Wiring Systems business takes into consideration thelong- and short-term product development needs of PKC’s customers and the latest development trends inthe automotive industry.
PKC’s main products are individually tailored electrical distribution systems, in addition to which PKC’sproduct development is a pioneer in the application of new solutions for the needs of its customers. Agrowing part of PKC’s global product range is vehicle electronics, through which PKC can offer its customersmore thoroughly optimised electrical distribution systems.
Through active technological development, improvement is constantly being sought in product quality andperformance: alternative materials are researched and utilised, and new innovative solutions are developedfor the vehicle electrical distribution systems architecture. Improvements are being implemented cost-effectively with the aim of minimising the overall costs of the customer’s product.
The strong areas of expertise of PKC’s Electronics business product development are test and powermanagement solutions.
PERSONNEL
During the report period, the Group had an average payroll of 19,766 employees (19,026). At the end of the

9 / 33
report period, the Group’s personnel totalled 19,710 employees (19,513), of whom 19,410 (19,210) workedabroad and 300 (303) in Finland. In addition the Group had at the end of the report period 736 (441)temporary employees. 97.1% of the personnel were employed by the wiring systems business segment and2.8% by the electronics business segment. Geographically personnel was divided at the end of the reportperiod as follows: North America 61.6%, Europe 28.3%, South America 8.0% and Asia 2.0%. Total amountof report period’s employee benefit expenses was EUR 117.2 million (EUR 104.4 million) including EUR 3.7million (EUR 2.7 million) classified as non-recurring expenses.
Majority of PKC’s manufacturing is labour intensive and the Group’s competitiveness is based on its skilledpersonnel. In order to maintain a skilled and engaged workforce, PKC focuses on developing its employees’competences. PKC takes a systematic approach to labour protection and frequently follows e.g. injury andoccupational disease rates and absentee rates which are reported also in PKC Group’s corporateresponsibility report.
QUALITY AND THE ENVIRONMENT
During the period wiring harness factory in Panevezys (Lithuania) has been certified according to ISO9001quality standard and ISO14001 environmental standard. Activities to certify the plant according toISO/TS16949 are on-going. Letter of Conformance according to ISO/TS16949 has been issued to wiringharness factory in Smederevo (Serbia) and certification is planned later in the year. Electronics factory inSuzhou (China) is proceeding with activities to certify the plant according to ISO13485 quality standard formedical equipment manufacturing during 2015.

10 / 33
Certifications at the end of the report period can be found by segment and manufacturing location in thetable below.
ISO9001(Quality)
ISO/TS 16949(Quality)
ISO14001(Environmental)
OHSAS 18001(Occupational
health &safety)
ISO13485 1)
(Medicalequipment
manufacturing)Wiring Systems
Acuna, Mexico 2) X X XJuarez, Mexico 2) X X XPiedras Negras,Mexico
2)X X X
Torreon , Mexico 2) X X XTraverse City, USA XBarchfeld,Germany
X X X
Keila, Estonia X X X XKostomuksha,Russia
X X X
Panevezys,Lithuania
XTarget
Q1/2016X
Smederevo, Serbia XLetter of
ConformanceX
Starachowice,Poland
X X X
Campo Alegre,Brasil
X X X
Curitiba, Brasil X X 3)Suzhou, China X X X
ElectronicsRaahe, Finland X X X X
Suzhou, China X X XTarget
Q1/20161) ISO13485 applicable for electronics manufacturing only2) Plants working according to ISO9001 requirements but separate certificates not requested3) Certification process on-going
PKC wants to take responsibility for the well-being of the environment by developing energy-saving solutionsand by designing products where emissions and material usage are minimised. The environmental impact ofmanufacturing will be reduced by optimizing deliveries, improving energy efficiency of production facilitiesand the efficient management of materials.
MANAGEMENT
The Annual General Meeting held on 1 April 2015, re-elected Reinhard Buhl, Wolfgang Diez, Shemaya Levy,Mingming Liu, Robert Remenar, Matti Ruotsala and Jyrki Tähtinen as Board members. In the Board’sorganisation meeting, Matti Ruotsala was elected as Chairman of the Board and Robert Remenar as Vice-Chairman.

11 / 33
Shemaya Levy was elected as the chairman of the Audit Committee and Wolfgang Diez, Mingming Liu andJyrki Tähtinen as members. The Board elected Matti Ruotsala as chairman of the Nomination andRemuneration Committee and Reinhard Buhl and Robert Remenar as members.
KPMG Oy Ab, which has announced Virpi Halonen, APA, to be the Auditor with principal responsibility, wasselected as auditor.
At the end of the report period the Group’s Executive Board consisted of the following persons MattiHyytiäinen, Chairman (President & CEO), Jyrki Keronen (Senior Vice President, Business Development &APAC), Jani Kiljala (President, Wiring Systems, Europe and South America), Sanna Raatikainen (GeneralCounsel), Jarmo Rajala (President, Electronics), Frank Sovis (President, Wiring Systems, North America)and Juha Torniainen (CFO).
DIVIDEND FOR 2014
The Annual General Meeting held on 1 April 2015 resolved to pay a dividend of EUR 0.70 per share: i.e. atotal of about EUR 16.8 million. The dividend was paid out on 14 April 2015.
SHARE TURNOVER AND SHAREHOLDERS
Trading of shares on Nasdaq Helsinki 1-6/15 1-6/14Turnover in shares 5,868,509 6,356,538Share turnover, EUR million 117.0 144.4Turnover in shares per average number of shares, % 24.5 26.6
PKC’s shares are also traded on alternative exchanges (such as Chi-X, BATS and Turquoise). The totaltrading volume on these particular alternative exchanges was 585,954 shares (612,778 shares) during thereport period.
Shares and market value on Nasdaq Helsinki 1-6/15 1-6/14Number of shares at the close of the report period 24,041,887 23,970,004Lowest share price during the report period, EUR 16.62 20.63Highest share price during the report period, EUR 23.37 26.33Share price at close of the report period, EUR 19.83 20.92Average share price of the report period, EUR 20.05 22.69Market capitalisation at the close of the report period, EURmillion 476.8 501.5
The shares held by Executive Board members, Board members, their closely associated persons andcorporations in which they have a controlling interest accounted for 0.3% (0.1%) of the total number ofshares at the end of the report period. PKC Group Plc had a total of 8,425 shareholders (8,466) at the end ofreport period. The shares held by foreigners and through nominee registrations at the close of the reportperiod totalled 36.7% of the share capital (36.8%).
Flaggings
On 12 January 2015 the share of votes and share capital in PKC Group Plc held by Nordea Funds Oy(1737785-9) fell below the limit of 5%. Following the transaction Nordea Funds Oy owned 1,183,325 PKCGroup Plc shares and votes, i.e. 4.94% of the share capital and votes.
On 19 February 2015 the share of votes and share capital in PKC Group Plc held by Nordea Funds Oy(1737785-9) exceeded the limit of 5%. Following the transaction Nordea Funds Oy owned 1,201,128 PKCGroup Plc shares and votes, i.e. 5.01% of the share capital and votes.

12 / 33
On 17 June 2015 the share of votes and share capital in PKC Group Plc held by Nordea Funds Oy(1737785-9) fell below the limit of 5%. Following the transaction Nordea Funds Oy owned 1,168,031 PKCGroup Plc shares and votes, i.e. 4.86% of the share capital and votes.
NUMBER OF SHARES
PKC Group Plc’s number of shares has changed during the report period as follows:Registrations of new sharescorresponding to subscriptions
2009Boptions
2009Coptions
2012A(i)options
2012A(ii)options
Number of sharesafter subscriptions
29.1.2015 5,000 - - - 23,975,50425.3.2015 6,660 1,000 - - 23,983,16415.5.2015 25,723 19,000 7,500 6,500 24,041,887
THE BOARD'S AUTHORISATIONS
The Board of Directors was granted authorisation by the Annual General Meeting on 3 April 2014 to decideon one or more share issues and granting of special rights defined in Chapter 10, Section 1 of theCompanies Act and all the terms and conditions thereof. A maximum total of 4,750,000 shares may beissued or subscribed for on the basis of authorisation. The authorisation includes the right to decide ondirected share issues. The authorisation is in force for five years from the date of the General Meeting'sdecision. At Board of Directors' discretion the authorisation may be used e.g. in financing possible corporateacquisitions, inter-company co-operation or similar arrangement, or strengthening Company's financial orcapital structure. The authorisation revoked the authorisation granted on 30 March 2011.
The Board of Directors was granted authorisation by the Annual General Meeting on 1 April 2015 to resolveto repurchase a maximum of 530,000 shares in the Company by using funds in the unrestrictedshareholders' equity. The number of shares corresponds 2.2 per cent of all shares of the Company. Theprice paid for the shares repurchased shall be based on the market price of the Company´s shares in publictrading. The minimum price to be paid would be the lowest market price of the share quoted in public tradingduring the authorization period and the maximum price the highest market price quoted during theauthorization period. Own shares can be repurchased otherwise than in proportion to the shareholdings ofthe shareholders (directed repurchase). The authorization is used for purposes determined by the Board ofDirectors, among other things, for the Company's incentive plans. The authorization is effective until nextAnnual General Meeting of Shareholders, however, at most until 30 September 2016.
The company does not have any own shares (treasury shares) in its possession.

13 / 33
STOCK OPTION SCHEMES
2009 options
2009A 2009B 2009CSubscription period ended
30.4.2014ended
30.4.20151.4.2014-30.4.2016
Current subscription price, EUR - - 15.88Total amount of options 200,000 200,000 200,000Held by PKC or non-allocated - - 57,500Exercised 195,500 167,215 30,000Expired 4,500 32,785 -Outstanding - - 112,500Invested non-restrictedequity fund can increase by, EUR - - 1,786,500
The key personnel stock option scheme initiated in 2009 comprises a total of 600,000 options divided into A,B and C warrants. The stock options entitle their owners to subscribe for a maximum total of 600,000 newshares in the company or existing shares held by the company. After the beginning of the subscription periodoptions will no longer be distributed to key personnel. The subscription price for shares through the exerciseof the 2009 stock options is the volume-weighted average price of the PKC Group Plc share on NasdaqHelsinki for April 2009, 2010 and 2011 +20% with dividend adjustments. Options which subscription periodhas begun and are held by PKC cannot be exercised.
2012 options
2012A(i) 2012A(ii) 2012B(i) 2012B(ii) 2012C(i) 2012C(ii)Subscription period 1.4.2015-
30.4.20171.4.2015-30.4.2017
1.4.2016-30.4.2018
1.4.2016-30.4.2018
1.4.2017-30.4.2019
1.4.2017-30.4.2019
Current subscription price, EUR 15.31 15.31 16.65 16.65 23.28 23.28Total amount of options 170,000 170,000 170,000 170,000 170,000 170,000Held by PKC or non-allocated 137,500 137,500 10,000 10,000 31,500 31,500Exercised 7,500 6,500Outstanding 25,000 26,000 160,000 160,000 138,500 138,500Invested non-restrictedequity fund can increase by,EUR 382,750 398,060 2,830,500 2,830,500 3,957,600 3,957,600
The key personnel stock option scheme initiated in 2012 comprises a total of 1,020,000 options. The stockoptions are marked with the symbol 2012A(i) and 2012A(ii); 2012B(i) and 2012B(ii); as well as 2012C(i) and2012C(ii). A total of 170,000 stock options are included in each stock option class. The stock options entitletheir owners to subscribe for a maximum total of 1,020,000 new shares in the company or existing sharesheld by the company. The subscription price for shares through the exercise of the 2012 stock options is thevolume-weighted average price of the PKC Group Plc share on Nasdaq Helsinki during first quarter in 2012,2013 and 2014. Options which subscription period has begun and are held by PKC cannot be exercised.
The share subscription period for stock options 2012A(ii), 2012B(ii) and 2012C(ii) shall, however, notcommence, unless certain operational or financial targets of the Group established for the exercise of stockoptions and determined by the Board of Directors have been attained. The Board of Directors shall annuallydecide on targets separately for each stock option class in connection with the distribution of stock options.Those stock options, for which the targets determined by the Board of Directors have not been attained, shallexpire in the manner decided by the Board of Directors. Currently 2012A(ii) options have been released andare allocated to the key personnel. 2012B(ii) and 2012C(ii) options have been initially allocated to the key

14 / 33
personnel.
SHARE-BASED INCENTIVE PLANS
On 11 February 2015 PKC Group announced three new share-based incentive plans for the Group keypersonnel approved by the Board of Directors.
Performance Share Plan 2015
The performance period of the Performance Share Plan 2015 is calendar years 2015-2017, during which theplan is directed to approximately 40 participants, including the members of the Executive Board. Therewards to be paid on the basis of the performance period 2015-2017 correspond to the value of anapproximate maximum total of 310,000 PKC Group Plc shares (including also the cash proportion).Attainment of the required performance level will determine the proportion out of the maximum reward thatwill be paid to a participant on the basis of the Performance Share Plan 2015.
Matching Share Plan 2015
The vesting period of Matching Share Plan 2015 is calendar years 2015-2017, during which the plan isdirected to approximately 20 participants, including the members of the Executive Board. The Board ofDirectors may resolve to include new participants in this plan during 2015-2017, and on the duration of therelated vesting periods (12-36 months). The rewards allocated in 2015-2017 on the basis of the MatchingShare Plan 2015 correspond to the value of an approximate maximum total of 100,000 PKC Group Plcshares (including also the cash proportion).
The prerequisite for receiving reward on the basis of the Matching Share Plan 2015 is that a personparticipating in the Plan acquires the Company´ shares up to the number determined by the Board ofDirectors. Furthermore, receiving of reward is tied to the continuation of participant´s employment or serviceupon reward payment. The participant may as a gross reward, receive one (1) matching share for eachacquired share.
Restricted Share Plan 2015
The vesting period of the Restricted Share Plan 2015 is calendar years 2015-2017, during which the plan isdirected to approximately 20 selected key persons. The Board of Directors may resolve to include new keypersons in this plan during 2015-2017, and on the duration of the related vesting periods (12-36 months).The rewards allocated in 2015-2017 on the basis of the Restricted Share Plan 2015 correspond to the valueof an approximate maximum total of 120,000 PKC Group Plc shares (including also the cash proportion).
In total, the Performance Share Plan 2015, Matching Share Plan 2015 and Restricted Share Plan 2015correspond to the value of an approximate maximum total of 530,000 PKC Group Plc shares (including alsothe cash proportion).
CORPORATE RESPONSIBILITY
Corporate responsibility is a key element in PKC’s operations. PKC operates with ethical business practice,takes responsibility for the operating environment and strives to minimize any harm caused to theenvironment, and respects and promotes human rights and fair workplace practices, equal opportunities, andzero-tolerance policy on bribery and corruption. PKC Group’s Board of Directors has ratified the Code ofConduct covering the whole group. The Code of Conduct sets principles for ethical business practice and isbased on the highest ethical standards. Compliance with legislation, regulations and international norms is afundamental requirement, from which it is not possible to deviate in any circumstances.
PKC’s Corporate Responsibility report for 2014 was published on 10 March 2015.

15 / 33
STRATEGY 2018
Strategic objectives have been announced in the capital market day held 3 April 2013.
PKC is a global partner, designing, manufacturing and integrating electrical distribution systems for thecommercial vehicle and rolling stock industry and other selected segments. PKC is seeking growth within itscurrent Commercial Vehicle markets and customers as well as in the growing markets of Asia. In addition,PKC is studying growth opportunities in expanding its business further within Transportation Industry. This isa segment where PKC can further utilize its unique knowhow as a global supplier of electrical distributionsystems.
The long-term financial targets of PKC Group Plc is to reach EUR 1.4 billion revenue by 2018 and at least10% EBITDA, while maintaining gearing below 75%. The targeted dividend payout is 30 - 60% of the cashflow after investments.
Key strategic highlights of 2015
PKC Group announced on 1 July 2015 that it had closed the deal to buy the rolling stock electricaldistribution system business (Wiring & Controls business) of Groclin S.A. Group.
PKC Group adjusts production capacity in South America by closing Curitiba, Brazil factory andconsolidating all its production capacity in Brazil to Campo Alegre factory, which was announced on 24 June2015.
PKC Group expands its business in China and establishes a joint venture with a Chinese commercial vehicleEDS supplier based on signed frame agreement with Jiangsu Huakai Wire Harness Co. Ltd. (Huakai), whichwas announced on 30 March 2015.
PKC Group won new business contracts in the amount of about EUR 30 million from two major globalvehicle manufacturers, which was announced on 25 March 2015.
SHORT-TERM RISKS AND UNCERTAINTIES
The demand for PKC´s products is dependent especially on the volatility of the global commercial vehicleindustry as well as the development of PKC’s customers’ businesses.
Uncertainty related to emerging markets’ economic development has increased to a high level. Especially inBrazil higher inflation as well as economic and political uncertainty has continued. The growth of theEuropean economy has not accelerated significantly and the inflation has continued on a low level.
Consolidation of the customer base and changes in customers’ relative market shares and sourcingstrategies may affect demand of PKC’s products.
Weakening of the US dollar against the Mexican peso as well as the weakening of the euro against thePolish zloty and the Russian rouble may increase PKC’s processing costs. Strengthening of the euro againstthe Brazilian real may increase PKC’s material costs. A significant increase in copper price may weakenPKC Group’s profit in short term. The customer prices are updated on average with a 3-5 month delay on thebasis of copper price changes.
The objective of PKC Group’s risk management is to identify risks relevant to business operations, and todetermine the measures, responsibilities and schedules required for efficient risk management. Thecomprehensive risk management process is implemented across the whole PKC Group with the aim ofestablishing uniform procedures for the analysis and measurement of risks, taking into consideration thegeographical differences between units. PKC’s risks are classified into strategic, operational and financialrisks. More information about PKC's risks is presented in the annual report and Corporate GovernanceGuidelines.

16 / 33
MARKET OUTLOOK
Wiring Systems Business
In 2015 the production of heavy-duty and medium-duty trucks in Europe is expected to grow by about 5%compared to previous year’s level.
In 2015 the production of heavy-duty and medium-duty trucks in North America is expected to increase byabout 7%, and production of light vehicles to increase by about 5% compared to 2014.
In 2015 the production of heavy-duty and medium-duty trucks in Brazil is expected to be clearly lower thanprevious year. The economic and political uncertainty in Brazil bear a significant risk for Brazilian truck salesto further drop in 2015.
Electronics Business
The market demand for Electronics segment’s products is expected to remain on the current level at themost.
PKC GROUP’S OUTLOOK FOR 2015
PKC Group estimates that with prevailing exchange rates 2015 revenue will be higher than previous yearlevel, and that comparable EBITDA will be higher than in 2014. In 2014, PKC’s revenue was EUR 829.5million and comparable EBITDA before non-recurring items was EUR 48.6 million. Revenue and EBITDAestimates are based on current business structure.
PKC Group has reclassified certain financial items and operating expenses as of the beginning of 2015. Thechanges are minor and comparison periods have been adjusted accordingly.
FINANCIAL REPORTS IN 2015
In 2015, the Interim Reports will be published as follows:· Interim Report 1-9/2015 Thursday, October 29, 2015 at about 8.15 a.m.
The text section of this release focuses on the interim report. Comparisons have been made to the figures ofthe corresponding period in 2014, unless otherwise mentioned. The figures presented in the tables areindependently rounded figures.

17 / 33
TABLES
This interim report has been prepared in accordance with IAS 34 (Interim Financial Reporting) standard.The interim report has been prepared in accordance with the same principles as the annual financialstatements for 2014.The year 2015 IFRS standard changes have no significant effect on the interim report.PKC Group has reclassified certain financial items and operating expenses as of the beginning of 2015.Comparison periods have been adjusted accordingly. The changes to revenue and operating profit (loss) areminor and have no impact on the net profit (loss) for the period or shareholders’ equity. The changes arepresented in detail in interim report Q1/2015, pages 25-28.The interim report is unaudited.
CONSOLIDATED STATEMENT OFCOMPREHENSIVE INCOME (EUR 1,000)
4-6/153 mon.
4-6/143 mon.
1-6/156 mon.
1-6/146 mon.
1-12/1412 mon.
Revenue 223,886 205,966 450,380 410,023 829,516Production for own use 2 29 2 120 53Other operating income 1,366 1,349 2,194 1,486 4,311Increase (+) / decrease (-) in stocks of finishedgoods and work in progress 3,125 -405 6,050 -1,396 1,211Materials and services -135,834 -123,559 -272,208 -247,116 -505,270Employee benefit expenses -59,758 -52,375 -117,177 -104,356 -221,893Depreciation, amortisation and impairment -8,383 -6,728 -15,966 -13,208 -33,476Other operating expenses -21,647 -19,647 -41,951 -38,333 -81,430Operating profit (loss) 2,757 4,631 11,324 7,221 -6,978
Items affecting comparability -5,361 -1,465 -5,943 -4,200 -28,362Comparable operating profit 8,118 6,095 17,268 11,421 21,384
Interest and other financial income and expenses -1,113 -789 -2,203 -1,858 -4,085Foreign currency exchange differences -247 29 60 -138 535Profit (loss) before taxes 1,397 3,871 9,182 5,225 -10,528
Income taxes -2,785 -1,277 -6,210 -1,724 -18,523Net profit (loss) for the report period -1,388 2,593 2,972 3,501 -29,051
Other comprehensive incomeItems that may be reclassified subsequently to profit or lossForeign currency translation differences - foreignoperations -6,177 2,984 9,226 4,496 8,452Cash flow hedges -64 0 -1,870 0 -1,443Taxes related to cash flow hedges 24 0 686 0 529Total comprehensive income for the period -7,605 5,578 11,015 7,997 -21,514
Attributable to equity holders of the parentcompanyBasic earnings per share (EPS), EUR -0.06 0.11 0.12 0.15 -1.21Diluted earnings per share (EPS), EUR -0.06 0.11 0.12 0.15 -1.21

18 / 33
CONSOLIDATED STATEMENT OF FINANCIAL POSITION(EUR 1,000)
6/15 6/14 12/14
ASSETSNon-current assetsGoodwill 31,655 30,201 30,348Intangible assets 35,958 33,270 36,035Property, plant and equipment 65,390 76,261 68,539Available-for-sale financial assets 720 56 720Other receivables 6,725 6,137 6,541Deferred tax assets 16,699 16,902 17,300Total non-current assets 157,147 162,826 159,483Current assetsInventories 94,143 82,202 79,390ReceivablesTrade receivables 99,643 102,775 89,033Other receivables 23,656 22,764 18,052Current tax assets 407 11 3Total receivables 123,706 125,549 107,088Cash and cash equivalents 93,515 74,970 110,321Total current assets 311,364 282,721 296,799Total assets 468,511 445,548 456,282
EQUITY AND LIABILITIESEquityShare capital 6,218 6,218 6,218Share premium account 11,282 11,282 11,282Invested non-restricted equity fund 81,963 81,162 81,256Share-based payments 6,268 4,444 5,369Other reserves -1,932 0 -914Translation difference 5,553 -7,542 -3,673Retained earnings 40,408 87,598 87,598Net profit (loss) for the report period 2,972 3,501 -29,051Total equity 152,732 186,662 158,085LiabilitiesNon-current liabilitiesInterest-bearing financial liabilities 101,183 101,171 101,446Provisions 1,522 1,488 1,619Other liabilities 7,762 8,637 9,260Deferred tax liabilities 22,729 18,071 25,593Total non-current liabilities 133,197 129,367 137,918Current liabilitiesInterest-bearing financial liabilities 24,500 0 0Trade payables 97,295 86,296 98,251Other non-interest-bearing liabilities 59,979 43,222 62,013Current tax liabilities 809 0 15Total current liabilities 182,583 129,519 160,279Total liabilities 315,779 258,886 298,197Total equity and liabilities 468,511 445,548 456,282

19 / 33
CONSOLIDATED STATEMENT OF CASHFLOWS (EUR 1,000)
4-6/153 mon.
4-6/143 mon.
1-6/156 mon.
1-6/146 mon.
1-12/1412 mon.
Cash flows from operating activitiesCash receipts from customers 241,292 209,998 444,068 401,147 836,731Cash receipts from other operating income 1,277 101 231 188 3,647Cash paid to suppliers and employees -230,116 -189,572 -450,027 -393,784 -794,399Cash flows from operations before financialincome and expenses and taxes 12,453 20,527 -5,729 7,550 45,979Interest paid and other financial expenses 403 95 -3,363 -1,132 -8,227Effects of exchange rate changes 1,052 -988 -4,646 657 7,909Interest received 63 24 2,112 40 3,846Income taxes paid -9,477 -6,718 -13,542 -6,991 -8,468Net cash from operating activities (A) 4,493 12,939 -25,167 124 41,038
Cash flows from investing activitiesAcquisition of property, plant and equipmentand intangible assets -3,020 -4,957 -5,345 -10,518 -19,772Proceeds from sale of property, plant andequipment and intangible assets 74 17 168 38 42Acquisitions of available-for-sale assets 0 -610 0 -610 -610Dividends received from investments 4 1 99 1 1Net cash used in investment activities (B) -2,943 -5,549 -5,078 -11,089 -20,339
Cash flows after investments 1,550 7,390 -30,245 -10,965 20,699
Cash flows from financing activitiesShare issue and subscriptions of options 774 309 915 414 422Proceeds from current borrowings 9,500 0 24,500 0 0Proceeds from non-current borrowings 0 -23 0 0 0Repayment of current/non-current borrowings 0 -30 0 -678 -660Dividends paid -16,788 -16,760 -16,788 -16,760 -16,760Net cash used in financing activities (C) -6,515 -16,504 8,627 -17,025 -16,998
Net increase (+) or decrease (-) in cash andequivalents (A+B+C) -4,964 -9,114 -21,619 -27,990 3,701
Cash and cash equivalents in the beginning ofthe period 100,919 83,578 110,321 102,665 102,665Effect of exchange rate changes -2,439 506 4,808 295 3,956Cash and cash equivalents in the end of theperiod 93,515 74,970 93,515 74,970 110,321

20 / 33
KEY FINANCIAL INDICATORS 1-6/156 mon.
1-6/146 mon.
1-12/1412 mon.
Revenue, EUR 1,000 450,380 410,023 829,516Operating profit (loss), EUR 1,000 11,324 7,221 -6,978% of revenue 2.5 1.8 -0.8Profit (loss) before taxes, EUR 1,000 9,182 5,225 -10,528% of revenue 2.0 1.3 -1.3Net profit (loss) for the period, EUR 1,000 2,972 3,501 -29,051% of revenue 0.7 0.9 -3.5Return on equity (ROE), % 3.8 3.7 -16.5Return on investments (ROI), % 13.8 8.3 2.0Return on capital employed (ROCE), % 12.8 7.8 7.7Net working capital, EUR 1,000 59,767 78,233 26,199Net liabilities, EUR 1,000 32,168 26,201 -8,875Gearing, % 21.1 14.0 -5.6Equity ratio, % 32.6 41.9 34.7Current ratio 1.7 2.2 1.9Gross capital expenditure, EUR 1,000 5,405 11,518 19,908% of revenue 1.2 2.8 2.4R&D expenditures, EUR 1,000 4,715 4,089 8,164% of revenue 1.0 1.0 1.0Personnel average 19,766 19,026 19,640
PER-SHARE KEY INDICATORS1-6/15
6 mon.1-6/14
6 mon.1-12/14
12 mon.
Earnings per share (EPS), EUR 0.12 0.15 -1.21Earnings per share (EPS),diluted, EUR 0.12 0.15 -1.21Equity per share, EUR 6.35 7.79 6.59Cash flow per share, EUR -1.26 -0.45 0.86Share price at close of period, EUR 19.83 20.92 17.58Lowest share price, EUR 16.62 20.63 13.13Highest share price, EUR 23.37 26.33 26.33Average share price, EUR 20.05 22.69 19.69Turnover in shares, 1,000 shares 5,869 6,357 12,101Turnover in shares per (share issue adjusted) share capital, % 24.5 26.6 50.5Average number of shares, 1,000 shares 23,994 23,935 23,953Average number of shares, diluted, 1,000 shares 24,036 24,119 24,098Shares at end of period, 1,000 shares 24,042 23,970 23,971Market capitalisation, EUR 1,000 476,751 501,452 421,401

21 / 33
1. OPERATING SEGMENTSSegment assets and liabilities include only those assets and liabilities that can be directly allocated to therespective segments. Group’s unallocated expenses and income, and eliminations between segments areincluded in unallocated items of comprehensive income. Unallocated assets include mainly items related toGroup management and also taxes and loan receivables. Unallocated liabilities include current and non-current loans and tax liabilities.
1.4.-30.6.2015 (EUR 1,000) WiringSystems
Electronics Totalreportablesegments
Unallocatedamounts
andeliminations
TotalGroup
Segment revenue 209,346 14,726 224,072 50 224,121of which inter-segment revenue 118 68 186 50 236External revenue 209,228 14,657 223,886 0 223,886
EBITDA 16,508 685 17,193 -1,484 15,708% of revenue 7.9 4.7 7.0
Depreciation, amortisation andimpairments *) -4,855 -436 -5,291 -16 -5,307
EBITA 11,652 249 11,901 -1,501 10,401% of revenue 5.6 1.7 4.6
PPA depreciation and amortisation -2,283 0 -2,283 0 -2,283
Operating profit before non-recurringitems 9,369 249 9,618 -1,501 8,118% of revenue 4.5 1.7 3.6
Non-recurring employee benefit expenses -2,849 0 -2,849 0 -2,849Impairment of PPE and intangible assets -793 0 -793 0 -793Other non-recurring income and expenses -1,366 0 -1,366 -353 -1,719Total non-recurring items -5,008 0 -5,008 -353 -5,361
Operating profit) 4,362 249 4,611 -1,854 2,757% of revenue 2.1 1.7 1.2
Financial income and expenses 0 0 0 -1,360 -1,360Profit before taxes 4,362 249 4,611 -3,214 1,397Income taxes 0 0 0 -2,785 -2,785Net profit (loss) for the period 4,362 249 4,611 -5,998 -1,388
Goodwill 30,446 1,209 31,655 0 31,655Other segment assets 375,763 42,633 418,396 18,460 436,856Total assets 406,209 43,842 450,051 18,460 468,511
Segment liabilities 307,252 27,990 335,242 -19,463 315,779Total liabilities 307,252 27,990 335,242 -19,463 315,779*) excluding PPA depreciation and amortisation and non-recurring asset impairment

22 / 33
1.4.-30.6.2014 (EUR 1,000) WiringSystems
Electronics Totalreportablesegments
Unallocatedamounts
andeliminations
TotalGroup
Segment revenue 191,459 14,734 206,193 193 206,385of which inter-segment revenue 175 52 227 193 420External revenue 191,284 14,682 205,966 0 205,966
EBITDA 13,504 761 14,264 -1,339 12,926% of revenue 7.1 5.2 6.3
Depreciation, amortisation andimpairments *) -4,437 -354 -4,791 -16 -4,807
EBITA 9,066 407 9,473 -1,355 8,119% of revenue 4.7 2.8 3.9
PPA depreciation and amortisation -2,023 0 -2,023 0 -2,023
Operating profit before non-recurringitems 7,043 407 7,450 -1,355 6,095% of revenue 3.7 2.8 3.0
Non-recurring employee benefit expenses -667 0 -667 0 -667Impairment of PPE and intangible assets 103 0 103 0 103Other non-recurring income and expenses -318 0 -318 -583 -900Total non-recurring items -882 0 -882 -583 -1,465
Operating profit 6,161 407 6,568 -1,937 4,631% of revenue 3.2 2.8 2.2
Financial income and expenses 0 0 0 -760 -760Profit before taxes 6,161 407 6,568 -2,697 3,871Income taxes 0 0 0 -1,277 -1,277Net profit for the period 6,161 407 6,568 -3,974 2,593
Goodwill 28,992 1,209 30,201 0 30,201Other segment assets 411,189 36,797 447,986 -32,639 415,347Total assets 440,181 38,006 478,187 -32,639 445,548
Segment liabilities 335,871 26,422 362,294 -103,408 258,886Total liabilities 335,871 26,422 362,294 -103,408 258,886
*) excluding PPA depreciation and amortisation and non-recurring asset impairment

23 / 33
1.1.-30.6.2015 (EUR 1,000) WiringSystems
Electronics Totalreportablesegments
Unallocatedamounts
andeliminations
TotalGroup
Segment revenue 415,185 35,561 450,746 105 450,851of which inter-segment revenue 268 98 366 105 471External revenue 414,917 35,463 450,380 0 450,380
EBITDA 31,827 3,524 35,351 -2,910 32,441% of revenue 7.7 9.9 7.2
Depreciation, amortisation andimpairments *) -9,602 -858 -10,460 -39 -10,500
EBITA 22,224 2,666 24,890 -2,949 21,941% of revenue 5.4 7.5 4.9
PPA depreciation and amortisation -4,673 0 -4,673 0 -4,673
Operating profit before non-recurringitems 17,551 2,666 20,217 -2,949 17,268% of revenue 4.2 7.5 3.8
Non-recurring employee benefit expenses -3,673 0 -3,673 0 -3,673Impairment of PPE and intangible assets -793 0 -793 0 -793Other non-recurring income and expenses -542 0 -542 -936 -1,478Total non-recurring items -5,008 0 -5,008 -936 -5,943
Operating profit 12,543 2,666 15,209 -3,885 11,324% of revenue 3.0 7.5 2.5
Financial income and expenses 0 0 0 -2,142 -2,142Profit before taxes 12,543 2,666 15,209 -6,027 9,182Income taxes 0 0 0 -6,210 -6,210Net profit for the period 12,543 2,666 15,209 -12,237 2,972
Goodwill 30,446 1,209 31,655 0 31,655Other segment assets 375,763 42,633 418,396 18,460 436,856Total assets 406,209 43,842 450,051 18,460 468,511
Segment liabilities 307,252 27,990 335,242 -19,463 315,779Total liabilities 307,252 27,990 335,242 -19,463 315,779
*) excluding PPA depreciation and amortisation and non-recurring asset impairment

24 / 33
1.1.-30.6.2014 (EUR 1,000) WiringSystems
Electronics Totalreportablesegments
Unallocatedamounts
andeliminations
TotalGroup
Segment revenue 380,232 30,221 410,453 375 410,828of which inter-segment revenue 316 113 430 375 805External revenue 379,916 30,107 410,023 0 410,023
EBITDA 25,183 2,001 27,184 -2,452 24,732% of revenue 6.6 6.6 6.0
Depreciation, amortisation andimpairments *) -8,513 -709 -9,222 -31 -9,252
EBITA 16,670 1,292 17,962 -2,482 15,479% of revenue 4.4 4.3 3.8
PPA depreciation and amortisation -4,059 0 -4,059 0 -4,059
Operating profit before non-recurringitems 12,611 1,292 13,903 -2,482 11,421% of revenue 3.3 4.3 2.8
Non-recurring employee benefit expenses -2,687 0 -2,687 0 -2,687Impairment of PPE and intangible assets 103 0 103 0 103Other non-recurring income and expenses -402 0 -402 -1,213 -1,615Total non-recurring items -2,987 0 -2,987 -1,213 -4,200
Operating profit 9,625 1,292 10,917 -3,695 7,221% of revenue 2.5 4.3 1.8
Financial income and expenses 0 0 0 -1,996 -1,996Profit before taxes 9,625 1,292 10,917 -5,691 5,225Income taxes 0 0 0 -1,724 -1,724Net profit for the period 9,625 1,292 10,917 -7,416 3,501
Goodwill 28,992 1,209 30,201 0 30,201Other segment assets 411,189 36,797 447,986 -32,639 415,347Total assets 440,181 38,006 478,187 -32,639 445,548
Segment liabilities 335,871 26,422 362,294 -103,408 258,886Total liabilities 335,871 26,422 362,294 -103,408 258,886
*) excluding PPA depreciation and amortisation and non-recurring asset impairment

25 / 33
1.1.-31.12.2014 (EUR 1,000) WiringSystems
Electronics Totalreportablesegments
Unallocatedamounts
andeliminations
TotalGroup
Segment revenue 772,680 57,717 830,398 576 830,973of which inter-segment revenue 607 274 881 576 1,457External revenue 772,073 57,443 829,516 0 829,516
EBITDA 51,425 3,131 54,556 -5,983 48,572% of revenue 6.7 5.5 5.9
Depreciation, amortisation andimpairments *) -17,490 -1,473 -18,964 -69 -19,033
EBITA 33,934 1,658 35,592 -6,052 29,540% of revenue 4.4 2.9 3.6
PPA depreciation and amortisation -8,156 0 -8,156 0 -8,156
Operating profit before non-recurringitems 25,778 1,658 27,436 -6,052 21,384% of revenue 3.3 2.9 2.6
Non-recurring employee benefit expenses -12,216 0 -12,216 0 -12,216Impairment of PPE and intangible assets -6,288 0 -6,288 0 -6,288Other non-recurring income and expenses -7,967 0 -7,967 -1,891 -9,858Total non-recurring items -26,471 0 -26,471 -1,891 -28,362
Operating profit (loss) -692 1,658 965 -7,943 -6,978% of revenue -0.1 2.9 -0.8
Financial income and expenses 0 0 0 -3,550 -3,550Profit (loss) before taxes -692 1,658 965 -11,493 -10,528Income taxes 0 0 0 -18,523 -18,523Net profit (loss ) for the period -692 1,658 965 -30,017 -29,051
Goodwill 29,139 1,209 30,348 0 30,348Other segment assets 348,690 39,484 388,175 37,760 425,934Total assets 377,829 40,693 418,522 37,760 456,282
Segment liabilities 288,972 27,658 316,629 -18,432 298,197Total liabilities 288,972 27,658 316,629 -18,432 298,197
*) excluding PPA depreciation and amortisation and non-recurring asset impairment
26 / 33
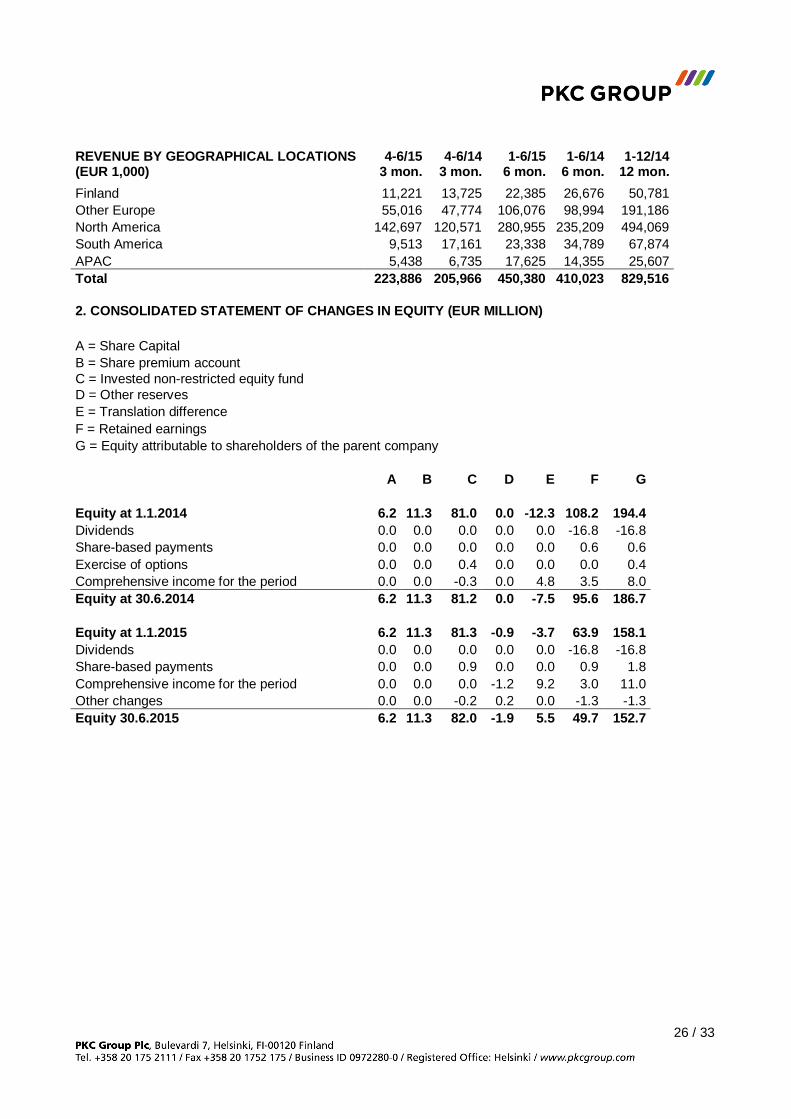
REVENUE BY GEOGRAPHICAL LOCATIONS(EUR 1,000)
4-6/15 3 mon.
4-6/143 mon.
1-6/15 6 mon.
1-6/146 mon.
1-12/1412 mon.
Finland 11,221 13,725 22,385 26,676 50,781Other Europe 55,016 47,774 106,076 98,994 191,186North America 142,697 120,571 280,955 235,209 494,069South America 9,513 17,161 23,338 34,789 67,874APAC 5,438 6,735 17,625 14,355 25,607Total 223,886 205,966 450,380 410,023 829,516
2. CONSOLIDATED STATEMENT OF CHANGES IN EQUITY (EUR MILLION)
A = Share CapitalB = Share premium accountC = Invested non-restricted equity fundD = Other reservesE = Translation differenceF = Retained earningsG = Equity attributable to shareholders of the parent company
A B C D E F G
Equity at 1.1.2014 6.2 11.3 81.0 0.0 -12.3 108.2 194.4Dividends 0.0 0.0 0.0 0.0 0.0 -16.8 -16.8Share-based payments 0.0 0.0 0.0 0.0 0.0 0.6 0.6Exercise of options 0.0 0.0 0.4 0.0 0.0 0.0 0.4Comprehensive income for the period 0.0 0.0 -0.3 0.0 4.8 3.5 8.0Equity at 30.6.2014 6.2 11.3 81.2 0.0 -7.5 95.6 186.7
Equity at 1.1.2015 6.2 11.3 81.3 -0.9 -3.7 63.9 158.1Dividends 0.0 0.0 0.0 0.0 0.0 -16.8 -16.8Share-based payments 0.0 0.0 0.9 0.0 0.0 0.9 1.8Comprehensive income for the period 0.0 0.0 0.0 -1.2 9.2 3.0 11.0Other changes 0.0 0.0 -0.2 0.2 0.0 -1.3 -1.3Equity 30.6.2015 6.2 11.3 82.0 -1.9 5.5 49.7 152.7
27 / 33
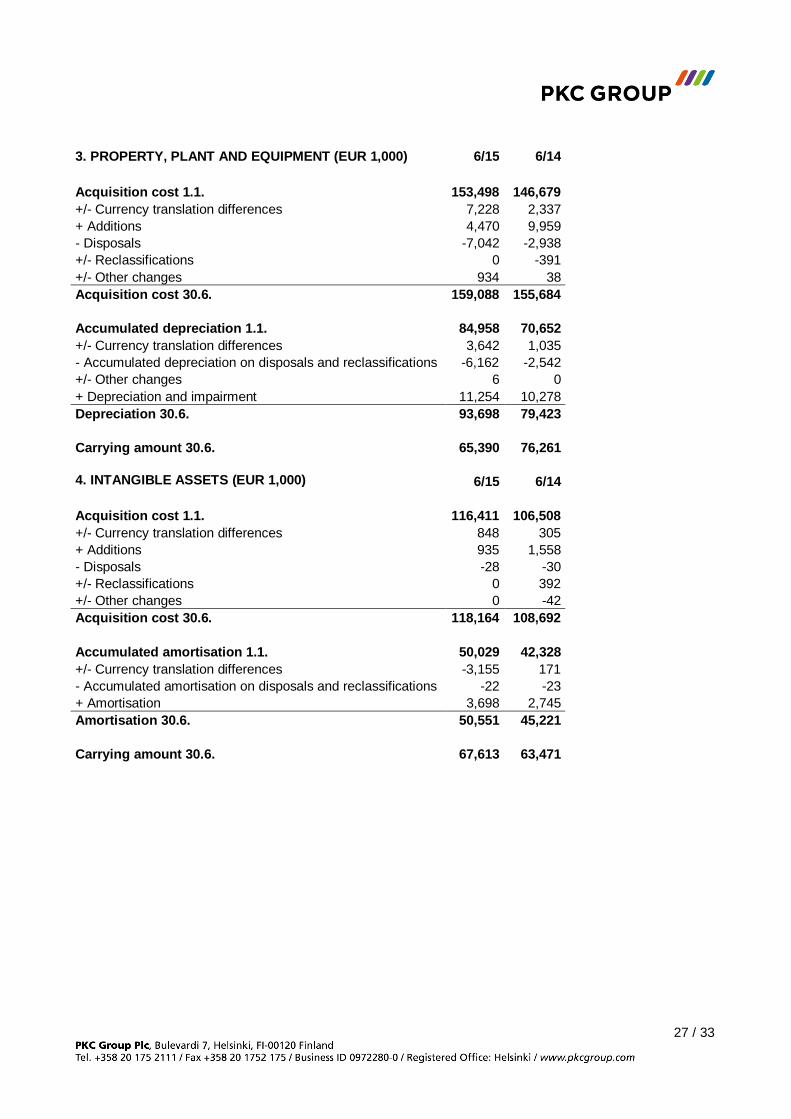
3. PROPERTY, PLANT AND EQUIPMENT (EUR 1,000) 6/15 6/14
Acquisition cost 1.1. 153,498 146,679+/- Currency translation differences 7,228 2,337+ Additions 4,470 9,959- Disposals -7,042 -2,938+/- Reclassifications 0 -391+/- Other changes 934 38Acquisition cost 30.6. 159,088 155,684
Accumulated depreciation 1.1. 84,958 70,652+/- Currency translation differences 3,642 1,035- Accumulated depreciation on disposals and reclassifications -6,162 -2,542+/- Other changes 6 0+ Depreciation and impairment 11,254 10,278Depreciation 30.6. 93,698 79,423
Carrying amount 30.6. 65,390 76,261
4. INTANGIBLE ASSETS (EUR 1,000) 6/15 6/14
Acquisition cost 1.1. 116,411 106,508+/- Currency translation differences 848 305+ Additions 935 1,558- Disposals -28 -30+/- Reclassifications 0 392+/- Other changes 0 -42Acquisition cost 30.6. 118,164 108,692
Accumulated amortisation 1.1. 50,029 42,328+/- Currency translation differences -3,155 171- Accumulated amortisation on disposals and reclassifications -22 -23+ Amortisation 3,698 2,745Amortisation 30.6. 50,551 45,221
Carrying amount 30.6. 67,613 63,471

28 / 33
5. FAIR VALUES OF FINANCIAL INSTRUMENTS (EUR 1,000)
Set out below is a comparison of the carrying amounts and fair values of financial instrumentsas at 30 June 2015
As of June 30, 2015Carrying amounts ofbalance sheet items
Fair values of balancesheet items
Non-current financial assetsOther non-current financial assets 672 672Total non-current financial assets 672 672
Current financial assetsInterest derivatives 1,780 1,780Copper derivatives 80 80Total current financial assets 1,860 1,860
Total financial assets 2,532 2,532
Non-current financial liabilitiesNon-current interest-bearing liabilities 101,183 113,525Total non-current financial liabilities 101,183 113,525
Current financial liabilitiesCurrent interest-bearing liabilities 24,500 24,500Currency derivatives 4,945 4,945Total current financial liabilities 29,445 29,445
Total financial liabilities 130,628 142,970
The valuation of derivatives is based on market data (level 2 IFRS 7:27A). The valuation ofavailable-for-sale shares (Other non-current financial assets, EUR 672 thousand) is based on theacquisition cost (level 3, IFRS 7.27A) as the fair value of the shares cannot be determined reliably.

29 / 33
6. CONTINGENT LIABILITIES AT END OF PERIOD(EUR 1,000)
6/15 6/14 12/14
Leasing liabilities 23,994 21,719 20,771
Liabilities for derivative instruments
Nominal valuesInterest derivatives 50,000 75,000 50,000Currency derivatives 93,310 30,214 62,988Copper derivatives 3,397 4,440 3,708Total 146,707 109,654 116,696
Fair valuesInterest derivatives 1,780 2,177 2,191Currency derivatives -4,945 203 -3,931Copper derivatives 80 127 -42Total -3,085 2,507 -1,782
Interest rate, currency and copper derivatives are used in hedging currency and copperrisks. PKC Group does not apply hedge accounting to copper derivative instruments inaccordance with IAS 39. Fair values of copper derivatives are recognised through profitand loss. PKC Group applies hedge accounting to currency derivatives and to interestrate swaps.
7. QUARTERLY KEY INDICATORS,CONSOLIDATED
4-6/143 mon.
7-9/143 mon.
10-12/143 mon.
1-3/153 mon.
4-6/153 mon.
Revenue, EUR million 206.0 210.2 209.2 226.5 223.9Operating profit (loss), EUR million 4.6 -4.0 -10.2 8.6 2.8% of revenue 2.2 -1.9 -4.9 3.8 1.2Profit (loss) before taxes, EUR million 3.9 -4.6 -11.2 7.8 1.4% of revenue 1.9 -2.2 -5.3 3.4 0.6Equity ratio, % 41.9 38.0 34.7 35.8 32.6Earnings per share (EPS), diluted (EUR) 0.11 -0.73 -0.63 0.18 -0.06Equity per share, EUR 7.79 7.39 6.59 7.34 6.35Net cash from operating activities, EUR million 12.9 6.5 34.4 -29.7 4.5Cash flow after investments, EUR million 7.4 0.9 30.7 -31.8 1.6
QUARTERLY KEY INDICATORS, WIRING SYSTEMSRevenue, EUR million 191.3 195.4 196.7 205.7 209.2Operating profit (loss), EUR million 6.2 -3.0 -7.3 8.2 4.4% of revenue 3.2 -1.6 -3.7 4.0 2.1
QUARTERLY KEY INDICATORS, ELECTRONICSRevenue, EUR million 14.7 14.8 12.5 20.8 14.7Operating profit (loss), EUR million 0.4 0.6 -0.2 2.4 0.2% of revenue 2.8 4.0 -1.8 11.6 1.7

30 / 33
MATERIAL EVENTS SUBSEQUENT TO THE END OF THE REPORTING PERIOD
PKC Group announced on 1 July 2015 that it had closed the deal to buy the rolling stock electricaldistribution system business (Wiring & Controls business) of Groclin S.A. Group, a company listed on theWarsaw stock exchange. The deal includes Kabel-Technik-Polska Sp. z o. o. (‘KTP’) operating in Poland,which at the time of the closing owns the entire Wiring & Controls business of Groclin S.A. Group. Therequirements of closing have been fulfilled and the closing became effective and ownership and control wastransferred on 1 July 2015.
The net debt free purchase price is EUR 50 million. The purchase price is subject to post closing purchaseprice adjustment based on the actual level of net working capital and net debt on the closing date. Theacquisition took place via a new company, in which PKC Group has an 80% holding and Wiring & Controlsbusiness’ management has a 20% holding. PKC Group and minority shareholders have agreed on a calloption structure, within the framework of which PKC Group will acquire the minority shareholders’ shares notbefore than two years from the closing of the deal.
The Wiring & Controls business develops and manufactures electrical cabinets, powerpacks and electricaldistribution systems for rolling stock manufacturers. The clientele also includes the on/off highwaycommercial vehicle, energy and materials handling industry. The customers are leading companies in theirfield and mainly operate globally. Wiring & Controls business revenue in 2014 totalled some EUR 56 million,normalised EBITDA % totalled some 7%, and number of personnel at the end of 2014 totalled about 2,000.
Had the acquired Wiring & Controls business been consolidated from 1 January 2015, the consolidatedstatement of income would show pro forma revenue of EUR 480 million and EBITDA before non-recurringitems of EUR 34 million.
The acquired Wiring & Controls business will be consolidated into PKC Group as of 1 July 2015 according tothe so called anticipated acquisition method i.e. no minority interest will be accounted for. In the anticipatedacquisition method the estimated value of the call option will be included into the acquisition value. Theacquired Wiring & Controls business will be included into PKC Group’s Wiring Systems business segment.By the end of Q2 2015, EUR 0.8 million of acquisition related costs have been charged to other operatingexpenses in the consolidated income statement.
The initial accounting for the acquisition and the purchase price allocation are incomplete. Provisionally it isestimated that adjustments to fair value relate mainly to customer relationships within intangible assets

31 / 33
CALCULATION OF INDICATORS
Return on equity (ROE), %= 100 x Net profit (loss) for the report period / Total equity (average)
Return on investments (ROI), %= 100 x (Profit (loss) before taxes + financial expenses) / (Total equity + interest-bearing financial liabilities(average))
Return on capital employed (ROCE), %= 100 x (Operating profit +/– non-recurring items) / (Total equity + interest-bearing financial liabilities(average))
Net liabilities= Interest bearing liabilities – cash and cash equivalents
Gearing, %= 100 x (Interest-bearing financial liabilities – cash and cash equivalents) / Total equity
Equity ratio, %= 100 x Total equity / (Total of the statement of financial position – advance payments received)
Current ratio= Total current assets / Total current liabilities
Earnings per share (EPS), EUR= Net profit (loss) for the report period attributable to equity holders of the parent company / Average shareissue-adjusted number of shares
Equity per share, EUR= Equity attributable to equity holders of the parent company / Share issue-adjusted number of shares at thedate of the statement of financial position
Cash flow per share, EUR= Cash flows after investments / Average share issue-adjusted number of shares
Market capitalisation= Number of shares at the end of the report period x the last trading price of the report period
EBITDA= Operating profit (loss) + non-recurring items + depreciation, amortisation and impairments
EBITA= Operating profit (loss) + non-recurring items + PPA depreciation and amortisation
Net working capital= Inventories + current non-interest-bearing receivables – current non-interest-bearing liabilities
All the future estimates and forecasts presented in this stock exchange release are based on the bestcurrent knowledge of the company’s management and information published by market research companiesand customers. The estimates and forecasts contain certain elements of risk and uncertainty which, if theymaterialise, may lead to results that differ from present estimates. The main factors of uncertainty arerelated, among other things, to the general economic situation, the trend in the operating environment andthe sector as well as the success of the Group’s strategy.

32 / 33
PKC GROUP PLCBoard of Directors
Matti HyytiäinenPresident & CEO
For additional information, contact:Matti Hyytiäinen, President & CEO, PKC Group Plc, tel. +358 (0)400 710 968
Juha Torniainen, CFO, PKC Group Plc, tel. +358 (0)40 570 8871
PRESS CONFERENCE
A press conference on the interim report will be arranged for analysts and investors today, 6 August 2015, at10.00 a.m., at the address Event Arena Bank, Unioninkatu 20, Helsinki.
DISTRIBUTION
Nasdaq HelsinkiMain mediawww.pkcgroup.com
PKC Group is a global partner, designing, manufacturing and integrating electrical distribution systems,electronics and related architecture components for the commercial vehicle industry, rolling stockmanufacturers and other selected segments. The Group has production facilities in Brazil, China, Estonia,Finland, Germany, Lithuania, Mexico, Poland, Russia, Serbia and the USA. The Group's revenue in 2014totalled EUR 829.5 million. PKC Group Plc is listed on Nasdaq Helsinki.

PKC Group Plc
Bulevardi 7
FI-00120 Helsinki, Finland
www.pkcgroup.com