Embed Size (px)
Citation preview
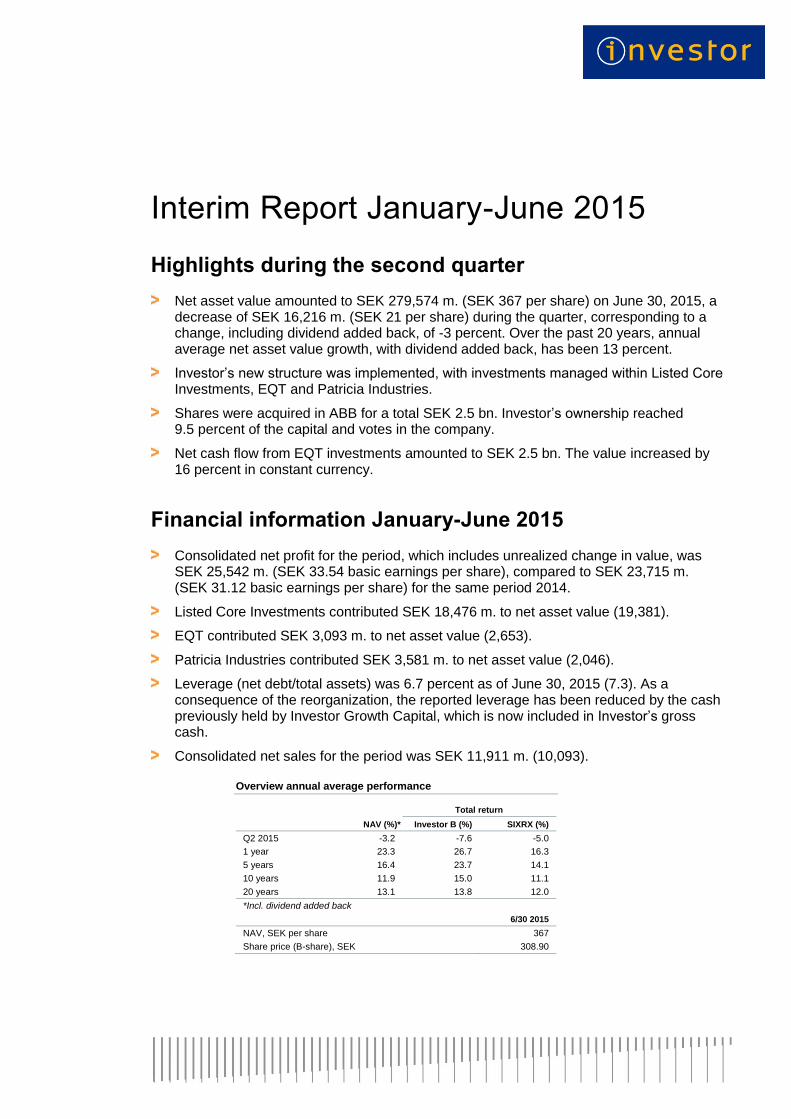
Interim Report January-June 2015
Highlights during the second quarter
Net asset value amounted to SEK 279,574 m. (SEK 367 per share) on June 30, 2015, a decrease of SEK 16,216 m. (SEK 21 per share) during the quarter, corresponding to a change, including dividend added back, of -3 percent. Over the past 20 years, annual average net asset value growth, with dividend added back, has been 13 percent.
Investor’s new structure was implemented, with investments managed within Listed Core Investments, EQT and Patricia Industries.
Shares were acquired in ABB for a total SEK 2.5 bn. Investor’s ownership reached 9.5 percent of the capital and votes in the company.
Net cash flow from EQT investments amounted to SEK 2.5 bn. The value increased by 16 percent in constant currency.
Financial information January-June 2015
Consolidated net profit for the period, which includes unrealized change in value, was SEK 25,542 m. (SEK 33.54 basic earnings per share), compared to SEK 23,715 m. (SEK 31.12 basic earnings per share) for the same period 2014.
Listed Core Investments contributed SEK 18,476 m. to net asset value (19,381).
EQT contributed SEK 3,093 m. to net asset value (2,653).
Patricia Industries contributed SEK 3,581 m. to net asset value (2,046).
Leverage (net debt/total assets) was 6.7 percent as of June 30, 2015 (7.3). As a consequence of the reorganization, the reported leverage has been reduced by the cash previously held by Investor Growth Capital, which is now included in Investor’s gross cash.
Consolidated net sales for the period was SEK 11,911 m. (10,093).
Overview annual average performance
Total return
NAV (%)* Investor B (%) SIXRX (%)
Q2 2015 -3.2 -7.6 -5.0
1 year 23.3 26.7 16.3
5 years 16.4 23.7 14.1
10 years 11.9 15.0 11.1
20 years 13.1 13.8 12.0
*Incl. dividend added back
6/30 2015
NAV, SEK per share 367
Share price (B-share), SEK 308.90
INVESTOR Q2 2015 – 2
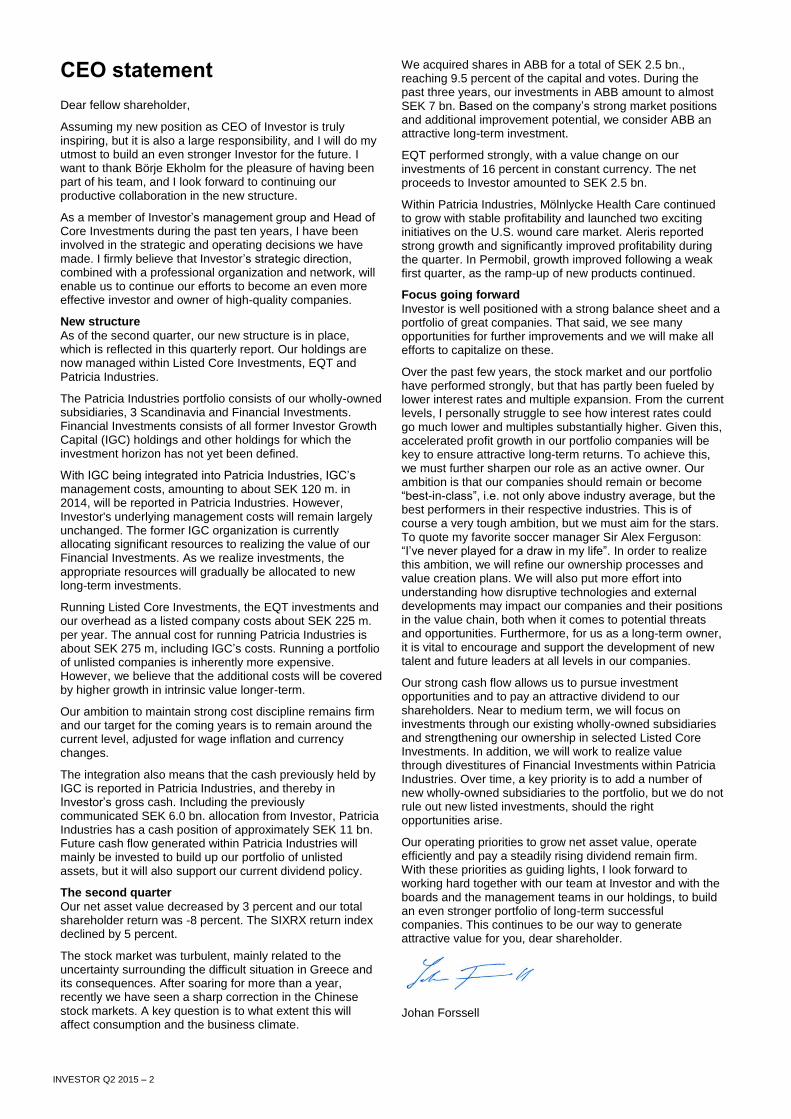
CEO statement
Dear fellow shareholder,
Assuming my new position as CEO of Investor is truly inspiring, but it is also a large responsibility, and I will do my utmost to build an even stronger Investor for the future. I want to thank Börje Ekholm for the pleasure of having been part of his team, and I look forward to continuing our productive collaboration in the new structure.
As a member of Investor’s management group and Head of Core Investments during the past ten years, I have been involved in the strategic and operating decisions we have made. I firmly believe that Investor’s strategic direction, combined with a professional organization and network, will enable us to continue our efforts to become an even more effective investor and owner of high-quality companies.
New structure
As of the second quarter, our new structure is in place, which is reflected in this quarterly report. Our holdings are now managed within Listed Core Investments, EQT and Patricia Industries.
The Patricia Industries portfolio consists of our wholly-owned subsidiaries, 3 Scandinavia and Financial Investments. Financial Investments consists of all former Investor Growth Capital (IGC) holdings and other holdings for which the investment horizon has not yet been defined.
With IGC being integrated into Patricia Industries, IGC’s management costs, amounting to about SEK 120 m. in 2014, will be reported in Patricia Industries. However, Investor's underlying management costs will remain largely unchanged. The former IGC organization is currently allocating significant resources to realizing the value of our Financial Investments. As we realize investments, the appropriate resources will gradually be allocated to new long-term investments.
Running Listed Core Investments, the EQT investments and our overhead as a listed company costs about SEK 225 m. per year. The annual cost for running Patricia Industries is about SEK 275 m, including IGC’s costs. Running a portfolio of unlisted companies is inherently more expensive. However, we believe that the additional costs will be covered by higher growth in intrinsic value longer-term.
Our ambition to maintain strong cost discipline remains firm and our target for the coming years is to remain around the current level, adjusted for wage inflation and currency changes.
The integration also means that the cash previously held by IGC is reported in Patricia Industries, and thereby in Investor’s gross cash. Including the previously communicated SEK 6.0 bn. allocation from Investor, Patricia Industries has a cash position of approximately SEK 11 bn. Future cash flow generated within Patricia Industries will mainly be invested to build up our portfolio of unlisted assets, but it will also support our current dividend policy.
The second quarter
Our net asset value decreased by 3 percent and our total shareholder return was -8 percent. The SIXRX return index declined by 5 percent.
The stock market was turbulent, mainly related to the uncertainty surrounding the difficult situation in Greece and its consequences. After soaring for more than a year, recently we have seen a sharp correction in the Chinese stock markets. A key question is to what extent this will affect consumption and the business climate.
We acquired shares in ABB for a total of SEK 2.5 bn., reaching 9.5 percent of the capital and votes. During the past three years, our investments in ABB amount to almost SEK 7 bn. Based on the company’s strong market positions and additional improvement potential, we consider ABB an attractive long-term investment.
EQT performed strongly, with a value change on our investments of 16 percent in constant currency. The net proceeds to Investor amounted to SEK 2.5 bn.
Within Patricia Industries, Mölnlycke Health Care continued to grow with stable profitability and launched two exciting initiatives on the U.S. wound care market. Aleris reported strong growth and significantly improved profitability during the quarter. In Permobil, growth improved following a weak first quarter, as the ramp-up of new products continued.
Focus going forward
Investor is well positioned with a strong balance sheet and a portfolio of great companies. That said, we see many opportunities for further improvements and we will make all efforts to capitalize on these.
Over the past few years, the stock market and our portfolio have performed strongly, but that has partly been fueled by lower interest rates and multiple expansion. From the current levels, I personally struggle to see how interest rates could go much lower and multiples substantially higher. Given this, accelerated profit growth in our portfolio companies will be key to ensure attractive long-term returns. To achieve this, we must further sharpen our role as an active owner. Our ambition is that our companies should remain or become “best-in-class”, i.e. not only above industry average, but the best performers in their respective industries. This is of course a very tough ambition, but we must aim for the stars. To quote my favorite soccer manager Sir Alex Ferguson: “I’ve never played for a draw in my life”. In order to realize this ambition, we will refine our ownership processes and value creation plans. We will also put more effort into understanding how disruptive technologies and external developments may impact our companies and their positions in the value chain, both when it comes to potential threats and opportunities. Furthermore, for us as a long-term owner, it is vital to encourage and support the development of new talent and future leaders at all levels in our companies.
Our strong cash flow allows us to pursue investment opportunities and to pay an attractive dividend to our shareholders. Near to medium term, we will focus on investments through our existing wholly-owned subsidiaries and strengthening our ownership in selected Listed Core Investments. In addition, we will work to realize value through divestitures of Financial Investments within Patricia Industries. Over time, a key priority is to add a number of new wholly-owned subsidiaries to the portfolio, but we do not rule out new listed investments, should the right opportunities arise.
Our operating priorities to grow net asset value, operate efficiently and pay a steadily rising dividend remain firm. With these priorities as guiding lights, I look forward to working hard together with our team at Investor and with the boards and the management teams in our holdings, to build an even stronger portfolio of long-term successful companies. This continues to be our way to generate attractive value for you, dear shareholder.
Johan Forssell
INVESTOR Q2 2015 – 3
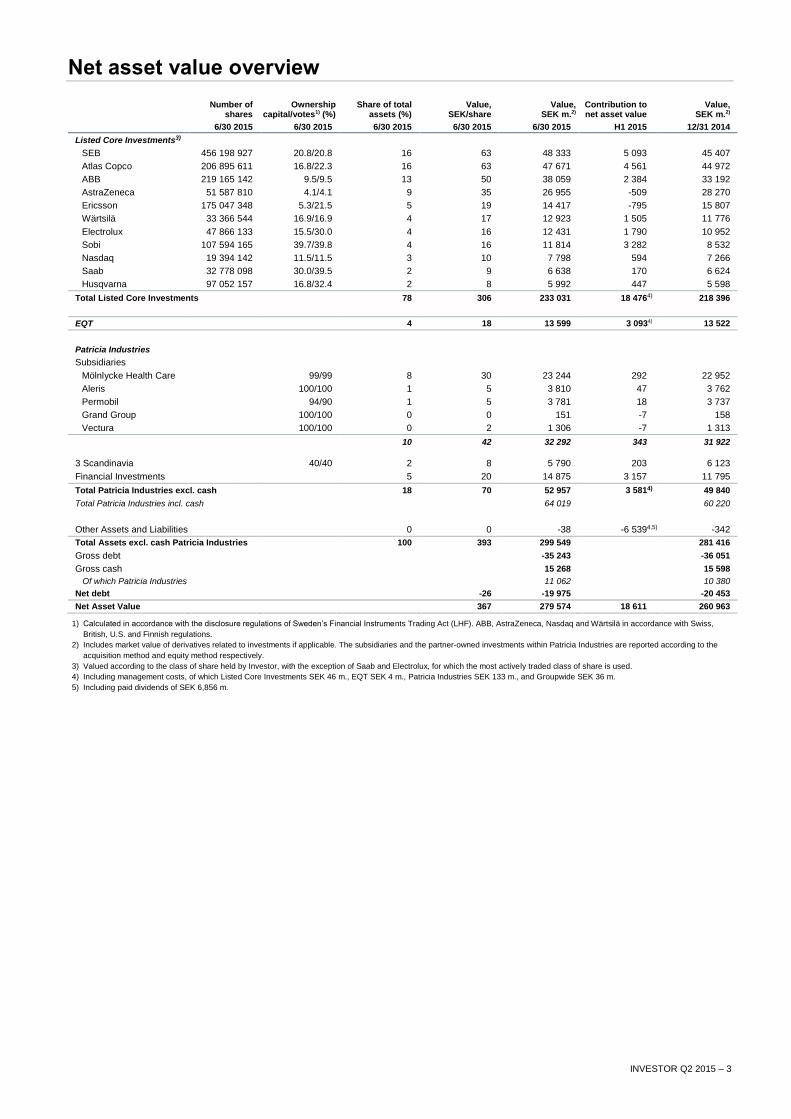
Net asset value overview
Number of
shares Ownership
capital/votes1) (%) Share of total
assets (%) Value,
SEK/share Value,
SEK m.2)
Contribution to net asset value
Value, SEK m.2)
6/30 2015 6/30 2015 6/30 2015 6/30 2015 6/30 2015 H1 2015 12/31 2014
Listed Core Investments3)
SEB 456 198 927 20.8/20.8 16 63 48 333 5 093 45 407
Atlas Copco 206 895 611 16.8/22.3 16 63 47 671 4 561 44 972
ABB 219 165 142 9.5/9.5 13 50 38 059 2 384 33 192
AstraZeneca 51 587 810 4.1/4.1 9 35 26 955 -509 28 270
Ericsson 175 047 348 5.3/21.5 5 19 14 417 -795 15 807
Wärtsilä 33 366 544 16.9/16.9 4 17 12 923 1 505 11 776
Electrolux 47 866 133 15.5/30.0 4 16 12 431 1 790 10 952
Sobi 107 594 165 39.7/39.8 4 16 11 814 3 282 8 532
Nasdaq 19 394 142 11.5/11.5 3 10 7 798 594 7 266
Saab 32 778 098 30.0/39.5 2 9 6 638 170 6 624
Husqvarna 97 052 157 16.8/32.4 2 8 5 992 447 5 598
Total Listed Core Investments 78 306 233 031 18 4764) 218 396
EQT 4 18 13 599 3 0934) 13 522
Patricia Industries
Subsidiaries
Mölnlycke Health Care 99/99 8 30 23 244 292 22 952
Aleris 100/100 1 5 3 810 47 3 762
Permobil 94/90 1 5 3 781 18 3 737
Grand Group 100/100 0 0 151 -7 158
Vectura 100/100 0 2 1 306 -7 1 313
10 42 32 292 343 31 922
3 Scandinavia 40/40 2 8 5 790 203 6 123
Financial Investments 5 20 14 875 3 157 11 795
Total Patricia Industries excl. cash 18 70 52 957 3 5814) 49 840
Total Patricia Industries incl. cash 64 019 60 220
Other Assets and Liabilities 0 0 -38 -6 5394,5) -342
Total Assets excl. cash Patricia Industries 100 393 299 549 281 416
Gross debt -35 243 -36 051
Gross cash 15 268 15 598
Of which Patricia Industries 11 062 10 380
Net debt -26 -19 975 -20 453
Net Asset Value 367 279 574 18 611 260 963 1) Calculated in accordance with the disclosure regulations of Sweden’s Financial Instruments Trading Act (LHF). ABB, AstraZeneca, Nasdaq and Wärtsilä in accordance with Swiss,
British, U.S. and Finnish regulations.
2) Includes market value of derivatives related to investments if applicable. The subsidiaries and the partner-owned investments within Patricia Industries are reported according to the
acquisition method and equity method respectively.
3) Valued according to the class of share held by Investor, with the exception of Saab and Electrolux, for which the most actively traded class of share is used.
4) Including management costs, of which Listed Core Investments SEK 46 m., EQT SEK 4 m., Patricia Industries SEK 133 m., and Groupwide SEK 36 m.
5) Including paid dividends of SEK 6,856 m.
INVESTOR Q2 2015 – 4
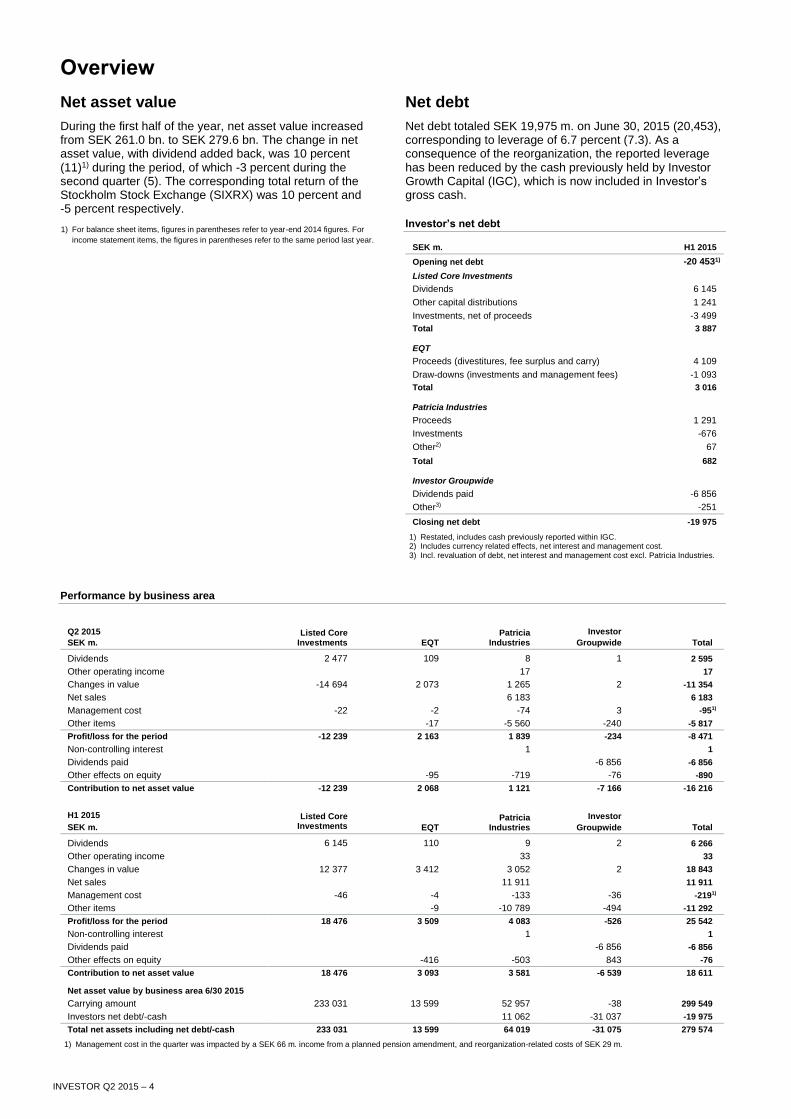
Net asset value
During the first half of the year, net asset value increased from SEK 261.0 bn. to SEK 279.6 bn. The change in net asset value, with dividend added back, was 10 percent (11)1) during the period, of which -3 percent during the second quarter (5). The corresponding total return of the Stockholm Stock Exchange (SIXRX) was 10 percent and -5 percent respectively.
1) For balance sheet items, figures in parentheses refer to year-end 2014 figures. For
income statement items, the figures in parentheses refer to the same period last year.
Net debt
Net debt totaled SEK 19,975 m. on June 30, 2015 (20,453), corresponding to leverage of 6.7 percent (7.3). As a consequence of the reorganization, the reported leverage has been reduced by the cash previously held by Investor Growth Capital (IGC), which is now included in Investor’s gross cash.
Investor’s net debt
SEK m. H1 2015
Opening net debt -20 4531)
Listed Core Investments
Dividends 6 145
Other capital distributions 1 241
Investments, net of proceeds -3 499
Total 3 887
EQT
Proceeds (divestitures, fee surplus and carry) 4 109
Draw-downs (investments and management fees) -1 093
Total 3 016
Patricia Industries
Proceeds 1 291
Investments -676
Other2) 67
Total 682
Investor Groupwide
Dividends paid -6 856
Other3) -251
Closing net debt -19 975
1) Restated, includes cash previously reported within IGC. 2) Includes currency related effects, net interest and management cost. 3) Incl. revaluation of debt, net interest and management cost excl. Patricia Industries.
Performance by business area
Q2 2015
SEK m. Listed Core
Investments EQT Patricia
Industries
Investor
Groupwide Total
Dividends 2 477 109 8 1 2 595
Other operating income 17 17
Changes in value -14 694 2 073 1 265 2 -11 354
Net sales 6 183 6 183
Management cost -22 -2 -74 3 -951)
Other items -17 -5 560 -240 -5 817
Profit/loss for the period -12 239 2 163 1 839 -234 -8 471
Non-controlling interest 1 1
Dividends paid -6 856 -6 856
Other effects on equity -95 -719 -76 -890
Contribution to net asset value -12 239 2 068 1 121 -7 166 -16 216
H1 2015
SEK m.
Listed Core Investments EQT
Patricia Industries
Investor
Groupwide Total
Dividends 6 145 110 9 2 6 266
Other operating income 33 33
Changes in value 12 377 3 412 3 052 2 18 843
Net sales 11 911 11 911
Management cost -46 -4 -133 -36 -2191)
Other items -9 -10 789 -494 -11 292
Profit/loss for the period 18 476 3 509 4 083 -526 25 542
Non-controlling interest 1 1
Dividends paid -6 856 -6 856
Other effects on equity -416 -503 843 -76
Contribution to net asset value 18 476 3 093 3 581 -6 539 18 611
Net asset value by business area 6/30 2015
Carrying amount 233 031 13 599 52 957 -38 299 549
Investors net debt/-cash 11 062 -31 037 -19 975
Total net assets including net debt/-cash 233 031 13 599 64 019 -31 075 279 574
1) Management cost in the quarter was impacted by a SEK 66 m. income from a planned pension amendment, and reorganization-related costs of SEK 29 m.
Overview
INVESTOR Q2 2015 – 5
Listed Core Investments
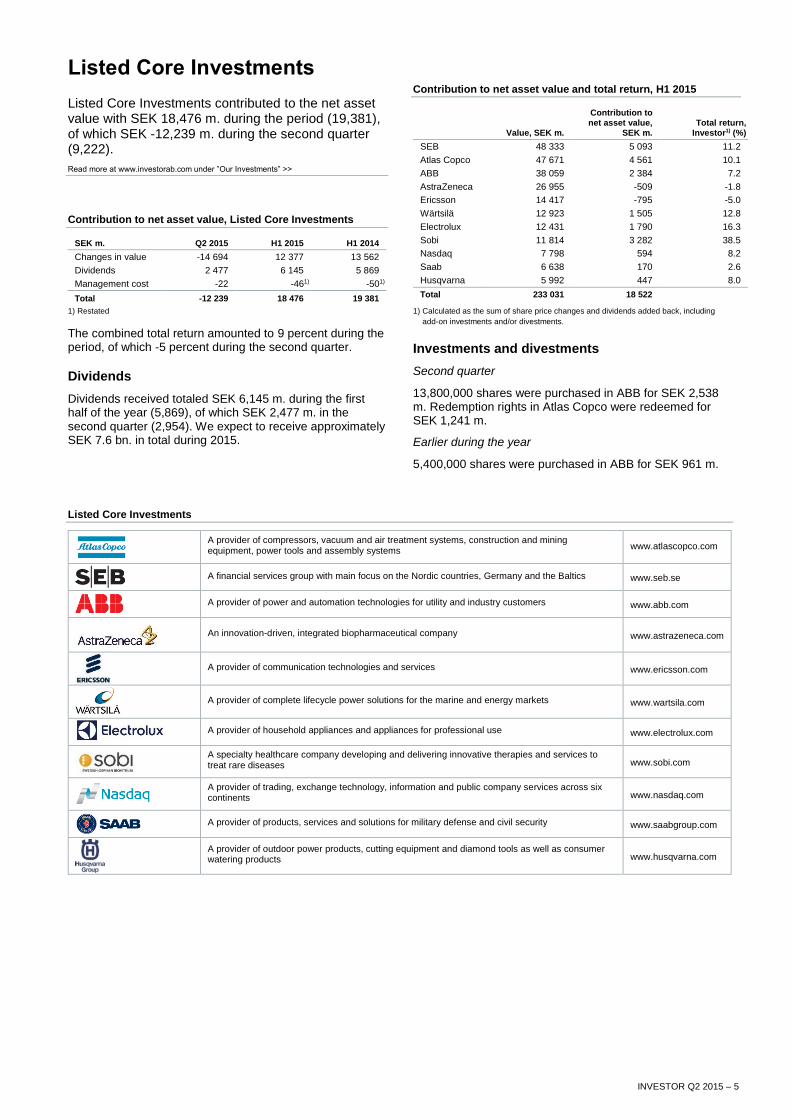
Listed Core Investments contributed to the net asset value with SEK 18,476 m. during the period (19,381), of which SEK -12,239 m. during the second quarter (9,222).
Read more at www.investorab.com under ”Our Investments” >>
Contribution to net asset value, Listed Core Investments
SEK m. Q2 2015 H1 2015 H1 2014
Changes in value -14 694 12 377 13 562
Dividends 2 477 6 145 5 869
Management cost -22 -461) -501)
Total -12 239 18 476 19 381
1) Restated
The combined total return amounted to 9 percent during the period, of which -5 percent during the second quarter.
Dividends
Dividends received totaled SEK 6,145 m. during the first half of the year (5,869), of which SEK 2,477 m. in the second quarter (2,954). We expect to receive approximately SEK 7.6 bn. in total during 2015.
Contribution to net asset value and total return, H1 2015
Value, SEK m.
Contribution to net asset value,
SEK m. Total return,
Investor1) (%)
SEB 48 333 5 093 11.2
Atlas Copco 47 671 4 561 10.1
ABB 38 059 2 384 7.2
AstraZeneca 26 955 -509 -1.8
Ericsson 14 417 -795 -5.0
Wärtsilä 12 923 1 505 12.8
Electrolux 12 431 1 790 16.3
Sobi 11 814 3 282 38.5
Nasdaq 7 798 594 8.2
Saab 6 638 170 2.6
Husqvarna 5 992 447 8.0
Total 233 031 18 522
1) Calculated as the sum of share price changes and dividends added back, including
add-on investments and/or divestments.
Investments and divestments
Second quarter
13,800,000 shares were purchased in ABB for SEK 2,538 m. Redemption rights in Atlas Copco were redeemed for SEK 1,241 m.
Earlier during the year
5,400,000 shares were purchased in ABB for SEK 961 m.
Listed Core Investments
A provider of compressors, vacuum and air treatment systems, construction and mining equipment, power tools and assembly systems
www.atlascopco.com
A financial services group with main focus on the Nordic countries, Germany and the Baltics www.seb.se
A provider of power and automation technologies for utility and industry customers www.abb.com
An innovation-driven, integrated biopharmaceutical company www.astrazeneca.com
A provider of communication technologies and services www.ericsson.com
A provider of complete lifecycle power solutions for the marine and energy markets www.wartsila.com
A provider of household appliances and appliances for professional use www.electrolux.com
A specialty healthcare company developing and delivering innovative therapies and services to treat rare diseases www.sobi.com
A provider of trading, exchange technology, information and public company services across six continents www.nasdaq.com
A provider of products, services and solutions for military defense and civil security www.saabgroup.com
A provider of outdoor power products, cutting equipment and diamond tools as well as consumer watering products www.husqvarna.com
INVESTOR Q2 2015 – 6
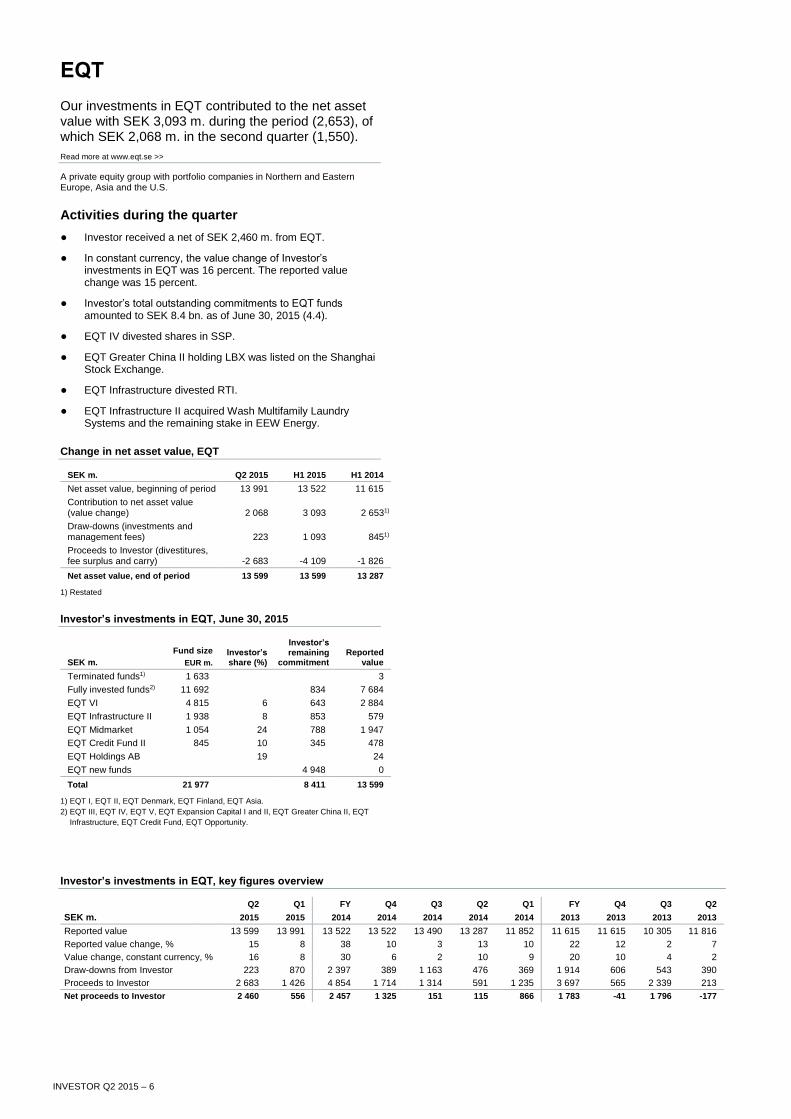
EQT
Our investments in EQT contributed to the net asset value with SEK 3,093 m. during the period (2,653), of which SEK 2,068 m. in the second quarter (1,550).
Read more at www.eqt.se >>
A private equity group with portfolio companies in Northern and Eastern Europe, Asia and the U.S.
Activities during the quarter
● Investor received a net of SEK 2,460 m. from EQT.
● In constant currency, the value change of Investor’s investments in EQT was 16 percent. The reported value change was 15 percent.
● Investor’s total outstanding commitments to EQT funds amounted to SEK 8.4 bn. as of June 30, 2015 (4.4).
● EQT IV divested shares in SSP.
● EQT Greater China II holding LBX was listed on the Shanghai Stock Exchange.
● EQT Infrastructure divested RTI.
● EQT Infrastructure II acquired Wash Multifamily Laundry Systems and the remaining stake in EEW Energy.
Change in net asset value, EQT
SEK m. Q2 2015 H1 2015 H1 2014
Net asset value, beginning of period 13 991 13 522 11 615
Contribution to net asset value (value change) 2 068 3 093 2 6531)
Draw-downs (investments and management fees) 223 1 093 8451)
Proceeds to Investor (divestitures, fee surplus and carry) -2 683 -4 109 -1 826
Net asset value, end of period 13 599 13 599 13 287
1) Restated
Investor’s investments in EQT, June 30, 2015
SEK m.
Fund size
EUR m.
Investor’s share (%)
Investor’s remaining
commitment Reported
value
Terminated funds1) 1 633 3
Fully invested funds2) 11 692 834 7 684
EQT VI 4 815 6 643 2 884
EQT Infrastructure II 1 938 8 853 579
EQT Midmarket 1 054 24 788 1 947
EQT Credit Fund II 845 10 345 478
EQT Holdings AB 19 24
EQT new funds 4 948 0
Total 21 977 8 411 13 599
1) EQT I, EQT II, EQT Denmark, EQT Finland, EQT Asia.
2) EQT III, EQT IV, EQT V, EQT Expansion Capital I and II, EQT Greater China II, EQT
Infrastructure, EQT Credit Fund, EQT Opportunity.
Investor’s investments in EQT, key figures overview
Q2 Q1 FY Q4 Q3 Q2 Q1 FY Q4 Q3 Q2
SEK m. 2015 2015 2014 2014 2014 2014 2014 2013 2013 2013 2013
Reported value 13 599 13 991 13 522 13 522 13 490 13 287 11 852 11 615 11 615 10 305 11 816
Reported value change, % 15 8 38 10 3 13 10 22 12 2 7
Value change, constant currency, % 16 8 30 6 2 10 9 20 10 4 2
Draw-downs from Investor 223 870 2 397 389 1 163 476 369 1 914 606 543 390
Proceeds to Investor 2 683 1 426 4 854 1 714 1 314 591 1 235 3 697 565 2 339 213
Net proceeds to Investor 2 460 556 2 457 1 325 151 115 866 1 783 -41 1 796 -177
INVESTOR Q2 2015 – 7
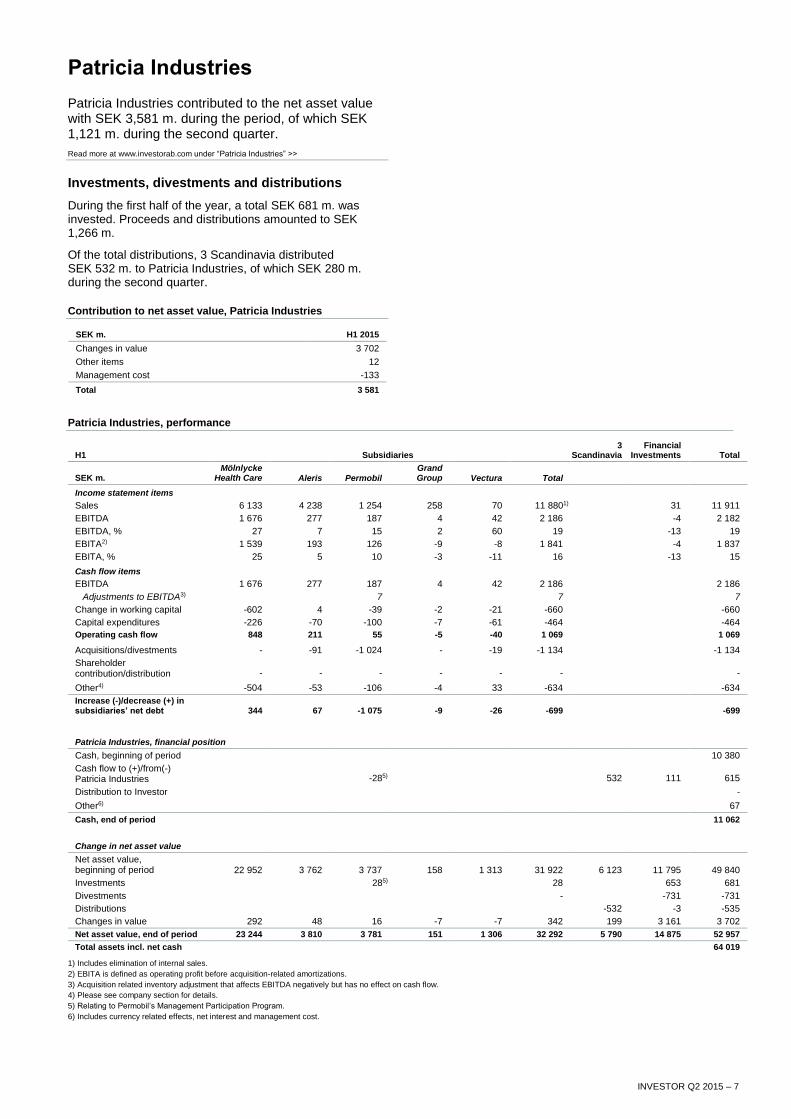
Patricia Industries
Patricia Industries contributed to the net asset value with SEK 3,581 m. during the period, of which SEK 1,121 m. during the second quarter.
Read more at www.investorab.com under “Patricia Industries” >>
Investments, divestments and distributions
During the first half of the year, a total SEK 681 m. was invested. Proceeds and distributions amounted to SEK 1,266 m.
Of the total distributions, 3 Scandinavia distributed SEK 532 m. to Patricia Industries, of which SEK 280 m. during the second quarter.
Contribution to net asset value, Patricia Industries
SEK m. H1 2015
Changes in value 3 702
Other items 12
Management cost -133
Total 3 581
Patricia Industries, performance
H1 Subsidiaries 3
Scandinavia Financial
Investments Total
SEK m. Mölnlycke
Health Care Aleris Permobil Grand Group Vectura Total
Income statement items
Sales 6 133 4 238 1 254 258 70 11 8801) 31 11 911
EBITDA 1 676 277 187 4 42 2 186 -4 2 182
EBITDA, % 27 7 15 2 60 19 -13 19
EBITA2) 1 539 193 126 -9 -8 1 841 -4 1 837
EBITA, % 25 5 10 -3 -11 16 -13 15
Cash flow items
EBITDA 1 676 277 187 4 42 2 186 2 186
Adjustments to EBITDA3) 7 7 7
Change in working capital -602 4 -39 -2 -21 -660 -660
Capital expenditures -226 -70 -100 -7 -61 -464 -464
Operating cash flow 848 211 55 -5 -40 1 069 1 069
Acquisitions/divestments - -91 -1 024 - -19 -1 134 -1 134
Shareholder contribution/distribution - - - - - - -
Other4) -504 -53 -106 -4 33 -634 -634
Increase (-)/decrease (+) in subsidiaries’ net debt 344 67 -1 075 -9 -26 -699 -699
Patricia Industries, financial position
Cash, beginning of period 10 380
Cash flow to (+)/from(-) Patricia Industries -285) 532 111 615
Distribution to Investor -
Other6) 67
Cash, end of period 11 062
Change in net asset value
Net asset value, beginning of period 22 952 3 762 3 737 158 1 313 31 922 6 123 11 795 49 840
Investments 285) 28 653 681
Divestments - -731 -731
Distributions -532 -3 -535
Changes in value 292 48 16 -7 -7 342 199 3 161 3 702
Net asset value, end of period 23 244 3 810 3 781 151 1 306 32 292 5 790 14 875 52 957
Total assets incl. net cash 64 019
1) Includes elimination of internal sales.
2) EBITA is defined as operating profit before acquisition-related amortizations.
3) Acquisition related inventory adjustment that affects EBITDA negatively but has no effect on cash flow.
4) Please see company section for details.
5) Relating to Permobil’s Management Participation Program.
6) Includes currency related effects, net interest and management cost.
INVESTOR Q2 2015 – 8
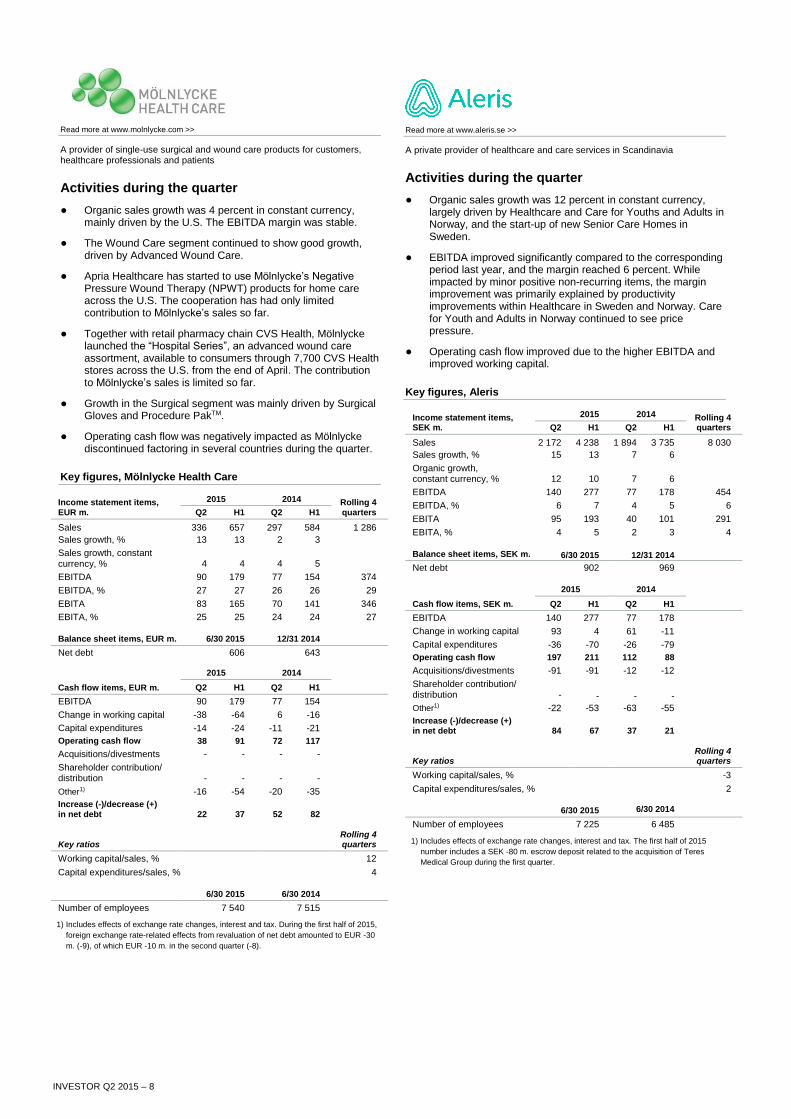
Read more at www.molnlycke.com >>
A provider of single-use surgical and wound care products for customers, healthcare professionals and patients
Activities during the quarter
● Organic sales growth was 4 percent in constant currency, mainly driven by the U.S. The EBITDA margin was stable.
● The Wound Care segment continued to show good growth, driven by Advanced Wound Care.
● Apria Healthcare has started to use Mölnlycke’s Negative Pressure Wound Therapy (NPWT) products for home care across the U.S. The cooperation has had only limited contribution to Mölnlycke’s sales so far.
● Together with retail pharmacy chain CVS Health, Mölnlycke launched the “Hospital Series”, an advanced wound care assortment, available to consumers through 7,700 CVS Health stores across the U.S. from the end of April. The contribution to Mölnlycke’s sales is limited so far.
● Growth in the Surgical segment was mainly driven by Surgical Gloves and Procedure PakTM.
● Operating cash flow was negatively impacted as Mölnlycke discontinued factoring in several countries during the quarter.
Key figures, Mölnlycke Health Care
Income statement items, EUR m.
2015 2014 Rolling 4 quarters Q2 H1 Q2 H1
Sales 336 657 297 584 1 286
Sales growth, % 13 13 2 3
Sales growth, constant currency, % 4 4 4 5
EBITDA 90 179 77 154 374
EBITDA, % 27 27 26 26 29
EBITA 83 165 70 141 346
EBITA, % 25 25 24 24 27
Balance sheet items, EUR m. 6/30 2015 12/31 2014
Net debt 606 643
2015 2014
Cash flow items, EUR m. Q2 H1 Q2 H1
EBITDA 90 179 77 154
Change in working capital -38 -64 6 -16
Capital expenditures -14 -24 -11 -21
Operating cash flow 38 91 72 117
Acquisitions/divestments - - - -
Shareholder contribution/ distribution - - - -
Other1) -16 -54 -20 -35
Increase (-)/decrease (+) in net debt 22 37 52 82
Key ratios Rolling 4
quarters
Working capital/sales, % 12
Capital expenditures/sales, % 4
6/30 2015 6/30 2014
Number of employees 7 540 7 515
1) Includes effects of exchange rate changes, interest and tax. During the first half of 2015,
foreign exchange rate-related effects from revaluation of net debt amounted to EUR -30
m. (-9), of which EUR -10 m. in the second quarter (-8).
Read more at www.aleris.se >>
A private provider of healthcare and care services in Scandinavia
Activities during the quarter
● Organic sales growth was 12 percent in constant currency, largely driven by Healthcare and Care for Youths and Adults in Norway, and the start-up of new Senior Care Homes in Sweden.
● EBITDA improved significantly compared to the corresponding period last year, and the margin reached 6 percent. While impacted by minor positive non-recurring items, the margin improvement was primarily explained by productivity improvements within Healthcare in Sweden and Norway. Care for Youth and Adults in Norway continued to see price pressure.
● Operating cash flow improved due to the higher EBITDA and improved working capital.
Key figures, Aleris
Income statement items, SEK m.
2015 2014 Rolling 4 quarters Q2 H1 Q2 H1
Sales 2 172 4 238 1 894 3 735 8 030
Sales growth, % 15 13 7 6
Organic growth, constant currency, % 12 10 7 6
EBITDA 140 277 77 178 454
EBITDA, % 6 7 4 5 6
EBITA 95 193 40 101 291
EBITA, % 4 5 2 3 4 Balance sheet items, SEK m. 6/30 2015 12/31 2014
Net debt 902 969
2015 2014
Cash flow items, SEK m. Q2 H1 Q2 H1
EBITDA 140 277 77 178
Change in working capital 93 4 61 -11
Capital expenditures -36 -70 -26 -79
Operating cash flow 197 211 112 88
Acquisitions/divestments -91 -91 -12 -12
Shareholder contribution/ distribution - - - -
Other1) -22 -53 -63 -55
Increase (-)/decrease (+) in net debt 84 67 37 21
Key ratios Rolling 4
quarters
Working capital/sales, % -3
Capital expenditures/sales, % 2
6/30 2015 6/30 2014
Number of employees 7 225 6 485
1) Includes effects of exchange rate changes, interest and tax. The first half of 2015
number includes a SEK -80 m. escrow deposit related to the acquisition of Teres
Medical Group during the first quarter.

INVESTOR Q2 2015 – 9
Read more at www.permobil.com >>
A provider of advanced powered and manual wheelchairs for severely disabled users
Activities during the quarter
● Performance improved, with organic sales growth of 6 percent in constant currency, supported by positive response for the new powered wheelchair series in both North America and Europe. Reported sales growth was driven by the acquisitions of TiLite and ROHO and positive currency impact.
● Reported EBITDA was SEK 125 m. and the margin was 17 percent, below last year’s level due to investments in sales force expansion and product introduction activities. Transaction costs and higher costs of goods sold, as a result of inventory step-up related to the ROHO acquisition, also weighed on the margin.
● The operating cash flow was negatively impacted by the investments made in inventory and demo wheelchairs in order to support the ongoing introduction of the new powered wheelchair series.
Key figures, Permobil
Income statement items, SEK m.
2015 2014 Rolling 4 quarters Q2 H1 Q2 H1
Sales 723 1 254 482 893 2 414
Sales growth, % 50 40 10 9
Organic growth, constant currency, % 6 2 5 6
EBITDA 125 187 103 166 447
EBITDA, % 17 15 21 19 19
EBITA 89 126 83 129 338
EBITA, % 12 10 17 14 14
Balance sheet items, SEK m. 6/30 2015 12/31 2014
Net debt 2 526 1 451
Cash flow items, SEK m.
2015 2014
Q2 H1 Q2 H1
EBITDA 125 187 103 166
Adjustments to EBITDA1) 7 7 - -
Change in working capital -40 -39 -64 -24
Capital expenditures -57 -100 -29 -64
Operating cash flow 35 55 10 78
Acquisitions/divestments -1 024 -1 024 -362 -362
Shareholder contribution/ distribution - - - -
Other2) 55 -106 2 -20
Increase (-)/decrease (+) in net debt -934 -1 075 -350 -304
Key ratios
Rolling 4 quarters
Working capital/sales, % 20
Capital expenditures/sales, % 8
6/30 2015 6/30 2014
Number of employees 1 310 955
1) Acquisition related inventory adjustment that effects EBITDA negatively but has no
effect on cash flow.
2) Includes effects of exchange rate changes, interest and tax. During the first half of
2015, foreign exchange rate-related effects amounted to SEK -53 m. from revaluation
of Net debt (-32), of which SEK 56 m. during the second quarter (-33).
Read more at www.grandhotel.se >>
Grand Hôtel, Scandinavia’s leading five-star hotel, and Lydmar Hotel
Activities during the quarter
● Organic sales growth for the Grand Group was 6 percent, primarily driven by strong growth in the lodging business at both Grand Hôtel and Lydmar.
● EBITDA improved. The margin was flat following decreased profitability in the Food & Beverage segment and higher operating expenses.
Key figures, Grand Group
Income statement items, SEK m.
2015 2014 Rolling 4 quarters Q2 H1 Q2 H1
Sales 155 258 146 238 561
Sales growth, % 6 8 29 28
Organic growth, % 6 8 12 12
EBITDA 15 4 14 1 33
EBITDA, % 10 2 10 0 6
EBITA 8 -9 9 -10 6
EBITA, % 5 -3 6 -4 1
Balance sheet items, SEK m. 6/30 2015 12/31 2014
Net debt -76 -85
Cash flow items, SEK m.
2015 2014
Q2 H1 Q2 H1
EBITDA 15 4 14 1
Change in working capital 4 -2 6 -23
Capital expenditures -1 -7 -7 -15
Operating cash flow 18 -5 13 -37
Acquisitions/divestments - - - -
Shareholder contribution/ distribution - - - -
Other1) -2 -4 -2 -21
Increase (-)/decrease (+) in net debt 16 -9 11 -58
Key ratios Rolling 4 quarters
Working capital/sales, % -10
Capital expenditures/sales, % 2
6/30 2015 6/30 2014
Number of employees 340 325
1) Includes effects of exchange rate changes, interest and tax.
INVESTOR Q2 2015 – 10
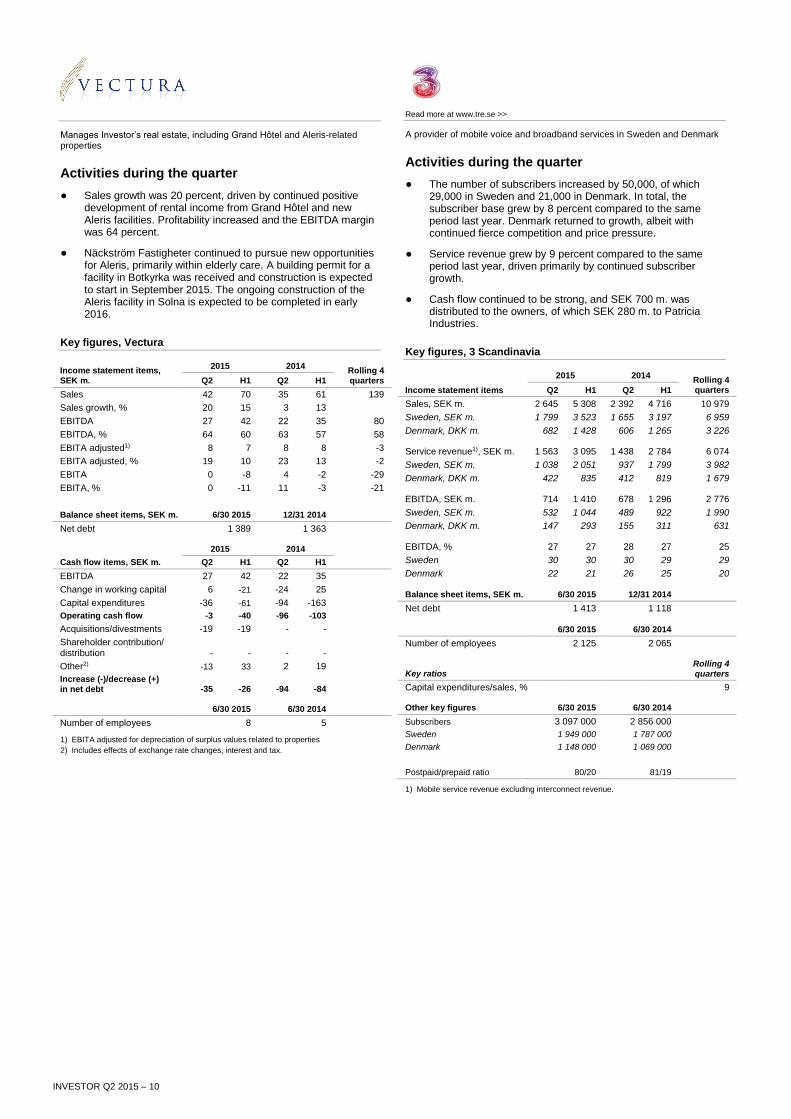
Manages Investor’s real estate, including Grand Hôtel and Aleris-related properties
Activities during the quarter
● Sales growth was 20 percent, driven by continued positive development of rental income from Grand Hôtel and new Aleris facilities. Profitability increased and the EBITDA margin was 64 percent.
● Näckström Fastigheter continued to pursue new opportunities for Aleris, primarily within elderly care. A building permit for a facility in Botkyrka was received and construction is expected to start in September 2015. The ongoing construction of the Aleris facility in Solna is expected to be completed in early 2016.
Key figures, Vectura
Income statement items, SEK m.
2015 2014 Rolling 4 quarters Q2 H1 Q2 H1
Sales 42 70 35 61 139
Sales growth, % 20 15 3 13
EBITDA 27 42 22 35 80
EBITDA, % 64 60 63 57 58
EBITA adjusted1) 8 7 8 8 -3
EBITA adjusted, % 19 10 23 13 -2
EBITA 0 -8 4 -2 -29
EBITA, % 0 -11 11 -3 -21
Balance sheet items, SEK m. 6/30 2015 12/31 2014
Net debt 1 389 1 363
Cash flow items, SEK m.
2015 2014
Q2 H1 Q2 H1
EBITDA 27 42 22 35
Change in working capital 6 -21 -24 25
Capital expenditures -36 -61 -94 -163
Operating cash flow -3 -40 -96 -103
Acquisitions/divestments -19 -19 - -
Shareholder contribution/ distribution - - - -
Other2) -13 33 2 19
Increase (-)/decrease (+) in net debt -35 -26 -94 -84
6/30 2015 6/30 2014
Number of employees 8 5
1) EBITA adjusted for depreciation of surplus values related to properties
2) Includes effects of exchange rate changes, interest and tax.
Read more at www.tre.se >>
A provider of mobile voice and broadband services in Sweden and Denmark
Activities during the quarter
● The number of subscribers increased by 50,000, of which 29,000 in Sweden and 21,000 in Denmark. In total, the subscriber base grew by 8 percent compared to the same period last year. Denmark returned to growth, albeit with continued fierce competition and price pressure.
● Service revenue grew by 9 percent compared to the same period last year, driven primarily by continued subscriber growth.
● Cash flow continued to be strong, and SEK 700 m. was distributed to the owners, of which SEK 280 m. to Patricia Industries.
Key figures, 3 Scandinavia
Income statement items
2015 2014 Rolling 4 quarters Q2 H1 Q2 H1
Sales, SEK m. 2 645 5 308 2 392 4 716 10 979
Sweden, SEK m. 1 799 3 523 1 655 3 197 6 959
Denmark, DKK m. 682 1 428 606 1 265 3 226
Service revenue1), SEK m. 1 563 3 095 1 438 2 784 6 074
Sweden, SEK m. 1 038 2 051 937 1 799 3 982
Denmark, DKK m. 422 835 412 819 1 679
EBITDA, SEK m. 714 1 410 678 1 296 2 776
Sweden, SEK m. 532 1 044 489 922 1 990
Denmark, DKK m. 147 293 155 311 631
EBITDA, % 27 27 28 27 25
Sweden 30 30 30 29 29
Denmark 22 21 26 25 20
Balance sheet items, SEK m. 6/30 2015 12/31 2014
Net debt 1 413 1 118
6/30 2015 6/30 2014
Number of employees 2 125 2 065
Key ratios Rolling 4 quarters
Capital expenditures/sales, % 9
Other key figures 6/30 2015 6/30 2014
Subscribers 3 097 000 2 856 000
Sweden 1 949 000 1 787 000
Denmark 1 148 000 1 069 000
Postpaid/prepaid ratio 80/20 81/19
1) Mobile service revenue excluding interconnect revenue.
INVESTOR Q2 2015 – 11
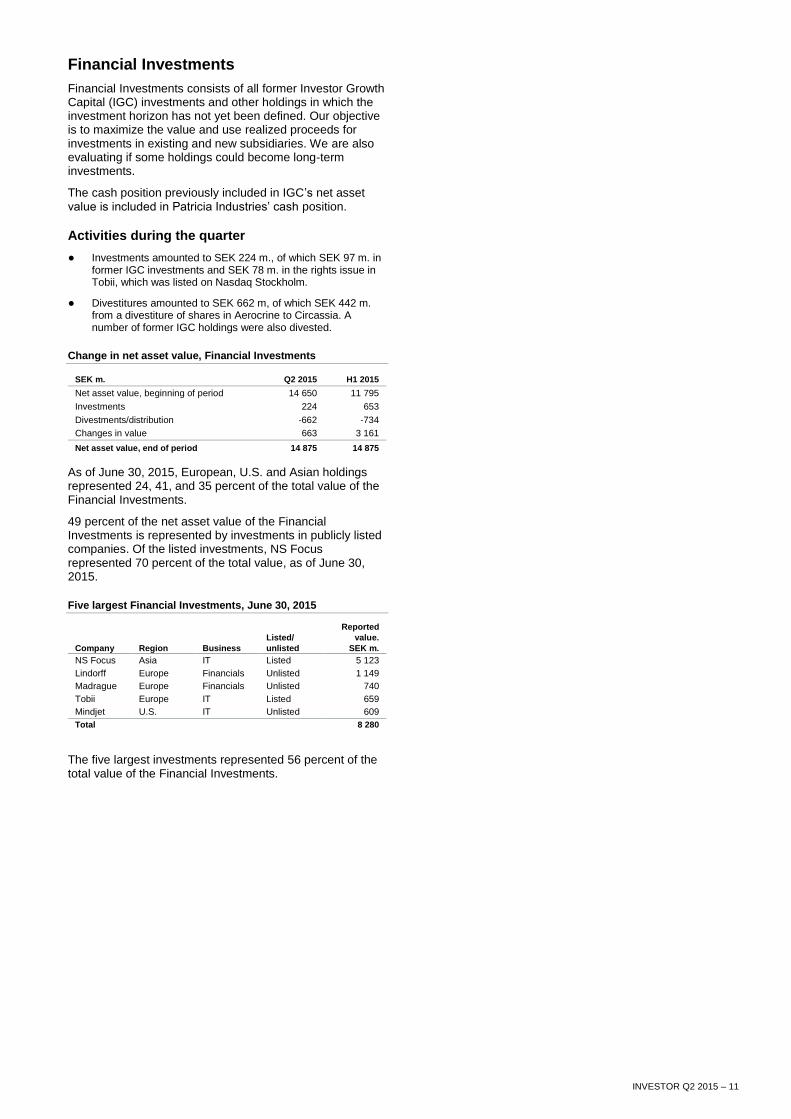
Financial Investments
Financial Investments consists of all former Investor Growth Capital (IGC) investments and other holdings in which the investment horizon has not yet been defined. Our objective is to maximize the value and use realized proceeds for investments in existing and new subsidiaries. We are also evaluating if some holdings could become long-term investments.
The cash position previously included in IGC’s net asset value is included in Patricia Industries’ cash position.
Activities during the quarter
● Investments amounted to SEK 224 m., of which SEK 97 m. in former IGC investments and SEK 78 m. in the rights issue in Tobii, which was listed on Nasdaq Stockholm.
● Divestitures amounted to SEK 662 m, of which SEK 442 m. from a divestiture of shares in Aerocrine to Circassia. A number of former IGC holdings were also divested.
Change in net asset value, Financial Investments
SEK m. Q2 2015 H1 2015
Net asset value, beginning of period 14 650 11 795
Investments 224 653
Divestments/distribution -662 -734
Changes in value 663 3 161
Net asset value, end of period 14 875 14 875
As of June 30, 2015, European, U.S. and Asian holdings represented 24, 41, and 35 percent of the total value of the Financial Investments.
49 percent of the net asset value of the Financial Investments is represented by investments in publicly listed companies. Of the listed investments, NS Focus represented 70 percent of the total value, as of June 30, 2015.
Five largest Financial Investments, June 30, 2015
Company Region Business
Listed/
unlisted
Reported
value.
SEK m.
NS Focus Asia IT Listed 5 123
Lindorff Europe Financials Unlisted 1 149
Madrague Europe Financials Unlisted 740
Tobii Europe IT Listed 659
Mindjet U.S. IT Unlisted 609
Total 8 280
The five largest investments represented 56 percent of the total value of the Financial Investments.
INVESTOR Q2 2015 – 12
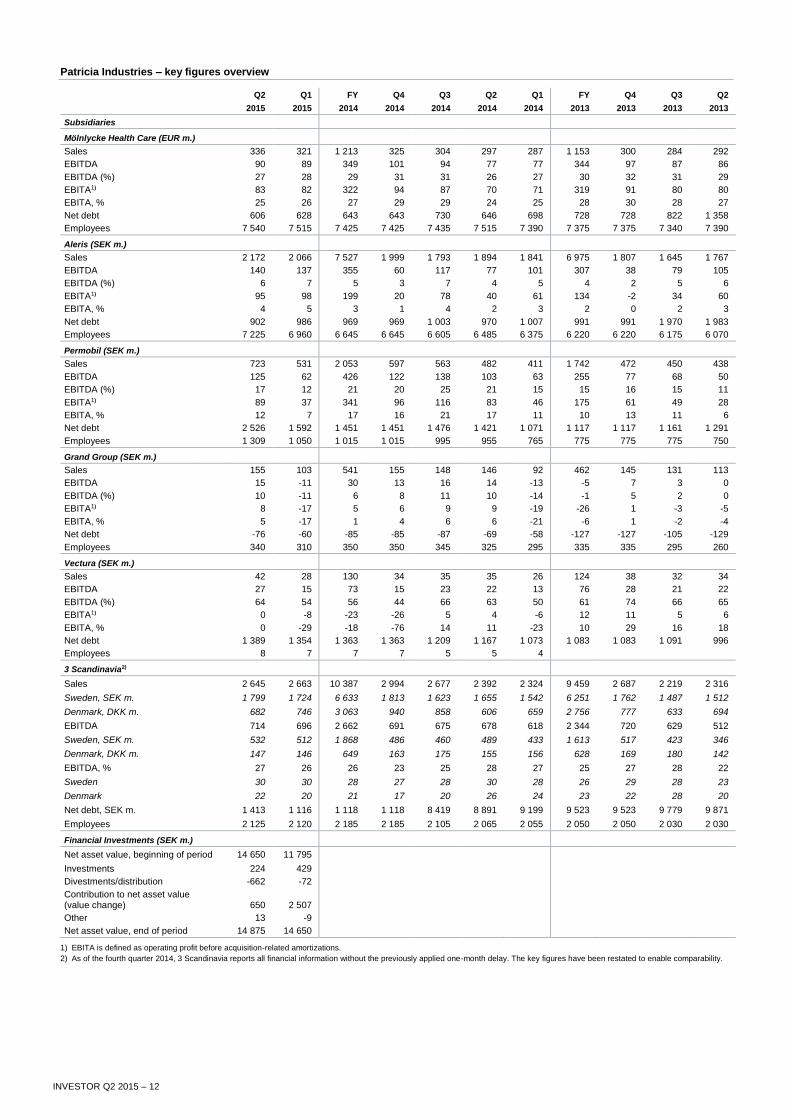
Patricia Industries – key figures overview
Q2 Q1 FY Q4 Q3 Q2 Q1 FY Q4 Q3 Q2
2015 2015 2014 2014 2014 2014 2014 2013 2013 2013 2013
Subsidiaries
Mölnlycke Health Care (EUR m.)
Sales 336 321 1 213 325 304 297 287 1 153 300 284 292
EBITDA 90 89 349 101 94 77 77 344 97 87 86
EBITDA (%) 27 28 29 31 31 26 27 30 32 31 29
EBITA1) 83 82 322 94 87 70 71 319 91 80 80
EBITA, % 25 26 27 29 29 24 25 28 30 28 27
Net debt 606 628 643 643 730 646 698 728 728 822 1 358
Employees 7 540 7 515 7 425 7 425 7 435 7 515 7 390 7 375 7 375 7 340 7 390
Aleris (SEK m.)
Sales 2 172 2 066 7 527 1 999 1 793 1 894 1 841 6 975 1 807 1 645 1 767
EBITDA 140 137 355 60 117 77 101 307 38 79 105
EBITDA (%) 6 7 5 3 7 4 5 4 2 5 6
EBITA1) 95 98 199 20 78 40 61 134 -2 34 60
EBITA, % 4 5 3 1 4 2 3 2 0 2 3
Net debt 902 986 969 969 1 003 970 1 007 991 991 1 970 1 983
Employees 7 225 6 960 6 645 6 645 6 605 6 485 6 375 6 220 6 220 6 175 6 070
Permobil (SEK m.)
Sales 723 531 2 053 597 563 482 411 1 742 472 450 438
EBITDA 125 62 426 122 138 103 63 255 77 68 50
EBITDA (%) 17 12 21 20 25 21 15 15 16 15 11
EBITA1) 89 37 341 96 116 83 46 175 61 49 28
EBITA, % 12 7 17 16 21 17 11 10 13 11 6
Net debt 2 526 1 592 1 451 1 451 1 476 1 421 1 071 1 117 1 117 1 161 1 291
Employees 1 309 1 050 1 015 1 015 995 955 765 775 775 775 750
Grand Group (SEK m.)
Sales 155 103 541 155 148 146 92 462 145 131 113
EBITDA 15 -11 30 13 16 14 -13 -5 7 3 0
EBITDA (%) 10 -11 6 8 11 10 -14 -1 5 2 0
EBITA1) 8 -17 5 6 9 9 -19 -26 1 -3 -5
EBITA, % 5 -17 1 4 6 6 -21 -6 1 -2 -4
Net debt -76 -60 -85 -85 -87 -69 -58 -127 -127 -105 -129
Employees 340 310 350 350 345 325 295 335 335 295 260
Vectura (SEK m.)
Sales 42 28 130 34 35 35 26 124 38 32 34
EBITDA 27 15 73 15 23 22 13 76 28 21 22
EBITDA (%) 64 54 56 44 66 63 50 61 74 66 65
EBITA1) 0 -8 -23 -26 5 4 -6 12 11 5 6
EBITA, % 0 -29 -18 -76 14 11 -23 10 29 16 18
Net debt 1 389 1 354 1 363 1 363 1 209 1 167 1 073 1 083 1 083 1 091 996
Employees 8 7 7 7 5 5 4
3 Scandinavia2)
Sales 2 645 2 663 10 387 2 994 2 677 2 392 2 324 9 459 2 687 2 219 2 316
Sweden, SEK m. 1 799 1 724 6 633 1 813 1 623 1 655 1 542 6 251 1 762 1 487 1 512
Denmark, DKK m. 682 746 3 063 940 858 606 659 2 756 777 633 694
EBITDA 714 696 2 662 691 675 678 618 2 344 720 629 512
Sweden, SEK m. 532 512 1 868 486 460 489 433 1 613 517 423 346
Denmark, DKK m. 147 146 649 163 175 155 156 628 169 180 142
EBITDA, % 27 26 26 23 25 28 27 25 27 28 22
Sweden 30 30 28 27 28 30 28 26 29 28 23
Denmark 22 20 21 17 20 26 24 23 22 28 20
Net debt, SEK m. 1 413 1 116 1 118 1 118 8 419 8 891 9 199 9 523 9 523 9 779 9 871
Employees 2 125 2 120 2 185 2 185 2 105 2 065 2 055 2 050 2 050 2 030 2 030
Financial Investments (SEK m.)
Net asset value, beginning of period 14 650 11 795
Investments 224 429
Divestments/distribution -662 -72
Contribution to net asset value (value change) 650 2 507
Other 13 -9
Net asset value, end of period 14 875 14 650
1) EBITA is defined as operating profit before acquisition-related amortizations.
2) As of the fourth quarter 2014, 3 Scandinavia reports all financial information without the previously applied one-month delay. The key figures have been restated to enable comparability.
INVESTOR Q2 2015 – 13
Group
Net debt
Net debt totaled SEK 19,975 m. on June 30, 2015 (20,453). Debt financing of the subsidiaries within Patricia Industries is arranged on an independent, ring-fenced basis and hence not included in Investor’s net debt. Within Patricia Industries, Investor guarantees SEK 0.7 bn. of 3 Scandinavia’s external debt, but this is not included in Investor’s net debt.
Net debt, 6/30 2015
SEK m.
Consolidated balance
sheet
Deductions related to
Patricia subsidiaries
Investor’s net debt
Other financial investments 4 046 -2 4 0441)
Cash, bank and short-term investments 15 815 -4 591 11 2241)
Receivables included in net debt 1 926 - 1 926
Loans -51 654 14 561 -37 093
Provision for pensions -715 639 -76
Total -30 582 10 607 -19 975
1) Included in cash and readily available placements.
Investor’s cash and readily available placements amounted to SEK 15,268 m. as of June 30, 2015 (15,598). The short-term investments are invested conservatively, taking into account the risk-adjusted return profile. Gross debt excluding pensions for Investor amounted to SEK 35,167 m. at the end of the second quarter 2015 (35,825).
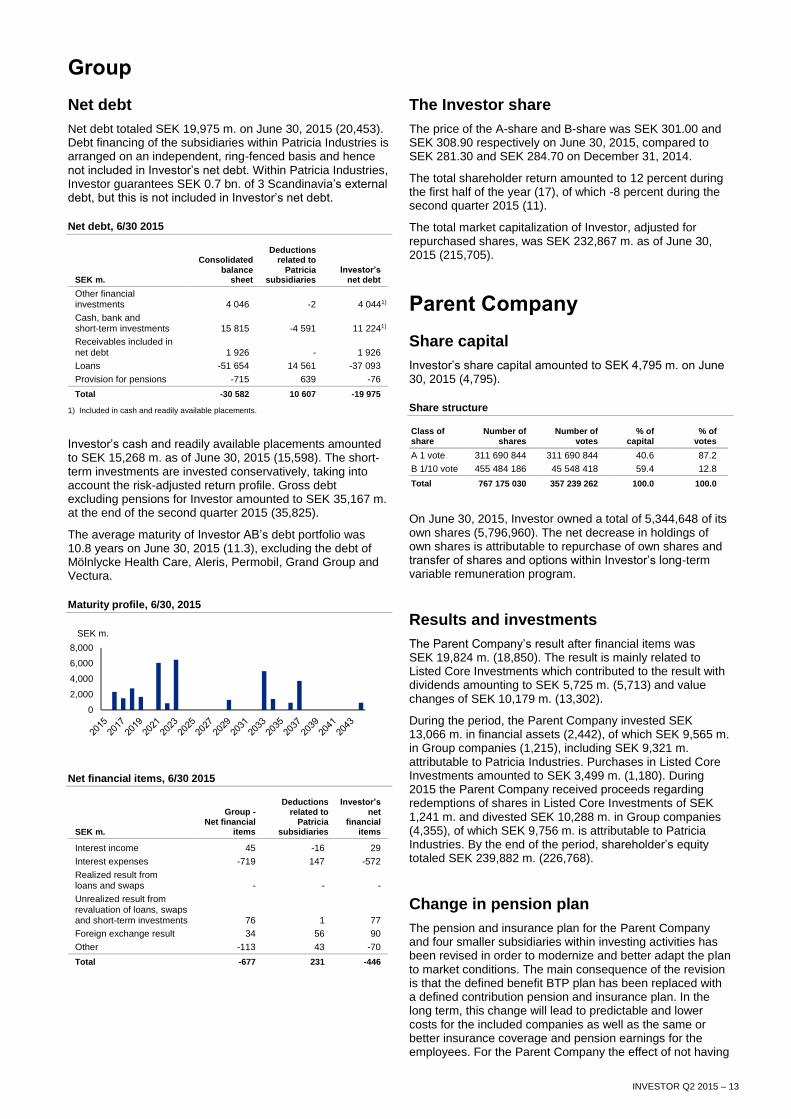
The average maturity of Investor AB’s debt portfolio was 10.8 years on June 30, 2015 (11.3), excluding the debt of Mölnlycke Health Care, Aleris, Permobil, Grand Group and Vectura.
Maturity profile, 6/30, 2015
Net financial items, 6/30 2015
SEK m.
Group - Net financial
items
Deductions related to
Patricia subsidiaries
Investor’s net
financial items
Interest income 45 -16 29
Interest expenses -719 147 -572
Realized result from loans and swaps - - -
Unrealized result from revaluation of loans, swaps and short-term investments 76 1 77
Foreign exchange result 34 56 90
Other -113 43 -70
Total -677 231 -446
The Investor share
The price of the A-share and B-share was SEK 301.00 and SEK 308.90 respectively on June 30, 2015, compared to SEK 281.30 and SEK 284.70 on December 31, 2014.
The total shareholder return amounted to 12 percent during the first half of the year (17), of which -8 percent during the second quarter 2015 (11).
The total market capitalization of Investor, adjusted for repurchased shares, was SEK 232,867 m. as of June 30, 2015 (215,705).
Parent Company
Share capital
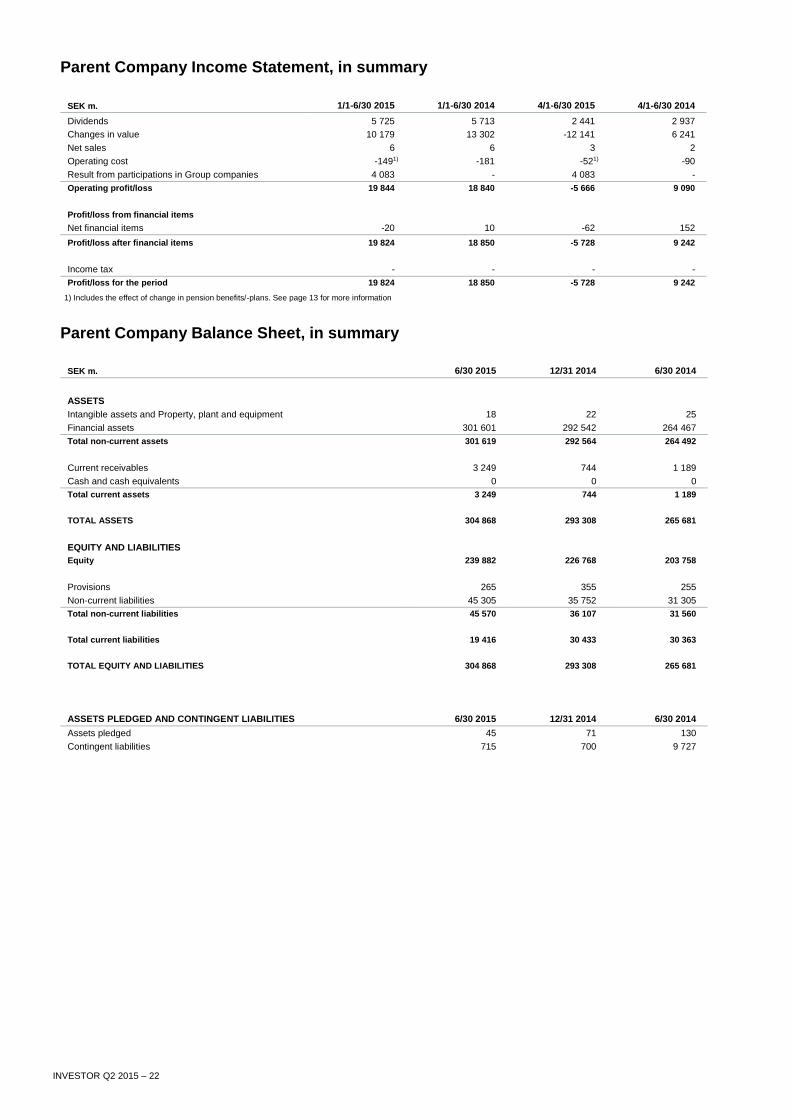
Investor’s share capital amounted to SEK 4,795 m. on June 30, 2015 (4,795).
Share structure
Class of share
Number of shares
Number of votes
% of capital
% of votes
A 1 vote 311 690 844 311 690 844 40.6 87.2
B 1/10 vote 455 484 186 45 548 418 59.4 12.8
Total 767 175 030 357 239 262 100.0 100.0
On June 30, 2015, Investor owned a total of 5,344,648 of its own shares (5,796,960). The net decrease in holdings of own shares is attributable to repurchase of own shares and transfer of shares and options within Investor’s long-term variable remuneration program.
Results and investments
The Parent Company’s result after financial items was SEK 19,824 m. (18,850). The result is mainly related to Listed Core Investments which contributed to the result with dividends amounting to SEK 5,725 m. (5,713) and value changes of SEK 10,179 m. (13,302).
During the period, the Parent Company invested SEK 13,066 m. in financial assets (2,442), of which SEK 9,565 m. in Group companies (1,215), including SEK 9,321 m. attributable to Patricia Industries. Purchases in Listed Core Investments amounted to SEK 3,499 m. (1,180). During 2015 the Parent Company received proceeds regarding redemptions of shares in Listed Core Investments of SEK 1,241 m. and divested SEK 10,288 m. in Group companies (4,355), of which SEK 9,756 m. is attributable to Patricia Industries. By the end of the period, shareholder’s equity totaled SEK 239,882 m. (226,768).
Change in pension plan
The pension and insurance plan for the Parent Company and four smaller subsidiaries within investing activities has been revised in order to modernize and better adapt the plan to market conditions. The main consequence of the revision is that the defined benefit BTP plan has been replaced with a defined contribution pension and insurance plan. In the long term, this change will lead to predictable and lower costs for the included companies as well as the same or better insurance coverage and pension earnings for the employees. For the Parent Company the effect of not having
0
2,000
4,000
6,000
8,000
SEK m.
INVESTOR Q2 2015 – 14
any formal obligation regarding the defined benefit plan, BTP, is recognized in operating income under Operating costs. The effect in the Parent Company amounts to SEK 55 m. In the Group’s consolidated income statement the effect is recognized under Management costs and amounts to SEK 66 m.
Other
Acquisitions (business combinations)
On February 24, 2015, Aleris signed an agreement to acquire the healthcare provider, Teres Medical Group. The acquisition enables Aleris to strengthen its position as the leading private healthcare provider in Scandinavia. Teres has 17 surgical clinics and private hospitals in Norway, Denmark and Sweden. Through the acquisition, Aleris adds experience, competence and a broader range of high quality within different surgical services in Scandinavia. The transaction is subject to approval from competition authorities.
Permobil’s acquisition of ROHO
On April 27, 2015, Permobil acquired The ROHO Group, Inc., the global leader in skin protection and positioning solutions for wheelchair users, based in Belleville, Illinois, U.S. The acquisition marks the next important step in Permobil’s strategy to become a leading healthcare company, providing innovative advanced rehabilitation solutions for people with disabilities. The consideration amounted to SEK 1,012 m.
In the preliminary purchase price allocation, goodwill amounts to SEK 614 m. The goodwill recognized for the acquisition corresponds to the combined company’s opportunities for synergies. The goodwill recognized is not expected to be deductible for income tax purposes.
Identifiable assets acquired and liabilities assumed (SEK m.)
ROHO Group
SEK m. Preliminary Purchase Price
Allocation
Intangible assets 272
Property, plant and equipment 132
Inventory 95
Accounts receivables 39
Cash and cash equivalents 9
Deferred tax liabilities -110
Current liabilities -39
Net identifiable assets and liabilities 398
Consolidated goodwill 614
Consideration 1 012
Transaction related costs amounted to SEK 17 m. and derive from external legal fees and due diligence expenses. The costs have been included in the item Administrative, research and development and other operating cost in the Group’s consolidated income statement.
For the two month period from the acquisition date until June 30, ROHO contributed with net sales of SEK 74 m. and profit of SEK 10 m. to the Group’s result. If the acquisition had occurred on January 1, 2015, management estimates that consolidated net sales for the Investor Group would have increased by SEK 121 m. and consolidated profit for the period would have increased by SEK 4 m.
Pledged assets and contingent liabilities
Pledged assets have decreased by approximately SEK 3.0 bn. during the year, mainly due to the refinancing of Permobil. Total pledged assets amounts to SEK 1.1 bn.
No material changes in contingent liabilities during the period.
Risks and Risk management
The main risks that the Group and the Parent Company are exposed to are primarily related to the value changes of the listed assets due to market price fluctuations. The strained economic situation in Greece and the volatility in the Chinese stock markets currently increase uncertainty. The development of the global economy is an important uncertainty factor in assessment of near-term market fluctuations. The development of the financial markets also affects the various unlisted holdings’ businesses and opportunities for new investments and divestments.
Investor and its subsidiaries are exposed to commercial risks, financial risks and market risks. In addition, the subsidiaries, through their business activities within respective sector, also are exposed to legal/regulatory risks and political risks, for example political decisions on healthcare budgets and industry regulations.
Whatever the economic situation in the world, operational risk management requires a continued high level of awareness and focused work in line with stated policies and instructions.
Investor’s risk management, risks and uncertainties are described in detail in the Annual Report, (Administration report and Note 3). No significant changes have been assessed subsequently, aside from changes in current macro economy and thereto related risks.
Accounting policies
For the Group, this interim report was prepared in accordance with IAS 34 Interim Financial Reporting and applicable regulations in the Swedish Annual Accounts Act, and for the Parent Company in accordance with Sweden’s Annual Accounts Act, chapter 9 Interim report. Unless otherwise specified below, the accounting policies that have been applied for the Group and Parent Company are in agreement with the accounting policies used in the preparation of the company’s most recent annual report.
New and changed accounting policies in 2015
New or revised IFRSs and interpretations from the IFRS Interpretations Committee have had no effect on the profit/loss, financial position or disclosures for the Group or Parent Company.
Presentation of new structure
As of the second quarter 2015, Investor’s presentation of operating segments has been changed. The change is due to a new internal structure for management and reporting. Previously the operations were divided into the two business areas Core Investments and Financial Investments, which had different investment strategies and goals. In the new structure, the operations are divided into the three business areas Listed Core Investments, EQT and Patricia Industries. The business area Listed Core Investments consists of the listed core holdings and the business area EQT of the holdings in EQT. The business area Patricia Industries
INVESTOR Q2 2015 – 15
includes the wholly-owned subsidiaries, the former IGC portfolio and all other financial investments, except EQT and Investor’s trading portfolio. Comparative figures have been adjusted correspondingly.
In connection to the new presentation of operating segments, the definition of management costs have been changed. Historically only the general costs for the investment organization in Sweden have been classified as management cost. The corresponding costs for the operations within IGC was reported as Administrative, research and development and other operating costs. From the second quarter 2015, the general costs for the investment organization within former IGC are included in the management costs. Comparative figures have been adjusted correspondingly.
Financial calendar
Oct. 23, 2015 Interim Management Statement January-September 2015
Jan. 28, 2016 Year-end Report
April 21, 2016 Interim Management Statement January-March 2016
July 19, 2016 Interim Report January-June 2016
For more information:
Helena Saxon, Chief Financial Officer: +46 8 614 2000 [email protected]
Stefan Stern, Head of Corporate Relations and Communications: +46 8 614 2058 +46 70 636 7417 [email protected]
Magnus Dalhammar, Head of Investor Relations: +46 8 614 2130, +46 73 524 2130 [email protected]
Address:
Investor AB (publ) (CIN 556013-8298) SE-103 32 Stockholm, Sweden Visiting address: Arsenalsgatan 8C Phone: +46 8 614 2000 Fax: + 46 8 614 2150 www.investorab.com
Ticker codes:
INVEB SS in Bloomberg INVEb.ST in Reuters INVE B in NASDAQ
The information in this Interim Report is such that Investor is required to disclose under Sweden’s Securities Market Act.
The Interim Report was released for publication at 07:00 CET on July 16, 2015.
This Interim Report and additional information is available on www.investorab.com

INVESTOR Q2 2014 – 16
The Board of Directors declares that the six-month Interim Report provides a true and fair overview of the Parent Company’s and Group’s operations, their financial position and performance, and describes material risks and uncertainties facing the Parent Company and other companies in the Group.
Stockholm, July 16, 2015
Jacob Wallenberg Chairman
Josef Ackermann Gunnar Brock Sara Öhrvall Director Director Director
Magdalena Gerger Tom Johnstone Grace Reksten Skaugen Director Director Director Marcus Wallenberg Hans Stråberg Lena Treschow Torell Vice Chairman Director Director
Johan Forssell President and Chief Executive Officer Director
INVESTOR Q2 2015 – 17
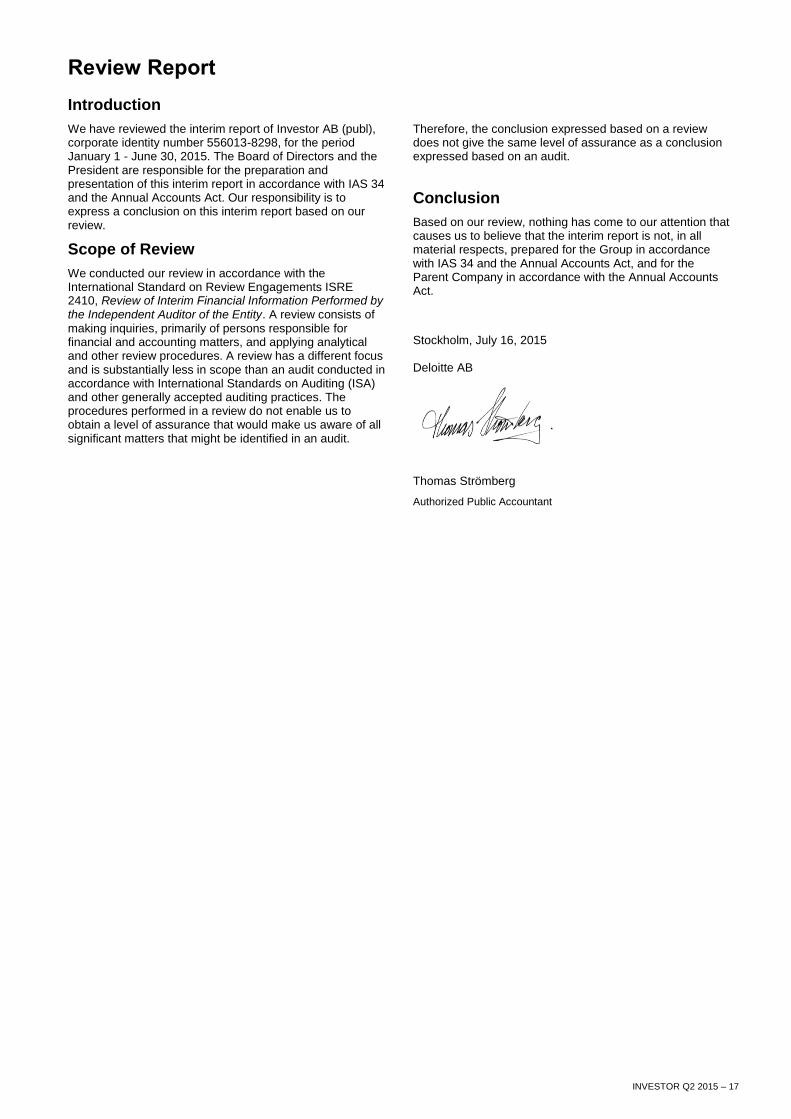
Review Report
Introduction
We have reviewed the interim report of Investor AB (publ), corporate identity number 556013-8298, for the period January 1 - June 30, 2015. The Board of Directors and the President are responsible for the preparation and presentation of this interim report in accordance with IAS 34 and the Annual Accounts Act. Our responsibility is to express a conclusion on this interim report based on our review.
Scope of Review
We conducted our review in accordance with the International Standard on Review Engagements ISRE 2410, Review of Interim Financial Information Performed by the Independent Auditor of the Entity. A review consists of making inquiries, primarily of persons responsible for financial and accounting matters, and applying analytical and other review procedures. A review has a different focus and is substantially less in scope than an audit conducted in accordance with International Standards on Auditing (ISA) and other generally accepted auditing practices. The procedures performed in a review do not enable us to obtain a level of assurance that would make us aware of all significant matters that might be identified in an audit.
Therefore, the conclusion expressed based on a review does not give the same level of assurance as a conclusion expressed based on an audit.
Conclusion
Based on our review, nothing has come to our attention that causes us to believe that the interim report is not, in all material respects, prepared for the Group in accordance with IAS 34 and the Annual Accounts Act, and for the Parent Company in accordance with the Annual Accounts Act.
Stockholm, July 16, 2015 Deloitte AB
Thomas Strömberg
Authorized Public Accountant
INVESTOR Q2 2015 – 18
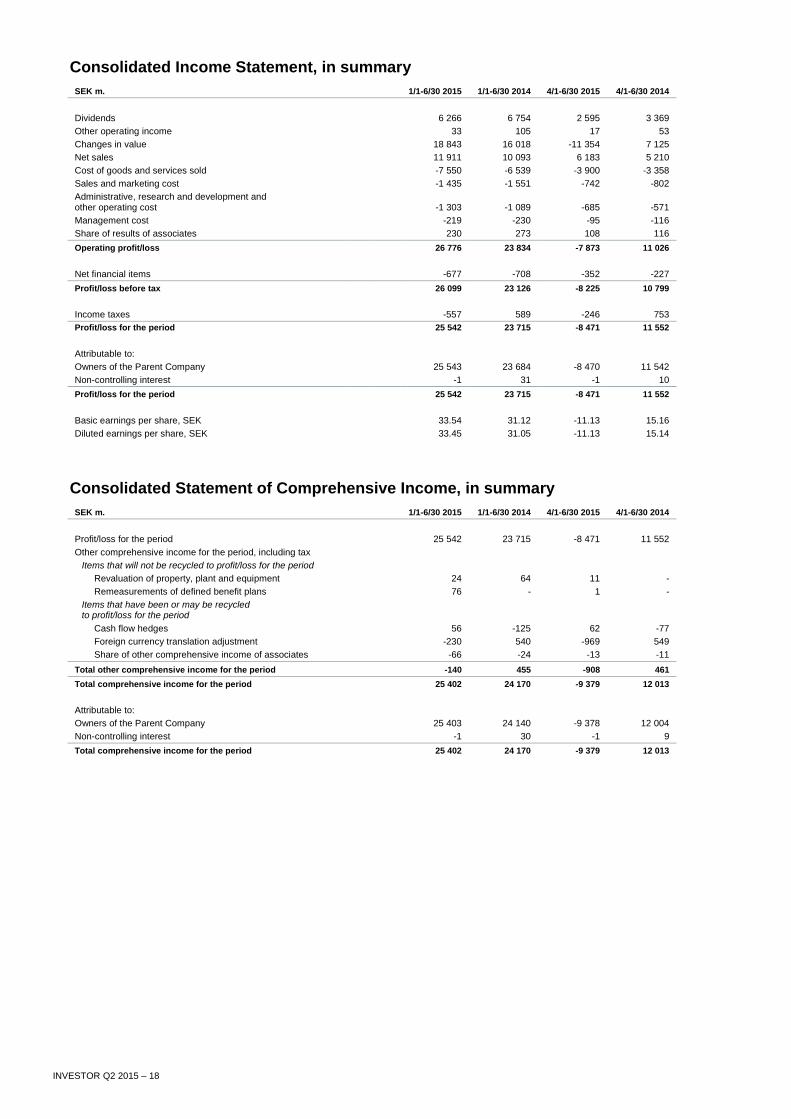
Consolidated Income Statement, in summary
SEK m. 1/1-6/30 2015 1/1-6/30 2014 4/1-6/30 2015 4/1-6/30 2014
Dividends 6 266 6 754 2 595 3 369
Other operating income 33 105 17 53
Changes in value 18 843 16 018 -11 354 7 125
Net sales 11 911 10 093 6 183 5 210
Cost of goods and services sold -7 550 -6 539 -3 900 -3 358
Sales and marketing cost -1 435 -1 551 -742 -802
Administrative, research and development and other operating cost -1 303 -1 089 -685 -571
Management cost -219 -230 -95 -116
Share of results of associates 230 273 108 116
Operating profit/loss 26 776 23 834 -7 873 11 026
Net financial items -677 -708 -352 -227
Profit/loss before tax 26 099 23 126 -8 225 10 799
Income taxes -557 589 -246 753
Profit/loss for the period 25 542 23 715 -8 471 11 552
Attributable to:
Owners of the Parent Company 25 543 23 684 -8 470 11 542
Non-controlling interest -1 31 -1 10
Profit/loss for the period 25 542 23 715 -8 471 11 552
Basic earnings per share, SEK 33.54 31.12 -11.13 15.16
Diluted earnings per share, SEK 33.45 31.05 -11.13 15.14
Consolidated Statement of Comprehensive Income, in summary
SEK m. 1/1-6/30 2015 1/1-6/30 2014 4/1-6/30 2015 4/1-6/30 2014
Profit/loss for the period 25 542 23 715 -8 471 11 552
Other comprehensive income for the period, including tax
Items that will not be recycled to profit/loss for the period
Revaluation of property, plant and equipment 24 64 11 -
Remeasurements of defined benefit plans 76 - 1 -
Items that have been or may be recycled to profit/loss for the period
Cash flow hedges 56 -125 62 -77
Foreign currency translation adjustment -230 540 -969 549
Share of other comprehensive income of associates -66 -24 -13 -11
Total other comprehensive income for the period -140 455 -908 461
Total comprehensive income for the period 25 402 24 170 -9 379 12 013
Attributable to:
Owners of the Parent Company 25 403 24 140 -9 378 12 004
Non-controlling interest -1 30 -1 9
Total comprehensive income for the period 25 402 24 170 -9 379 12 013
INVESTOR Q2 2015 – 19
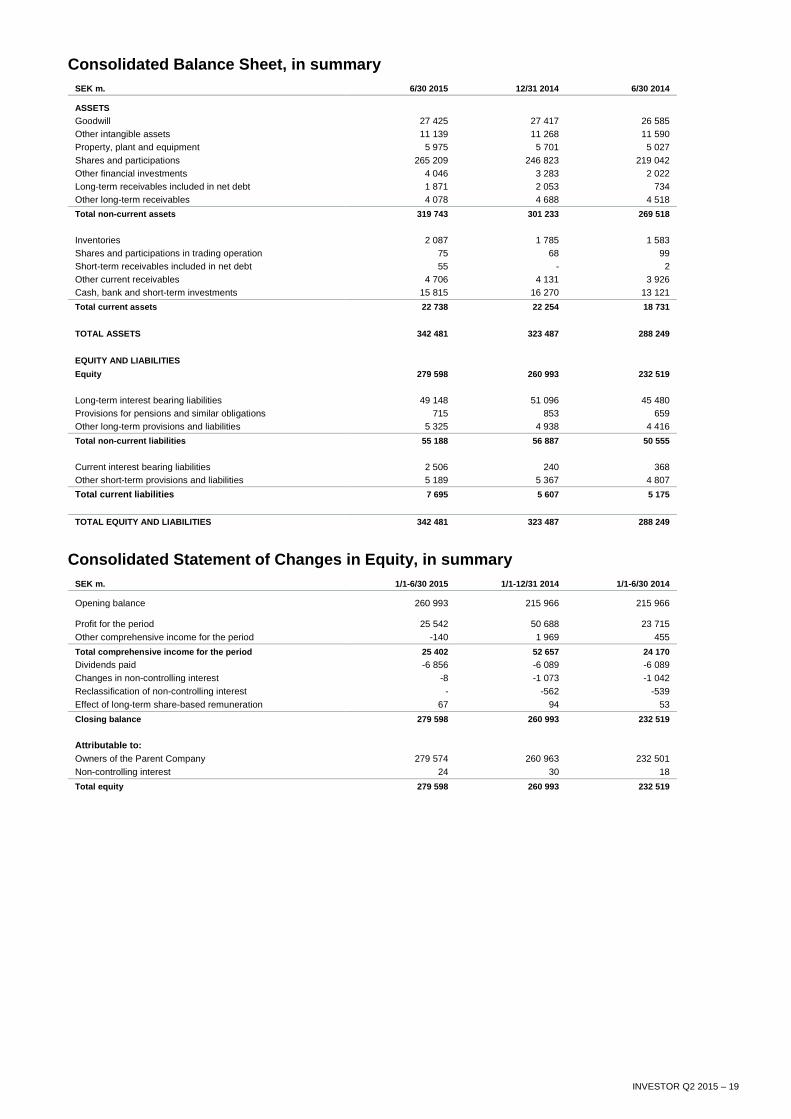
Consolidated Balance Sheet, in summary
SEK m. 6/30 2015 12/31 2014 6/30 2014
ASSETS
Goodwill 27 425 27 417 26 585
Other intangible assets 11 139 11 268 11 590
Property, plant and equipment 5 975 5 701 5 027
Shares and participations 265 209 246 823 219 042
Other financial investments 4 046 3 283 2 022
Long-term receivables included in net debt 1 871 2 053 734
Other long-term receivables 4 078 4 688 4 518
Total non-current assets 319 743 301 233 269 518
Inventories 2 087 1 785 1 583
Shares and participations in trading operation 75 68 99
Short-term receivables included in net debt 55 - 2
Other current receivables 4 706 4 131 3 926
Cash, bank and short-term investments 15 815 16 270 13 121
Total current assets 22 738 22 254 18 731
TOTAL ASSETS 342 481 323 487 288 249
EQUITY AND LIABILITIES
Equity 279 598 260 993 232 519
Long-term interest bearing liabilities 49 148 51 096 45 480
Provisions for pensions and similar obligations 715 853 659
Other long-term provisions and liabilities 5 325 4 938 4 416
Total non-current liabilities 55 188 56 887 50 555
Current interest bearing liabilities 2 506 240 368
Other short-term provisions and liabilities 5 189 5 367 4 807
Total current liabilities 7 695 5 607 5 175
TOTAL EQUITY AND LIABILITIES 342 481 323 487 288 249
Consolidated Statement of Changes in Equity, in summary
SEK m. 1/1-6/30 2015 1/1-12/31 2014 1/1-6/30 2014
Opening balance 260 993 215 966 215 966
Profit for the period 25 542 50 688 23 715
Other comprehensive income for the period -140 1 969 455
Total comprehensive income for the period 25 402 52 657 24 170
Dividends paid -6 856 -6 089 -6 089
Changes in non-controlling interest -8 -1 073 -1 042
Reclassification of non-controlling interest - -562 -539
Effect of long-term share-based remuneration 67 94 53
Closing balance 279 598 260 993 232 519
Attributable to:
Owners of the Parent Company 279 574 260 963 232 501
Non-controlling interest 24 30 18
Total equity 279 598 260 993 232 519
INVESTOR Q2 2015 – 20
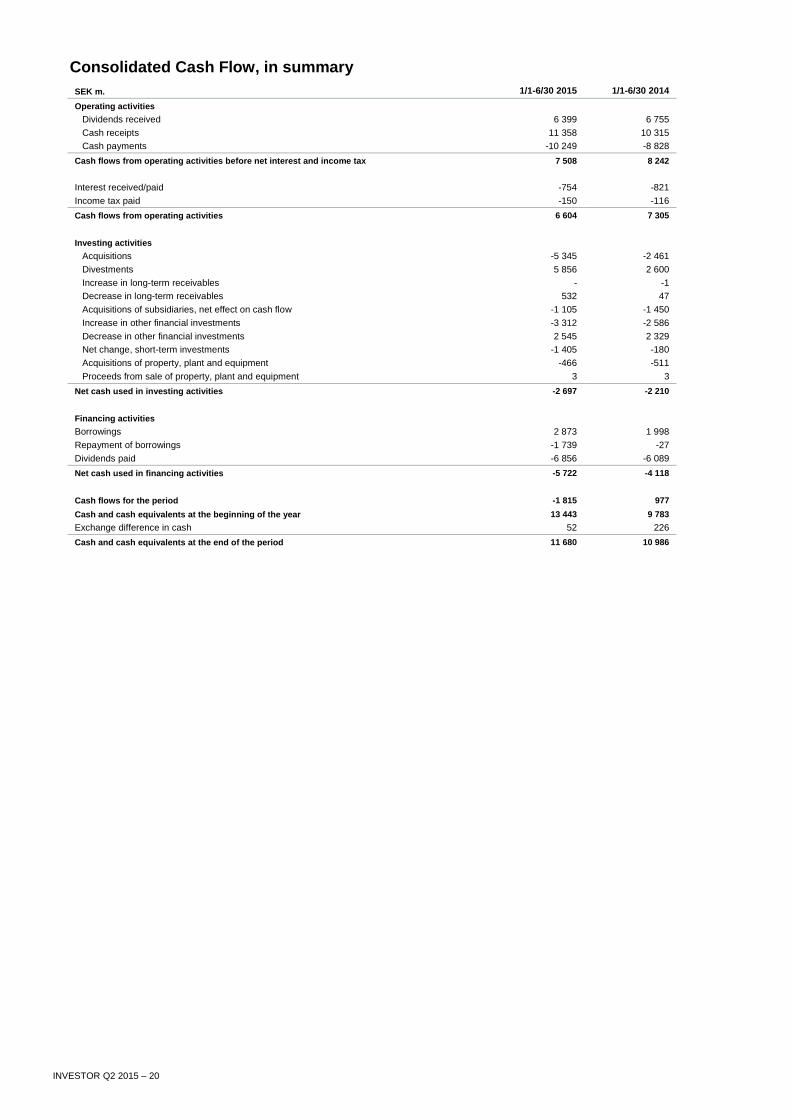
Consolidated Cash Flow, in summary
SEK m. 1/1-6/30 2015 1/1-6/30 2014
Operating activities
Dividends received 6 399 6 755
Cash receipts 11 358 10 315
Cash payments -10 249 -8 828
Cash flows from operating activities before net interest and income tax 7 508 8 242
Interest received/paid -754 -821
Income tax paid -150 -116
Cash flows from operating activities 6 604 7 305
Investing activities
Acquisitions -5 345 -2 461
Divestments 5 856 2 600
Increase in long-term receivables - -1
Decrease in long-term receivables 532 47
Acquisitions of subsidiaries, net effect on cash flow -1 105 -1 450
Increase in other financial investments -3 312 -2 586
Decrease in other financial investments 2 545 2 329
Net change, short-term investments -1 405 -180
Acquisitions of property, plant and equipment -466 -511
Proceeds from sale of property, plant and equipment 3 3
Net cash used in investing activities -2 697 -2 210
Financing activities
Borrowings 2 873 1 998
Repayment of borrowings -1 739 -27
Dividends paid -6 856 -6 089
Net cash used in financing activities -5 722 -4 118
Cash flows for the period -1 815 977
Cash and cash equivalents at the beginning of the year 13 443 9 783
Exchange difference in cash 52 226
Cash and cash equivalents at the end of the period 11 680 10 986
INVESTOR Q2 2015 – 21
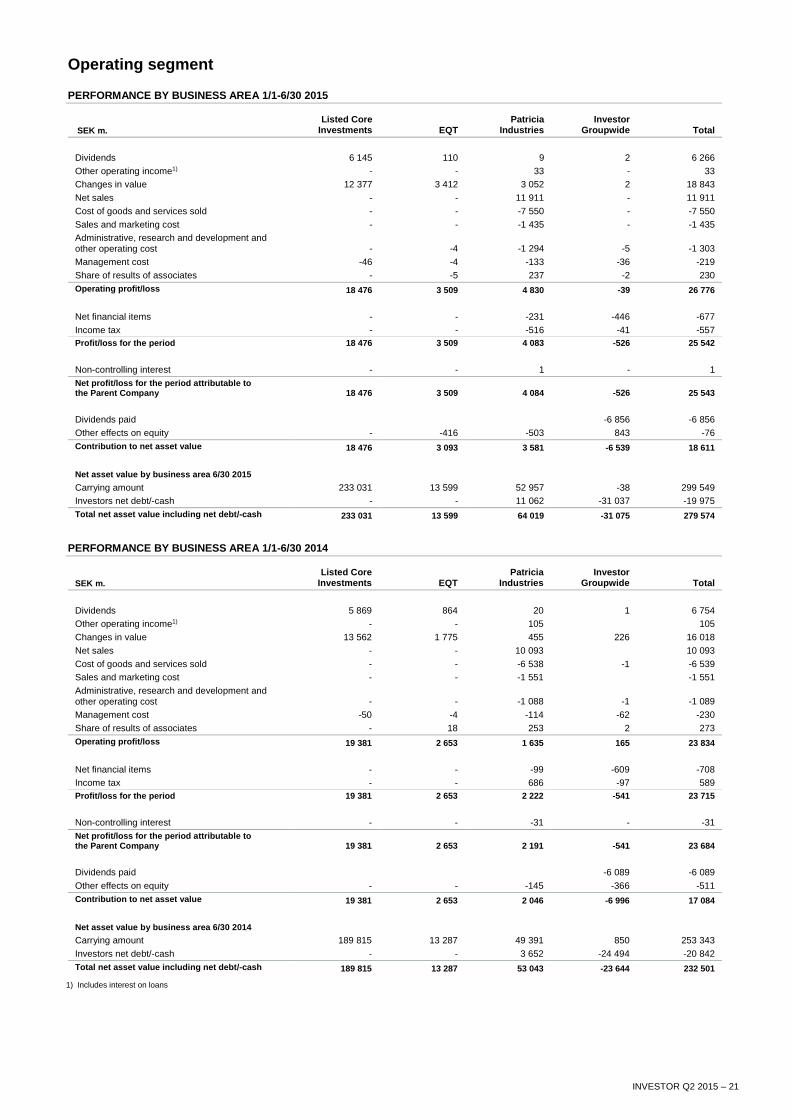
Operating segment
PERFORMANCE BY BUSINESS AREA 1/1-6/30 2015
SEK m.
Listed Core Investments EQT
Patricia Industries
Investor Groupwide Total
Dividends 6 145 110 9 2 6 266
Other operating income1) - - 33 - 33
Changes in value 12 377 3 412 3 052 2 18 843
Net sales - - 11 911 - 11 911
Cost of goods and services sold - - -7 550 - -7 550
Sales and marketing cost - - -1 435 - -1 435
Administrative, research and development and other operating cost - -4 -1 294 -5 -1 303
Management cost -46 -4 -133 -36 -219
Share of results of associates - -5 237 -2 230
Operating profit/loss 18 476 3 509 4 830 -39 26 776
Net financial items - - -231 -446 -677
Income tax - - -516 -41 -557
Profit/loss for the period 18 476 3 509 4 083 -526 25 542
Non-controlling interest - - 1 - 1
Net profit/loss for the period attributable to the Parent Company 18 476 3 509 4 084 -526 25 543
Dividends paid -6 856 -6 856
Other effects on equity - -416 -503 843 -76
Contribution to net asset value 18 476 3 093 3 581 -6 539 18 611
Net asset value by business area 6/30 2015
Carrying amount 233 031 13 599 52 957 -38 299 549
Investors net debt/-cash - - 11 062 -31 037 -19 975
Total net asset value including net debt/-cash 233 031 13 599 64 019 -31 075 279 574
PERFORMANCE BY BUSINESS AREA 1/1-6/30 2014
SEK m.
Listed Core Investments EQT
Patricia Industries
Investor Groupwide Total
Dividends 5 869 864 20 1 6 754
Other operating income1) - - 105 105
Changes in value 13 562 1 775 455 226 16 018
Net sales - - 10 093 10 093
Cost of goods and services sold - - -6 538 -1 -6 539
Sales and marketing cost - - -1 551 -1 551
Administrative, research and development and other operating cost - - -1 088 -1 -1 089
Management cost -50 -4 -114 -62 -230
Share of results of associates - 18 253 2 273
Operating profit/loss 19 381 2 653 1 635 165 23 834
Net financial items - - -99 -609 -708
Income tax - - 686 -97 589
Profit/loss for the period 19 381 2 653 2 222 -541 23 715
Non-controlling interest - - -31 - -31
Net profit/loss for the period attributable to the Parent Company 19 381 2 653 2 191 -541 23 684
Dividends paid -6 089 -6 089
Other effects on equity - - -145 -366 -511
Contribution to net asset value 19 381 2 653 2 046 -6 996 17 084
Net asset value by business area 6/30 2014
Carrying amount 189 815 13 287 49 391 850 253 343
Investors net debt/-cash - - 3 652 -24 494 -20 842
Total net asset value including net debt/-cash 189 815 13 287 53 043 -23 644 232 501
1) Includes interest on loans
INVESTOR Q2 2015 – 22
Parent Company Income Statement, in summary
SEK m. 1/1-6/30 2015 1/1-6/30 2014 4/1-6/30 2015 4/1-6/30 2014
Dividends 5 725 5 713 2 441 2 937
Changes in value 10 179 13 302 -12 141 6 241
Net sales 6 6 3 2
Operating cost -1491) -181 -521) -90
Result from participations in Group companies 4 083 - 4 083 -
Operating profit/loss 19 844 18 840 -5 666 9 090
Profit/loss from financial items
Net financial items -20 10 -62 152
Profit/loss after financial items 19 824 18 850 -5 728 9 242
Income tax - - - -
Profit/loss for the period 19 824 18 850 -5 728 9 242
1) Includes the effect of change in pension benefits/-plans. See page 13 for more information
Parent Company Balance Sheet, in summary
SEK m. 6/30 2015 12/31 2014 6/30 2014
ASSETS
Intangible assets and Property, plant and equipment 18 22 25
Financial assets 301 601 292 542 264 467
Total non-current assets 301 619 292 564 264 492
Current receivables 3 249 744 1 189
Cash and cash equivalents 0 0 0
Total current assets 3 249 744 1 189
TOTAL ASSETS 304 868 293 308 265 681
EQUITY AND LIABILITIES
Equity 239 882 226 768 203 758
Provisions 265 355 255
Non-current liabilities 45 305 35 752 31 305
Total non-current liabilities 45 570 36 107 31 560
Total current liabilities 19 416 30 433 30 363
TOTAL EQUITY AND LIABILITIES 304 868 293 308 265 681
ASSETS PLEDGED AND CONTINGENT LIABILITIES 6/30 2015 12/31 2014 6/30 2014
Assets pledged 45 71 130
Contingent liabilities 715 700 9 727
INVESTOR Q2 2015 – 23
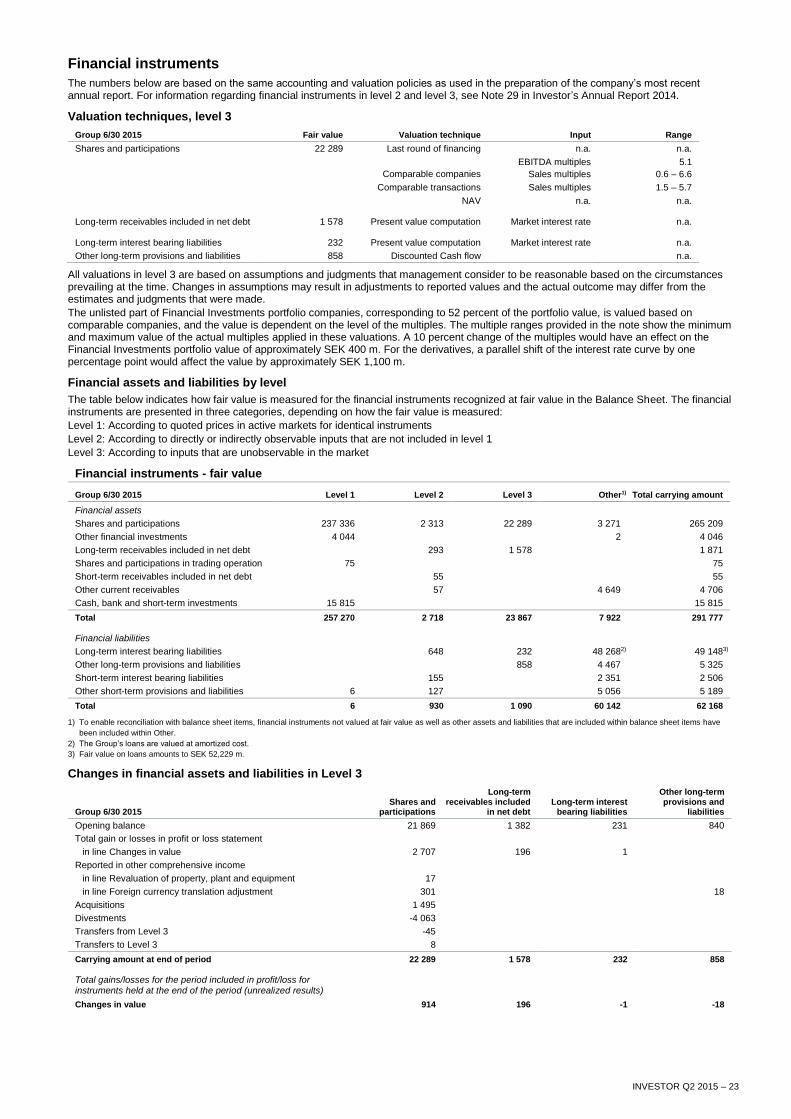
Financial instruments
The numbers below are based on the same accounting and valuation policies as used in the preparation of the company’s most recent annual report. For information regarding financial instruments in level 2 and level 3, see Note 29 in Investor’s Annual Report 2014.
Valuation techniques, level 3
Group 6/30 2015 Fair value Valuation technique Input Range
Shares and participations 22 289 Last round of financing n.a. n.a.
Comparable companies
EBITDA multiples
Sales multiples
5.1
0.6 – 6.6
Comparable transactions Sales multiples 1.5 – 5.7
NAV n.a. n.a.
Long-term receivables included in net debt 1 578 Present value computation Market interest rate n.a.
Long-term interest bearing liabilities 232 Present value computation Market interest rate n.a.
Other long-term provisions and liabilities 858 Discounted Cash flow n.a.
All valuations in level 3 are based on assumptions and judgments that management consider to be reasonable based on the circumstances prevailing at the time. Changes in assumptions may result in adjustments to reported values and the actual outcome may differ from the estimates and judgments that were made.
The unlisted part of Financial Investments portfolio companies, corresponding to 52 percent of the portfolio value, is valued based on comparable companies, and the value is dependent on the level of the multiples. The multiple ranges provided in the note show the minimum and maximum value of the actual multiples applied in these valuations. A 10 percent change of the multiples would have an effect on the Financial Investments portfolio value of approximately SEK 400 m. For the derivatives, a parallel shift of the interest rate curve by one percentage point would affect the value by approximately SEK 1,100 m.
Financial assets and liabilities by level
The table below indicates how fair value is measured for the financial instruments recognized at fair value in the Balance Sheet. The financial instruments are presented in three categories, depending on how the fair value is measured:
Level 1: According to quoted prices in active markets for identical instruments
Level 2: According to directly or indirectly observable inputs that are not included in level 1
Level 3: According to inputs that are unobservable in the market
Financial instruments - fair value
Group 6/30 2015 Level 1 Level 2 Level 3 Other1) Total carrying amount
Financial assets
Shares and participations 237 336 2 313 22 289 3 271 265 209
Other financial investments 4 044 2 4 046
Long-term receivables included in net debt 293 1 578 1 871
Shares and participations in trading operation 75 75
Short-term receivables included in net debt 55 55
Other current receivables 57 4 649 4 706
Cash, bank and short-term investments 15 815 15 815
Total 257 270 2 718 23 867 7 922 291 777
Financial liabilities
Long-term interest bearing liabilities 648 232 48 2682) 49 1483)
Other long-term provisions and liabilities 858 4 467 5 325
Short-term interest bearing liabilities 155 2 351 2 506
Other short-term provisions and liabilities 6 127 5 056 5 189
Total 6 930 1 090 60 142 62 168
1) To enable reconciliation with balance sheet items, financial instruments not valued at fair value as well as other assets and liabilities that are included within balance sheet items have
been included within Other.
2) The Group’s loans are valued at amortized cost.
3) Fair value on loans amounts to SEK 52,229 m.
Changes in financial assets and liabilities in Level 3
Group 6/30 2015 Shares and
participations
Long-term receivables included
in net debt Long-term interest
bearing liabilities
Other long-term provisions and
liabilities
Opening balance 21 869 1 382 231 840
Total gain or losses in profit or loss statement
in line Changes in value 2 707 196 1
Reported in other comprehensive income
in line Revaluation of property, plant and equipment 17
in line Foreign currency translation adjustment 301 18
Acquisitions 1 495
Divestments -4 063
Transfers from Level 3 -45
Transfers to Level 3 8
Carrying amount at end of period 22 289 1 578 232 858
Total gains/losses for the period included in profit/loss for instruments held at the end of the period (unrealized results)
Changes in value 914 196 -1 -18