Embed Size (px)
Citation preview

9M 2015
INTERIM REPORT JANUARY–SEPTEMBER
2
Contents
GENERAL
Business Developments – Overview 3 Beiersdorf’s Shares 4
INTERIM MANAGEMENT REPORT – GROUP
Results of Operations – Group 5 Results of Operations – Business Segments 6 Net Assets – Group 9 Financial Position – Group 10 Employees 11 Opportunities and Risks 11 Outlook for 2015 12
INTERIM CONSOLIDATED FINANCIAL STATEMENTS
Income Statement 14 Statement of Comprehensive Income 15 Balance Sheet 16 Cash Flow Statement 17 Statement of Changes in Equity 18 Segment Reporting 19 Selected Explanatory Notes 20

Beiersdorf Interim Report January–September 2015 / Interim Management Report – Group / Business Developments – Overview 3
Business Developments – Overview
Beiersdorf continues on its successful path
○ Group sales grow by 2.7% ○ Consumer sales up 3.2% on previous year ○ tesa grows by 0.3% ○ Group EBIT margin increases to 14.9%
Outlook for fiscal year 2015
○ Consumer sales growth of 3-4% ○ Significant improvement in Consumer EBIT margin on previous
year ○ tesa sales at last year’s level ○ tesa EBIT margin similar to the prior-year level
Beiersdorf at a Glance
Jan. 1–Sep. 30, 2014 Jan. 1–Sep. 30, 2015
Group sales (in € million) 4,716 5,035
Change (organic) (in %) 4.3 2.7
Change (nominal) (in %) 0.9 6.8
Consumer sales (in € million) 3,905 4,172
Change (organic) (in %) 4.2 3.2
Change (nominal) (in %) 0.6 6.8
tesa sales (in € million) 811 863
Change (organic) (in %) 4.3 0.3
Change (nominal) (in %) 2.5 6.5
Operating result (EBIT, excluding special factors) (in € million) 671 750
Operating result (EBIT) (in € million) 608 750
Profit after tax (in € million) 423 514
Return on sales after tax (in %) 9.0 10.2
Earnings per share (in €) 1.84 2.24
Gross cash flow (in € million) 485 615
Capital expenditure (in € million) 198 191
Research and development expenses (in € million) 125 137
Employees (as of Sep. 30) 17,293 17,881
Percentage changes are calculated based on thousands of euros.
GROUP SALES (IN € MILLION) PROFIT AFTER TAX (IN € MILLION)
5,035 514
2015 2015
6,285 581
2014 2014
4,716 423
2014 2014
Jan. 1–Sep. 30�� Full year Jan. 1–Sep. 30�� Full year
SALES GROWTHIN % 4.3 4.7 2.7
RETURN ON SALESAFTER TAX IN % 9.0 9.2 10.2
Beiersdorf Interim Report January–September 2015 / Contents Beiersdorf Interim Report January–September 2014 / General / Business Developments – Overview

4
Beiersdorf’s Shares Following the agreement of a third bailout package for Greece, the possibility of an economic downturn in China unsettled investors. The sharpest slump in Chinese stocks since the financial crisis led to considerable turbulence on global equity markets. Slower growth in the emerging economies also put downward pressure on commodities, causing copper and oil prices to fall to their lowest level in several years. In view of the economic uncertainty, the US Federal Reserve decided to postpone its expected key interest rate hike. Germany’s benchmark index, the DAX, saw fluctuations of more than 20% during the period and shed all its gains for the year. Downward pressure on the DAX came from shares of energy suppliers and carmakers, whose prices fell sharply during the reporting period in some cases.
The half-year results presented by Beiersdorf AG on August 5 were received positively by analysts, particularly the operating result and the strong sales performance in important emerging markets such as Russia and Brazil. Confirmation of the outlook for the Consumer Business Segment also raised expectations that business would accelerate further towards year-end. As a result, Beiersdorf’s shares continued the positive trend seen throughout the year, despite a negative market environment, and outperformed competitors in the Household and Personal Care sector.
Beiersdorf’s shares closed the third quarter at €79.17.
KEY FIGURES – SHARES
2014 2015
Earnings per share as of Sep. 30 (in €) 1.84 2.24
Market capitalization as of Sep. 30 (in € million) 16,667 19,951
Closing price as of Sep. 30 (in €) 66.14 79.17
High for the period Jan. 1–Sep. 30 (in €) 76.93 83.90
Low for the period Jan. 1–Sep. 30 (in €) 64.50 66.01
€79.17September 30, 2015
Closing price
June 30 July 7 July 14 July 21 July 28 Aug. 4 Aug. 11 Aug. 18 Aug. 25 Sep. 1 Sep. 8 Sep. 15 Sep. 22 Sep. 30
BEIERSDORF’S SHARE PRICE PERFORMANCEJuly 1–September 30, 2015�/�relative change in % Beiersdorf� � DAX
110
115
105
100
95
90
85

Beiersdorf Interim Report January–September 2015 / Interim Management Report – Group / Results of Operations – Group 5
Interim Management Report – Group Results of Operations – Group
○ Group sales rise 2.7% ○ EBIT margin increases to 14.9% ○ Profit after tax increases to €514 million
Organic Group sales in the first nine months of 2015 were up 2.7% on the prior year. Exchange rate effects increased this figure by 4.3 percentage points. Structural changes reduced growth by 0.2 percentage points. As a result, nominal Group sales climbed 6.8% from the prior-year figure of €4,716 million, to €5,035 million. The Consumer Business Segment recorded organic growth of 3.2%, while tesa grew organically by 0.3%.
In Europe, sales were up 1.0% on the prior year. In nominal terms, sales amounted to €2,640 million (previous year: €2,625 million), 0.6% higher than the prior-year figure.
Growth in the Americas region amounted to 9.3%. In nominal terms, sales increased by 14.8% to €917 million (previous year: €799 million).
The Africa/Asia/Australia region reported growth of 1.8%. A nominal increase of 14.4% to €1,478 million was achieved (previous year: €1,292 million).
INCOME STATEMENT (IN € MILLION)
Jan. 1–Sep. 30, 2014 Jan. 1–Sep. 30, 2015 Change in %
Sales 4,716 5,035 6.8
Cost of goods sold* –1,964 –2,065 5.2
Gross profit* 2,752 2,970 7.9
Marketing and selling expenses* –1,713 –1,807 5.5
Research and development expenses –125 –137 9.2
General and administrative expenses –246 –260 5.8
Other operating result 3 –16 –
Operating result (EBIT, excluding special factors) 671 750 11.9
Special factors –63 – –
Operating result (EBIT) 608 750 23.4
Financial result 9 –10 –
Profit before tax 617 740 19.7
Income taxes –194 –226 16.2
Profit after tax 423 514 21.4
Basic/diluted earnings per share (in €) 1.84 2.24 21.4 * Change in presentation (cf. p. 20, Selected Explanatory Notes).
The operating result (EBIT, excluding special factors) increased to €750 million (previous year: €671 million). Excluding special factors, the EBIT margin was 14.9% (previous year: 14.2%).
The Beiersdorf Group’s results of operations are determined on the basis of the operating result (EBIT) excluding special factors. This figure is not part of IFRSs and should be treated merely as voluntary additional information.
No special factors required recognition in the first nine months of 2015. Special factors of €–63 million in the previous year primarily related to the write-down of our Chinese hair care brands in the Consumer Business Segment.
Beiersdorf Interim Report January–September 2015 / General / Beiersdorf’s Shares Beiersdorf Interim Report January–September 2014 / Interim Management Report – Group / Results of Operations – Group
6
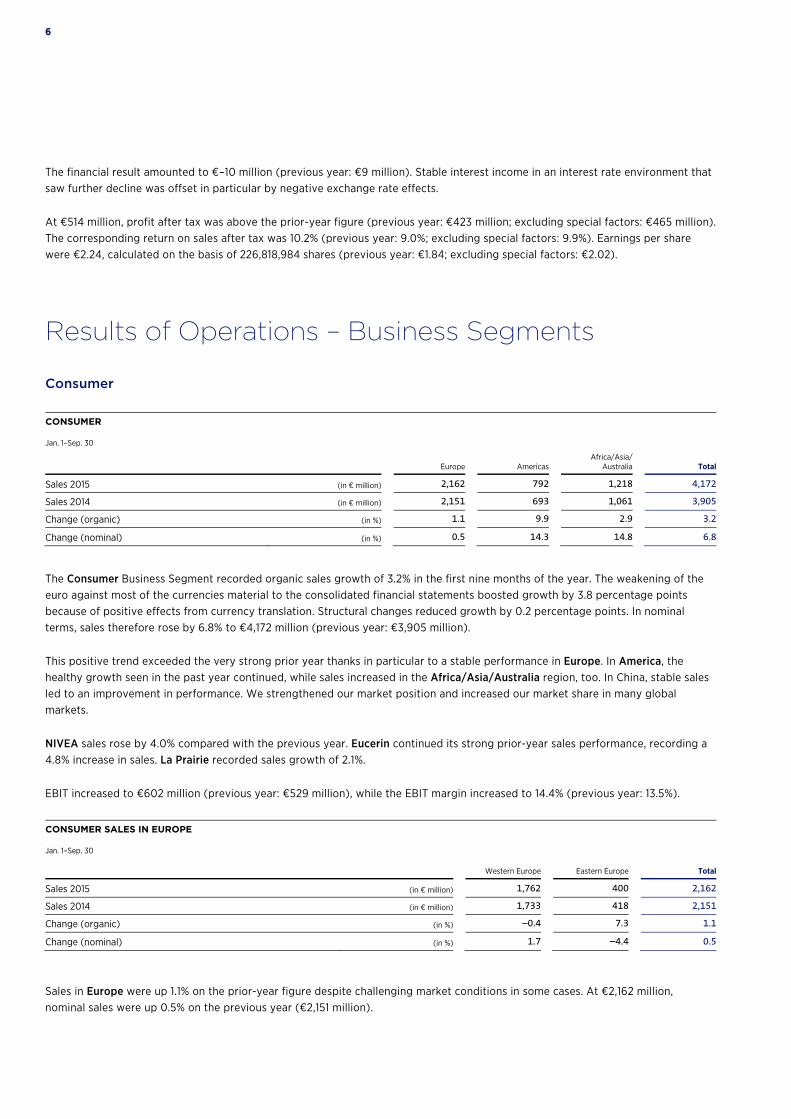
The financial result amounted to €–10 million (previous year: €9 million). Stable interest income in an interest rate environment that saw further decline was offset in particular by negative exchange rate effects.
At €514 million, profit after tax was above the prior-year figure (previous year: €423 million; excluding special factors: €465 million). The corresponding return on sales after tax was 10.2% (previous year: 9.0%; excluding special factors: 9.9%). Earnings per share were €2.24, calculated on the basis of 226,818,984 shares (previous year: €1.84; excluding special factors: €2.02).
Results of Operations – Business Segments
Consumer
CONSUMER
Jan. 1–Sep. 30
Europe Americas Africa/Asia/
Australia Total
Sales 2015 (in € million) 2,162 792 1,218 4,172
Sales 2014 (in € million) 2,151 693 1,061 3,905
Change (organic) (in %) 1.1 9.9 2.9 3.2
Change (nominal) (in %) 0.5 14.3 14.8 6.8
The Consumer Business Segment recorded organic sales growth of 3.2% in the first nine months of the year. The weakening of the euro against most of the currencies material to the consolidated financial statements boosted growth by 3.8 percentage points because of positive effects from currency translation. Structural changes reduced growth by 0.2 percentage points. In nominal terms, sales therefore rose by 6.8% to €4,172 million (previous year: €3,905 million).
This positive trend exceeded the very strong prior year thanks in particular to a stable performance in Europe. In America, the healthy growth seen in the past year continued, while sales increased in the Africa/Asia/Australia region, too. In China, stable sales led to an improvement in performance. We strengthened our market position and increased our market share in many global markets.
NIVEA sales rose by 4.0% compared with the previous year. Eucerin continued its strong prior-year sales performance, recording a 4.8% increase in sales. La Prairie recorded sales growth of 2.1%.
EBIT increased to €602 million (previous year: €529 million), while the EBIT margin increased to 14.4% (previous year: 13.5%).
CONSUMER SALES IN EUROPE
Jan. 1–Sep. 30 Western Europe Eastern Europe Total
Sales 2015 (in € million) 1,762 400 2,162
Sales 2014 (in € million) 1,733 418 2,151
Change (organic) (in %) –0.4 7.3 1.1
Change (nominal) (in %) 1.7 –4.4 0.5
Sales in Europe were up 1.1% on the prior-year figure despite challenging market conditions in some cases. At €2,162 million, nominal sales were up 0.5% on the previous year (€2,151 million).

Beiersdorf Interim Report January–September 2015 / Interim Management Report – Group / Results of Operations – Business Segments 7
Sales in Western Europe were down 0.4% on the prior-year figure. While strong sales growth was achieved in Germany, Spain, and the United Kingdom in particular, a number of other markets, including Italy and Switzerland, were unable to repeat their prior-year performance.
Sales in Eastern Europe were up 7.3% on the prior-year figure. Growth was mainly driven by the very healthy trend in Russia, which recorded a rise in both sales and market share. Sales also rose again in Poland.
CONSUMER SALES IN THE AMERICAS
Jan. 1–Sep. 30 North America Latin America Total
Sales 2015 (in € million) 308 484 792
Sales 2014 (in € million) 248 445 693
Change (organic) (in %) 4.5 13.0 9.9
Change (nominal) (in %) 24.5 8.6 14.3
Organic sales in the Americas region rose by 9.9%. At €792 million, nominal sales were up 14.3% on the previous year (€693 million), due to exchange rate changes for the US dollar and the key South American currencies.
Sales in North America were up 4.5% on the previous year.
Latin America saw sales growth of 13.0%, driven by excellent growth rates in Brazil and strong to very strong increases in other key markets. Only Venezuela saw significant negative performance.
CONSUMER SALES IN AFRICA/ASIA/AUSTRALIA
Jan. 1–Sep. 30 Total
Sales 2015 (in € million) 1,218
Sales 2014 (in € million) 1,061
Change (organic) (in %) 2.9
Change (nominal) (in %) 14.8
The Africa/Asia/Australia region recorded a 2.9% increase in organic sales. Nominal growth of 14.8% was achieved due to the positive performance of almost all currencies against the euro. Sales amounted to €1,218 million (previous year: €1,061 million).
Stabilizing sales in China and our continued excellent performance in Japan, India, South Africa, and Turkey were the basis for the improved sales performance. The complete loss of our warehouse in Australia following a storm in April had a slightly negative impact on growth rates in the region. Thanks to enormous efforts, however, the affiliate was again able to achieve the previous year’s level of sales.
Beiersdorf Interim Report January–September 2015 / Interim Management Report – Group / Results of Operations – Group Beiersdorf Interim Report January–September 2014 / Interim Management Report – Group / Results of Operations – Business Segments

8
tesa
tesa
Jan. 1–Sep. 30
Europe Americas Africa/Asia/
Australia Total
Sales 2015 (in € million) 478 125 260 863
Sales 2014 (in € million) 474 106 231 811
Change (organic) (in %) 0.8 5.5 –3.2 0.3
Change (nominal) (in %) 0.9 18.2 12.7 6.5
The tesa Business Segment recorded organic sales growth of 0.3% in the first nine months of 2015. Exchange rate effects increased this figure by 6.2 percentage points. In nominal terms, tesa’s sales therefore increased by 6.5% to €863 million (previous year: €811 million).
Sales were lifted by a strong performance in both the industrial business – particularly with customers in the automotive industry – and the consumer business.
EBIT in the tesa Business Segment increased to €148 million (previous year: €142 million), while the EBIT margin amounted to 17.2% (previous year: 17.5%).

Beiersdorf Interim Report January–September 2015 / Interim Management Report – Group / Net Assets – Group 9
Net Assets – Group
NET ASSETS (IN € MILLION) Assets Dec. 31, 2014 Sep. 30, 2014 Sep. 30, 2015
Non-current assets 2,340 2,129 2,624
Inventories 786 802 795
Other current assets 2,228 2,385 2,608
Cash and cash equivalents 976 993 745
Summe Aktiva 6,330 6,309 6,772
Equity and liabilities Dec. 31, 2014 Sep. 30, 2014 Sep. 30, 2015
Equity 3,640 3,577 4,025
Non-current provisions 700 655 645
Non-current liabilities 73 96 95
Current provisions 466 548 428
Current liabilities 1,451 1,433 1,579
Summe Passiva 6,330 6,309 6,772
Non-current assets increased by €284 million as against December 31, 2014, to €2,624 million. Long-term securities were reclassified to current assets due to shorter maturities and new purchases were made. Capital expenditure on property, plant, and equipment, and intangible assets amounted to €191 million (previous year: €198 million). Of this amount, €113 million was attributable to the Consumer Business Segment (previous year: €128 million) and €78 million to the tesa Business Segment (previous year: €70 million). The investments mainly related to Consumer facilities, tesa’s new headquarters, and tesa factories. Group depreciation, amortization, and impairment losses amounted to €90 million (previous year: €146 million). The prior-year figure includes impairment losses of €66 million on our Chinese hair care brands. Inventories rose by €9 million as against December 31, 2014, to €795 million. Other current assets increased by €380 million as against December 31, 2014, to €2,608 million. This item includes short-term securities of €858 million, an increase of €296 million as against the 2014 year-end. Trade receivables increased by €52 million compared with the figure for December 31, 2014, to €1,327 million.
Cash and cash equivalents decreased by €231 million as against December 31, 2014, to €745 million. However, net liquidity (cash, cash equivalents, and long- and short-term securities less current liabilities to banks) increased by €276 million compared with the figure for December 31, 2014, to €2,803 million. Current liabilities to banks decreased by €13 million and amounted to €39 million on the reporting date.
Total non-current provisions and liabilities have decreased by €33 million since December 31, 2014, to €740 million, mainly due to a slightly higher discount rate for pension provisions. The growth in current liabilities to €1,579 million was primarily due to the €165 million increase in trade payables.
FINANCING STRUCTURE (IN %)
Equity�� Non-current liabilities�� Current liabilities
301258
Dec. 31, 2014
Sep. 30, 2014
Sep. 30, 2015
30
3112
1159
57
Beiersdorf Interim Report January–September 2015 / Interim Management Report – Group / Results of Operations – Business Segments Beiersdorf Interim Report January–September 2014 / Interim Management Report – Group / Net Assets – Group

10
Financial Position – Group
CASH FLOW STATEMENT (IN € MILLION)
Jan. 1–Sep. 30, 2014 Jan. 1–Sep. 30, 2015
Gross cash flow 485 615
Change in working capital –140 –34
Net cash flow from operating activities 345 581
Net cash flow from investing activities –160 –601
Free cash flow 185 –20
Net cash flow from financing activities –200 –210
Other changes 24 –1
Net change in cash and cash equivalents 9 –231
Cash and cash equivalents as of Jan. 1 984 976
Cash and cash equivalents as of Sep. 30 993 745
Gross cash flow amounted to €615 million, up €130 million on the prior-year value. The cash outflow from the change in working capital was €34 million (previous year: €140 million). The increases in receivables and other assets of €106 million and in inventories of €9 million were partially matched by a €81 million rise in liabilities and provisions. Overall, the net cash flow from operating activities totaled €581 million (previous year: €345 million).
The net cash outflow from investing activities amounted to €601 million (previous year: €160 million). Interest and other financial income received of €52 million and proceeds of €32 million from the sale of intangible assets and property, plant, and equipment were offset by net cash outflows of €494 million for the purchase of securities as well as capital expenditure of €191 million for intangible assets and property, plant, and equipment.
Free cash flow was therefore €–20 million, down €205 million on the prior-year value (€185 million). The net cash outflow from financing activities amounted to €210 million (previous year: €200 million).
Cash and cash equivalents amounted to €745 million (previous year: €993 million).

Beiersdorf Interim Report January–September 2015 / Interim Management Report – Group / Employees 11
Employees The number of employees increased by 483 compared with the figure on December 31, 2014, from 17,398 to 17,881. As of September 30, 2015, 13,756 employees worked in the Consumer Business Segment and 4,125 at tesa.
Opportunities and Risks For more information on opportunities and risks, please refer to our Risk Report in the Group Management Report as of December 31, 2014. There were no significant changes in opportunities and risks as of September 30, 2015.
EMPLOYEES BY REGION (IN %)as of Sep. 30, 2015; total 17,881 employees
Europe58.0
Americas15.3
Africa/Asia/Australia26.7
Beiersdorf Interim Report January–September 2015 / Interim Management Report – Group / Financial Position --- Group Beiersdorf Interim Report January–September 2014 / Interim Management Report – Group / Employees Beiersdorf Interim Report January–September 2014 / Interim Management Report – Group / Opportunities and Risks

12
Outlook for 2015
Expected Macroeconomic Developments
The global economic situation looks set to see only moderate improvement in the coming months. We expect that this trend will be driven mainly by the industrialized nations, while growth in the emerging markets will continue to lose momentum. Tapering of bond sales and a planned increase in key interest rates by the US Federal Reserve, coupled with developments in the current crisis regions, are causing substantial uncertainty as regards global economic growth.
In Europe, we expect growth this year to be up slightly on the prior year. Since the economic recovery in the eurozone is only progressing slowly, necessary reforms and structural adjustments will continue to restrict the potential for growth in some countries, despite the European Central Bank’s bond-buying program. Factors that could put the recovery at risk include ongoing high unemployment in many countries, the lack of appetite for reform in certain European countries, and geopolitical unrest. Overall, we anticipate a relatively muted trend due to the still weak economy in some countries. In Germany, we expect growth to outstrip that in the rest of Europe, and that it will continue to be driven by consumer spending and increasing investment as a result of the expansionary monetary policy. We expect to see slightly stronger growth in the United States economy. Consumer spending is set to rise as a result of the further decline in unemployment. The increased confidence of American companies and the favorable economic environment are likely to be reflected in an increase in capital expenditure. However, tapering of bond sales and the planned increase in interest rates are a source of uncertainty for the economy and the financial markets. In Japan, we expect growth to be on a level with the previous year. The Bank of Japan’s continued expansionary monetary policy and the cheap yen are likely to have a positive impact on foreign trade. In China, we expect growth to be down on the prior-year level. Fiscal policy and the uncertain effects of the social and environmental reforms that have been announced are particular sources of uncertainty. Conditions in the remaining emerging markets will probably be more challenging. In India, we expect to see slightly higher growth than in the previous year, with continued high single-digit inflation. We anticipate a slight increase in economic growth in the emerging markets of Southeast Asia. Given the highly protectionist tendencies in many Latin American countries, particularly in Venezuela, Ecuador, and Argentina, developments are difficult to forecast for this area. The Russian economy is being negatively impacted by the fall in oil prices, the changes in the ruble’s exchange rate, and the results of sanctions.
Lower oil prices are cutting purchase costs for the oil refining industries. However, as the prices of the refined materials and plastic resins are most strongly affected by supply and demand in their respective markets, we expect only a limited positive impact on procurement costs. The current weakness of the euro on the currency market is countering this trend slightly. In 2014, Beiersdorf significantly stepped up its efforts to identify and implement cost reduction opportunities across all its functions. These activities are progressing well and are continuing in 2015.

Beiersdorf Interim Report January–September 2015 / Interim Management Report – Group / Outlook for 2015 13
Business Developments
We are expecting sales growth in the Consumer Business Segment to outperform the market in 2015, at 3-4%. The EBIT margin from operations is expected to significantly exceed the prior-year figure.
In the tesa Business Segment, we are predicting sales in 2015 to be at last year’s level. The EBIT margin from operations is expected to be similar to the prior-year level.
Building on the forecasts for the two business segments, we are expecting Group sales to grow by 3-4%. The consolidated EBIT margin from operations should significantly exceed the prior-year figure.
We firmly believe that we are well positioned for the future, thanks to our internationally successful brand portfolio, our innovative and high-quality products, and our dedicated employees.
Hamburg, November 2015 Beiersdorf AG The Executive Board

14
Interim Consolidated Financial Statements Income Statement
(IN € MILLION)
July 1–Sep. 30, 2014 July 1–Sep. 30, 2015 Jan. 1 –Sep. 30, 2014 Jan. 1 –Sep. 30, 2015
Sales 1,545 1,633 4,716 5,035
Cost of goods sold –653 –685 –1,964 –2,065
Gross profit 892 948 2,752 2,970
Marketing and selling expenses –540 –562 –1,713 –1,807
Research and development expenses –43 –48 –125 –137
General and administrative expenses –87 –85 –246 –260
Other operating result –66 –11 –60 –16
Operating result (EBIT) 156 242 608 750
Interest income 5 7 16 18
Interest expense –1 –1 –4 –6
Net pension result –3 –3 –9 –9
Other financial result 4 –11 6 –13
Profit before tax 161 234 617 740
Income taxes –47 –71 –194 –226
Profit after tax 114 163 423 514
Of which attributable to
– Equity holders of Beiersdorf AG 111 159 417 507
– Non-controlling interests 3 4 6 7
Basic/diluted earnings per share (in €) 0.49 0.70 1.84 2.24

Beiersdorf Interim Report January–September 2015 / Interim Consolidated Financial Statements / Statement of Comprehensive Income 15
Statement of Comprehensive Income
(IN € MILLION)
July 1–Sep. 30, 2014 July 1–Sep. 30, 2015 Jan. 1–Sep. 30, 2014 Jan. 1–Sep. 30, 2015
Profit after tax 114 163 423 514
Remeasurement gains and losses on cash flow hedges –7 17 –17 2
Deferred taxes on remeasurement gains and losses on cash flow hedges 2 –5 6 –1
Remeasurement gains and losses on cash flow hedges recognized in other comprehensive income –5 12 –11 1
Remeasurement gains and losses on available-for-sale financial assets –8 –29 3 2
Deferred taxes on remeasurement gains and losses on available-for-sale financial assets 3 9 –1 –1
Remeasurement gains and losses on available-for-sale financial assets recognized in other comprehensive income –5 –20 2 1
Exchange differences 33 –70 47 –3
Other comprehensive income that will be reclassified subsequently to profit or loss 23 –78 38 –1
Remeasurements of defined benefit pension plans –89 –15 –176 60
Deferred taxes on remeasurements of defined benefit pension plans 28 5 55 –19
Remeasurements of defined benefit pension plans recognized in other comprehensive income –61 –10 –121 41
Other comprehensive income that will not be reclassified subsequently to profit or loss –61 –10 –121 41
Other comprehensive income net of tax –38 –88 –83 40
Total comprehensive income 76 75 340 554
Of which attributable to
– Equity holders of Beiersdorf AG 73 71 334 546
– Non-controlling interests 3 4 6 8
Beiersdorf Interim Report January–September 2015 / Interim Consolidated Financial Statements / Income Statement Beiersdorf Interim Report January–September 2015 / Interim Consolidated Financial Statements / Statement of Comprehensive Income

16
Balance Sheet
(IN € MILLION) Assets Dec. 31, 2014 Sep. 30, 2014 Sep. 30, 2015
Intangible assets 119 111 118
Property, plant, and equipment 964 907 1,034
Non-current financial assets/securities 1,059 925 1,262
Other non-current assets 3 3 2
Deferred tax assets 195 183 208
Non-current assets 2,340 2,129 2,624
Inventories 786 802 795
Trade receivables 1,275 1,299 1,327
Other current financial assets 108 109 126
Income tax receivables 113 106 115
Other current assets 170 163 182
Securities 562 708 858
Cash and cash equivalents 976 993 745
Current assets 3,990 4,180 4,148
Summe Aktiva 6,330 6,309 6,772
Equity and liabilities Dec. 31, 2014 Sep. 30, 2014 Sep. 30, 2015
Equity attributable to equity holders of Beiersdorf AG 3,629 3,568 4,016
Non-controlling interests 11 9 9
Equity 3,640 3,577 4,025
Provisions for pensions and other post-employment benefits 627 567 574
Other non-current provisions 73 88 71
Non-current financial liabilities 1 7 3
Other non-current liabilities 3 3 3
Deferred tax liabilities 69 86 89
Non-current liabilities 773 751 740
Other current provisions 466 548 428
Income tax liabilities 130 105 160
Trade payables 1,022 1,086 1,187
Other current financial liabilities 135 128 116
Other current liabilities 164 114 116
Current liabilities 1,917 1,981 2,007
6,330 6,309 6,772

Beiersdorf Interim Report January–September 2015 / Interim Consolidated Financial Statements / Cash Flow Statement 17
Cash Flow Statement
(IN € MILLION) Jan. 1–Sep. 30, 2014 Jan. 1–Sep. 30, 2015
Profit after tax 423 514
Reconciliation of profit after tax to net cash flow from operating activities
Income taxes 194 226
Financial result –9 10
Income taxes paid –261 –217
Depreciation and amortization 146 90
Change in non-current provisions (excluding interest components and changes recognized in OCI) 1 –4
Gain/loss on disposal of property, plant, and equipment, and intangible assets –9 –4
Gross cash flow 485 615
Change in inventories –69 –9
Change in receivables and other assets –243 –106
Change in liabilities and current provisions 172 81
Net cash flow from operating activities 345 581
Investments in property, plant, and equipment, and intangible assets –198 –191
Proceeds from the sale of property, plant, and equipment, and intangible assets 20 32
Payments to acquire securities –754 –711
Proceeds from the sale/final maturity of securities 726 217
Interest received 23 31
Proceeds from dividends and other financing activities 23 21
Net cash flow from investing activities –160 –601
Free cash flow 185 –20
Proceeds from loans 35 54
Loan repayments –33 –67
Interest paid –3 –7
Other financing expenses paid –40 –31
Cash dividends paid (Beiersdorf AG) –159 –159
Net cash flow from financing activities –200 –210
Effect of exchange rate fluctuations and other changes on cash held 24 –1
Net change in cash and cash equivalents 9 –231
Cash and cash equivalents as of Jan. 1 984 976
Cash and cash equivalents as of Sep. 30 993 745
Beiersdorf Interim Report January–September 2015 / Interim Consolidated Financial Statements / Balance Sheet Beiersdorf Interim Report January–September 2015 / Interim Consolidated Financial Statements / Cash Flow Statement

18
Statement of Changes in Equity
(IN € MILLION)
Accumulated other comprehensive income
Share capital
Additional paid-in capital
Retainedearnings*
Currency translation
adjustment
Hedging instruments
from cash flow hedges
Available-for-sale
financial assets
Total attributable
to equity holders
Non-controlling
interests Total
Jan. 1, 2014 252 47 3,209 –128 3 10 3,393 12 3,405
Total comprehensive income for the period – – 296 47 –11 2 334 6 340
Dividend of Beiersdorf AG for previous year – – –159 – – – –159 – –159
Dividend of non- controlling interests for previous year – – – – – – – –9 –9
Sep. 30, 2014 252 47 3,346 –81 –8 12 3,568 9 3,577
Jan. 1, 2015 252 47 3,413 –93 –3 13 3,629 11 3,640
Total comprehensive income for the period – – 548 –4 1 1 546 8 554
Dividend of Beiersdorf AG for previous year – – –159 – – – –159 – –159
Dividend of non- controlling interests for previous year – – – – – – – –10 –10
Sep. 30, 2015 252 47 3,802 –97 –2 14 4,016 9 4,025
* The cost of treasury shares amounting to €955 million has been deducted from retained earnings.
Beiersdorf Interim Report January–September 2015 / Interim Consolidated Financial Statements / Segment Reporting 19
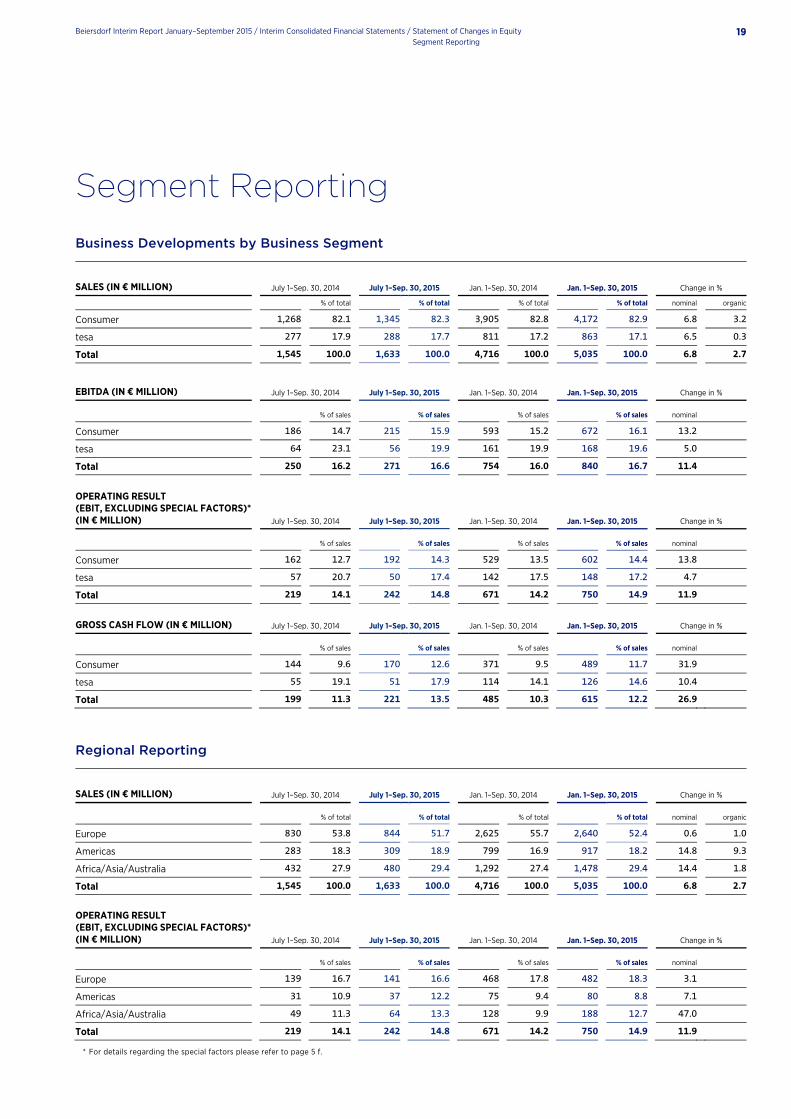
Segment Reporting
Business Developments by Business Segment
SALES (IN € MILLION) July 1–Sep. 30, 2014 July 1–Sep. 30, 2015 Jan. 1–Sep. 30, 2014 Jan. 1–Sep. 30, 2015 Change in %
% of total % of total % of total % of total nominal organic
Consumer 1,268 82.1 1,345 82.3 3,905 82.8 4,172 82.9 6.8 3.2
tesa 277 17.9 288 17.7 811 17.2 863 17.1 6.5 0.3
Total 1,545 100.0 1,633 100.0 4,716 100.0 5,035 100.0 6.8 2.7
EBITDA (IN € MILLION) July 1–Sep. 30, 2014 July 1–Sep. 30, 2015 Jan. 1–Sep. 30, 2014 Jan. 1–Sep. 30, 2015 Change in %
% of sales % of sales % of sales % of sales nominal Consumer 186 14.7 215 15.9 593 15.2 672 16.1 13.2
tesa 64 23.1 56 19.9 161 19.9 168 19.6 5.0
Total 250 16.2 271 16.6 754 16.0 840 16.7 11.4
OPERATING RESULT (EBIT, EXCLUDING SPECIAL FACTORS)* (IN € MILLION) July 1–Sep. 30, 2014 July 1–Sep. 30, 2015 Jan. 1–Sep. 30, 2014 Jan. 1–Sep. 30, 2015 Change in %
% of sales % of sales % of sales % of sales nominal Consumer 162 12.7 192 14.3 529 13.5 602 14.4 13.8
tesa 57 20.7 50 17.4 142 17.5 148 17.2 4.7
Total 219 14.1 242 14.8 671 14.2 750 14.9 11.9
GROSS CASH FLOW (IN € MILLION) July 1–Sep. 30, 2014 July 1–Sep. 30, 2015 Jan. 1–Sep. 30, 2014 Jan. 1–Sep. 30, 2015 Change in %
% of sales % of sales % of sales % of sales nominal Consumer 144 9.6 170 12.6 371 9.5 489 11.7 31.9
tesa 55 19.1 51 17.9 114 14.1 126 14.6 10.4
Total 199 11.3 221 13.5 485 10.3 615 12.2 26.9
Regional Reporting
SALES (IN € MILLION) July 1–Sep. 30, 2014 July 1–Sep. 30, 2015 Jan. 1–Sep. 30, 2014 Jan. 1–Sep. 30, 2015 Change in %
% of total % of total % of total % of total nominal organic
Europe 830 53.8 844 51.7 2,625 55.7 2,640 52.4 0.6 1.0
Americas 283 18.3 309 18.9 799 16.9 917 18.2 14.8 9.3
Africa/Asia/Australia 432 27.9 480 29.4 1,292 27.4 1,478 29.4 14.4 1.8
Total 1,545 100.0 1,633 100.0 4,716 100.0 5,035 100.0 6.8 2.7
OPERATING RESULT (EBIT, EXCLUDING SPECIAL FACTORS)* (IN € MILLION) July 1–Sep. 30, 2014 July 1–Sep. 30, 2015 Jan. 1–Sep. 30, 2014 Jan. 1–Sep. 30, 2015 Change in %
% of sales % of sales % of sales % of sales nominal Europe 139 16.7 141 16.6 468 17.8 482 18.3 3.1
Americas 31 10.9 37 12.2 75 9.4 80 8.8 7.1
Africa/Asia/Australia 49 11.3 64 13.3 128 9.9 188 12.7 47.0
Total 219 14.1 242 14.8 671 14.2 750 14.9 11.9 * For details regarding the special factors please refer to page 5 f.
Beiersdorf Interim Report January–September 2015 / Interim Consolidated Financial Statements / Statement of Changes in Equity Beiersdorf Interim Report January–September 2015 / Interim Consolidated Financial Statements / Segment Reporting

20
Selected Explanatory Notes
Information on the Company and on the Group
The registered office of Beiersdorf AG is at Unnastrasse 48 in Hamburg (Germany), and the company is registered with the commercial register of the Hamburg Local Court under the number HRB 1787. The ultimate parent of the company is maxingvest ag. The activities of Beiersdorf AG and its affiliates (“Beiersdorf Group”) consist primarily of the manufacture and distribution of branded consumer goods in the area of skin care, and of the manufacture and distribution of technical adhesive tapes.
Basis of Preparation
The interim consolidated financial statements for the period from January 1 to September 30, 2015, were prepared in accordance with IAS 34 “Interim Financial Reporting.” The interim consolidated financial statements should be read in conjunction with the consolidated financial statements as of December 31, 2014.
Accounting Policies
The figures disclosed in this interim report were prepared in accordance with International Financial Reporting Standards (IFRSs). The same accounting policies were used in the interim consolidated financial statements as in the annual consolidated financial statements for 2014. The intraperiod income tax expense was calculated on the basis of the estimated effective tax rate for the full year. The interim report was not audited or reviewed.
Change in Income Statement Presentation
Effective as of the beginning of fiscal year 2015, direct expenses for distribution logistics are reported under “cost of goods sold” (previously: “marketing and selling expenses”) so as to enhance international comparability of the cost structure. These expenses mainly comprise operating expenses for distribution centers and freight shipments to customers. The prior-year figures have been adjusted accordingly. The change in presentation has no effect on the operating result.
(IN € MILLION) Jan.1-Sep.30, 2014 (old) Reclassification Jan.1-Sep.30, 2014 (new)
Cost of goods sold –1,741 –223 –1,964Gross profit 2,975 –223 2,752Marketing and selling expenses –1,936 223 –1,713

Beiersdorf Interim Report January–September 2015 / Interim Consolidated Financial Statements / Selected Explanatory Notes 21
Related Party Disclosures
Please refer to the consolidated financial statements as of December 31, 2014, for related party disclosures. There were no significant changes as of September 30, 2015.
Corporate Governance
The declaration of compliance with the recommendations of the German Corporate Governance Code issued by the Supervisory Board and the Executive Board for fiscal year 2014 in accordance with § 161 Aktiengesetz (German Stock Corporation Act, AktG) was published at the end of December 2014 and is permanently available on our website at WWW.BEIERSDORF.COM/INVESTORS/CORPORATE-GOVERNANCE/DECLARATION-OF-COMPLIANCE.HTML.
Events after the Reporting Date
No significant events occurred after the balance sheet date that would have a material effect on the Beiersdorf Group’s business development.

22
Additional Disclosures on Financial Instruments
The following table shows the carrying amounts and fair values of the Group’s financial instruments.
(IN € MILLION)
Measurement under IAS 39
Dec. 31, 2014 Carrying amount
Amortized cost
Fair valuerecognized
in OCI
Fair valuethrough
profit or loss Fair value
Assets
Loans and receivables (LaR) 2,345 2,345 – – 2,345
Non-current financial assets 8 8 – – 8
Trade receivables 1,275 1,275 – – 1,275
Other current financial assets 86 86 – – 86
Cash and cash equivalents 976 976 – – 976
Available-for-sale financial assets (AfS) 334 10 324 – 334
Non-current financial assets 10 10 – – 10
Securities 324 – 324 – 324
Held-to-maturity financial investments (HtM) 1,279 1,279 – – 1,352
Securities 1,279 1,279 – – 1,352
Derivative financial instruments used for hedges (DFI) 19 – 16 3 19
Derivative financial instruments not included in a hedging relationship (FVPL) 3 – – 3 3
Liabilities
Other financial liabilities (OFL) 1,135 1,135 – – 1,135
Non-current financial liabilities 1 1 – – 1
Trade payables 1,022 1,022 – – 1,022
Other current financial liabilities 112 112 – – 112
Derivative financial instruments used for hedges (DFI) 23 – 21 2 23
Sep. 30, 2015 Assets
Loans and receivables (LaR) 2,191 2,191 – – 2,191
Non-current financial assets 11 11 – – 11
Trade receivables 1,327 1,327 – – 1,327
Other current financial assets 108 108 – – 108
Cash and cash equivalents 745 745 – – 745
Available-for-sale financial assets (AfS) 619 10 609 – 619
Non-current financial assets 10 10 – – 10
Securities 609 – 609 – 609
Held-to-maturity financial investments (HtM) 1,488 1,488 – – 1,492
Securities 1,488 1,488 – – 1,492
Derivative financial instruments used for hedges (DFI) 20 – 15 5 20
Derivative financial instruments not included in a hedging relationship (FVPL) – – – – –
Liabilities
Other financial liabilities (OFL) 1,287 1,287 – – 1,287
Non-current financial liabilities – – – – –
Trade payables 1,187 1,187 – – 1,187
Other current financial liabilities 100 100 – – 100
Derivative financial instruments used for hedges (DFI) 19 – 18 1 19

Beiersdorf Interim Report January–September 2015 / Interim Consolidated Financial Statements / Selected Explanatory Notes 23
The following hierarchy levels under IFRS 13 are used to measure and report the fair values of financial instruments:
○ Level 1: Fair values that are measured using quoted prices in active markets ○ Level 2: Fair values that are measured using valuation techniques whose significant inputs are based on directly or indirectly
observable market data ○ Level 3: Fair values that are measured using valuation techniques whose significant inputs are not based on observable market
data
The following overview shows the hierarchy levels used to categorize financial instruments that are measured at fair value on a recurring basis.
(IN € MILLION)
Fair value hierarchy under IFRS 13
Dec. 31, 2014 Level 1 Level 2 Level 3 Total
Assets
Available-for-sale financial assets (AfS) 324 – – 324
Securities 324 – – 324
Derivative financial instruments used for hedges (DFI) – 19 – 19
Derivative financial instruments not included in a hedging relationship (FVPL) – 3 – 3
Liabilities
Derivative financial instruments used for hedges (DFI) – 23 – 23
Sep. 30, 2015 Assets
Available-for-sale financial assets (AfS) 609 – – 609
Securities 609 – – 609
Derivative financial instruments used for hedges (DFI) – 20 – 20
Liabilities
Derivative financial instruments used for hedges (DFI) – 19 – 19
No transfers between hierarchy levels took place in the first three quarters of 2015.
In the Beiersdorf Group, securities carried at fair value are allocated to fair value hierarchy level 1 and are measured at quoted prices on the balance sheet date.
Derivative financial instruments are assigned to fair value hierarchy level 2. The fair values of currency forwards are calculated using the exchange rate as of the reporting date and discounted to the reporting date on the basis of their respective yield curves.
Financial instruments that are not measured at fair value predominantly have remaining contractual maturities of less than 12 months as of the reporting date. Therefore, their carrying amounts at the balance sheet date correspond approximately to their fair value. Securities classified as “held to maturity (HtM)” are an exception. The fair values for this item have been assigned to fair value hierarchy level 1.

2016
January 14 ___
Publication of
Preliminary Group Results 2015 (Sales)
February 17 ___
Publication of Annual Report 2015, Annual Accounts Press Conference,
Financial Analyst Meeting
March 31 ___
Annual General Meeting
May 4 ___
Interim Report
January to March 2016
August 4 ___
Interim Report
January to June 2016
November 3 ___
Interim Report
January to September 2016
Contact Information Published by Editorial Team and Concept Additional Information
Beiersdorf Aktiengesellschaft Unnastrasse 48 20245 Hamburg Germany
Corporate Communications Telephone: +49-40-4909-2001 E-mail: [email protected]
Corporate Communications Telephone: +49-40-4909-2001 E-mail: [email protected]
Investor Relations Telephone: +49-40-4909-5000 E-mail: [email protected]
Beiersdorf on the Internet www.beiersdorf.com
Note
The Interim Report is also available in German.
The online version is available at WWW.BEIERSDORF.COM/INTERIM_REPORT.
Financial Calendar