Embed Size (px)
Citation preview
INTERIM REPORT Q1 2017 /184 OCTOBER 2017

This presentation does not constitute or form part of and should not be construed as, an offer to sell or issue or the solicitation of an offer to buy or acquire securities issued by Bang & Olufsen a/s in any jurisdiction, including the United States of America, Canada, Australia, Japan or the United Kingdom, or an inducement to enter into investment activity in any jurisdiction.
This presentation contains forward looking statements. Such statements concern management’s current expectations, beliefs, intentions or strategies relating to future events and hence involve substantial risks and uncertainties. Actual future results and performance may differ materially from those contained in such statements. This presentation does not imply that Bang & Olufsen a/s has undertaken to revise these forward looking statements, except what is required under applicable law or stock exchange regulation.
No part of the information contained in this presentation should form the basis of or be relied upon in connection with any contract or commitment or investment decision whatsoever. Neither Bang & Olufsen a/s nor any of its affiliates, advisors or other representatives shall have any liability whatsoever (in negligence or otherwise) for any loss howsoever arising from any use of this presentation or its contents.
2
DISCLAIMER
I N T E R I M R E P O R T Q 1 2 0 1 7 / 1 8
• Highl ights
• F i n a n c i a l r e s u l t s
• O u t l o o k
• Q u e s t i o n s & a n s w e r s
AGENDA
I N T E R I M R E P O R T Q 1 2 0 1 7 / 1 8 3

Q1 HIGHLIGHTS: A SATISFACTORY START
• Group revenue grew 15 per cent
• Several new products launched across business units and
increased brand partnering activities
• The Group gross margin increased to 39.9 per cent from
33.4 per cent
• Negative EBITDAC due to the seasonal nature of the
business and development cost, however it improved
compared to last year.
• The outlook for 2017/18 remains unchanged
4I N T E R I M R E P O R T Q 1 2 0 1 7 / 1 8

STRATEGY EXECUTION
5
N E W P R O D U C T S
• BeoLab 50, BeoVision Eclipse, Beoplay E8 and E4 was launched. Together with existing products and BeoSound Shape, which is now available, the company has a strong foundation for increasing revenue in the coming quarters
B R A N D P A R T N E R I N G A C T I V I T I E S
• Brand partnering is an important driver of license income and brand awareness. The company announced collaborations with LG on the V30 smartphone, and with Bentley Motors, through Harman, to deliver an audio system to the Continental GT.
I N T E R I M R E P O R T Q 1 2 0 1 7 / 1 8
I M P R O V E D G O - T O - M A R K E T S E T U P
• The go-to-market approach has been strengthened. New digital capabilities has been added, the transformation of the setup in the US and GCR is well underway and the overall quality of the mono-and multibrand distribution has been improved

FINANCIAL RESULTS
6
• H i g h l i g h t s
• Financia l resul ts
• O u t l o o k
• Q u e s t i o n s & a n s w e r s
I N T E R I M R E P O R T Q 1 2 0 1 7 / 1 8

FINANCIAL HIGHLIGHTS
• Revenue increased from DKK 515 million last year to DKK 592 million, corresponding to a growth of 15 per cent
• The Group’s gross margin increased to 39.9 per cent from 33.4 per cent driven by higher revenue, increased income from brand partnering, improved product margins and a change in product mix
• EBITDAC improved compared to last year. But due to the seasonal nature of the business and high development costs, it was negative DKK 42 million. The improvement was driven by the increase in revenue and improved gross margin
• Capacity costs increased due to higher depreciations on capitalised development costs related to the TV portfolio
• In line with expectations, free cash flow was negative DKK 159 million compared to negative DKK 32 million last year
7I N T E R I M R E P O R T Q 1 2 0 1 7 / 1 8
Key financial figures DKK million
17/18 16/17
Revenue 592 515
Gross profit 236 172
EBIT -65 -89
EBT -70 -87
Earnings -55 -66
Gross margin, % 39.9 33.4
Net working capital 130 285
Free cash flow -159 -32
1st quarter

326
211
271
229
371
322 314
267
0
50
100
150
200
250
300
350
400
Q2 15/16 Q3 15/16 Q4 15/16 Q1 16/17 Q2 16/17 Q3 16/17 Q4 16/17 Q1 17/18
DKK
m
403
492
425
287
496464 471
325
0
100
200
300
400
500
600
Q2 15/16 Q3 15/16 Q4 15/16 Q1 16/17 Q2 16/17 Q3 16/17 Q4 16/17 Q1 17/18
DK
Km
DOUBLE-DIGIT GROWTH IN BOTH BUSINESS UNITS
8
B A N G & O L U F S E N Q U A R T E R LY R E V E N U E
• The Bang & Olufsen business unit had a good start to the year and grew 13 per cent
• The growth was primarily driven by increased sales of BeoSound 1 and 2, and by the launch of new products such as BeoLab 50, BeoVision Eclipse, and BeoSound Shape, together with increased income from brand partnering
B & O P L AY Q U A R T E R LY R E V E N U E
• The B&O PLAY business unit continued the double-digit growth and grew 17 per cent. The main growth contributors were BeoplayA1, A9 and H5, which continued to perform well, as well as Beoplay P2 and E4 that were launched in the previous two quarters
• B&O PLAY revenue through third-party retail and e-commerce increased by 25 per cent. The revenue through the B1 and shop-in-shop channel was on par with last year
17%13%
Bang & Olufsen B&O PLAY
I N T E R I M R E P O R T Q 1 2 0 1 7 / 1 8

1800
2500
33003721
5331 5462 5692 5808
6607 6658 64246833
0
1.000
2.000
3.000
4.000
5.000
6.000
7.000
8.000
Q214/15
Q314/15
Q414/15
Q115/16
Q215/16
Q315/16
Q415/16
Q116/17
Q216/17
Q316/17
Q416/17
Q117/18
No.
TP
R s
tore
s
B1 STORES ADJUSTED AND FOCUS ON QUALITY IN TPR
9
F E W E R B 1 A N D S H O P - I N - S H O P S T O R E S
• The transformation of the mono-brand retail distribution continued, with key focus on creating a network of fewer, stronger partners
• The net number of B1 and shop-in-shops decreased by 28, primarily in Europe and Greater China
M O D E R A T E I N C R E A S E I N N O . O F T P R S T O R E S
• B&O PLAY expanded the number of third-party retail stores while maintaining a strong focus on ensuring quality and depth to improve sales in the existing stores
• The number of third-party retail stores increased to 6,833 stores from 5,808 stores
I N T E R I M R E P O R T Q 1 2 0 1 7 / 1 8
598 626
0100200300400500600700
31/8/2017 31/5/2017
B1 and shop-in-shops
Europe North AmericaGreater China Rest of World
TPR stores

GROWTH IN ALL REGIONS
10
G R E A T E R C H I N A A N D R E S T O F W O R L D W E R E T H E M A I N G R O W T H D R I V E R S
• Both business units grew in Europe in the first quarter. The growth was a result of the continued focus on driving flexible living products as well as the launch of BeoLab 50
• Focus in North America was to continue the transformation of the organisational structure and the B1 network, while expanding the distribution in the third-party retail channel. Revenue growth in North America was supported by increased income from brand partnering
• The growth momentum continued to be strong in the Greater China region, where focus continued to be on growing B&O PLAY
• The increase in revenue in Rest of World was driven by growth in both business units and partially supported by increased income from brand partnering
I N T E R I M R E P O R T Q 1 2 0 1 7 / 1 8
4%(6%)
6%(9%)
32%(41%)
46%(46%)
Revenue y-o-y change(Growth in local currency in parenthesis)
324
55
102 110
311
5278 75
0
50
100
150
200
250
300
350
Europe North America Greater China Rest of World
DK
Km

GROUP GROSS MARGIN IMPROVED TO 39.9 PER CENT
11
G R O U P G R O S S M A R G I N W A S 3 9 . 9 P E R C E N T A G A I N S T 3 3 . 4 P E R C E N T L A S T Y E A R
• The gross margin in the Bang & Olufsen segment was 40.0 per cent against 33.3 per cent last year due to:
• Higher revenue in the quarter, resulting in a higher indirect cost absorption
• Increased income from brand partnering• A change in product mix due to a higher share of
speaker turnover
• The gross margin for the B&O PLAY segment was 39.6 per cent against 33.6 per cent last year due to:
• Product mix• Higher volumes and positive scalability impacts on
the supply chain
I N T E R I M R E P O R T Q 1 2 0 1 7 / 1 8
Gross margin
% 1st quarter
17/18 16/17
Bang & Olufsen 40,0 33,3
B&O PLAY 39,6 33,6
Group 39.9 33.4

CAPACITY COSTS INCREASED IN THE QUARTER IN LINE WITH EXPECTATIONS
12
C A P A C I T Y C O S T S I N C R E A S E D D U E T O H I G H E R D E V E L O P M E N T C O S T S
• The capacity costs were DKK 301 million compared to DKK 261 million last year
• The increase was due to higher depreciation on development projects. Adjusted for this impact, capacity costs increased DKK 5 million
I N V E S T M E N T S I N P R O D U C T D E V E L O P M E N T C O N T I N U E D
• Development costs were DKK 114 million against DKK 75 million last year. The increase was expected due to higher depreciations of the current TV product portfolio
• Incurred development costs and capitalisations of development projects in the quarter were particularly high due to the final development of BeoVision Eclipse. These costs are expected to decrease significantly in the coming quarters
I N T E R I M R E P O R T Q 1 2 0 1 7 / 1 8
Capacity costsDKK million
17/18 16/17
Development 114 75
Dist. and marketing 162 163
Administration 25 23
Total cap. costs 301 261
1st quarter Development costsDKK million
17/18 16/17
Incurred development costs before capitalisation 109 67Net effect of capitalisations and amortisations 5 8Development costs in P&L, reported 114 75Capitalisation (%) 59.7% 39.8%
1st quarter
Cash FlowDKK million
17/18 16/17
Earnings for the period -55 -66
Net working capital related 72 -68
Other -95 128
Cash flow from oper. activities -78 -7
Cash flow from investing activities -81 -26
Free Cash Flow -159 -32
1st quarter
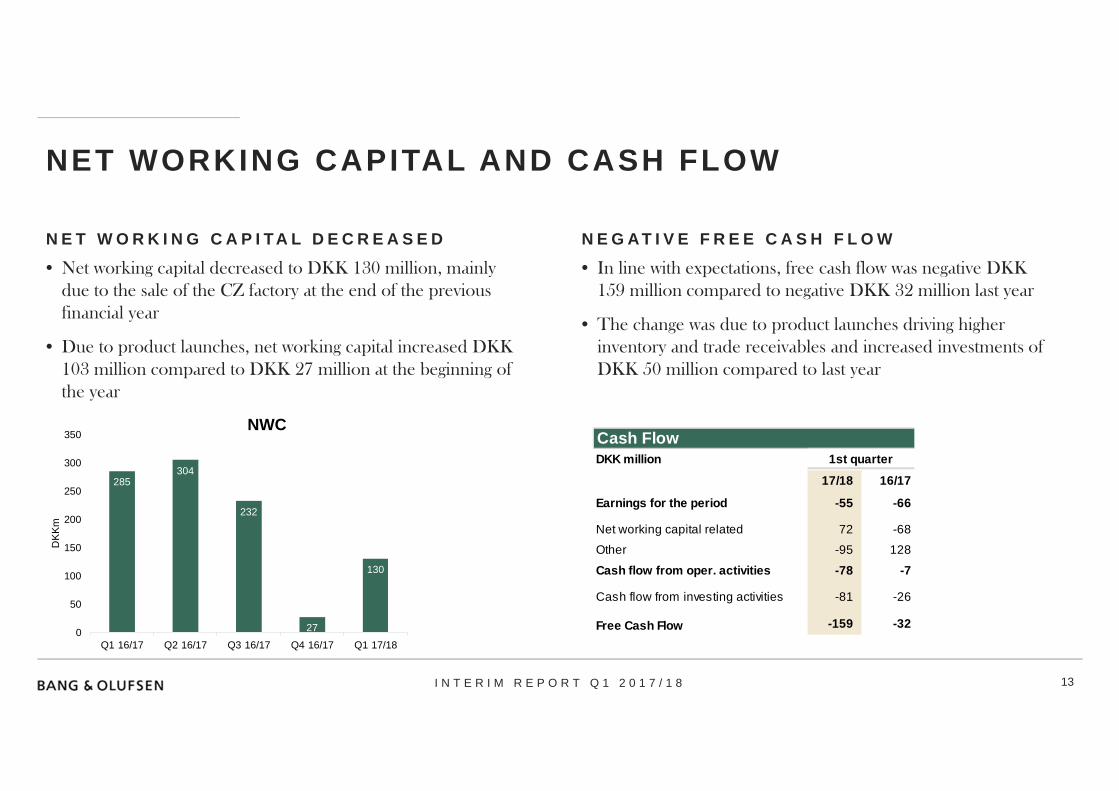
NET WORKING CAPITAL AND CASH FLOW
13
• Net working capital decreased to DKK 130 million, mainly due to the sale of the CZ factory at the end of the previous financial year
• Due to product launches, net working capital increased DKK 103 million compared to DKK 27 million at the beginning of the year
N E G A T I V E F R E E C A S H F L O W
• In line with expectations, free cash flow was negative DKK 159 million compared to negative DKK 32 million last year
• The change was due to product launches driving higher inventory and trade receivables and increased investments of DKK 50 million compared to last year
N E T W O R K I N G C A P I T A L D E C R E A S E D
I N T E R I M R E P O R T Q 1 2 0 1 7 / 1 8
285304
232
27
130
0
50
100
150
200
250
300
350
Q1 16/17 Q2 16/17 Q3 16/17 Q4 16/17 Q1 17/18
DK
Km
NWC

OUTLOOK
14
• H i g h l i g h t s
• F i n a n c i a l r e s u l t s
• Out look
• Q u e s t i o n s & a n s w e r s
I N T E R I M R E P O R T Q 1 2 0 1 7 / 1 8

OUTLOOK FOR 2017/18
15I N T E R I M R E P O R T Q 1 2 0 1 7 / 1 8
• Group revenue is expected to grow by around 10 per cent compared to 2016/17
• B&O PLAY is expected to continue to be the main growth driver with growth of more than 20 per cent compared to 2016/17
• The Bang & Olufsen business unit is expected to remain flat and adversely impacted by the transformation of the branded retail network
• Revenue related to brand partnering is expected to be DKK 160-200 million
• The EBITDAC margin for the Group is expected to be 8-10 per cent for 2017/18
• The EBIT margin for the Group is expected to be 1-3 per cent for 2017/18 and impacted by high depreciations and low capitalisations
• The Group’s free cash flow is expected to be positive in 2017/18

Q&A
16
• H i g h l i g h t s
• F i n a n c i a l r e s u l t s
• O u t l o o k
• Quest ions & answers
I N T E R I M R E P O R T Q 1 2 0 1 7 / 1 8

I N V E S T O R R E L A T I O N S C O N T A C T :
C L A U S H Ø J M A R K J E N S E N
I N V E S T O R R E L A T I O N S
D I R E C T T E L . : + 4 5 9 6 8 4 1 2 5 1
M O B I L E T E L . : + 4 5 2 3 2 5 1 0 6 7
E M A I L : C H M @ B A N G - O L U F S E N . D K