Embed Size (px)
Citation preview

Interim report Q1 2021
Tryg
A/S
· K
laus
dals
brov
ej 6
01, 2
750
Bal
leru
p, D
enm
ark
· CV
R n
o. 2
6460
212

Contents
Management’s review
Highlights 03Income overview 04Tryg's results 05Business initiatives 08Private 10Commercial 12Corporate 14Sweden 16Investment activities 17Solvency and dividend 18Financial outlook 19Financial calendar 20
Financial statements
Financial statements 22Statement by the Supervisory Board and the Executive Board 23Financial highlights 24Income statement 25 Statement of comprehensive income 26Statement of financial position 27Statement of changes in equity 28Cash flow statement 30Notes 31Quarterly outline 37
05
17
08
19
Tryg results
Investment activities
Business initiatives
Financial outlook
Tryg aims to pay a nominal, stable and increasing ordinary dividend, while maintaining stable results and a high level of return on capital employed
* Calculated on the new 654m number of shares
Shareholder remuneration(DKK per share)
2016 2017 2018 2019 2020 Q1 2021
Ordinary dividend Extraordinary dividend
1.65
6.86.46.2
3.33.5
6.6
1.07*
7.0
2Interim report Q1 2021 | Tryg A/S |

Highlights
Financial Q1 Customer Q1RSA transaction Q1
DKK 37bn SEK 1bn
up to 715m
846.2% 751m 14.1Premium growth in local currencies
Q1 2020: 8.9%
Technical result (DKK)
Q1 2020: 672m
Expense ratio
Q1 2020: 14.1
193mInvestment return on free portfolio (DKK)
Q1 2020: -713m
343mTotal investment income (DKK)
Q1 2020: -980m
1,022mProfit before tax (DKK)
Q1 2020: -372m
700m
87.1Combined ratio
Q1 2020: 88.0
180Solvency ratioadjusted for the equity raise
Q4 2020: 183
899Solvency ratio as reported
Q4 2020: 183
Quarterly dividend or 1.07 per share
Q1 2020: 0.0
0.8Group underlying claims ratio improved
Q1 2020: 0.5
Member bonus (6th year in a row)equivalent to 5% of premiums paid for 2020
2020: 8%
Intact has obtained approval from the Dan-ish Competition and Consumer Authority to acquire sole control of RSA’s business outside Norway and Sweden, including sole control of RSA’s Danish business placed in Codan A/S. The Tryg Group will co-own RSA’s business in Denmark (‘Codan Denmark’) with the Intact Group on a 50/50 economic basis. Codan Denmark will remain completely separate and independent of Tryg
Norwegian and Swedish competition authori-ties approvals received by Tryg
Tryg, Intact, including certain subsidiaries thereof, as well as TryghedsGruppen smba have received clearances from the Danish Financial Supervisory Authority for the acquisition of a qualifying holding in Codan A/S, Codan Forsikring A/S and Forsikringsselskabet Privatsikring A/S.
Introduction of new Customer satisfaction score
Q1 2020: 83
Rights issue completed
Tier 1 issuerated Baa3 by Moody’s
Premium growth of 6.2% (8.9% in Q1 2020), a technical result of DKK 751m which was positively impacted by good development in the core business, the delivery of Alka synergies
partly offset by higher weather claims compared to the prior-year period. Investment income of DKK 343m primarily driven by good returns on equities, positive returns on free and match
portfolios. Profit before tax of DKK 1,022m (DKK -372m). Quarterly dividend of DKK 700m or DKK 1.07 per share, demonstrating a strong dividend commitment even in a transformation-
al year as 2021, which also supports Trygheds-Gruppen’s member bonus. Solvency ratio (adjusted for the equity raise) of 180.
3
Management’s review - Contents
Interim report Q1 2021 | Tryg A/S |

Income overviewDKKm Q1 2021 Q1 2020 2020
Gross premium income 5,906 5,595 22,653Gross claims -4,142 -4,316 -15,437Total insurance operating costs -830 -787 -3,202Profit/loss on gross business 933 491 4,014Profit/loss on ceded business -174 181 -499Insurance technical interest, net of reinsurance -9 -1 -20Technical result 751 672 3,495Investment return after insurance technical interest 343 -980 311Other income and costs -72 -64 -265Profit/loss before tax 1,022 -372 3,541Tax -208 -70 -768Profit/loss on continuing business 814 -442 2,773Profit/loss 814 -442 2,773Run-off gains/losses, net of reinsurance 255 357 1,145
Key figuresTotal equity 48,773 10,458 12,264Return on equity after tax (%) a) 22.2 -16.0 22.5Number of shares, end of period (1,000) 653,973 301,701 301,750Earnings per share 2.50 -1.47 9.19Operating earnings per share (DKK) b) 2.58 -1.38 9.54Ordinary dividend per share (DKK) 1.07 0.00 7.00
Premium growth in local currencies 6.2 8.9 7.0
Gross claims ratio 70.1 77.1 68.1Net reinsurance ratio 2.9 -3.2 2.2Claims ratio, net of reinsurance 73.1 73.9 70.3Gross expense ratio 14.1 14.1 14.1Combined ratio 87.1 88.0 84.5
Run-off, net of reinsurance (%) -4.3 -6.4 -5.1Large claims, net of reinsurance (%) 2.0 2.4 2.2Weather claims, net of reinsurance (%) 2.2 2.0 1.6Discounting (%) 0.2 0.3 0.2COVID-19 claims, net of reinsurance (%) -1.3 0.7 -0.8
Combined ratio on business areasPrivate 87.8 90.1 83.9Commercial 82.5 88.5 83.7Corporate 94.4 78.8 88.0Sweden 80.5 90.0 83.2
a) ROE is calculated as Profit for the period after tax divided with weighted average equity (as prescribed by the Danish FSA)b) Adjusted for depreciation on intangible assets related to Brands and Customer relations after tax (note 3, page 35)
Combined ratio (%)
Q117
100
90
80
70
60Q217
Q317
Q417
Q118
Q218
Q318
Q418
Q119
Q219
Q319
Q419
Q120
Q220
Q320
Q420
Q121
Expense ratio (%)
Q117
22
20
18
16
14
12
10Q217
Q317
Q417
Q118
Q218
Q318
Q418
Q119
Q219
Q319
Q419
Q120
Q220
Q320
Q420
Q121
Return on equi� (%)
2016 2017 2018 2019 Q1 20212020
50
40
30
20
10
0
Interim report Q1 2021 | Tryg A/S | 4
Management’s review - Contents
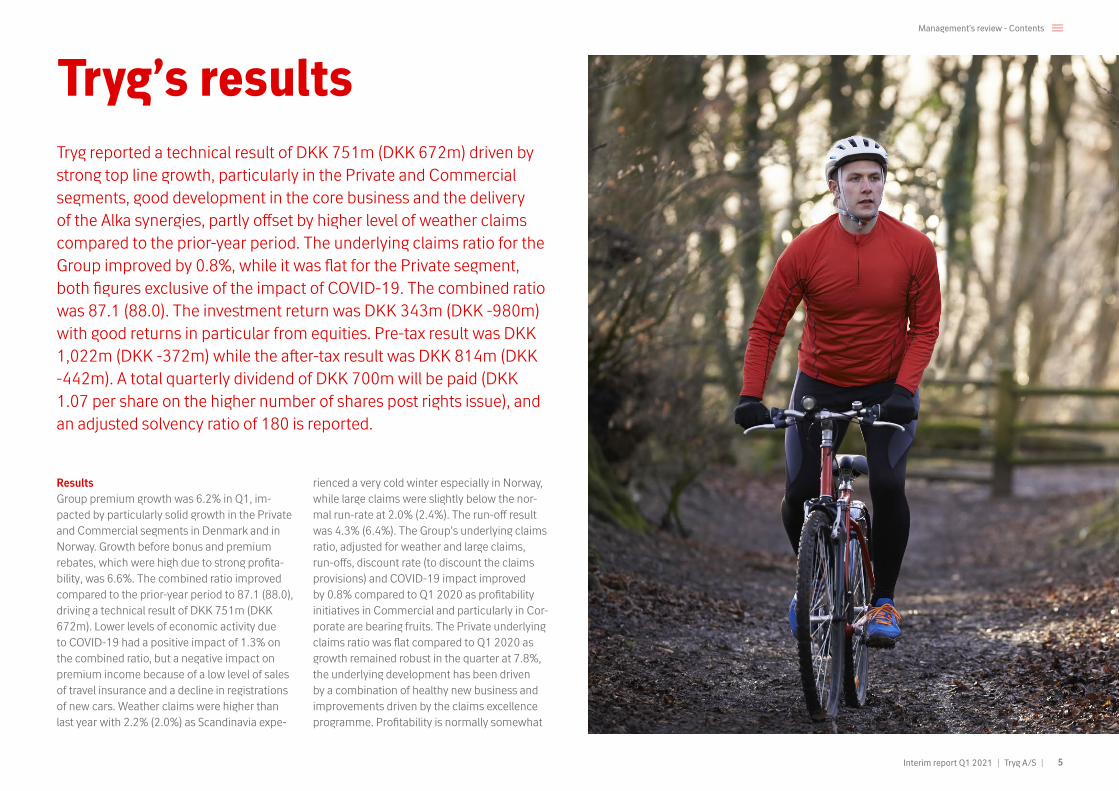
Tryg’s results
ResultsGroup premium growth was 6.2% in Q1, im-pacted by particularly solid growth in the Private and Commercial segments in Denmark and in Norway. Growth before bonus and premium rebates, which were high due to strong profita-bility, was 6.6%. The combined ratio improved compared to the prior-year period to 87.1 (88.0), driving a technical result of DKK 751m (DKK 672m). Lower levels of economic activity due to COVID-19 had a positive impact of 1.3% on the combined ratio, but a negative impact on premium income because of a low level of sales of travel insurance and a decline in registrations of new cars. Weather claims were higher than last year with 2.2% (2.0%) as Scandinavia expe-
Tryg reported a technical result of DKK 751m (DKK 672m) driven by strong top line growth, particularly in the Private and Commercial segments, good development in the core business and the delivery of the Alka synergies, partly offset by higher level of weather claims compared to the prior-year period. The underlying claims ratio for the Group improved by 0.8%, while it was flat for the Private segment, both figures exclusive of the impact of COVID-19. The combined ratio was 87.1 (88.0). The investment return was DKK 343m (DKK -980m) with good returns in particular from equities. Pre-tax result was DKK 1,022m (DKK -372m) while the after-tax result was DKK 814m (DKK -442m). A total quarterly dividend of DKK 700m will be paid (DKK 1.07 per share on the higher number of shares post rights issue), and an adjusted solvency ratio of 180 is reported.
rienced a very cold winter especially in Norway, while large claims were slightly below the nor-mal run-rate at 2.0% (2.4%). The run-off result was 4.3% (6.4%). The Group’s underlying claims ratio, adjusted for weather and large claims, run-offs, discount rate (to discount the claims provisions) and COVID-19 impact improved by 0.8% compared to Q1 2020 as profitability initiatives in Commercial and particularly in Cor-porate are bearing fruits. The Private underlying claims ratio was flat compared to Q1 2020 as growth remained robust in the quarter at 7.8%, the underlying development has been driven by a combination of healthy new business and improvements driven by the claims excellence programme. Profitability is normally somewhat
5
Management’s review - Contents
Interim report Q1 2021 | Tryg A/S |
lower for new business than ‘old’ business due to an approximately 3% higher claims fre-quency and higher distribution costs. At times where growth levels are very strong, the Private segment will therefore contribute less to the underlying claims ratio development. Com-mercial and especially Corporate given Tryg’s long-term initiatives will ensure continuous im-provement for the Group, which will more than offset the development in the Private segment. In the medium and long term, a higher share of premium income from the Private segment will be considered a key competitive advantage. Tryg’s Corporate business is actively increasing prices and reducing exposure to unprofitable segments and expects profitability to improve in 2021 and the following years. Synergies from the Alka transaction were DKK 28m in Q1 2021 (accumulated DKK 204m against target of DKK 300m), of which DKK 8m stemmed from re-duced costs, DKK 8m from claims and DKK 12m from revenue-related initiatives.
Customer satisfaction increased from 83 in Q1 2020 to 84 in Q1 2021 in Denmark.
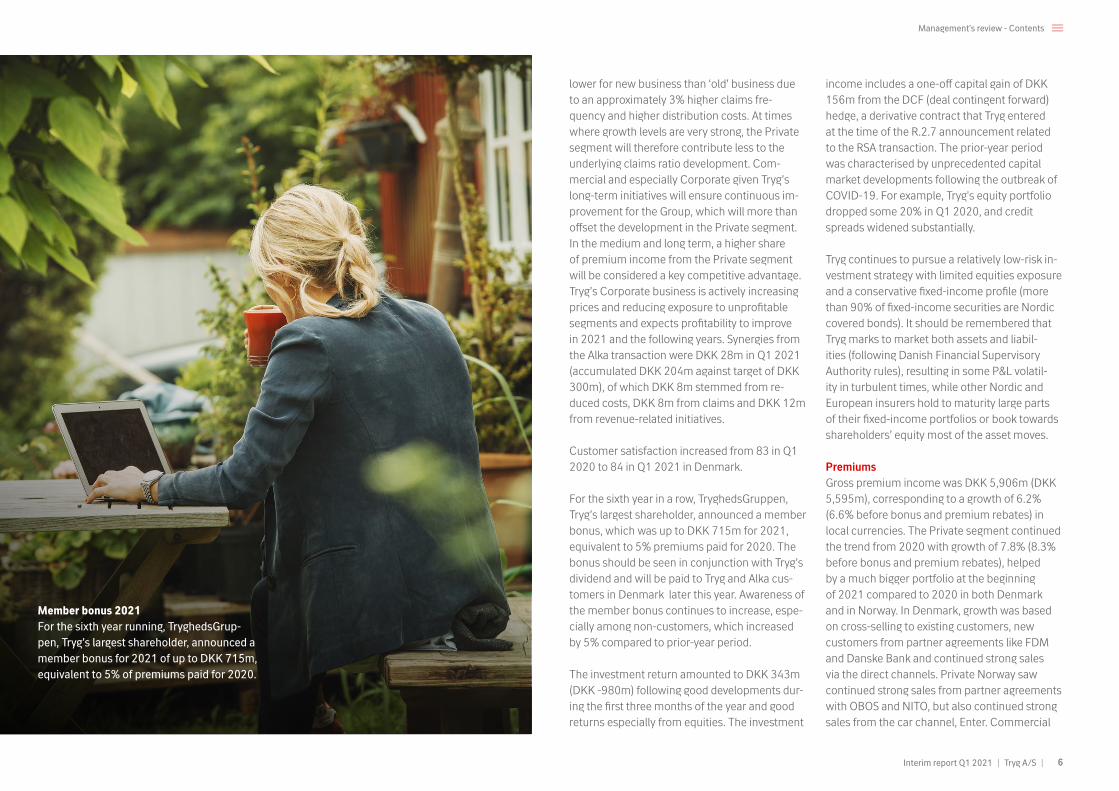
For the sixth year in a row, TryghedsGruppen, Tryg’s largest shareholder, announced a member bonus, which was up to DKK 715m for 2021, equivalent to 5% premiums paid for 2020. The bonus should be seen in conjunction with Tryg’s dividend and will be paid to Tryg and Alka cus-tomers in Denmark later this year. Awareness of the member bonus continues to increase, espe-cially among non-customers, which increased by 5% compared to prior-year period.
The investment return amounted to DKK 343m (DKK -980m) following good developments dur-ing the first three months of the year and good returns especially from equities. The investment
income includes a one-off capital gain of DKK 156m from the DCF (deal contingent forward) hedge, a derivative contract that Tryg entered at the time of the R.2.7 announcement related to the RSA transaction. The prior-year period was characterised by unprecedented capital market developments following the outbreak of COVID-19. For example, Tryg's equity portfolio dropped some 20% in Q1 2020, and credit spreads widened substantially.
Tryg continues to pursue a relatively low-risk in-vestment strategy with limited equities exposure and a conservative fixed-income profile (more than 90% of fixed-income securities are Nordic covered bonds). It should be remembered that Tryg marks to market both assets and liabil-ities (following Danish Financial Supervisory Authority rules), resulting in some P&L volatil-ity in turbulent times, while other Nordic and European insurers hold to maturity large parts of their fixed-income portfolios or book towards shareholders’ equity most of the asset moves.
PremiumsGross premium income was DKK 5,906m (DKK 5,595m), corresponding to a growth of 6.2% (6.6% before bonus and premium rebates) in local currencies. The Private segment continued the trend from 2020 with growth of 7.8% (8.3% before bonus and premium rebates), helped by a much bigger portfolio at the beginning of 2021 compared to 2020 in both Denmark and in Norway. In Denmark, growth was based on cross-selling to existing customers, new customers from partner agreements like FDM and Danske Bank and continued strong sales via the direct channels. Private Norway saw continued strong sales from partner agreements with OBOS and NITO, but also continued strong sales from the car channel, Enter. Commercial
Member bonus 2021 For the sixth year running, TryghedsGrup-pen, Tryg’s largest shareholder, announced a member bonus for 2021 of up to DKK 715m, equivalent to 5% of premiums paid for 2020.
6
Management’s review - Contents
Interim report Q1 2021 | Tryg A/S |

realised a 5.3% increase in premiums based on continued growth in Denmark of 5.9% and more robust growth in Commercial Norway, which was partly ascribable to the acceptance of price hikes by large Commercial customers. The Corporate segment raised prices in all countries, which led to an increase in premiums for the Norwegian and Swedish business and a drop in premium income for Denmark. On top of this there were positive premium regulations in Norway. Private Sweden posted growth of 1.2%, partly driven by the impact of price adjustments in 2021 and churn due to price hikes.
ClaimsThe claims ratio net of ceded business was 73.1 (73.9). The Group’s underlying claims ratio im-proved to 74.7 (75.5), helped primarily by profita-bility initiatives in the Commercial and Corporate segments. The Private underlying claims ratio of 73.9 (73.9) was flat compared to Q1 2020. The current strong level of growth in the Private segment is likely to impact the underlying claims ratio somewhat as profitability is lower for new business compared to old business. At the same time, profitability initiatives in the Corporate seg-ment should help sustain the improvement in the Group’s underlying claims ratio. Tryg continues to expect an improved underlying claims ratio for the FY 2021. Following the COVID-19 pandem-ic, lower levels of economic activity due to the lockdown of societies have impacted the claims ratio positively by 1.3%. It should be noted that the lockdowns imposed in Denmark and Norway have been very different from the lockdowns in most large European countries. In Q1, schools were, for example, partially closed, employees strongly recommended to work from home, and non-essential shops were also closed, while households remained free to move around with no personal restrictions.
In Scandinavia, the weather was very cold, especially in Norway, which recorded the lowest temperatures for more than ten years in January, but Denmark also had a period with very cold weather. This led to a high level of frost claims, however the total level of weather claims were lower than for an average Q1 character-ised by seasonal storms, which can be harsh at times. Weather claims were DKK 130m (DKK 111m), or 2.2% (2.0%) of the claims ratio. Large claims impacted the claims ratio negatively by 2.0% (2.4%), which is below average quarterly expectations and also below Q1 2020. Tryg’s assumptions for the full year are based on large claims of DKK 550m (with no seasonality) and weather claims of DKK 600m (mostly in Q1 and Q4).
ExpensesThe expense ratio was 14.1 (14.1). At the capital markets day at the end of 2017, Tryg announced an expense ratio target for 2020 of around 14, as IT investments and an increase in employee numbers (especially in the short term) are expected to be broadly offset by continuous effi-ciency improvements, driven primarily by lower distribution costs. The overall development in the expense ratio is likely to remain unchanged in 2021. Cost synergies of DKK 8m from the Alka transaction also helped the expense ratio, but at the same time high premium growth in the Private segment led to an increase in distribu-tion costs.
Investment activitiesInvestment income was DKK 343m (DKK -980m). The development in the capital markets was positive in the quarter with equities return-ing 7%. Both the free and match portfolios re-ported positive returns. Tryg has booked in Q1 a one-off gain of DKK 156m under other financial
income & expenses, this stems from the value adjustmentof the DCF hedge contract (a deriva-tive contract that Tryg entered at the time of the R.2.7 announcement related to the RSA acqui-sition) reflecting a favourable currencies move between GBP and DKK. The prior-year period in 2020 saw unprecedented turbulence in the capi-tal markets following the outbreak of COVID-19. Leading equity indices dropped some 25-30% in three weeks in March, credit spreads widened, and a severe pressure was seen across all asset classes. The difference in returns on equities in the two comparable quarters was approximately 27%, which explains half of the difference in the overall investment income (excluding the one-off gain from the DCF hedge).
Profit before and after taxProfit before tax was DKK 1,022m (DKK -372m), while the profit after tax was DKK 814m (DKK -442m). The total tax bill was DKK 208m (DKK 70m). It should be noted that capital gains on equities reduce the tax rate, while the opposite happens in quarters with negative equity market developments.
Dividend and capitalAt the time of publication of the annual report, Tryg mentioned an expected dividend range of DKK 2.6-3.0bn for 2021. Tryg will be paying a Q1 dividend of DKK 700m or DKK 1.07 per share (based on the new number of shares following the rights issue). The quarterly dividend is ex-pected to remain flat, even in a ‘transition’ year like 2021 where various items – such as equity accounting of acquired assets, transaction costs and restructuring costs – will be recognised in the P&L compared to a normal year.
7
Management’s review - Contents
Interim report Q1 2021 | Tryg A/S |

Business initiativesIn 2021, Tryg will continue to build on the foundation for customer and sales excellence established during the most recent strategy period (2018-2020). This will entail enhancing some of the strategic initiatives associated with the 2020 targets. Additionally, 2021 will see a strong focus on the B2B segment, and initiatives will be implemented to grow the Commercial segment and increase profitability in the Corpo-rate segment.
PrivateTryg continues to develop offerings to ensure that Tryg remains relevant in the market, and that Tryg’s customers feel ‘tryg’, i.e. protected and cared for. Tryg does this by making it easy to be a customer with Tryg, and by offering products and services that deliver tangible advantages to the customers, such as preventive elements as part of the insurance products.
In Q1 2021, Tryg did so by offering approximately 7,000 customers with a child accident insurance the chance to do an online first-aid course focus-ing on first aid for children at a discounted rate. In Denmark, approximately 175,000 children are involved in accidents and taken to an emergency department a year. Administering first aid within the first few minutes of an accident happening can be essential, and parents play a vital role in this context.
In Q1 2021, Tryg also launched a new version of the contents insurance, which includes three different preventive elements related to cycling: 1) A bicycle helmet with a GPS tracker that
sends a message to a relative if one crashes, 2) a bicycle alarm, and 3) a built-in GPS tracker that can locate the bicycle, if stolen. These types of prevention are designed to make customers feel more ‘tryg’, but are also expected to prevent claims.
In Q1 2021, Alka Mobile was launched. Alka Mobile is a low-price mobile phone subscription offered to all Alka customers as well as union members, which means that a total of approxi-mately 2.5m people in Denmark are eligible for the Alka Mobile subscription. With this offering, Alka is seeking to deliver a solution to customers and union members that comes with tangible financial advantages.
Finally, in Sweden, Moderna has increased the number of online self-service functionalities on offer, making it even easier to be a customer with Moderna. The new functionalities include more options for adjusting existing insurances in the online universe as well as the implemen-tation of robotic process automation solutions to ensure that processes are as efficient as possible.
Business to businessIn 2021, focus is on growing the busi-ness-to-business (B2B) segments, primarily small and medium-sized businesses, while maintaining a strong profitability focus. Due to COVID-19, many commercial businesses have been forced to adapt to new and challenging conditions. For example, employees are working significantly more from home. To support
Commercial customers, Tryg is offering the Norwegian Commercial customers a new Home Office product, which provides the same cover for their employees, whether they are working from home or at their workplace.
In Denmark, a new packaged product – Tryg Business – targeting small and medium-sized Commercial customers has been launched to kick-start the strong B2B growth focus in 2021. The product seeks to reduce complexity by bundling the most relevant insurance products, while also incorporating preventive elements such as annual online workplace assessments. With ‘Tryg Tilbage’ (‘Tryg Return’), customers are offered additional help in case an employee suffers an accident.
ClaimsIn Tryg’s Danish and Norwegian claims organisa-tions, the implementation of a new and more ef-fective claims handling system continues. In Q1 2021, accident insurance in both Denmark and Norway was added, as well as workers’ com-pensation insurance in Norway. The new claims handling system boosts the quality of the claims handling process by ensuring that all the correct information is collected, and that the customer receives payment as fast as possible. In the new system, many simple claims types, such as travel claims, are handled as straight-through pro-cessing (STP), which is a fully automated claim handling. In 2021, more than 125,000 claims are expected to be handled as STP.
Corporate ResponsibilityIn January 2021, Tryg launched its new Corpo-rate Responsibility strategy: ‘Driving sustainable impact’. The strategy includes supporting our customers in the green transition by offering sustainable insurance products and sustainable claims handling solutions.
In order to be able to offer sustainable claims handling, Tryg will give priority to working with sustainable suppliers. Therefore, Tryg has started screening suppliers for compliance and performance. Tryg evaluates suppliers based on the minimum requirements described in Tryg’s Supplier Code of Conduct and performs an ESG (Environmental, Social and Governance) risk screening.
A practical example on how Tryg works with sustainability is the focus on ‘smart repair’. In Q1 2021, Tryg established collaboration with a number of repair shops and car importers in Denmark. The purpose is to reduce plastic waste by repairing bumpers instead of replacing them. Every year Tryg/Alka pays for having approxi-mately 30,000 bumpers replaced. In 2021, the goal is to repair at least 25% of all damaged bumpers, entailing in an estimated waste reduction of 15-20 tonnes plastic. To ensure that repairing is an attractive option for suppliers, the base payment has been increased regardless of time consumption, in addition to which Tryg is offering to support repair shops that do not have the skills and equipment needed to carry out repair.
8
Management’s review - Contents
Interim report Q1 2021 | Tryg A/S |
Alka synergiesIn connection with the acquisition of Alka, Tryg communicated a guidance of DKK 300m of synergies, which are expected to be achieved in 2021. The realisation of synergies is progressing according to plan, and in Q1 2021, further syner-gies totalling DKK 28m were achieved, bringing total synergies to DKK 204m. In the quarter claims and expense synergies amounted to DKK 8m each and revenue synergies amounted to DKK 12m.
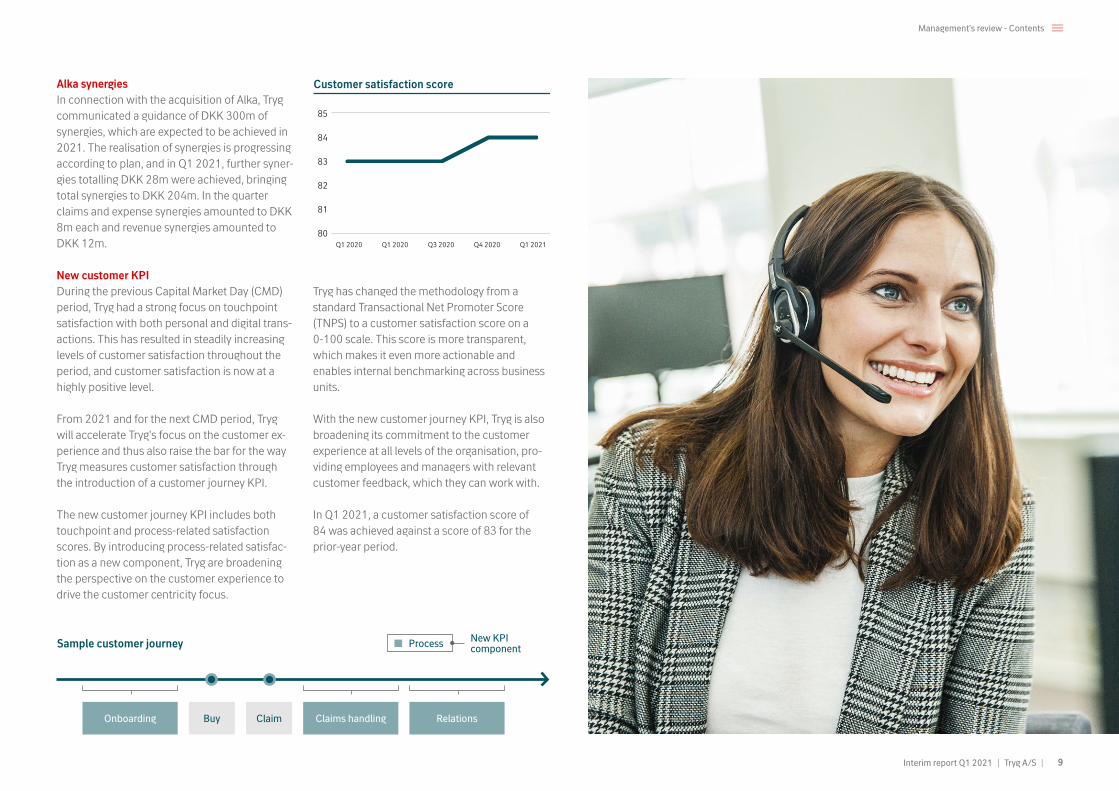
New customer KPIDuring the previous Capital Market Day (CMD) period, Tryg had a strong focus on touchpoint satisfaction with both personal and digital trans-actions. This has resulted in steadily increasing levels of customer satisfaction throughout the period, and customer satisfaction is now at a highly positive level.
From 2021 and for the next CMD period, Tryg will accelerate Tryg's focus on the customer ex-perience and thus also raise the bar for the way Tryg measures customer satisfaction through the introduction of a customer journey KPI.
The new customer journey KPI includes both touchpoint and process-related satisfaction scores. By introducing process-related satisfac-tion as a new component, Tryg are broadening the perspective on the customer experience to drive the customer centricity focus.
Tryg has changed the methodology from a standard Transactional Net Promoter Score (TNPS) to a customer satisfaction score on a 0-100 scale. This score is more transparent, which makes it even more actionable and enables internal benchmarking across business units.
With the new customer journey KPI, Tryg is also broadening its commitment to the customer experience at all levels of the organisation, pro-viding employees and managers with relevant customer feedback, which they can work with.
In Q1 2021, a customer satisfaction score of 84 was achieved against a score of 83 for the prior-year period.
Sample customer journey
Onboarding Claims handling RelationsBuy
Process New KPI component
Claim
Customer satisfaction score
Q1 2020 Q1 2020 Q3 2020 Q4 2020 Q1 2021
85
84
83
82
81
80
9
Management’s review - Contents
Interim report Q1 2021 | Tryg A/S |

Private Key figures – Private
DKKm Q1 2021 Q1 2020 2020
Gross premium income 3,371 3,162 12,743
Gross claims -2,443 -2,500 -8,883
Gross expenses -460 -433 -1,727
Profit/loss on gross business 468 228 2,133
Profit/loss on ceded business -57 85 -76
Insurance technical interest, net of reinsurance -4 -1 -12
Technical result 407 313 2,045
Run-off gains/losses, net of reinsurance 33 32 120
Key ratios
Premium growth in local currency (%) 7.8 10.4 9.0
Gross claims ratio 72.5 79.1 69.7
Net reinsurance ratio 1.7 -2.7 0.6
Claims ratio, net of reinsurance 74.2 76.4 70.3
Gross expense ratio 13.6 13.7 13.6
Combined ratio 87.8 90.1 83.9
Combined ratio exclusive of run-off 88.8 91.1 84.8
Run-off, net of reinsurance (%) -1.0 -1.0 -0.9
Large claims, net of reinsurance (%) 0.0 0.5 0.2
Weather claims, net of reinsurance (%) 3.1 2.1 2.1
407m Technical result
(DKK)
Q1 2020: 313m
87.8Combined ratio
Q1 2020: 90.1
7.8%Premium growth(local currencies)
Q1 2020: 10.4%
13.6Expense ratio
Q1 2020: 13.7
Financial highlights Q1 2021
Private encompasses the sale of insurance products to private individuals in Denmark and Norway. Sales are distributed via call centres, the Internet, Tryg’s own agents, Alka (Denmark), franchisees (Norway), interest organisations, car dealers, estate agents and Danske Bank branches. The business area accounts for 57% of the Group’s total premium income.
Results Private reported a technical result of DKK 407m (DKK 313m) and a combined ratio of 87.8 (90.1). The results were impacted by a good growth in the Private business, an increase in weather claims in both Denmark and Norway, and a sta-ble run-off result. The underlying claims devel-opment was flat compared to the corresponding quarter last year due to the high premium growth reported in the Private segment. The net positive impact from COVID-19 in the Private segment was 1.9% of the combined ratio, driven primarily by a much lower level of travel claims and a slightly reduced claims frequency for other main products.
Premiums Gross premium income was 7.8% (10.4%) when measured in local currencies and 8.3% before bonus and premium rebates, which were at a high level because of strong profitability of partner agreements. The positive development continued in the Danish part of Private with pre-mium growth of 7.5% (9.0% before bonus and
premium rebates), based on high sales levels for partner agreements, cross-selling and continued strong performance by the independent agent sales channel. Private Norway reported growth of 8.3% in local currencies, which was posi-tively impacted by the good growth achieved in 2020, resulting in a much bigger portfolio at the beginning of 2021 and driven by strong sales from Enter (the Norwegian car channel), OBOS and NITO. Growth was also helped by the financial troubles encountered by a number of small insurers. The retention rate was 89.9 (91.4) for the Danish part of the business being impacted by churn due to the cancellation of the Nordea agreement. Excluding the Nordea churn the retention rate was 91.1, and still there was a net positive impact when looking at Nordea and Danske Bank in combination. In Norway, Tryg re-ported a positive development with a retention rate of 88.2 (87.2).
Claims The claims ratio, net of ceded business, was 74.2 (76.4), impacted by a higher level of
The business area accounts for 57% of the Group’s total premium income.57%
10
Management’s review - Contents
Interim report Q1 2021 | Tryg A/S |

weather claims in both Denmark and Norway compared to the prior-year period. In Norway, some of the coldest temperatures for more than ten years were recorded, leading to frost-relat-ed claims. In Denmark, there was also a very high level of frost-related claims compared to previous years. The underlying claims develop-ment, excluding the net impact from COVID-19, was flat driven by a mix of good growth, claims handling initiatives and synergies related to the Alka integration. COVID-19 had a net positive impact of 1.9 percentage points in the Private segment, driven by a very low frequency of travel claims and somewhat lower claims frequency for other products such as contents insurance due to fewer burglaries (as more people have been working from home due to the COVID-19 pandemic). In the motor insurance segment, the number of claims was up 4%, primarily reflect-ing a higher number of insured cars compared to the prior-year period.
Expenses The expense ratio for Private was 13.6 (13.7), which was supported by synergies related to the Alka acquisition and distribution initiatives. The use of independent agents in Denmark remains an important driver for more efficient distribution, but at the same time Tryg also sees an improved performance for traditional sales channels. Employee numbers totalled 1,334 at the end of the quarter against 1,344 at the end of 2020 and were impacted by reductions primarily in Denmark.New initiative in car repair
In Q1, Tryg launched a new initiative with an increased focus on repair and re-use of
cars’ plastic parts which means both reduc-tions in claims costs and CO
2 emissions.
11
Management’s review - Contents
Interim report Q1 2021 | Tryg A/S |

CommercialCommercial encompasses the sale of insurance products to small and medium-sized businesses in Denmark and Norway. Commercial also includes ‘Tryg Garanti’ a). Sales are distributed via Tryg’s own sales force, brokers, Alka (Denmark), franchisees (Norway), customer centres as well as group agreements. The business area accounts for 22% of the Group’s total premium income.
ResultsCommercial reported a technical result of DKK 222m (DKK 142m) and a combined ratio of 82.5 (88.5). The results were impacted by a signifi-cantly lower level of large claims compared to Q1 2020, lower run-off and a somewhat lower level of weather claims. The net positive impact from COVID-19 was 0.9 on the combined ratio, driven primarily by travel claims but also a lower level of claims in other lines of business such as workers’ compensation insurance. A survey showed that Commercial had the highest brand awareness and highest customer satisfaction score among the ten largest companies in the Danish Commercial market.
Premiums Gross premium income totalled DKK 1,288m (DKK 1,233m), which represents a 5.3% increase when measured in local currencies. Commercial realised a high level of growth in
both Denmark and Norway. The Danish Com-mercial business reported growth of 5.9%, while the Norwegian Commercial business reported growth of more than 3.7%, which was driven by price hikes for large Commercial customers and healthy growth for small and medium-sized customers.
The retention rate for Denmark was unchanged at 88.5 (88.5) with continued strong customer focus, as witnessed by a public survey published in mid-March showing that Commercial DK had the highest scores in both brand recognition and customer satisfaction. In Norway, the retention rate was unchanged at 89.2 (89.2).
Claims The claims ratio, net of ceded business, was 65.6 (71.8). The lower level was primarily attributable to a much lower level of large
The business area accounts for 22% of the Group’s total premium income.22%
Key figures – Commercial
DKKm Q1 2021 Q1 2020 2020
Gross premium income 1,288 1,233 4,930
Gross claims -804 -958 -3,167
Gross expenses -218 -205 -831
Profit/loss on gross business 266 70 932
Profit/loss on ceded business -41 72 -130
Insurance technical interest, net of reinsurance -2 0 -5
Technical result 222 142 798
Run-off gains/losses, net of reinsurance 52 100 348
Key ratios
Premium growth in local currency (%) 5.3 6.3 5.5
Gross claims ratio 62.4 77.7 64.2
Net reinsurance ratio 3.2 -5.9 2.6
Claims ratio, net of reinsurance 65.6 71.8 66.9
Gross expense ratio 16.9 16.6 16.9
Combined ratio 82.5 88.5 83.7
Combined ratio exclusive of run-off 86.6 96.5 90.7
Run-off, net of reinsurance (%) -4.1 -8.1 -7.1
Large claims, net of reinsurance (%) 0.0 7.0 1.8
Weather claims, net of reinsurance (%) 1.7 3.0 1.6
222m Technical result
(DKK)
Q1 2020: 142m
82.5Combined ratio
Q1 2020: 88.5
5.3%Premium growth(local currencies)
Q1 2020: 6.3%
16.9Expense ratio
Q1 2020: 16.6
Financial highlights Q1 2021
a) Tryg Garanti (Credit & Surety business) has been transferred from the Corporate segment to the Commercial segment in Q1 2021 - comparative figures have been restated accordingly.
Interim report Q1 2021 | Tryg A/S | 12
Management’s review - Contents

claims compared to 2020. The claims level was positively impacted by an improved underlying claims level and a slightly lower level of weather claims and negatively impacted by a somewhat lower run-off level. COVID-19 had a net positive impact of 0.9 percentage points, driven by travel insurance claims, a lower level of workers’ com-pensation claims and property claims.
Expenses The expense ratio was 16.9 (16.6). At the end of Q1 2021, Commercial had 625 employ-ees against 617 at the end of Q4 2020 due to strengthened distribution in Denmark. Commer-cial Denmark still sees strong potential in using independent sales agents as part of improving the distribution set-up.
Alka MobilIn Q1, Alka started a new mobile compa-
ny in Denmark called `Alka Mobil´. Alka Mobil offers attractive prices and other
loyalty benefits for customers in Alka and members of the unions Alka works with,
equivalent to 2.5 million Danes.
Interim report Q1 2021 | Tryg A/S | 13
Management’s review - Contents

CorporateCorporate sells insurance products to corporate customers un-der the brands ‘Tryg’ in Denmark and Norway, and ‘Moderna’ in Sweden. Sales are affected both via Tryg’s own sales force and via insurance brokers. Moreover, customers with international insurance needs are served by Corporate through its cooperation with the AXA Group. The business area accounts for 15% of the Group’s total premium income.
ResultsCorporate reported a technical result of DKK 47m (DKK 180m), with a combined ratio of 94.4 (78.8). The much lower technical result was due to a substantially increased level of large claims but also further improvement to underlying claims levels, primarily in Norway but also in Denmark and Sweden. In general, all Corporate areas continues to have initiatives to improve profitability through changed portfolio mixes and price initiatives for segments and products. It is particularly important to look at underlying developments in the Corporate business as headline profitability can be severely impacted by large claims. In Q1 2021, large claims repre-sent some 13.8% of the Corporate combined ratio vs 3.9% in the prior-year period. Renewals on 1 January were positive across all geogra-phies with a generally high level of acceptance of price increases. The net positive impact from COVID-19 was 0.4 on the combined ratio, which was positively impacted by workers’ compensa-tion and travel claims.
Premiums Gross premium income totalled DKK 875m (DKK 846m), representing an increase of 3.8% when measured in local currencies. The devel-opment was driven by a mix of price increases, pruning of portfolios and for Norway significant regulations to the premium income for 2020. Excluding the regulations premium growth was approximately 1 percent. The main focus of the Corporate segment remains to achieve a stable long-term profitability.
Claims The claims ratio, net of ceded business, was 84.2 (68.4) and driven by a very high level of large claims mainly due to one large property claim. Run-off was also at a high level although slightly down compared to the prior-year period. More importantly, underlying profitability continues to improve and, in this quarter, an improved un-derlying claims ratio was recorded in Denmark, Norway and Sweden primarily as a result of im-plemented price hikes. As mentioned, COVID-19
The business area accounts for 15% of the Group’s total premium income.15%
Key figures – Corporate
DKKm Q1 2021 Q1 2020 2020
Gross premium income 875 846 3,376
Gross claims -662 -597 -2,311
Gross expenses -90 -88 -367
Profit/loss on gross business 123 162 698
Profit/loss on ceded business -75 18 -294
Insurance technical interest, net of reinsurance -1 0 -2
Technical result 47 180 401
Run-off gains/losses, net of reinsurance 93 173 436
Key ratios
Premium growth in local currency (%) 3.8 4.8 1.5
Gross claims ratio 75.6 70.5 68.5
Net reinsurance ratio 8.5 -2.1 8.7
Claims ratio, net of reinsurance 84.2 68.4 77.2
Gross expense ratio 10.2 10.4 10.9
Combined ratio 94.4 78.8 88.0
Combined ratio exclusive of run-off 105.1 99.3 101.0
Run-off, net of reinsurance (%) -10.7 -20.5 -12.9
Large claims, net of reinsurance (%) 13.8 3.9 11.5
Weather claims, net of reinsurance (%) 0.1 0.7 0.6
47m Technical result
(DKK)
Q1 2020: 180m
94.4Combined ratio
Q1 2020: 78.8
3.8%Premium growth(local currencies)
Q1 2020: 4.8%
10.2Expense ratio
Q1 2020: 10.4
Financial highlights Q1 2021
Interim report Q1 2021 | Tryg A/S | 14
Management’s review - Contents

had little positive impact with 0.4 percentage points due to slight positive impact from primari-ly workers’ compensation and travel insurance.
Expenses The expense ratio was 10.2 (10.4), which is low and slightly lower than last year. In general, Corporate area will have lower expense ratios as customers pay the commission to the brokers. The number of employees in Corporate was almost unchanged from 212 at the end of 2020 to 215 in Q1 2021.
New CR strategyIn Q1, Tryg published its Corporate
Responsibility strategy for 2023: Driving sustainable impact. The strat-egy is based on three strategic pillars:
Responsible company, Green work-place and Sustainable insurance.
Interim report Q1 2021 | Tryg A/S | 15
Management’s review - Contents

SwedenSweden comprises the sale of insurance products to private customers under the ‘Moderna’ brand. Moreover, insurance is sold under the brands Atlantica, Bilsport & MC and Moderna Djurförsäkringar. Sales take place through its own sales force, call centres, partners and online. The business area accounts for 6% of the Group’s total premium income.
ResultsIn Q1 2021, Sweden Private (Moderna) reported a technical result of DKK 72m (DKK 35m) and a combined ratio of 80.5 (90.0). The improved result was primarily attributable to higher run-off gains and improved underlying claims level. Premium growth increased by 1.2% (4.9%) when measured in local currencies based on a combination of price adjustments and customer reaction to this.
PremiumsPremium income totalled DKK 372m (DKK 353m), equating to an increase of 1.2% when measured in local currencies. As mentioned, the increase was partly driven by price adjustments, customer reactions and organic growth. Organic growth was helped through partner agreements with Danske Bank, Akademiker Försäkringer and OBOS in Sweden.
ClaimsThe claims ratio, net of ceded business, was 63.2 (71.9), which is much lower compared to the prior-year period. The lower claims ratio was driven especially by a higher run-off level related to motor insurance and an improved underlying claims ratio driven primarily by the initiatives to improve motor insurance through price adjust-ments in 2020.
ExpensesThe expense ratio was 17.3 (18.1). The expense level was lower compared to the prior-year peri-od, which did not represent a trend but reflects some volatility between quarters. At the end of the quarter, the number of employees was 318, which was a decrease of 5 employees compared to Q4 2020.
The business area accounts for 6% of the Group’s total premium income.6%
72m Technical result
(DKK)
Q1 2020: 35m
80.5Combined ratio
Q1 2020: 90.0
1.2%Premium growth(local currencies)
Q1 2020: 4.9%
17.3Expense ratio
Q1 2020: 18.1
Financial highlights Q1 2021
Key figures – Sweden
DKKm Q1 2021 Q1 2020 2020
Gross premium income 372 353 1,604
Gross claims -235 -260 -1,067
Gross expenses -64 -64 -269
Profit/loss on gross business 73 30 268
Profit/loss on ceded business -1 6 1
Insurance technical interest, net of reinsurance -1 0 -1
Technical result 72 35 268
Run-off gains/losses, net of reinsurance 75 53 249
Key ratios
Premium growth in local currency (%) 1.2 4.9 4.9
Gross claims ratio 63.0 73.5 66.5
Net reinsurance ratio 0.2 -1.6 -0.1
Claims ratio, net of reinsurance 63.2 71.9 66.4
Gross expense ratio 17.3 18.1 16.8
Combined ratio 80.5 90.0 83.2
Combined ratio exclusive of run-off 100.8 105.1 98.8
Run-off, net of reinsurance (%) -20.3 -15.1 -15.5
Weather claims, net of reinsurance (%) 0.8 0.3 0.1
Interim report Q1 2021 | Tryg A/S | 16
Management’s review - Contents

Investment activitiesInvestment income totalled DKK 343m (DKK -980m) in Q1 2021, driven by a return of DKK 193m (DKK -713m) on the free portfolio, a return of DKK 72m (DKK -203m) on the match portfolio and other financial income and expens-es of DKK 78m (DKK -64m).
The total market value of Tryg’s investment portfolio was DKK 42.9bn at 31 March 2021. The investment portfolio consists of a match portfolio of DKK 30.6bn and a free portfolio of DKK 12.3bn. The match portfolio is composed of low-risk fixed income assets that mirror the Group’s insurance liabilities, and fluctuations resulting from interest rate changes are there-fore offset to the greatest possible extent. The free portfolio reflects the Group’s capital, it is invested in a global multi-asset low risk portfolio strategy, predominantly in fixed income securi-ties with a short duration but also in equities and properties.
Free portfolio Capital markets developments, especially within equities, were markedly positive compared to the corresponding period. Macroeconoic expec-tations are improving driven by an accelerated roll-out of COVID-19 vaccination programmes (in some countries faster than others) while while there remains significant differences in the lock-down (or re-opening) across coun-tries, where the Nordic countries manage the situation relatively well compared to many other countries. Equity markets performed well and Tryg’s equity portfolio was up approximately 8% (-19% in prior-year period) in the quarter. Interest rates move upward since the beginning
of the year and this has driven a mark to market loss on the fixed income portfolio. Properties returned a 1.2% (-3.7%) broadly in line with normalized expectations. Tryg’s free portfolio was up 1.6% (-6.5%) in Q1 2021 with the prima-ry driver being the performance of equities as explained above.
Match portfolioThe result of the match portfolio is the differ-ence between the return on the match portfolio and the amount transferred to the technical result. The result can be split into a “regula-tory deviation” and a “performance result”. The “regulatory deviation” reported a positive contribution of DKK 39m (DKK -90m), driven by a gain on Norwegian liabilities (following the increased interest rates) which was slightly high-er compared to the loss on the asset side. The “performance” result represented a positive con-tribution of DKK 33m (DKK -113m) as Nordic covered-bond spreads narrowed slightly.
Other financial income and expensesOther financial income and expenses totalled DKK 78m (DKK -64m). This item consists of a number of elements, the largest being the interest expenses associated with Tryg loans (Tier 2 and Tier 1 loans), the hedging of foreign currency exposure and expenses related to the investment management team.
Other financial income and expenses in Q1 included a positive gain of DKK 156m on the DCF (deal contingent forward) hedge, a derivative contract that Tryg entered at the time of the R.2.7 announcement. The financial gain
Return - Investments
DKKm Q1 2021 Q1 2020 2020
Free portfolio, gross return 193 -713 585
Match portfolio, regulatory deviation and performance 72 -203 -19
Other financial income and expenses 78 -64 -255
Total investment return 343 -980 311
Return - match portfolio
DKKm Q1 2021 Q1 2020 2020
Return, match portfolio -244 235 548
Value adjustments, changed discount rate 321 -406 -530
Transferred to insurance technical interest -5 -32 -37
Match, regulatory deviation and performance 72 -203 -19
Hereof:
Match, regulatory deviation 39 -90 -48
Match, performance 33 -113 29
Return - free portfolioInvestment assets
DKKmQ1
2021Q1 2021
(%)Q1
2020Q1 2020
(%) 31.03.2021 31.12.2020
Bonds -7 -0.2 7 0.2 3,811 3,987
Credit bonds -53 -2.4 -225 -10.5 2,115 1,744
Investment grade credit -16 -2.0 -47 -4.7 751 845
Emerging market bonds -16 -2.5 -85 -15.7 631 447
High-yield bonds -21 -2.8 -93 -15.5 733 452
Diversifying Alternatives a) 11 1.1 -8 -1.3 942 647
Equity b) 208 8.2 -401 -18.9 2,715 1,785
Real Estate 34 1.2 -85 -3.7 2,752 2,331
Total 193 1.6 -713 -6.5 12,335 10,494a) Diversifying Alternatives concists of CAT Bonds and a tactical mandate including both bonds, interest based investment funds
and equity based investment funds.b) In addition to the equity portfolio exposure is derivatives contracts of DKK -118m.
is driven by the positive development in the exchange rate between GBP and DKK during the aforementioned period from R2.7 and until RSA shareholders’ vote.
Long-term expectations for this line are un-changed at slightly more than DKK -60m on a quarterly basis as disclosed previously.
Interim report Q1 2021 | Tryg A/S | 17
Management’s review - Contents

Solvency and dividendThe reported solvency ratio (based on Tryg’s partial internal model) was 899 at the end of Q1 compared to 183 at year-end 2020. The unusu-ally high solvency ratio is primarily a function of the rights issue conducted in March (new net eq-uity of approximately DKK 36.3bn raised), while the acquisition of Codan Norway, Trygg-Hansa and 50% of Codan Denmark is expected to close towards the end of Q2. Upon closing, both the own funds and SCR will reflect the required as-sets. Adjusted for the rights issue, the solvency ratio would be around 180 after deduction of the Q1 dividend of DKK 700m.
Own funds Own funds totalled DKK 46,058m at the end of Q1 (DKK 8,884m at the end of 2020). Own funds were positively impacted by the new equi-ty raised (approximately DKK 36.3bn) and by the reported net profit for the quarter, and negative-ly impacted by the DKK 700m dividend payment in the quarter. Tryg issued a new Tier 1 loan of SEK1bn in Q1 as part of the financing of the RSA transaction, an equivalent amount of Tier 2 loans has been called back in April. Additionally, in Q2 a new Tier 2 loan of DKK 1.5-2.0bn will be issued to optimise the post-transaction capital structure. The solvency capital requirement increased by DKK 268m, driven primarily by a higher market risk capital charge following the positive capital market development in the quarter. Tryg’s own funds consist predominantly of shareholders’ equity and subordinated loans.
Solvency capital requirementTryg calculates its individual solvency capital requirement based on a partial internal model in accordance with the Danish Financial Superviso-ry Authority’s Executive Order on Solvency and Operating Plans for Insurance Companies. The model is based on the structure of the standard model. Tryg uses an internal model to evaluate insurance risks, while other risks are calculated using standard model components.
The solvency capital requirement, calculated using the partial internal model, was DKK 5,123m (DKK 4,855m at year-end 2020), and the increase since the end of 2020 was primarily driven by a higher market risk charge following the positive equity market developments. The solvency capital requirement based on the standard formula was DKK 6,859m in Q1 2021 against DKK 6,608m at the end of 2020.
Solvency ratio expected above 170 at the end of 2021Tryg has disclosed at the time at the R2.7 announcement and confirmed when publishing the annual report, that it expects a solvency ratio at 170 at year-end 2021. That expectation remains unchanged. On a quarterly basis, the solvency ratio will be impacted by the closing of the rights issue in Q1, the expected closing of the transaction in Q2 and the booking of related transaction costs and restructuring costs.
Solvency Capital Requirement(DKKm)
Q4 2020 Q1 2021
5,1234,855
Own funds(DKKm)
Q4 2020 Q1 2021
8,884
46,058
Shareholder remuneration(DKK per share)
2016 2017 2018 2019 2020 Q1 2021
Ordinary dividend Extraordinary dividend
1.65
6.86.46.2
3.33.5
6.6
1.07*
7.0
RatingTryg has an “A1” (stable outlook) insurance finan-cial strength rating (IFSR) from Moody’s. The rating agency highlights Tryg’s strong position in the Nordic P&C market, robust profitability, very good asset quality and relatively low financial leverage. Moody’s also assigned an “A3” rating to Tryg’s subordinated debt and Baa3 rating to the Tier 1 notes. All ratings were confirmed following the announcement of the RSA Nordic assets acquisition.
* Calculated on the new 654m number of shares
Interim report Q1 2021 | Tryg A/S | 18
Management’s review - Contents

Recommended offer for RSA Insurance Group plc
Establishing the biggest non-life insurer in Scandinavia and becoming #3 insurer across all Scandinavian countries
Sweden Norway Denmark
Tryg technical result pre-acquisition, Five-year avg., %1
Tryg technical result post-acquisition, Pro-forma, %2
Expected deal returns
Synergies to be realised (DKKm)
~7 ~17% ~16% #1EPSROI Market share
(Pro-forma)
42% DK
27% NO
10% NO
6% SE
48% SE
67% DK
Market share (Pro-forma)
Remain #1 player
High-teens EPS accretion in 2023
1) Five-year average, 2015-2019 2) Pro-forma technical result based on reported five-year historical average contribution by country
for Tryg and Denmark, Sweden, Norway, plus estimated transaction synergies by country
Source: Investor Presentation: Recommended Offer for RSA Insurance Group plc (available on tryg.com)
Expected deal closing
(Q2 2021)
Separation estimated complete (Q1 2022)
Financial outlook 2021 outlook The three-year strategy period ended in 2020 with Tryg meeting all its financial targets. A new Capital Markets Day was initially scheduled for 28 January 2021 but has been postponed until the autumn following the recommended cash offer for RSA Insurance Group plc and pending approval by the regulatory authorities. The ac-quisition is considered transformational as it will create the largest Scandinavian non-life insurer, and doubling the pro-forma technical result. Therefore, the inclusion of the acquired asset in future financial targets is deemed essential for Tryg’s next Capital Markets Day.
Tryg has decided to publish a detailed outlook for 2021 together with the annual report. It is important to note that Tryg will not publish annual financial guidance going forward (i.e. in future annual reports) but will always refer to the financial targets presented at the next Capital Markets Day in autumn 2021 for the next three years ending in 2024.
~60
~350
~650
~900
2024202320222021
Public announcement
on 18 November 2020
Shareholder vote Tryg on 18 December
2020, RSA on 18 January 2021
Rights issue (Q1 2021)
Norwegian, Swedish and Danish antitrust approvals
and Danish FSA
Tier 1 capital notes issuance and call of Tier
2 loan
19
Management’s review - Contents
Interim report Q1 2021 | Tryg A/S |

Tryg stand-alone
Tryg stand-alone 2021 outlook (DKK)
Codan Norway and Trygg-Hansa 2018-2020 (simplified P&L)
Tryg (excluding RSA’s assets) still expects a technical result in the range of DKK 3.3-3.7bn in 2021. The range is due to the natural volatil-ity of large and weather claims and the more challenging macroeconomic outlook (compared to past years), which could impact the top line, especially in the Commercial and Corporate segments. The low end of the range would imply a significantly higher level of weather and large claims compared to a normalised guidance of large claims of DKK 550m and weather claims of DKK 600m a year. Run-off gains are expected to be between 3-5%. Tryg has guided previously for a normalised investment income between DKK 0 and DKK 200m. The investment result totalled DKK 343m in Q1, and the updated forecast is therefore for an investment result between DKK ~350m and DKK 500m. A news-letter explaining all the moving parts is available on tryg.com. Additionally, a link on tryg.com provides daily updates on the return of the free portfolio (the capital of the company) for greater transparency about the overall investment income. Other income and costs in the P&L are
expected to be between DKK -150m and DKK -250m. Tryg is booking in this line the deprecia-tion associated with the Alka acquisition, some holding company costs not related to the insur-ance portfolio and the income and costs related to selling pension products for Danske Bank.
Impact from RSA's assets The acquisition of RSA’s Norwegian and Swedish businesses and 50% of RSA’s Danish business is expected to be approved before the end of Q2. Based on this assumption, RSA’s assets are expected to be ‘equity-accounted’ for in H2 2021. Tryg will book the net profit contri-bution (for the relevant period) of the acquired assets under ‘income from associates’ under investment activities. In the table taken from the rights issue prospectus, it is possible to see the results for the past three years of Codan Norway and Trygg-Hansa consolidated. Tryg has disclosed total costs of DKK 4.4bn related to the RSA transaction. Some of these costs will be booked in the P&L while some will be recognised in the balance sheet. During 2020,
the deal-contingent forward hedges (derivative contracts entered into to ensure certainty of funds at the time of R.2.7 announcement) were booked with no impact on P&L. During 2021, the cost of DKK 1.3bn related to the cost of the contracts will be expensed in the P&L if the acquisition is completed. It is important to note
Solvency and dividends Tryg has announced dividends of between DKK 2.6bn and DKK 3.0bn for FY 2021. A quarterly dividend of DKK 700m has been announced
that the cost related to the DCF hedge is not tax-deductible, it is likely that this amount will be booked against the investment income line in Q2 assuming closing of the transaction before June 30. Additionally, DKK 1.6bn pertaining to underwriting fees for the rights issue and to the fees of financial and legal advisers will all be booked in the balance sheet, approximately DKK 700m (out of the DKK 1.6bn) has been booked in Q1 as deduction from shareholder equity. To-tal restructuring costs of DKK 1.5bn will also be booked in the P&L. At the time of writing, some DKK 500m is expected to be booked in 2021, and the remaining DKK 1bn in 2022. However, the exact timing remains uncertain as it depends on the closing of the transaction and relative integration. A first draft of the purchase price allocation shows likely annual amortisation of intangible assets (after tax) in the range of DKK 600-800m expected from 2022.
for Q1 2021. Tryg has previously disclosed an expected solvency ratio above 170 at year-end 2021. That expectation remains unchanged.
2018 2019 2020
Gross premium income 10,037 9,987 9,843Gross premium growth (in local currencies)a) 1.0% 1.2%Technical result 2,000 2,200 1,975Investment result -345 361 -618Other costs -58 - -120Pre-tax profit 1,597 2,561 1,237a) Excluding a DKK 180m write-off in 2020 of prior year Swedish customer debt in 2020
3.3 - 3.7bnTecnical result
~350 - 500mInvestment income
-150 and -250m Other income and costs
Costs related to RSA transaction
DKKbn P&LBalance
sheet
2021
Transaction costs (excluding restructuring) 1.3* 1.6*
Restructuring costs 0.5
2022
Restructuring costs 1.0
Total 4.4
*Non-tax deductible
20
Management’s review - Contents
Interim report Q1 2021 | Tryg A/S |

Financial calendar 2021
19 Apr. 2021 Tryg shares are traded ex-dividend 21 Apr. 2021 Payment of Q1 dividend 09 July 2021 Interim report Q2 and H1 12 July 2021 Tryg shares are traded ex-dividend 14 July 2021 Payment of Q2 dividend12 Oct. 2021 Interim report Q3 and Q1-Q313 Oct. 2021 Tryg shares are traded ex-dividend15 Oct. 2021 Payment of Q3 dividend
21
Management’s review - Contents
Interim report Q1 2021 | Tryg A/S |

Notes Contents – Financial statements Q1 2021
Financial statements
23 Statement by the Supervisory Board and the Executive Board
24 Financial highlights 25 Income statement 26 Statement of comprehensive income 27 Statement of financial position 28 Statement of changes in equity 30 Cash flow statement 31 Notes 37 Quarterly outline
Tryg’s Group consolidated financial statements areprepared in accordance with IFRS.
22
Financial statements - Contents
22Interim report Q1 2021 | Tryg A/S |
Financial statements - Contents

Statement by the Supervisory Board and the Executive Board
Ballerup, 16 April 2021
Executive Board
Morten Hübbe Barbara Plucnar Jensen Lars Bonde Johan Kirstein Brammer Group CEO Group CFO Group COO Group CCO
Supervisory Board
Jukka Pertola Torben Nielsen Elias Bakk Gert Ove Mikkelsen Charlotte Dietzer Karen Bladt Claus WistoftChairman Deputy Chairman
Ida Sofie Jensen Lene Skole Tina Snejbjerg Mari Thjømøe Carl-Viggo Östlund Lone Møller Olsen
The Supervisory Board and the Executive Board have today considered and adopted the interim report for Q1 2021 for Tryg A/S.
The report, which is unaudited and has not been reviewed by the company’s auditors, is present-ed in accordance with IAS 34 Interim Financial Reporting, the Danish Financial Business Act
and the requirements of the NASDAQ Copenha-gen for the presentation of financial statements of listed companies.
In our opinion, the report gives a true and fair view of the Group’s assets, liabilities and finan-cial position at 31 March 2021 and of the results of the Group’s activities and cash flows for the period for the Group.
We are furthermore of the opinion that the management’s report includes a fair review of the developments in the activities and financial position of the Group, the results for the period and of the Group’s financial position in general and describes the principal risks and uncertain-ties that the Group faces.
Interim report Q1 2021 | Tryg A/S | 23
Financial statements - Contents

Financial highlightsDKKm
Q12021
Q12020 2020
NOK/DKK, average rate for the period 71.27 73.72 69.63
SEK/DKK, average rate for the period 73.62 70.53 70.95
Gross premium income 5,906 5,595 22,653
Gross claims -4,142 -4,316 -15,437
Total insurance operating costs -830 -787 -3,202
Profit/loss on gross business 933 491 4,014
Profit/loss on ceded business -174 181 -499
Insurance technical interest, net of reinsurance -9 -1 -20
Technical result 751 672 3,495
Investment return after insurance technical interest 343 -980 311
Other income and costs -72 -64 -265
Profit/loss before tax 1,022 -372 3,541
Tax -208 -70 -768
Profit/loss, continuing business 814 -442 2,773
Profit/loss for the period 814 -442 2,773
Other comprehensive income
Other comprehensive income which cannot subsequently be reclassified as profit or loss 0 -22 -62
Other comprehensive income which can subsequently be reclassified as profit or loss 23 -47 48
Other comprehensive income 23 -69 -14
Comprehensive income 837 -511 2,759
Run-off gains/losses, net of reinsurance 255 357 1,145
Run-off gains/losses, Gross 244 306 1,094
Statement of financial position
Total provisions for insurance contracts 35,689 33,871 32,488
Total reinsurers' share of provisions for insurance contracts 1,824 2,123 1,377
Total equity 48,773 10,458 12,264
Total assets 101,587 59,880 60,916
Key ratios
Gross claims ratio 70.1 77.1 68.1
Net reinsurance ratio 2.9 -3.2 2.2
Claims ratio, net of reinsurance 73.1 73.9 70.3
Gross expense ratio 14.1 14.1 14.1
Combined ratio 87.1 88.0 84.5
24
Financial statements - Contents
Interim report Q1 2021 | Tryg A/S |

Income statement
DKKmQ1
2021Q1
2020 2020
Notes Investment activities
Income from associates -5 0 -47
Income from investment property 13 13 49
Interest income and dividends 132 140 506
2 Value adjustments 264 -1,029 110
Interest expenses -39 -32 -126
Administration expenses in connection with investment activities -17 -41 -145
Total investment return 349 -948 348
Return on insurance provisions -5 -32 -37
Total Investment return after insurance technical interest 343 -980 311
Other income 27 23 88
Other costs -99 -88 -354
Profit/loss before tax 1,022 -372 3,541
Tax -208 -70 -768
Profit/loss on continuing business 814 -442 2,773
Profit/loss for the period 814 -442 2,773
3 Earnings/ diluted earnings per share 2.50 -1.47 9.19
3 Operating earnings per share 2.58 -1.38 9.54
DKKmQ1
2021Q1
2020 2020
Notes General insurance
Gross premiums written 8,913 8,498 23,652
Ceded insurance premiums -752 -687 -1,552
Change in premium provisions -2,774 -2,709 -187
Change in reinsurers' share of premium provisions 337 383 85
Premium income, net of reinsurance 5,724 5,484 21,998
Insurance technical interest, net of reinsurance -9 -1 -20
Claims paid -3,935 -4,276 -15,542
Reinsurance cover received 116 124 987
Change in claims provisions -207 -41 105
Change in the reinsurers' share of claims provisions 91 323 -187
Claims, net of reinsurance -3,935 -3,869 -14,637
Bonus and premium discounts -234 -194 -812
Acquisition costs -642 -644 -2,532
Administration expenses -188 -143 -669
Acquisition costs and administration expenses -830 -787 -3,202
Reinsurance commissions and profit participation from reinsurers 34 39 170
Insurance operating costs, net of reinsurance -796 -748 -3,032
1 Technical result 751 672 3,495
25
Financial statements - Contents
Interim report Q1 2021 | Tryg A/S |

Statement of comprehensive income
DKKmQ1
2021Q1
2020 2020
Notes Profit/loss for the period 814 -442 2,773
Other comprehensive income
Other comprehensive income which cannot subsequently be reclassified as profit or loss
Actuarial gains/losses on defined-benefit pension plans 0 -30 -68
Tax on actuarial gains/losses on defined-benefit pension plans 0 7 6
0 -22 -62
Other comprehensive income which can subsequently be reclassified as profit or loss
Exchange rate adjustments of foreign entities 99 -294 -51
Hedging of currency risk in foreign entities -97 317 127
Tax on hedging of currency risk in foreign entities 21 -70 -28
23 -47 48
Total other comprehensive income 23 -69 -14
Comprehensive income 837 -511 2,759
26
Financial statements - Contents
Interim report Q1 2021 | Tryg A/S |
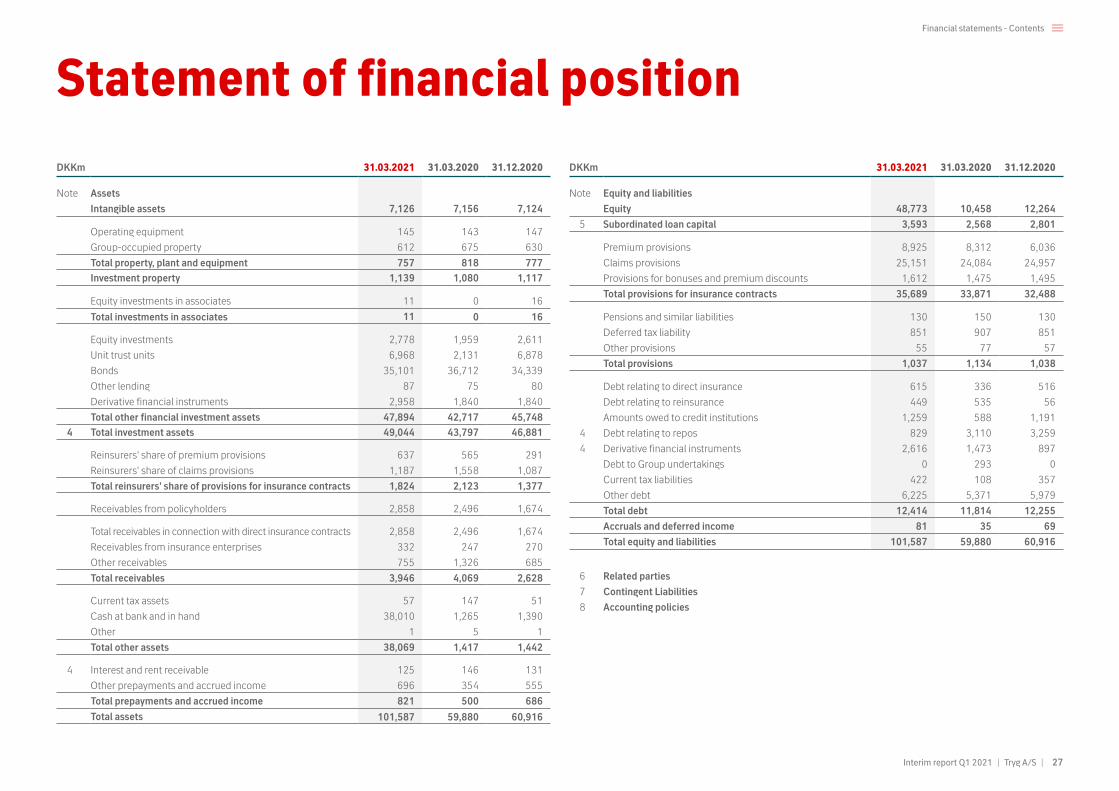
Statement of financial positionDKKm 31.03.2021 31.03.2020 31.12.2020
Note Assets
Intangible assets 7,126 7,156 7,124
Operating equipment 145 143 147
Group-occupied property 612 675 630
Total property, plant and equipment 757 818 777
Investment property 1,139 1,080 1,117
Equity investments in associates 11 0 16
Total investments in associates 11 0 16
Equity investments 2,778 1,959 2,611
Unit trust units 6,968 2,131 6,878
Bonds 35,101 36,712 34,339
Other lending 87 75 80
Derivative financial instruments 2,958 1,840 1,840
Total other financial investment assets 47,894 42,717 45,748
4 Total investment assets 49,044 43,797 46,881
Reinsurers' share of premium provisions 637 565 291
Reinsurers' share of claims provisions 1,187 1,558 1,087
Total reinsurers' share of provisions for insurance contracts 1,824 2,123 1,377
Receivables from policyholders 2,858 2,496 1,674
Total receivables in connection with direct insurance contracts 2,858 2,496 1,674
Receivables from insurance enterprises 332 247 270
Other receivables 755 1,326 685
Total receivables 3,946 4,069 2,628
Current tax assets 57 147 51
Cash at bank and in hand 38,010 1,265 1,390
Other 1 5 1
Total other assets 38,069 1,417 1,442
4 Interest and rent receivable 125 146 131
Other prepayments and accrued income 696 354 555
Total prepayments and accrued income 821 500 686
Total assets 101,587 59,880 60,916
DKKm 31.03.2021 31.03.2020 31.12.2020
Note Equity and liabilities
Equity 48,773 10,458 12,264
5 Subordinated loan capital 3,593 2,568 2,801
Premium provisions 8,925 8,312 6,036
Claims provisions 25,151 24,084 24,957
Provisions for bonuses and premium discounts 1,612 1,475 1,495
Total provisions for insurance contracts 35,689 33,871 32,488
Pensions and similar liabilities 130 150 130
Deferred tax liability 851 907 851
Other provisions 55 77 57
Total provisions 1,037 1,134 1,038
Debt relating to direct insurance 615 336 516
Debt relating to reinsurance 449 535 56
Amounts owed to credit institutions 1,259 588 1,191
4 Debt relating to repos 829 3,110 3,259
4 Derivative financial instruments 2,616 1,473 897
Debt to Group undertakings 0 293 0
Current tax liabilities 422 108 357
Other debt 6,225 5,371 5,979
Total debt 12,414 11,814 12,255
Accruals and deferred income 81 35 69
Total equity and liabilities 101,587 59,880 60,916
6 Related parties
7 Contingent Liabilities
8 Accounting policies
27
Financial statements - Contents
Interim report Q1 2021 | Tryg A/S |

Statement of changes in equitya) Other reserves contains Norwegian Natural Perils
Pool and contingency fund provisions. The provi-sions can be used to cover losses in connection with the settlement of insurance provisions or otherwise for the benefit of the insured and are not available for dividends.
b) 352,505,989 new shares of nominal DKK 5 at a price of 105 per share were issued. Cost related to the issue of new shares are deducted in proceeds recognised in retained earnings with DKK 699m.
DKKMShare
capital
Reserve for exchange rate
adjustmentOther
reservesa)Retainedearnings
Proposed dividend
Non-controllinginterest Total
Equity at 31 December 2020 1,511 25 1,706 8,492 529 1 12,264
Q1 2021
Profit/loss for the period -8 122 700 814
Other comprehensive income 23 0 23
Total comprehensive income 0 23 -8 122 700 837
Dividend paid -529 -529
Dividend, own shares 1 1
Purchase and sale of own shares -119 -119
Issue of new sharesb) 1,763 34,552 36,314
Share based payments 6 6
Total changes in equity in Q1 2021 1,763 23 -8 34,560 172 0 36,509
Equity at 31 March 2021 3,274 48 1,698 43,052 700 1 48,773
Equity at 31 December 2019 1,511 -23 1,677 7,906 1,013 1 12,085
Q1 2020
Profit/loss for the period -126 -316 -442
Other comprehensive income -47 -22 -69
Total comprehensive income 0 -47 -126 -338 0 0 -511
Dividend paid -1,013 -1,013
Dividend, own shares 1 1
Purchase and sale of own shares -109 -109
Share based payments 4 4
Total changes in equity in Q1 2020 0 -47 -126 -442 -1,013 0 -1,627
Equity at 31 March 2020 1,511 -70 1,551 7,464 0 1 10,458
28
Financial statements - Contents
Interim report Q1 2021 | Tryg A/S |

Statement of changes in equitya) Other reserves contains Norwegian Natural Perils
Pool and contingency fund provisions. The provi-sions can be used to cover losses in connection with the settlement of insurance provisions or otherwise for the benefit of the insured and are not available for dividends.
DKKMShare
capital
Reserve for exchange rate
adjustmentOther
reservesa)Retainedearnings
Proposed dividend
Non-controllinginterest Total
Equity at 31 December 2019 1,511 -23 1,677 7,906 1,013 1 12,085
2020
Profit/loss for the year 29 629 2,115 2,773
Other comprehensive income 48 -62 -14
Total comprehensive income 0 48 29 567 2,115 0 2,759
Dividend paid -2,599 -2,599
Dividend, own shares 4 4
Purchase and sale of own shares -13 -13
Share based payments 29 29
Total changes in equity in 2020 0 48 29 586 -484 0 179
Equity at 31 December 2020 1,511 25 1,706 8,492 529 1 12,264
29
Financial statements - Contents
Interim report Q1 2021 | Tryg A/S |

Cash flow statement
DKKmQ1
2021Q1
2020 2020
Cash flow from financing activities
Issue of new shares 36,314 0 0
Exercise of share options/purchase of treasury shares (net) -119 -109 -13
Dividend paid -529 -1,013 -2,599
Subordinated loan capital 735 0 0
Change in lease liabilities -34 -36 -139
Change in amounts owed to credit institutions 68 -123 480
Total cash flow from financing activities 36,435 -1,280 -2,271
Change in cash and cash equivalents, net 36,620 404 522
Exchange rate adjustment of cash and cash equivalents, 1 January 0 -7 0
Change in cash and cash equivalents, gross 36,620 397 522
Cash and cash equivalents, beginning of year 1,390 868 868
Cash and cash equivalents, end of period 38,010 1,265 1,390
DKKmQ1
2021Q1
2020 2020
Cash from operating activities
Premiums 7,739 7,227 22,884
Claims -3,978 -5,363 -15,400
Ceded business -175 -140 -634
Costs -832 -578 -2,961
Change in other debt and other amounts receivable 265 940 468
Cash flow from insurance activities 3,019 2,085 4,358
Interest income 105 92 359
Interest expenses -39 -32 -126
Dividend received 30 21 66
Taxes -160 -166 -599
Other income and costs -38 -28 -126
Total cash flow from operating activities 2,916 1,971 3,932
Cash flow from investment activities
Sale of real property 0 0 13
Acquisition and sale of equity investments and unit trust units (net) 236 -1,031 -5,502
Purchase/sale of bonds (net) -2,985 793 4,339
Purchase/sale of operating equipment (net) -5 -3 -37
Hedging of currency risk 23 -47 48
Total cash flow from investment activities -2,731 -287 -1,139
30
Financial statements - Contents
Interim report Q1 2021 | Tryg A/S |

Notesa) Tryg Garanti (Credit & Surety business) has been
transferred from the Corporate segment to the Commercial segment in Q1 2021 - comparative figures have been restated accordingly.
b) Amounts relating to one-off items are included un-der ‘Other’. Other assets and liabilities are managed at Group level and are not allocated to the individual segments but are included under ‘Other’. Costs are allocated according to specific keys, which are believed to provide the best estimate of assessed resource consumption.
DKKm Private Commerciala) Corporatea) Sweden Other b) Group
1 Operating segments
Q1 2021
Gross premium income 3,371 1,288 875 372 5,906
Gross claims -2,443 -804 -662 -235 1 -4,142
Gross operating expenses -460 -218 -90 -64 1 -830
Profit/loss on ceded business -57 -41 -75 -1 -174
Insurance technical interest, net of reinsurance -4 -2 -1 -1 -9
Technical result 407 222 47 72 2 751
Other items 63 63
Profit/loss 814
Run-off gains/losses, net of reinsurance 33 52 93 75 1 255
Intangible assets 5,646 62 526 892 7,126
Equity investments in associates 11 11
Reinsurers' share of premium provisions 144 105 386 2 637
Reinsurers' share of claims provisions 149 364 664 11 1,187
Other assets 92,625 92,625
Total assets 101,587
Premium provisions 3,733 2,340 1,919 933 8,925
Claims provisions 6,778 7,249 8,340 2,785 25,151
Provisions for bonuses and premium discounts 1,407 122 3 80 1,612
Other liabilities 17,125 17,125
Total liabilities 52,814
Interim report Q1 2021 | Tryg A/S | 31
Financial statements - Contents

Notesa) Tryg Garanti (Credit & Surety business) has been
transferred from the Corporate segment to the Commercial segment in Q1 2021 - comparative figures have been restated accordingly.
b) Amounts relating to one-off items are included un-der ‘Other’. Other assets and liabilities are managed at Group level and are not allocated to the individual segments but are included under ‘Other’. Costs are allocated according to specific keys, which are believed to provide the best estimate of assessed resource consumption.
DKKm Private Commerciala) Corporatea) Sweden Other b) Group
1 Operating segments (continued)
Q1 2020
Gross premium income 3,162 1,233 846 353 5,595
Gross claims -2,500 -958 -597 -260 -2 -4,316
Gross operating expenses -433 -205 -88 -64 4 -787
Profit/loss on ceded business 85 72 18 6 181
Insurance technical interest, net of reinsurance -1 -1
Technical result 313 142 180 35 2 672
Other items -1,114 -1,114
Profit/loss -442
Run-off gains/losses, net of reinsurance 32 100 173 53 -1 357
Intangible assets 5,772 56 510 817 7,156
Reinsurers' share of premium provisions 122 111 331 2 565
Reinsurers' share of claims provisions 155 403 987 13 1,558
Other assets 50,601 50,601
Total assets 59,880
Premium provisions 3,388 2,224 1,851 848 8,312
Claims provisions 6,117 7,216 8,130 2,620 24,084
Provisions for bonuses and premium discounts 1,294 120 26 36 1,475
Other liabilities 15,551 15,551
Total liabilities 49,422
Interim report Q1 2021 | Tryg A/S | 32
Financial statements - Contents

Notesa) Tryg Garanti (Credit & Surety business) has been
transferred from the Corporate segment to the Commercial segment in Q1 2021 - comparative figures have been restated accordingly.
b) Amounts relating to one-off items are included un-der ‘Other’. Other assets and liabilities are managed at Group level and are not allocated to the individual segments but are included under ‘Other’. Costs are allocated according to specific keys, which are believed to provide the best estimate of assessed resource consumption.
DKKm Private Commerciala) Corporatea) Sweden Other b) Group
1 Operating segments (continued)
2020
Gross premium income 12,743 4,930 3,376 1,604 22,653
Gross claims -8,883 -3,167 -2,311 -1,067 -9 -15,437
Gross operating expenses -1,727 -831 -367 -269 -7 -3,202
Profit/loss on ceded business -76 -130 -294 1 -499
Insurance technical interest, net of reinsurance -12 -5 -2 -1 -20
Technical result 2,045 798 401 268 -16 3,495
Other items -722
Profit/loss 2,773
Run-off gains/losses, net of reinsurance 120 348 436 249 -9 1,145
Intangible assets 5,677 60 533 854 7,124
Equity investments in associates 16 16
Reinsurers' share of premium provisions 50 24 216 291
Reinsurers' share of claims provisions 140 330 604 12 1,087
Other assets 52,398 52,398
Total assets 60,916
Premium provisions 2,747 1,364 943 983 6,036
Claims provisions 6,348 7,306 8,406 2,896 24,957
Provisions for bonuses and premium discounts 1,303 118 5 69 1,495
Other liabilities 16,164 16,164
Total liabilities 48,651
Interim report Q1 2021 | Tryg A/S | 33
Financial statements - Contents
Notes
DKKmQ1
2021Q1
2020 2020
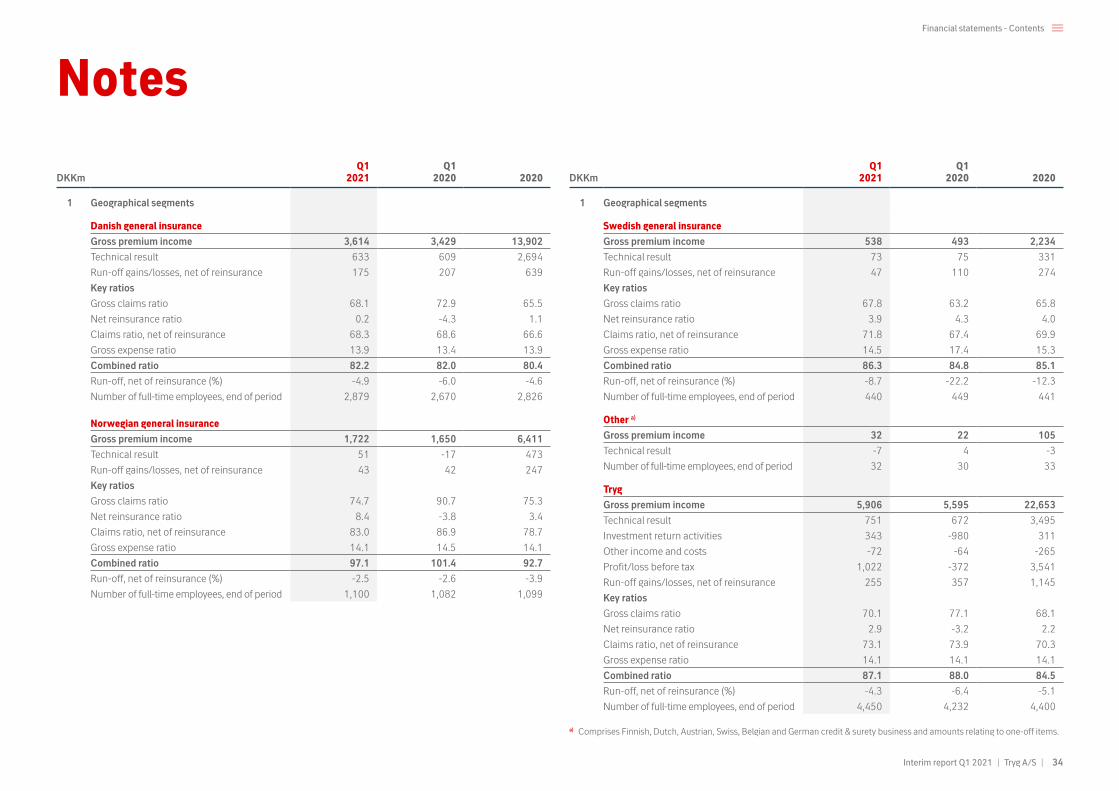
1 Geographical segments
Danish general insurance
Gross premium income 3,614 3,429 13,902
Technical result 633 609 2,694
Run-off gains/losses, net of reinsurance 175 207 639
Key ratios
Gross claims ratio 68.1 72.9 65.5
Net reinsurance ratio 0.2 -4.3 1.1
Claims ratio, net of reinsurance 68.3 68.6 66.6
Gross expense ratio 13.9 13.4 13.9
Combined ratio 82.2 82.0 80.4
Run-off, net of reinsurance (%) -4.9 -6.0 -4.6
Number of full-time employees, end of period 2,879 2,670 2,826
Norwegian general insurance
Gross premium income 1,722 1,650 6,411
Technical result 51 -17 473
Run-off gains/losses, net of reinsurance 43 42 247
Key ratios
Gross claims ratio 74.7 90.7 75.3
Net reinsurance ratio 8.4 -3.8 3.4
Claims ratio, net of reinsurance 83.0 86.9 78.7
Gross expense ratio 14.1 14.5 14.1
Combined ratio 97.1 101.4 92.7
Run-off, net of reinsurance (%) -2.5 -2.6 -3.9
Number of full-time employees, end of period 1,100 1,082 1,099
DKKmQ1
2021Q1
2020 2020
1 Geographical segments
Swedish general insurance
Gross premium income 538 493 2,234
Technical result 73 75 331
Run-off gains/losses, net of reinsurance 47 110 274
Key ratios
Gross claims ratio 67.8 63.2 65.8
Net reinsurance ratio 3.9 4.3 4.0
Claims ratio, net of reinsurance 71.8 67.4 69.9
Gross expense ratio 14.5 17.4 15.3
Combined ratio 86.3 84.8 85.1
Run-off, net of reinsurance (%) -8.7 -22.2 -12.3
Number of full-time employees, end of period 440 449 441
Other a)
Gross premium income 32 22 105
Technical result -7 4 -3
Number of full-time employees, end of period 32 30 33
Tryg
Gross premium income 5,906 5,595 22,653
Technical result 751 672 3,495
Investment return activities 343 -980 311
Other income and costs -72 -64 -265
Profit/loss before tax 1,022 -372 3,541
Run-off gains/losses, net of reinsurance 255 357 1,145
Key ratios
Gross claims ratio 70.1 77.1 68.1
Net reinsurance ratio 2.9 -3.2 2.2
Claims ratio, net of reinsurance 73.1 73.9 70.3
Gross expense ratio 14.1 14.1 14.1
Combined ratio 87.1 88.0 84.5
Run-off, net of reinsurance (%) -4.3 -6.4 -5.1
Number of full-time employees, end of period 4,450 4,232 4,400
a) Comprises Finnish, Dutch, Austrian, Swiss, Belgian and German credit & surety business and amounts relating to one-off items.
Interim report Q1 2021 | Tryg A/S | 34
Financial statements - Contents

Notes
DKKmQ1
2021Q1
2020 2020
2 Value adjustments
Value adjustments concerning financial assets or liabilities at fair value with value adjustment in the income statement:
Equity investments 149 -403 -153
Unit trust units 330 -520 -358
Bonds -63 -628 -233
Derivatives (equity, interest, currency)a) -89 755 769
327 -797 25
Value adjustments concerning assets or liabilities that cannot be attributed to IAS 39:
Investment property -1 -9 4
Discounting 321 -406 -530
Other statement of financial position items -383 183 611
-63 -232 85
264 -1,029 110
a) Contains the value adjustment of the DCF DKK 156m, which cannot be attributed to hedge accounting eg. Exchangerate changes prior to the shareholders vote in RSA from which point hedge accounting was applied.
DKKmQ1
2021Q1
2020 2020
3 Earnings per share
Profit/loss from continuing business 814 -442 2,773
Profit/loss for the year 814 -442 2,773
Depreciation on intangible assets related to Brands and Customer relations after tax 26 26 105
Operating Profit/loss for the year 840 -416 2,878
Average number of shares (1,000) 325,029 301,489 301,678
Diluted number of shares (1,000) 325,029 301,489 301,678
Diluted average number of shares (1,000) 0 0 0
Earnings per share, continuing business 2.50 -1.47 9.19
Diluted earnings per share, continuing business 2.50 -1.47 9.19
Earnings per share 2.50 -1.47 9.19
Diluted earnings per share 2.50 -1.47 9.19
Operating earings per share 2.58 -1.38 9.54
4 Tryg's investment portfolio
Total investment assets 49,044 43,797 46,881
Other, hereof financial instrument in liabilitiesa) -3,384 -3,891 -3,888
External customers -2,533 -2,212 -2,470
Tryg's investment portfoliob) 43,126 37,694 40,523
Hereof Match portfolio 30,635 27,200 28,094
Hereof Free portfolio 12,335 10,494 12,429
Hereof DCF related to RSA transaction 156 0 0
a) Primarily debt relating to repos and derivatives.b) The setup of Tryg Invest is impacting Tryg’s balance sheet as external customers investments are booked under “Total
other financial investments” with opposing liabilities entries such as “Debt to group undertakings” and “Other debt”.
Interim report Q1 2021 | Tryg A/S | 35
Financial statements - Contents

Notes
7 Contingent Liabilities
Companies in the Tryg Group are party to a number of other disputes in Denmark, Norway and Sweden, which management believes will not affect the Group’s financial position significantly beyond the obligations recognized in the statement of financial position at 31 March 2021.
8 Accounting policies
Tryg’s interim report for Q1 2021 is presented in accordance with IAS 34 Interim Financial
Reporting and the requirements of the NASDAQ Copenhagen for the presentation of financial statements of listed companies.
The application of IAS 34 means that the report is limited relative to the presentation of a full annual report and that the valuation principles are in accordance with International Financial Reporting Standards (IFRS).
Changes in accounting policiesThere have been no changes to the accounting policies or accounting estimates in Q1 2021.
OtherThe amounts in the report are disclosed in whole numbers of DKKm, unless otherwise stated.
The amounts have been rounded and consequently the sum of the rounded amounts and totals may differ slightly.
5 Subordinated loan capitalTryg Forsikring A/S has issued a new restricted Tier 1 Capital notes for the amount of SEK 1,000m.Amortised cost value of the loan is recognised with 735m DKK in the Statement of financial position.
Lender Listed bonds
Issue date February 2021
Maturity date Perpetual
Loan may be called by lender as from 2026
Repayment profile Interest-only
Interest structure 2.4% above STIBOR 3M
For information on other subordinated loans, please refer to annual report 2020, note 1.
The total share of loan capital included in the calculation of the capital base totals DKK 3,500m.
A subordinated loan of the amount of SEK 1.000m has given notice of cancellation in April 2021 and will be paid out in full in May 2021.
6 Related parties
In Q1 2021, a dividend for Q4 2020 of DKK 529m was paid to shareholders, of which 53% has been paid to TryghedsGruppen SMBA. In Q1 2021 dividend of DKK 529m has been paid from Tryg Forsikring A/S to Tryg A/S.
There have been no other significant transactions.
Interim report Q1 2021 | Tryg A/S | 36
Financial statements - Contents

Quarterly outline
Q1 Q4 Q3 Q2 Q1 Q4 Q3 Q2 Q1DKKm 2021 2020 2020 2020 2020 2019 2019 2019 2019
Private
Gross premium income 3,371 3,245 3,167 3,169 3,162 3,059 3,055 3,010 2,897
Technical result 407 537 588 607 313 494 458 593 406
Key ratios
Gross claims ratio 72.5 68.1 66.8 65.0 79.1 67.9 69.2 64.8 70.7
Net reinsurance ratio 1.7 2.5 0.4 2.1 -2.7 2.5 1.8 1.8 1.6
Claims ratio, net of reinsurance 74.2 70.5 67.3 67.1 76.4 70.4 71.0 66.5 72.3
Gross expense ratio 13.6 12.8 14.1 13.7 13.7 13.4 13.9 13.8 13.8
Combined ratio 87.8 83.3 81.3 80.8 90.1 83.8 84.9 80.3 86.1
Combined ratio exclusive of run-off 88.8 83.7 82.3 82.2 91.1 84.9 85.4 83.1 89.8
Commerciala)
Gross premium income 1,288 1,261 1,248 1,187 1,233 1,205 1,203 1,180 1,166
Technical result 222 179 253 223 142 199 190 233 152
Key ratios
Gross claims ratio 62.4 61.9 55.5 61.9 77.7 65.5 65.2 55.6 62.5
Net reinsurance ratio 3.2 5.4 7.9 3.0 -5.9 0.9 2.0 7.7 7.3
Claims ratio, net of reinsurance 65.6 67.3 63.4 64.9 71.8 66.4 67.3 63.3 69.8
Gross expense ratio 16.9 18.4 16.1 16.2 16.6 17.1 17.0 17.1 17.2
Combined ratio 82.5 85.7 79.6 81.1 88.5 83.5 84.2 80.4 87.0
Combined ratio exclusive of run-off 86.6 96.6 85.3 84.3 96.5 86.1 91.9 87.3 95.4
Corporatea)
Gross premium income 875 844 860 825 846 861 912 876 850
Technical result 47 -32 70 183 180 -21 168 93 48
Key ratios
Gross claims ratio 75.6 86.7 59.8 56.7 70.5 93.6 65.3 69.1 84.1
Net reinsurance ratio 8.5 4.5 21.9 10.4 -2.1 -3.1 7.7 9.8 0.8
Claims ratio, net of reinsurance 84.2 91.2 81.7 67.1 68.4 90.5 73.1 78.9 84.9
Gross expense ratio 10.2 12.5 10.0 10.7 10.4 11.8 8.4 10.8 9.4
Combined ratio 94.4 103.7 91.7 77.7 78.8 102.3 81.5 89.7 94.3
Combined ratio exclusive of run-off 105.1 113.1 104.7 86.4 99.3 112.2 95.0 97.2 110.3
A further detailed version of the presentation can be downloaded from Tryg.com/en > downloads > tables
a) Tryg Garanti (Credit & Surety business) has been transferred from the Corporate segment to the Com-mercial segment in Q1 2021 - comparative figures have been restated accordingly.
Interim report Q1 2021 | Tryg A/S | 37
Financial statements - Contents
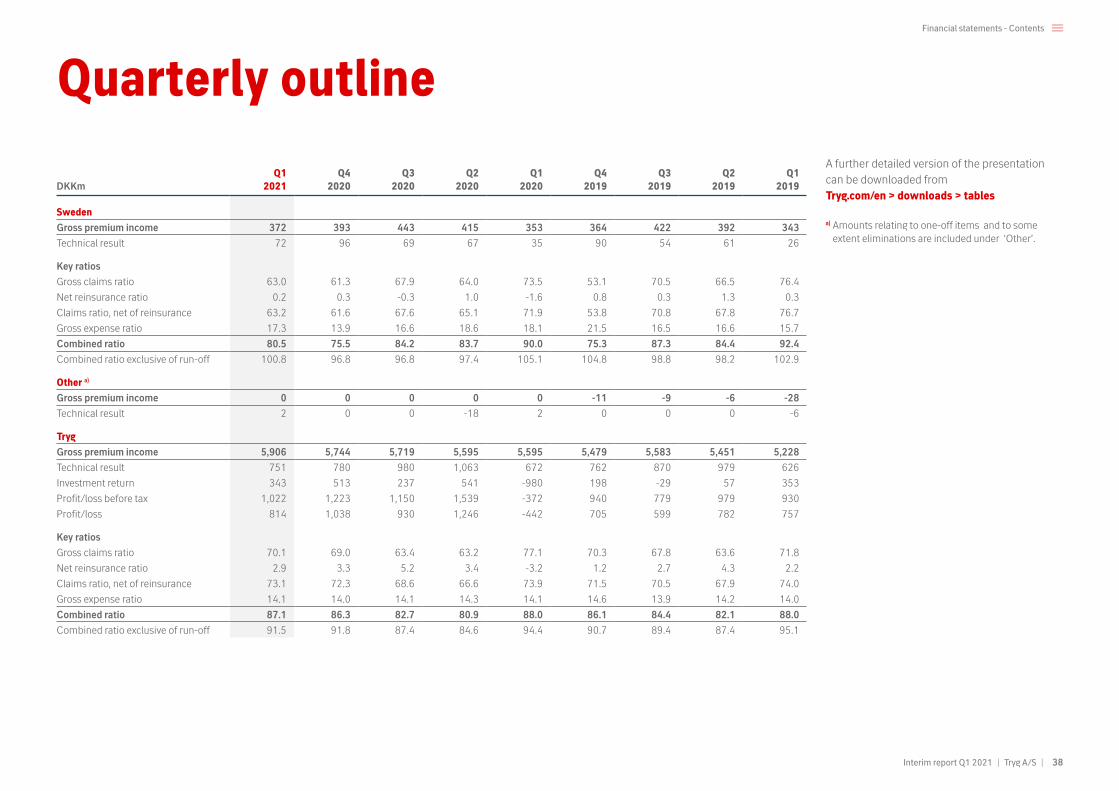
Quarterly outline
Q1 Q4 Q3 Q2 Q1 Q4 Q3 Q2 Q1DKKm 2021 2020 2020 2020 2020 2019 2019 2019 2019
Sweden
Gross premium income 372 393 443 415 353 364 422 392 343
Technical result 72 96 69 67 35 90 54 61 26
Key ratios
Gross claims ratio 63.0 61.3 67.9 64.0 73.5 53.1 70.5 66.5 76.4
Net reinsurance ratio 0.2 0.3 -0.3 1.0 -1.6 0.8 0.3 1.3 0.3
Claims ratio, net of reinsurance 63.2 61.6 67.6 65.1 71.9 53.8 70.8 67.8 76.7
Gross expense ratio 17.3 13.9 16.6 18.6 18.1 21.5 16.5 16.6 15.7
Combined ratio 80.5 75.5 84.2 83.7 90.0 75.3 87.3 84.4 92.4
Combined ratio exclusive of run-off 100.8 96.8 96.8 97.4 105.1 104.8 98.8 98.2 102.9
Other a)
Gross premium income 0 0 0 0 0 -11 -9 -6 -28
Technical result 2 0 0 -18 2 0 0 0 -6
Tryg
Gross premium income 5,906 5,744 5,719 5,595 5,595 5,479 5,583 5,451 5,228
Technical result 751 780 980 1,063 672 762 870 979 626
Investment return 343 513 237 541 -980 198 -29 57 353
Profit/loss before tax 1,022 1,223 1,150 1,539 -372 940 779 979 930
Profit/loss 814 1,038 930 1,246 -442 705 599 782 757
Key ratios
Gross claims ratio 70.1 69.0 63.4 63.2 77.1 70.3 67.8 63.6 71.8
Net reinsurance ratio 2.9 3.3 5.2 3.4 -3.2 1.2 2.7 4.3 2.2
Claims ratio, net of reinsurance 73.1 72.3 68.6 66.6 73.9 71.5 70.5 67.9 74.0
Gross expense ratio 14.1 14.0 14.1 14.3 14.1 14.6 13.9 14.2 14.0
Combined ratio 87.1 86.3 82.7 80.9 88.0 86.1 84.4 82.1 88.0
Combined ratio exclusive of run-off 91.5 91.8 87.4 84.6 94.4 90.7 89.4 87.4 95.1
A further detailed version of the presentation can be downloaded from Tryg.com/en > downloads > tables
a) Amounts relating to one-off items and to some extent eliminations are included under ‘Other’.
Interim report Q1 2021 | Tryg A/S | 38
Financial statements - Contents

Disclaimer
Certain statements in this annual report are based on the beliefs of our management as well as assumptions made by and information currently available to management. Statements regarding Tryg’s future operating results, finan-cial position, cash flows, business strategy, plans and future objectives other than statements of historical fact can generally be identified by the use of words such as ‘targets’, ‘believes’, ‘expects’, ‘aims’, ‘intends’, ‘plans’, ‘seeks’, ‘will’, ‘may’, ‘anticipates’, ‘would’, ‘could’, ‘continues’ or similar expressions.
A number of different factors may cause the actual performance to deviate significantly from the forward-looking statements in this annual report, including but not limited to general economic developments, changes in the competitive environment, developments in the financial markets, extraordinary events such as natural disasters or terrorist attacks, changes in legislation or case law and reinsurance.
Should one or more of these risks or uncer-tainties materialise, or should any underlying assumptions prove to be incorrect, Tryg’s actual financial condition or results of operations could materially differ from that described herein as anticipated, believed, estimated or expected. Tryg is not under any duty to update any of the forward-looking statements or to conform such statements to actual results, except as may be required by law.
Read more in the chapter Solvency and dividend on pages 31-32, and in Note 1 on page 60, in the Annual report 2020, for a description of some of the factors which may affect the Group’s perfor-mance or the insurance industry.