Embed Size (px)
Citation preview

INTERIM REPORT
Quarter ended June 30, 2017 (April 1, 2017 to June 30, 2017)
Samvardhana Motherson
Automotive Systems Group BV

Interim Report for the period ended June 30, 2017
Page | 2
Contents
Management discussion and analysis
Operating Overview…….…………………………………………………………................... 3
Group Structure…………………………………………………………………….………………….. 6
Corporate Information……………………………………………………………………………... 7
Geographical Footprint………………………………………………………………………........ 8
Financial Overview
Summary Financials………………………………………………………………………………….. 9
Components of Revenue & Expenses.……………………………………………..……….. 10
Trade Working Capital………………………………………………………………………………. 16
Capital Expenditure………………………………………………………………………………….. 18
Cash Flow…………………………………………………………………………………………………. 20
Significant financing arrangements….………………………………………………………. 21
Debt & Cash……………………………………………………………………………………………… 22
Liquidity Analysis……………………………………………………………………………………… 24
Audited Consolidated Financial Statements for the year ended March 31, 2017
Consolidated Statement of Financial Position……….…………………………………… 27
Consolidated Income Statement…..…………………………………………………………… 28
Consolidated Statement of Comprehensive Income..………………………………… 29
Consolidated Cash Flow Statement..…………………………………………………………. 30
Consolidated Statement of Changes in Equity….……...………………………………. . 32
Notes to the Consolidated Financial Statements………………………….……………. 34

Interim Report for the period ended June 30, 2017 Management discussion and analysis
Page | 3
MANAGEMENT DISCUSSION AND ANALYSIS
OPERATING OVERVIEW
BUSINESS OVERVIEW
Samvardhana Motherson Automotive Systems Group BV together with its subsidiaries (hereinafter
referred as “SMRP BV Group” or “the Group”) are a leading global Tier 1 supplier of rear view vision
systems and interior and exterior modules (including door panels, instrument panels and bumpers) to
automotive original equipment manufacturers (“OEMs”) primarily for use in the production of light
vehicles. We are also a member of the Samvardhana Motherson Group (“SMG”), one of the global Tier
1 automotive supplier. We have long-term relationships with 14 of the top 15 global OEMs by 2016
production volume and our OEM customers collectively represented over 90% of global automotive
production in 2016. We currently supply our products to over 600 vehicle programs. In addition, we
currently hold leading market positions in our key product segments and geographies, particularly in
the premium segment (which includes brands such as Audi, BMW, Jaguar Land Rover, Porsche,
Mercedes-Benz and others), on which we are especially focused. We are active across the phases of
our products’ lifecycles, from product conception, design, styling, prototyping and validation to the
manufacture, assembly and subsequent delivery of fully-engineered assembled products. SMRP BV
Group has presence in each major global automotive production region, with 48 production facilities
and 11 module centres spread across 18 countries and strategically located in close proximity to the
manufacturing plants of the OEM customers. SMRP BV Group operate business through following
main divisions:
Rear view vision systems: SMR division produces a wide range of rear view vision systems primarily for light vehicles. SMR is a leading global supplier of exterior mirrors, with a global market share of passenger car exterior rear view mirror of 24% by volume in 2016. Rear view mirrors play an important role in automotive safety and design, and are becoming increasingly sophisticated. SMR’s mirrors are engineered to optimize aerodynamics and integrate technologically advanced features that enhance safety, comfort and aesthetics. SMR is active in every phase of the product development cycle, and its product portfolio covers a wide spectrum of vehicle and price segments, from low-cost mirrors to highly complex premium mirrors incorporating a variety of electronic features. SMR’s focus on research & development and customer collaboration has resulted in various first-to-market innovations and a variety of full system solutions tailored to the needs of OEMs and end consumers, including Blind Spot Detection Systems (BSDS) and Telescopic Trailer Tow (TTT) mirrors. From its division headquarters in Stuttgart, Germany, SMR operated 21 manufacturing facilities and 2 module centres with presence in 16 countries and employed 10,326 people as of June 30, 2017.

Interim Report for the period ended June 30, 2017 Management discussion and analysis
Page | 4
Interior and exterior modules: SMP division produce various polymer-based interior and exterior products for light vehicles. SMP’s product portfolio is primarily comprised of complete modules, including door panels, instrument panels and bumpers as well as other plastic components and systems, such as centre consoles, decorative interior trims and plastic body parts. These products involve a complex manufacturing and assembly processes, require significant systems integration expertise and represent key comfort and aesthetic features of the vehicles in which they are integrated. SMP focuses on the premium segment, and is a leading global supplier of door panels,
instrument panels and bumpers, with a global market shares of 28%, 11% and 20%,
respectively, by volume in 2016. SMP’s facilities are strategically located in close proximity to
the plants of its OEM customers, allowing for minimal lead times and transport costs and
efficient inventory management through “just-in-time” and “just-in-sequence” deliveries to
customers.
SMP’s research and development team are focussed on meeting and exceeding the steadily
increasing requirements of its customers and focuses on key areas including lightweight
constructions, renewable raw materials, occupant protection and pedestrian protection. The
engineering team works with OEM to develop cost-efficient innovative products along with
adding new functionalities and continually improving SMP’s existing product range.
SMP division includes business of SMIA which was acquired in January 2015, SMIA with its
headquarters in Michelau (Germany) is an internationally renowned specialist in plastic
technologies since it’s foundation in 1967.
SMP division also includes Kobek Siebdruck GmbH & Co. KG (hereinafter ‘Kobek’), renamed as
Motherson Innovations Lights Gmbh & Co KG (“MIL”) acquired in January 2017. MIL is a
specialist in lightning solutions and has been a supplier to the SMP subsidiaries.
SMP holds 50% shareholding in Celulosa Fabril (Cefa) S.A. (hereinafter ‘CEFA’). Celulosa Fabril
S.A. (CEFA) is a leading Spanish company in the development and production of components
for the automobile industry based mainly on the technology of injection of plastic materials.
It is the parent company of a Módulos Ribera Alta, S.L (“MRA”). Following a change in
composition of the board of directors of CEFA, SMP gained majority control over CEFA board
with effect from December 20, 2016 and hence the same is consolidated as a subsidiary in the
consolidated financial statements.
Due to strong synergies between product portfolio and manufacturing technologies, SMIA,
Kobek and CEFA are considered as part of SMP for the purpose of review by the Chief
Operating Decision Makers (“CODM”) in taking strategic decisions.
SMP operated 27 manufacturing facilities and 9 module centres in 9 countries and employed
14,372 people as of June 30, 2017.

Interim Report for the period ended June 30, 2017 Management discussion and analysis
Page | 5
MANAGEMENT TEAM & EMPLOYEES
SMRP BV Group benefits from a strong professional management team, with average automotive industry experience among senior managers of over 25 years. The majority of the senior management team have been with the group or its legacy businesses for several years, demonstrating a high degree of continuity and commitment in leadership. Company’s management team has a demonstrated track record of achieving improved financial results and has solidified the customer relationships of SMR and SMP as well as enhancing their respective local management teams. In addition, the group has experienced and stable senior managers at the regional levels with significant experience and understanding of their respective markets and regions. SMRP BV Group’s strategy is to empower local management, ensuring they have ownership of day-to-day operational decisions while being guided by central principles aligned to the Group’s vision and strategy. The Group believe that the strength of management team combined with decentralized business model is an enabler to taking advantage of strategic market opportunities, to making decisions at the local level quickly and to better serve our customers. From time to time, the company employs staff on short-term basis to meet the demand for the products. These employees are typically employed under fixed-term contracts, generally of up to twelve months in duration which allows operational flexibility to meet customer demand. As on June 30, 2017, SMRP BV Group had a total of 24,698 employees. The following chart sets out the total number of persons employed by the company in SMP and SMR businesses:
SMR10,326 SMP
14,372

Interim Report for the period ended June 30, 2017 Management discussion and analysis
Page | 6
GROUP STRUCTURE
The following diagram represents the Corporate Structure of SMRP BV Group along with details of its principal
shareholders:
Corporate Structure as at June 30, 2017 and is not a legal structure
This space has been intentionally left blank
Samvardhana Motherson Global
Holdings Ltd.
(Cyprus)
49%
51%
49%
51%
Samvardhana Motherson Polymers Ltd.
(India)
69% 31%
100% 100% 100% 98.5%Samvardhana Motherson
Automotive Systems Group B.V.
(SMRP BV)
SMP Automotive Technology lberica
S.L., (Spain)
Samvardhana Motherson Peguform
GmbH, (Germany)
Samvardhana Motherson Reflectec
Group Holdings
Limited (Jersey)
SMP Automotive Interiors
(Beijing) Co. Ltd
100% 100% 100%94.8%
SMP Automotive Exterior
GmbH (Schierling)
SMP Deutschland GmbH,
(Germany)
Samvardhana Motherson
Innovative Autosystems
B.V. & Co. KG
Motherson Innovations
Lights GmbH & Co. KG
Subsidiaries & Joint Ventures Subsidiaries & Joint VenturesSubsidiaries, Joint Ventures &
Associates

Interim Report for the period ended June 30, 2017 Management discussion and analysis
Page | 7
CORPORATE INFORMATION
MANAGEMENT BOARD :
The Management Board of the company is responsible for managing day to day business and to legally
represent the company in its dealing with third parties while maintaining high standards of corporate
governance and corporate responsibility. Management Board consists of following members:
1. Laksh Vaaman Sehgal Managing Director (Chairman and Chief Executive Officer)
2. Andreas Heuser Managing Director
3. Jacob Meint Buit Resident Managing Director
4. Randolph de Cuba Resident Managing Director
SUPERVISORY BOARD :
The Supervisory Board of the company is responsible for supervising the management board’s policy and
course of action and to supervise the general conduct of the affairs of the company and any business it may be
affiliated with. The supervisory board assists the management board in an advisory capacity and have to carry
out their duties in the interest of the company. Supervisory Board consists of following members:
1. Vivek Chaand Sehgal Director and Chairman SMG
2. Bimal Dhar Director and Chief Executive Officer-SMP
3. Cezary Zawadzinski Director and Chief Operating Officer-SMR
4. G.N. Gauba Director
5. Kunal Malani Director
The above composition of Management & Supervisory Board is as on date.
REGISTERED OFFICE : The registered office of the company is under : Hoogoorddreef 15, 1101 BA Amsterdam The Netherlands

Interim Report for the period ended June 30, 2017 Management discussion and analysis
Page | 8
GEOGRAPHICAL FOOTPRINT
SMRP BV Group operate 48 manufacturing facilities across 18 countries and 11 module centres. Out of 48
manufacturing plants, SMR operates 21 manufacturing plants, SMP operates 27 manufacturing plants. These
includes two new Greenfield plants under construction in Kecskemet (Hungary) and Tuscaloosa (USA) to cater
to new customer orders.
SMRP BV Group’s global footprint enables strategic presence of manufacturing facilities with close proximity
to the plants of OEM customers. This enhances the ability to supply to in a timely and cost efficient manner,
particularly with respect to the majority of interior & exterior modules, including door panels, instrument
panels and bumpers, which cannot typically be transported efficiently. In addition, consumer demand for
vehicle personalisation in the premium segment has increased the complexities of interior and exterior
modules, some of which could have hundreds of potential permutations and combinations. To overcome these
challenges, SMRP BV assemble products in close proximity to the plants of OEM customers, and deliver them
on “just-in-time” and “just-in-sequence” basis directly to customers’ production lines with minimal lead times.
SMRP BV Group intends to continue to expand global footprint in line with the international expansion of main
OEM customer’s production footprint, particularly in emerging markets in Americas & Asia Pacific region.
Following chart provides an overview of SMRP BV Group’s global footprint:
Above information is as at June 30, 2017
24,600+ Workforce.
Module
Centers.
Countries.18
48 Manufacturing
Plants.
11

Interim Report for the period ended June 30, 2017 Management discussion and analysis
Page | 9
FINANCIAL OVERVIEW FOR THE QUARTER ENDED JUNE 30, 2017
Samvardhana Motherson Automotive Systems Group BV’s Board has approved its unaudited interim
consolidated condenses financial statements for the quarter ended June 30, 2017. The consolidated financial
statements have been prepared in accordance with International Financial Reporting Standards (“IFRS”) as
adopted by the European Union (“IFRS EU”).
SUMMARY FINANCIALS
Following are the summary financials for the quarter ended June 30, 2017:
1. Start-up cost incurred for new plants & facilities under construction
Income Statement
€ millions SMRPBV SMP SMR SMRPBV SMP SMR
Revenue 1,110.1 737.0 373.7 1,249.3 851.1 399.1
EBITDA 78.9 46.0 32.9 88.1 44.7 43.4
% to Revenue 7.1% 6.2% 8.8% 7.1% 5.3% 10.9%
Startup cost for greenfield1 (4.7) (4.7) - (11.7) (11.7) -
Adjusted EBITDA 83.6 50.7 32.9 99.8 56.4 43.4
% to Revenue 7.5% 6.9% 8.8% 8.0% 6.6% 10.9%
3M ended June 30, 20173M ended June 30, 2016
Statement of Financial Position March 31, 2017 June 30, 2017
Total Assets 2,818.6 2,727.8
Debt 1,021.9 1038.5
Cash and cash equivalents 506.0 392.4
Net Debt 515.9 646.1
Key Ratios# Allowed June 30, 2017
Gross Leverage Ratio: Indenture 3.50x 2.78x
Net Leverage Ratio : RCF 3.25x 1.74x
# Computed as per definitions given in Indenture & RCF agreements

Interim Report for the period ended June 30, 2017 Management discussion and analysis
Page | 10
COMPONENTS OF REVENUE & EXPENSES
REVENUE
SMRP BV Group’s revenues for quarter ended June 30, 2017 were € 1,249.3 million which is higher than the
revenues for the corresponding previous quarter ended June 30, 2016 at € 1,110.1 million. This represents
growth of approximately 13% over quarter ended June 30, 2016.
SMP’s revenues for quarter ended June 30, 2017 were € 851.1 million which is higher than the revenues for
the corresponding previous quarter ended June 30, 2016 at € 737.0 million. This represents growth of
approximately 15% over quarter ended June 30, 2016.
SMR’s revenues for quarter ended June 30, 2017 were € 399.1 million which is higher than the revenues for
the corresponding previous quarter ended June 30, 2016 at € 373.7 million. This represents growth of
approximately 7% over quarter ended June 30, 2016.
Split of revenue (€ Millions) between SMP and SMR was as under:
SMRPBV SMP SMR
SMP, which is the interior & exterior module business, contributed 68% of the revenues and SMR, which is
interior & exterior mirror business contributed 32% of the revenue for the quarter ended June 30, 2017 vis-à-
vis 66% and 34% respectively for the quarter ended June 30, 2016.
Geographical Spread of Revenues
During the quarter ended June 30, 2017, 68.2% of the revenues were contributed by European region, APAC
region contributed 13.7% and Americas contributed 18.1% to the overall group revenues. While the company
envisage healthy revenue growth across various geographies on consolidated basis but geographical spread of
revenues would further diversify with ramp up of commercial supplies from new plants at Mexico & China and
commencement of commercial production from Greenfields currently under construction at USA & Hungary.
€1,110.1
€1,249.313%
€ -
€ 100.0
€ 200.0
€ 300.0
€ 400.0
€ 500.0
€ 600.0
€ 700.0
€ 800.0
€ 900.0
€ 1,000.0
€ 1,100.0
€ 1,200.0
€ 1,300.0
€ 1,400.0
€ 1,500.0
Q1 FY 2016-17 Q1 FY 2017-18
€737.0
€851.115%
€ -
€ 100.0
€ 200.0
€ 300.0
€ 400.0
€ 500.0
€ 600.0
€ 700.0
€ 800.0
€ 900.0
€ 1,000.0
Q1 FY 2016-17 Q1 FY 2017-18
€373.7€399.17%
€ -
€ 100.0
€ 200.0
€ 300.0
€ 400.0
€ 500.0
€ 600.0
Q1 FY 2016-17 Q1 FY 2017-18

Interim Report for the period ended June 30, 2017 Management discussion and analysis
Page | 11
Diversified Customer Portfolio
SMRP BV Group is a trusted partner and strategic Tier I supplier to leading global OEMs and have well
established strategic relationships with several OEMs across the globe. The ability to support OEMs in every
phase of product development process differentiates the company from many of the competitors and given
the substantial investment & time that would be required to replicate company’s global footprint, strengthens
the status of SMRP BV Group as a preferred partner to most of the leading OEMs in the automotive industry.
The company is able to engage with customers during the early stages of collaborative development projects
which regularly enables the company to introduce company’s products into vehicle’s designs phase. This
collaboration when combined with close proximity to customer, technological leadership, demonstrated
reliability and financial stability results into maintaining strong track record by not only winning repeat orders
but new global upcoming platforms.
The following chart shows the revenue breakdown by customers for the quarter ended June 30, 2017 and June
30, 2016.
Germany35.7%
Spain19.5%
Hungary9.0%
UK3.4%
Portugal2.0%
France1.3%
USA6.4%
Mexico4.6%
Brazil1.8%
China7.1%
Korea5.9%
India1.4%
Others1.9%
Q1 FY 16-17.
Germany34.4%
Spain18.8%
Hungary8.1%
UK3.1%
Portugal1.6%
France1.8%
USA9.0%
Mexico6.5%
Brazil2.6%
China5.9%
Korea5.8%
India1.5%
Others0.9%
Q1 FY17-18.

Interim Report for the period ended June 30, 2017 Management discussion and analysis
Page | 12
During the quarter ended June 30, 2017, there is consistent growth in all customers, though there is significant
growth in Daimler with its share in overall revenue of SMRPBV Group increased to 14% during quarter ended
June 30, 2017 as compared to 11% during the corresponding previous quarter ended June 30, 2016, leading to
more diversified and balanced customer portfolio.
+ 15%
+13 %
26%
11%
10%10%
8%
7%
6%
5%
4%3%
2%8%
Audi23%
Daimler14%
VW10%Seat
9%
Hyundai/Kia6%
BMW7%
Porsche6%
Renault /Nissan5%
Ford5%
GM6%
JLR2%
Others 7%
Q1 FY 16-17
€1,110.1 Mio
Q1 FY 17-18
€1,249.3 Mio

Interim Report for the period ended June 30, 2017 Management discussion and analysis
Page | 13
EBITDA
The following table depicts the EBITDA and adjusted EBITDA for the quarter ended June 30, 2017 and June 30,
2016. Adjusted EBITDA represents EBITDA as adjusted for certain non-recurring items to reflect the operational
performance of SMRP BV Group.
1. Start-up cost incurred for new plants & facilities under construction € 4.7 million for quarter ended
June 30, 2016 and € 11.7 million for quarter ended June 30, 2017. There are significant start-up cost
including project management cost, trial of new products, travelling & training cost incurred for setting
up of manufacturing processes as per customer requirements, which are expensed to income
statement as conservative accounting practice. This will get normalised once the matching revenues
from the new plants will start.
Adjusted EBITDA has been consistently improving with increase of 19% for the quarter ended June 30, 2017 at
€ 99.8 million against € 83.6 million for the quarter ended June 30, 2016.
Split of adjusted EBITDA between SMP and SMR was as under:
SMRPBV SMP SMR
* After Start up cost for greenfield plants, charged to P&L
Income Statement
€ millions SMRPBV SMP SMR SMRPBV SMP SMR
Revenue 1,110.1 737.0 373.7 1,249.3 851.1 399.1
EBITDA 78.9 46.0 32.9 88.1 44.7 43.4
% to Revenue 7.1% 6.2% 8.8% 7.1% 5.3% 10.9%
Startup cost for greenfield1 (4.7) (4.7) - (11.7) (11.7) -
Adjusted EBITDA 83.6 50.7 32.9 99.8 56.4 43.4
% to Revenue 7.5% 6.9% 8.8% 8.0% 6.6% 10.9%
3M ended June 30, 20173M ended June 30, 2016
€78.9
€88.1
€4.7
€11.7€83.6
€99.8
€ 30.0
€ 40.0
€ 50.0
€ 60.0
€ 70.0
€ 80.0
€ 90.0
€ 100.0
€ 110.0
Q1 FY 2016-17 Q1 FY 2017-18
Reported EBITDA* Startup Cost Adjusted EBITDA
19%
€46.0 €44.7
€4.7€11.7
€50.7
€56.4
€ 10.0
€ 20.0
€ 30.0
€ 40.0
€ 50.0
€ 60.0
€ 70.0
Q1 FY 2016-17 Q1 FY 2017-18
Reported EBITDA* Startup Cost Adjusted EBITDA
11%
€32.9
€43.4
€ 10.0
€ 15.0
€ 20.0
€ 25.0
€ 30.0
€ 35.0
€ 40.0
€ 45.0
€ 50.0
€ 55.0
€ 60.0
Q1 FY 2016-17 Q1 FY 2017-18
32%

Interim Report for the period ended June 30, 2017 Management discussion and analysis
Page | 14
COST OF MATERIALS
Cost of materials includes purchases of raw materials, purchases of goods and tools for resale, discounts for
prompt payment, purchase returns and similar transactions, volume discounts, changes to inventories,
consumption of other supplies and purchase of pre-constructed components. These are primarily variable in
nature based on the product mix sold during the period. Cost of material was at € 809.2 million which
accounted for 64.8% of revenues for the quarter ended June 30, 2017. This is higher as compared to €714.9
million which accounted for 64.4% of revenues for the corresponding previous quarter ended June 30, 2016.
These increase in cost of materials is primarily due to increased production volume and higher engineering
projects due to launch of new projects for our OEMs. The total cost of material is consistent as percentage of
revenue.
PERSONNEL COSTS
Personnel expenses include wages, salaries, paid labour rendered by third parties, employer’s social security
contributions and other welfare expenses. Personnel expenses are primarily driven by the size of our
operations, our geographical reach and customer requirements. Personnel expenses were at € 242.7 million
which accounted for 19.4% of revenues for the quarter ended June 30, 2017. This is higher in absolute terms
as compared to € 215.2 million which accounted for 19.4% of revenues for the corresponding previous quarter
ended June 30, 2016. Such increase in absolute value was primarily due to increased capacity and production
level, ramp up of production from new facilities, Mexico & China and headcount at new Greenfield plants in
USA and Hungary during their construction phase.
OTHER OPERATING EXPENSES
Other operating expenses primarily consists of general administrative expenses, energy costs, repair &
maintenance costs, rental & lease costs, freight & forwarding costs, auditors remuneration, net foreign
exchange loss and legal & professional fees. Other operating expenses for the quarter ended June 30, 2017
were at € 122.1 million as compared to € 108.2 million for the corresponding previous quarter ended June 30,
2016. The increase in absolute terms was primarily due to higher production levels and ramp up of production
at new facilities as compared to corresponding previous quarter.
OTHER OPERATING INCOME
Other operating income primarily consists of income from development work & other recoveries from
customers, recovery of proceeds from insurance claims, rental income, royalty income and subsidies or grants.
Other operating income for the quarter ended June 30, 2017 were at € 12.8 million as compared to € 7.2 million
for the quarter ended June 30, 2016. The increase is primarily due to gain on foreign exchange transactions of
€ 1.4 million during the quarter ended June 30, 2017 as against € 0.3 million loss in the corresponding previous
quarter (appearing under Other Operating Expenses). Further there has been increase in subsidies by € 1.3
million over the corresponding previous quarter.
DEPRECIATION & AMORTISATION
Depreciation & Amortisation refers to the amount recognized in our income statement under this concept
reflecting the amortized value of the tangible and intangible assets on a straight-line basis over the estimated
useful life of the asset. Depreciation & Amortisation for the quarter ended June 30, 2017 were at € 30.1 million
and € 28.8 million for the quarter ended June 30, 2016. The increase in absolute values reflect impact of

Interim Report for the period ended June 30, 2017 Management discussion and analysis
Page | 15
depreciation on Greenfield facilities which commenced commercial production during the last financial year
and other capital expenditure incurred during the last financial year.
FINANCE COSTS/(INCOME)
Finance cost consists primarily of interest expense on borrowings, finance leases and defined benefit
obligations as well as foreign exchange losses on long-term loans. Finance income consists of interest income,
return on plan assets under defined benefit obligations and foreign exchange gain.
Net Finance cost for the quarter ended June 30, 2017 was at € 13.0 million as compared to € 8.2 million for the
quarter ended June 30, 2016.
The following table depicts the net finance cost and adjusted net finance cost for the quarter ended June 30,
2017 and June 30, 2016. Adjusted net finance cost represents finance cost as adjusted for amortisation of bond
issuance cost & upfront fees paid on credit facilities and foreign exchange gain/(loss) included in finance cost:
As evident from above table, after excluding impact of amortisation of bond issuance cost and upfront fee and
forex loss on reinstatement of foreign currency loans and related items included in net finance cost, there is
an increase of € 2.3 million in adjusted net finance cost primarily due to interest expense on new issue of US$
400.0 million senior secured notes issued during the quarter ended June 30, 2016.
Exceptional finance costs
During the quarter ended June 30, 2017 the Company recorded € 21.2 million towards one time/exceptional
costs on early redemption of € 500 million notes and write-off of unamortised transaction costs as explained
in Note A.6.4.8 of the interim financial statements.
INCOME TAXES
Income tax represents the sum of tax currently payable and deferred tax under the laws of each jurisdiction in
which the business is conducted. Income tax expenses for the quarter ended June 30, 2017 were € 15.4 million
as compared to € 15.0 million for the quarter ended June 30, 2016.
Net Finance Cost -€ millions Q1 FY 16-17 Q1 FY 17-18 Inc(+)/Dec(-)
Net Finance Cost 8.2 13.0 4.8
Less:
Amortisation charge1 (0.7) (1.0) (0.3)
Foreign Exchange Loss (Net) 2 0.5 (1.7) (2.2)
Adjusted net finance cost 8.0 10.3 2.3
1 Represents prorata amortisation of bond issuance cost and upfront fees paid on credit facilities2 Foreign exchange gain / (loss) on reinstatement of foreign currency loans and related item

Interim Report for the period ended June 30, 2017 Management discussion and analysis
Page | 16
TRADE WORKING CAPITAL
Trade Working Capital of the company comprises of receivables, inventories and payables. Net trade working
capital as at June 30, 2017 was at € 230.0 million and as at March 31, 2017 was at € 123.2 million. Net trade
working capital represents 17 days for June 30, 2017 which is higher than 10 days of working capital as at March
31, 2017.
Days on hand are calculated based on 360 days basis
Analysis on each of these element are described below :
Receivables
Receivables represents the amount to be received from customers for which goods have already been sold and
delivered to the customers or title of the property in goods have been transferred to customers. Trade
receivable are recognised initially at fair value and carried at amortised cost. These are net of impairment due
to delay or defaults which become likely in specific cases.
The Company had current receivables for € 304.2 million and € 330.9 million as at June 30, 2017 and March 31,
2017 respectively. These represent days on hand for 22 days and 26 days respectively.
In some cases engineering receivables are paid by our OEMs during program life through piece price
amortisation and hence related receivables form parts of our long term receivables. The company had such
amortisation receivables for € 148.5 million and € 129.2 million as at June 30, 2017 and March 31, 2017
respectively. These represent days on hand for 11 days and 10 days respectively. The increase as at June 30,
2017 is due to new launches during the year and therefore due to the basic characteristic of these receivables
having longer recovery period as per terms of the contract, the days were higher.
Jun 16 Mar 17 Jun 17
Trade Payables (46) (63) (52)
Inventory 15 15 15
Receivables 23 26 22
Receivables - Amortisation 10 10 11
Receivables - Engineering
WIP*16 22 21
10 18 17
€ Millions. No of Days.
* Receivables - Engineering WIP represents in-progress engineering inventory
recognized as receivables under percentage of completion method
Jun 16 Mar 17 Jun 17
Trade Payables (572.8) (801.2) (722.0)
Inventory 182.7 186.6 203.0
Receivables 288.9 330.9 304.2
Receivables - Amortisation 120.9 129.2 148.5
Receivables - Engineering
WIP*195.0 277.7 296.3
123.2 214.7
230.0

Interim Report for the period ended June 30, 2017 Management discussion and analysis
Page | 17
Further, the company had engineering WIP which represents in-progress engineering inventory recognized as
receivables under percentage of completion method. The company had such receivables in form of engineering
in progress for € 296.3 million and € 277.7 million as at June 30, 2017 March 31, 2017 respectively. These
represent days on hand for 21 days and 22 days respectively.
Inventories
Inventories represent the amount of raw material, work-in-progress and finished goods held by the company
in normal course of business. Inventories are carried at the lower of the cost or net realisable value at the
reporting date. These are net of impairment due to reduced market visibility or obsolescence. The Company
had inventory for € 203.0 million and € 186.6 million as at June 30, 2017 and March 31, 2017 respectively. The
inventory levels increased due to increased capacity & production levels and start-up of new plants. The
inventories represented days on hand for 15 days as at June 30, 2017 which is consistent with days on hand of
15 days as at March 31, 2017.
Payables
Payables comprise of trade payables and payables for capital goods. Trade Payables represents obligations to
pay for goods or services that have been acquired in the ordinary course of business from the suppliers. Payable
towards capital creditors represent current obligation to pay for machinery and other such items in the nature
of capital expenditure and also payables for work done by third parties in relation to assets under construction.
Payables are carried at their fair value.
The Company had payables for € 722.0 million and € 801.2 million as at June 30, 2017 and March 31, 2017
respectively. These represent days on hand for 52 days and 63 days respectively. Trade payables were relatively
high as at March 31, 2017 due to the fact that there was higher engineering projects and significant
capitalisation for new plants and a large portion of these were under engineering approval. Most of these
payables have been paid off during the quarter ended June 30, 2017 leading to lower amount as of June 30,
2017.
Interim Report for the period ended June 30, 2017 Management discussion and analysis
Page | 18
CAPITAL EXPENDITURE
SMRP BV Group’s growth strategy includes expanding operations in line with customers’ growth and sales
order book. The company is one of the few suppliers in its product segment with a global engineering &
manufacturing footprint and this strong geographical diversification enables the company to capitalise on
global growth opportunities while mitigating the impact of any regional demand fluctuations. The company
continuously assess the need for setting up Greenfield plants or expand capacities in existing plants to cater to
new platforms with existing/new customers.
SMRP BV Group is also focussed on improving the cost base by enhancing the vertical integration of the
manufacturing operations. Capital expenditure is also incurred to upgrade or replace key machineries utilised
in manufacturing & assembly process to increase production efficiencies. The establishment period for new
manufacturing facilities typically ranges between 12 and 24 months. Such capital expenditure primarily relates
to the building of new manufacturing plants or increasing the capacities in existing plants in response to new
orders from our customers.
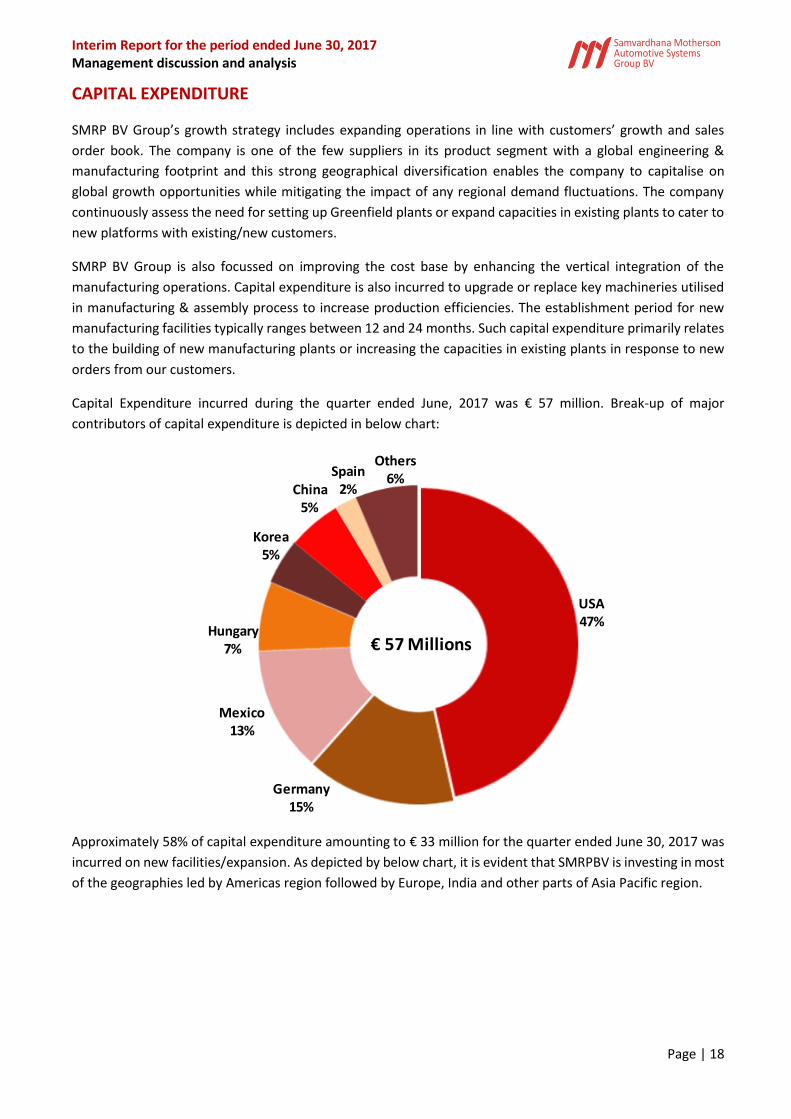
Capital Expenditure incurred during the quarter ended June, 2017 was € 57 million. Break-up of major
contributors of capital expenditure is depicted in below chart:
Approximately 58% of capital expenditure amounting to € 33 million for the quarter ended June 30, 2017 was
incurred on new facilities/expansion. As depicted by below chart, it is evident that SMRPBV is investing in most
of the geographies led by Americas region followed by Europe, India and other parts of Asia Pacific region.
USA47%
Germany 15%
Mexico13%
Hungary7%
Korea5%
China5%
Spain2%
Others6%
€ 57 Millions

Interim Report for the period ended June 30, 2017 Management discussion and analysis
Page | 19
The capital expenditure on expansion mainly includes the on-going setting up of SMP Greenfield plant in
Tuscaloosa (USA) to cater to new customer orders. This facility is expected to start from Q1 FY 2018-19. SMP
group is also incurring the capital expenditure in setting up of Greenfield plant in Kecskemet (Hungary) to cater
to new customer orders. This facility is expected to start from Q4 FY 2017-18.
Capital expenditure also include paintshop expansion at SMR group for its external rear view manufacturing
plants at San Luis Potosí (Mexico) and Mosonszolnok (Hungary) and expansion at Korea and USA.
USA76%
Mexico7%
China6%
Hungary5%
Korea4%
Others2%

Interim Report for the period ended June 30, 2017 Management discussion and analysis
Page | 20
CASH FLOW
The following summarises cash flow information for the quarter ended June 30, 2017:
Operating Activities
Net cash spent on operating activities for the quarter ended June 30, 2017 was € 41.1 million. Cash generated
from operations before changes in working capital & income tax was € 87.7 million. This is primarily due to
higher earnings before taxes and improved profitability of our business. However cash outflow on working
capital was € 104.9 million due to payment of trade payables in the normal course of business as well as
increase in inventories to support the ramp-up of production levels at Greenfield facilities in China and Mexico.
Income Tax payment of € 23.9 million was made during the quarter ended June 30, 2017.
Investing Activities
Net cash flow utilised in investing activities during the quarter ended June 30, 2017 was € 80.7 million. This
was primarily contributed by amount paid for purchase of property, plant & equipment (including advances)
for € 81.4 million. This was primarily incurred for the construction in progress of two new plants in Tuscaloosa,
U.S. and Kecskemét in Hungary as well as for the expansion of existing facilities in US, Mexico, Hungary, Korea
and USA.
Statement of Cash Flows (€ millions)April 1, 2016 to
Jun 30, 2016
April 1, 2017 to
Jun 30, 2017
Cash flow from operating activities before changes in
working capital and income tax 82.6 87.7
Changes in working capital (65.5) (104.9)
Income tax paid (13.2) (23.9)
Cash flow from operating activities 3.9 (41.1)
Purchase of property, plant and equipment
(including Pre-Payments) (55.9) (81.4)
Acquisition of Minority at SMR (9.2) -
Others 5.8 0.7
Cash flow from investing activities (59.3) (80.7)
Proceeds from issue of bond 267.3 -
Net Proceeds/(Repayment) of borrowings
(including finance leases) (62.3) 35.2
Interest Paid (5.7) (13.6)
Others - (10.2)
Cash flow from financing activities 199.3 11.4
Net increase in cash and cash equivalents 143.9 (110.4)
Cash and cash equivalents at the beginning of the period 192.5 506.0
Variation in cash and cash equivalents from translation in
foreign currencies 0.4 (3.2)
Cash and cash equivalents at the end of the period 336.8 392.4

Interim Report for the period ended June 30, 2017 Management discussion and analysis
Page | 21
Financing Activities
Net cash flow generated from financing activities for quarter ended June 30, 2017 was € 11.4 million. This mainly constituted proceeds from various working capital facilities utilised during the quarter. This was offset by Interest payment on financial liabilities for the quarter ended June 30, 2017 was € 13.6 million and € 10.1 million dividend payment to non-controlling interest holders.
SIGNIFICANT FINANCING ARRANGEMENTS
Revolving Credit Facilities On June 20, 2017 the Company entered into a new Revolving Credit Facilities Agreement (“RCF 2017”) with various banks.
The RCF 2017 is guaranteed by the Company and certain of its subsidiaries, and will benefit from the same collaterals as all the existing Senior Secured Notes issued by the Company. The RCF 2017 establishes multi-currency revolving credit facilities for an aggregate principal amount of €480.0 million (subsequently increased to €500.0 million in July 2017) which will mature on the date falling four years from the issue date i.e. June 20, 2021. The existing Revolving Credit Facility Agreement entered into on June 23, 2015 (“RCF 2015”) for an aggregate principal amount of €350.0 million has been subsequently terminated on June 21, 2017.
Issue of Senior Secured Notes On July 06, 2017, the Company issued €300.0 million 1.8% Senior Secured Notes due 2024 (the "Notes") at 99.299% of the nominal value. The Notes carry coupon at a rate of 1.80% payable annually on 06 July each year and will mature on July 06, 2024. The Notes are listed on the Irish Stock Exchange and trade on the Global Exchange Market. The entire proceeds from the issue of the Notes along with a portion of cash balance of the Company has been
utilized on July 06, 2017 to repay existing €500.0 million 4.125% Notes due 2021.
The €500.0 million Notes were repaid at a redemption price (excluding accrued interest) of 102.171%
calculated in accordance with the terms of indenture for the said Notes.

Interim Report for the period ended June 30, 2017 Management discussion and analysis
Page | 22
DEBT & CASH Gross Debt
Gross Debt as at June 30, 2017 was € 1,038.5 million against € 1,021.9 million as at March 31, 2017. Increase
in Gross debt during the quarter ended June 30, 2017 was primarily on account of utilisation of working capital
facilities during the quarter.
Break-up of Gross Debt into various facilities is as under:
This space has been intentionally left blank
30.06.16 31.03.17 30.06.17
RCF 1 2.9 10.0 10.1
Finance Lease 12.3 7.8 6.8
Working Capital 26.8 25.4 56.1
Term Loan 9.9 19.4 21.5
HY Bond 852.2 959.3 944.0
1,021.9 1,038.5
904.1

Interim Report for the period ended June 30, 2017 Management discussion and analysis
Page | 23
Cash & Net Debt
Cash and cash equivalent was € 392.4 million as at June 30, 2017 and € 506.0 million as at March 31, 2017.
Cash balance decreased due to payments on account of capital expenditure as well as creditors and other
working capital items.
Net Debt was € 646.1 million as on June 30, 2017 and € 515.9 million as on March 31, 2017. The increase in net
debt is largely due to capital expenditure incurred in setting up of new facilities.
This space has been intentionally left blank
Cash.€ Mio.
336.8
506.0
392.4
30.06.16 31.03.17 30.06.17
Net debt & net leverage.€ Mio.
567.3
515.9
646.1
1.92
1.43
1.74
30.06.16 31.03.17 30.06.17

Interim Report for the period ended June 30, 2017 Management discussion and analysis
Page | 24
LIQUIDITY ANALYSIS
SMRP BV Group’s liquidity requirements arise principally from operating activities, capital expenditure for new
facilities, maintenance & expansion capital expenditure, short term investments in engineering projects for
customer new product launches, repayment of borrowings and debt service obligations. Principal source of
funding includes cash from operations, committed credit lines, short-term loans and overdraft facilities at some
of the operating entities.
Cash generated from operating subsidiaries is utilised to finance growth within the operations of such
subsidiary or is transferred to holding companies through the payment of dividends or inter-company loans. In
most cases there are no significant obstacles or barriers for such transfer of funds but these are always subject
to local jurisdictions at respective country.
As at June 30, 2017 SMRP BV Group had significant liquidity under committed revolver credit facilities as
follows:
* Available liquidity subject to headroom under leverage ratios
** Sanctioned limit increased to €500 Mn subsequent to June 30, 2017
*** Earlier RCF facility of € 350 million was replaced with a new RCF facility during June 2017
Status of leverage ratio as at June 30, 2017:
€ in MillionsSanctioned
Limit**
Utilised as at
June 30, 2017
Liquidity
Available
RCF (including Ancilary facility) *** 480.0 10.1 469.9
Cash and Cash Equivalents 392.4
Total Liquidity Available 862.3
Key Ratios# Allowed June 30, 2017
Gross Leverage Ratio: Indenture 3.50x 2.78x
Net Leverage Ratio : RCF 3.25x 1.74x
# Computed as per definitions given in Indenture & RCF agreements

Interim Report for the period ended June 30, 2017 Unaudited Interim Condensed Consolidated Financial Statements All amounts in Euro’000, unless otherwise stated
Page | 25
Samvardhana Motherson Automotive Systems Group BV
Unaudited Interim Condensed Consolidated Financial
Statements
For the period ended June 30, 2017

Interim Report for the period ended June 30, 2017 Unaudited Interim Condensed Consolidated Financial Statements All amounts in Euro’000, unless otherwise stated
Page | 26
A. CONSOLIDATED FINANCIAL STATEMENTS

Interim Report for the period ended June 30, 2017 Unaudited Interim Condensed Consolidated Financial Statements All amounts in Euro’000, unless otherwise stated
Page | 27
A.1 Consolidated Statement of Financial Position Note June 30, 2017 March 31, 2017
Assets
Property, plant and equipment A.6.3.1 1,131,866 1,139,428
Intangible assets 27,181 29,106
Investment properties 10,400 10,466
Investments accounted for using the equity method 20,220 17,916
Other financial instruments A.6.3.2 5 3,508
Trade receivables and other assets 142,580 120,305
Deferred tax assets 39,892 39,496
Non-current assets 1,372,144 1,360,225
Inventories 202,981 186,649
Trade receivables 636,556 643,167
Current tax assets 7,642 3,741
Other financial instruments A.6.3.2 804 719
Other receivables 115,240 118,099
Cash and cash equivalents A.6.3.3 392,403 506,048
Current assets 1,355,626 1,458,423
Total assets 2,727,770 2,818,648
Equity and liabilities
Shareholder’s equity A.5 463,507 484,707
Non-controlling interests A.5 91,869 99,869
Equity 555,376 584,576
Borrowings A.6.3.4 965,136 980,116
Employee benefit obligations 12,952 12,767
Provisions 2,360 2,515
Other financial instruments A.6.3.2 7,467 151
Other liabilities 38,640 42,252
Deferred tax liabilities 51,694 51,797
Non-current liabilities 1,078,249 1,089,598
Trade payables 721,999 801,199
Provisions 16,268 20,287
Borrowings A.6.3.4 73,359 41,762
Liabilities to related parties 24,166 25,256
Other financial instruments A.6.3.2 340 961
Current tax liabilities 10,971 15,208
Other liabilities 247,042 239,801
Current liabilities 1,094,145 1,144,474
Liabilities 2,172,394 2,234,072
Total 2,727,770 2,818,648
The notes on pages 34 to 67 are an integral part of these unaudited interim condensed consolidated financial statements.
Interim Report for the period ended June 30, 2017 Unaudited Interim Condensed Consolidated Financial Statements All amounts in Euro’000, unless otherwise stated
Page | 28
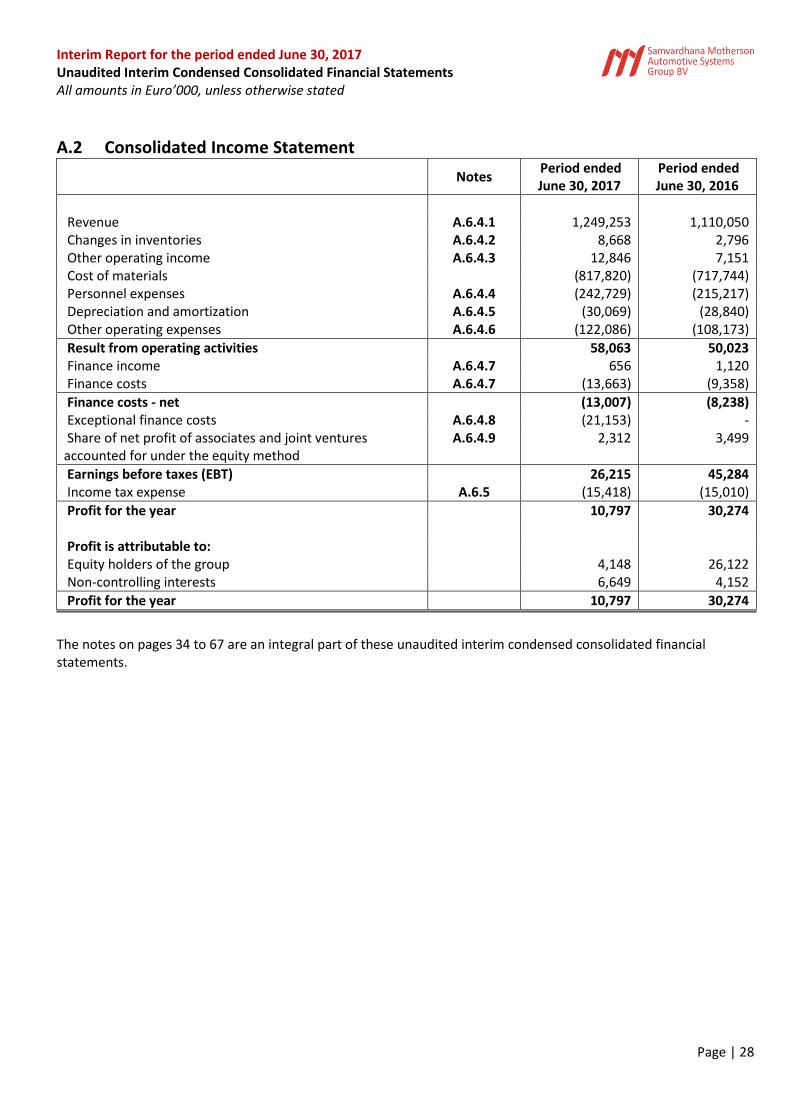
A.2 Consolidated Income Statement
Notes
Period ended June 30, 2017
Period ended June 30, 2016
Revenue A.6.4.1 1,249,253 1,110,050 Changes in inventories A.6.4.2 8,668 2,796 Other operating income A.6.4.3 12,846 7,151 Cost of materials (817,820) (717,744) Personnel expenses A.6.4.4 (242,729) (215,217) Depreciation and amortization A.6.4.5 (30,069) (28,840) Other operating expenses A.6.4.6 (122,086) (108,173)
Result from operating activities 58,063 50,023 Finance income A.6.4.7 656 1,120 Finance costs A.6.4.7 (13,663) (9,358)
Finance costs - net (13,007) (8,238) Exceptional finance costs A.6.4.8 (21,153) - Share of net profit of associates and joint ventures accounted for under the equity method
A.6.4.9 2,312 3,499
Earnings before taxes (EBT) 26,215 45,284 Income tax expense A.6.5 (15,418) (15,010)
Profit for the year 10,797 30,274 Profit is attributable to: Equity holders of the group 4,148 26,122 Non-controlling interests 6,649 4,152
Profit for the year 10,797 30,274
The notes on pages 34 to 67 are an integral part of these unaudited interim condensed consolidated financial statements.

Interim Report for the period ended June 30, 2017 Unaudited Interim Condensed Consolidated Financial Statements All amounts in Euro’000, unless otherwise stated
Page | 29
A.3 Consolidated Statement of Comprehensive Income
Period ended June 30, 2017
Period ended June 30, 2016
Profit for the year: 10,797 30,274 Other comprehensive income: (29,842) 15,952 Items that will not be reclassified to profit or loss Remeasurements of post-employment benefit obligations (314) 351 Income tax relating to these items 95 (131) Items that may be subsequently classified to profit or loss Cash flow hedges 735 - Exchange differences on translation of foreign operations (30,358) 15,732
Total comprehensive income for the year (19,045) 46,226
Total comprehensive income is attributable to: Equity holders of the group (21,060) 42,223 Non-controlling interests 2,015 4,003
(19,045) 46,226
The notes on pages 34 to 67 are an integral part of these unaudited interim condensed consolidated financial statements.

Interim Report for the period ended June 30, 2017 Unaudited Interim Condensed Consolidated Financial Statements All amounts in Euro’000, unless otherwise stated
Page | 30
A.4 Consolidated Cash Flow Statement Note Period ended
June 30, 2017 Period ended June 30, 2016
CASH FLOWS FROM OPERATING ACTIVITIES Profit for the year before tax A.2 26,215 45,284 Adjustments for: Depreciation of property, plant and equipment and investment properties
A.6.4.5 28,042 26,217
Amortisation of intangibles A.6.4.5 2,027 2,623 (Gain) / loss from the sale of property, plant and equipment, investment properties and assets held for sale
106 80
Finance costs – net (excluding foreign exchange loss) 32,492 8,864 Share of profits of JV and associates accounted for using equity method
A.6.4.9 (2,312) (3,499)
Reversal / addition of bad debt allowances and provisions 608 483 Unrealised foreign exchange (gain)/loss 617 2,558
Cash flows from operations before working capital changes 87,795 82,610
Working capital changes Increase in provisions (4,568) 2,413 Increase in inventories (21,279) (17,625) Increase in trade receivables (16,554) (51,150) Increase in other assets1 (11,091) (18,521) (Increase)/Decrease in trade payables (45,245) 9,513 (Increase)/Decrease in other liabilities2 (6,183) 9,828
Cash flows from operating activities before income tax (17,125) 17,068 Income taxes paid (23,929) (13,182)
Cash flows from operating activities (A) (41,054) 3,886
CASH FLOWS FROM INVESTING ACTIVITIES Payments for property, plant & equipment (including advances) (81,431) (57,594) Payments for intangible assets (232) (371) Proceeds from sale of property, plant and equipment 235 2,037 Payments for purchase of investments 26 - Dividends received from joint ventures - 6,035 Investment in non-consolidated entities - (770) Acquisition of non-controlling interests - (9,219) Interest received 656 494
Cash flows from investing activities (B) (80,746) (59,388)

Interim Report for the period ended June 30, 2017 Unaudited Interim Condensed Consolidated Financial Statements All amounts in Euro’000, unless otherwise stated
Page | 31
Note Period ended June 30, 2017
Period ended June 30, 2016
CASH FLOWS FROM FINANCING ACTIVITIES Dividends paid to non-controlling interest in subsidiaries (10,155) - Finance lease payments (804) (1,277) Proceeds from borrowings 36,148 253,298 Repayment of borrowings (net) (189) (47,060) Interest paid (13,631) (5,680)
Cash flows from financing activities (C) 11,369 199,281
Net increase (decrease) in cash and cash equivalents (A+B+C) (110,431) 143,779 Cash and cash equivalents at beginning of the financial year 506,048 192,518 Effects of exchange rate changes on cash and cash equivalents (3,214) 482 Cash and cash equivalents at the end of year A.6.3.3 392,403 336,779
1 Other asset comprise of tax receivables, other financial and non-financial assets. 2 Other liabilities comprise of prepayment received, liabilities from shareholders, and other financial and non-financial liabilities.
The notes on pages 34 to 67 are an integral part of these unaudited interim condensed consolidated financial statements.

Interim Report for the period ended June 30, 2017 Unaudited Interim Condensed Consolidated Financial Statements All amounts in Euro’000, unless otherwise stated
Page | 32
A.5 Consolidated Statement of Changes in Equity
Attributable to owners of the parent
Non-controlling
interest Total equity Subscribed
capital Share
premium
Currency translation
reserve
Retained earnings
Merger reserve
Cash flow hedge
reserve Total
As at April 01, 2017 66 900,910 26,796 282,279 (722,686) (2,658) 484,707 99,869 584,576 Total comprehensive income Profit for the year - - - 4,148 - - 4,148 6,649 10,797 Other comprehensive income Items that may be subsequently classified to profit or loss
Cash flow hedges - - - - - 723 723 12 735 Exchange differences on translation of foreign operations - - (26,010) - - - (26,010) (4,348) (30,358) Items that will not be reclassified to profit or loss
Remeasurements of post-employment benefit obligations - - - (253) - - (253) (61) (314) Income tax relating to these items - - - 74 - - 74 21 95 Total other comprehensive income - - (26,010) (179) - 723 (25,466) (4,375) (29,842) Total comprehensive income - - (26,010) 3,969 - 723 (21,318) 2,274 (19,045)
Transactions with owners Addition during the year - - - 118 - - 118 (118) - Dividend distribution to non-controlling interests - - - - - - - (10,155) (10,155) Total transactions with owners - - - 118 - - 118 (10,273) (10,155) As at June 30, 2017 66 900,910 786 286,366 (722,686) (1,935) 463,507 91,869 555,376

Interim Report for the period ended June 30, 2017 Unaudited Interim Condensed Consolidated Financial Statements All amounts in Euro’000, unless otherwise stated
Page | 33
Attributable to owners of the parent Non-
controlling interest
Total equity Subscribed capital
Share premium
Currency translation
reserve
Retained earnings
Merger reserve
Cash flow hedge
reserve Total
As at April 01, 2016 66 900,910 (4,139) 159,196 (722,686) - 333,347 70,795 404,142
Total comprehensive income
Profit for the year - - - 26,122 - - 26,122 4,152 30,274
Other comprehensive income
Items that may be subsequently classified to profit or loss
Cash flow hedges
Exchange differences on translation of foreign operations
- - 15,871 - - - 15,871 (139) 15,732
Items that will not be reclassified to profit or loss
Remeasurements of post-employment benefit obligations
- - - 364 - - 364 (13) 351
Income tax relating to these items - - - (136) - - (136) 5 (131) Total other comprehensive income - - 15,871 228 - - 16,099 (147) 15,952 Total comprehensive income - - 15,871 26,350 - - 42,221 4,005 46,226
Transactions with owners
Addition during the year - - - (3,455) - - (3,455) (5,764) (9,219) Dividend distribution to non-controlling interests
- - - - - - - - -
Total transactions with owners - - - (3,455) - - (3,455) (5,764) (9,219) As at June 30, 2016 66 900,910 11,732 182,091 (722,686) - 372,113 69,036 441,149
The notes on pages 34 to 67 are an integral part of these unaudited interim condensed consolidated financial statements.

Interim Report for the period ended June 30, 2017 Unaudited Interim Condensed Consolidated Financial Statements All amounts in Euro’000, unless otherwise stated
Page | 34
A.6. Notes to the Consolidated Financial Statements
A.6.1 General information and description of the business These unaudited interim condensed consolidated financial statements comprise of Samvardhana Motherson Automotive Systems Group BV (SMRP BV) and its subsidiaries (hereinafter referred to as “SMRP BV Group” or “the Group”) for the three months ended June 30, 2017. A list of subsidiaries consolidated is in Note A.6.2.3. MSSL is the ultimate parent of SMRP BV Group. SMRP BV is a private company with limited liability, incorporated under the laws of the Netherlands on
October 07, 2011. Its registered office and principal place of business is situated at Hoogoorddreef 15, 1101
BA Amsterdam, The Netherlands.
These unaudited interim condensed consolidated financial statements have been approved for issue by SMRP BV’s management and supervisory board on August 11, 2017. The management and supervisory board has the power to amend and reissue the financial statements. SMR Group On March 6, 2009 Samvardhana Motherson Reflectec Group Holdings Limited acquired the Visiocorp Group. SMR Group produces a wide range of rear view vision systems primarily for light vehicles. SMR is active in every phase of the product development cycle, and its product portfolio covers a wide spectrum of vehicle and price segments, from low-cost mirrors to highly complex premium mirrors incorporating a variety of electronic features. SMR’s focus on research & development and customer collaboration has resulted in various first-to-market innovations and a variety of full system solutions tailored to the needs of OEMs and end consumers, including Blind Spot Detection Systems (BSDS) and Telescopic Trailer Tow (TTT) mirrors. It has production facilities and engineering centres in 16 countries across the globe. SMP Group SMRP BV acquired the Peguform Group as on November 23, 2011.
SMP Group produce various polymer-based interior and exterior products for light vehicles. SMP’s product portfolio is primarily comprised of complete modules, including door panels, instrument panels and bumpers as well as other plastic components and systems, such as centre consoles, decorative interior trims and plastic body parts. These products involve a complex manufacturing and assembly processes, require significant systems integration expertise and represent key comfort and aesthetic features of the vehicles in which they are integrated. The product range encompasses individual parts and complete modules, with engineering and tooling services also being provided. It has production facilities and engineering centres in 9 countries across the globe.

Interim Report for the period ended June 30, 2017 Unaudited Interim Condensed Consolidated Financial Statements All amounts in Euro’000, unless otherwise stated
Page | 35
A.6.2 Summary of Significant Accounting Policies
A.6.2.1 Basis of preparation
The unaudited interim condensed consolidated financial statements of the Group have been prepared for reporting to the bondholders of the senior secured notes issued by SMRP BV. The interim condensed consolidated financial statements have been prepared in accordance with International Financial Reporting Standards (“IFRS”) as adopted by the European Union (“IFRS EU”). The accounting policies adopted in the preparation of the interim condensed consolidated financial statements are consistent with those followed in the preparation of the Group’s annual consolidated financial statements for the year ended March 31, 2017. The new standards and interpretations applicable for financial year beginning April 01, 2017 do not have any impact on the unaudited interim condensed consolidated financial statements of the Group. These interim financial statements does not include all the notes of the type normally included in an annual financial statement. Accordingly, this should be read in conjunction with the annual report for the year ended March 31, 2017. The unaudited interim condensed consolidated financial statements have been prepared under the historical cost convention except for available-for-sale financial assets, and financial assets and financial liabilities (including derivative instruments) at fair value through profit or loss.
The unaudited interim condensed consolidated financial statements are presented in euros and all values are rounded to the nearest thousand (€000), except when otherwise indicated.
A.6.2.2 Currency translation
A.6.2.2.1 Transactions in foreign currencies
All transactions are recorded in functional currency of the principal operating environment in which each Group company operates. The Consolidated financial statements are presented in ‘euro’, which is also the parent company’s functional currency. Foreign currency transactions are translated into the functional currency using the exchange rates prevailing at the dates of the transactions. Monetary assets and liabilities denominated in foreign currencies at the reporting date are translated into the functional currency at the rate prevailing on this date. Differences from foreign currency transactions are reported in the income statement. Non-monetary assets and liabilities that are measured at historical cost in foreign currencies at the reporting date are translated into the functional currency at the rate prevailing on the day of the transaction. Non-monetary assets and liabilities that are measured at fair value in foreign currencies at the reporting date are translated into the functional currency at the rate prevailing on the date on which the fair value was determined.

Interim Report for the period ended June 30, 2017 Unaudited Interim Condensed Consolidated Financial Statements All amounts in Euro’000, unless otherwise stated
Page | 36
A.6.2.2.2 Financial statements of foreign operations
The results and financial position of all the group entities that have a functional currency different from the presentation currency are translated into the presentation currency as follows: (a) assets and liabilities for each balance sheet presented are translated at the closing rate at the date of that balance sheet; (b) income and expenses for each income statement are translated at average exchange rates (unless this average is not a reasonable approximation of the cumulative effect of the rates prevailing on the transaction dates, in which case income and expenses are translated at the rate on the dates of the transactions); and all resulting exchange differences are recognised in other comprehensive income. Goodwill and fair value adjustments arising on the acquisition of a foreign entity are treated as assets and liabilities of the foreign entity and translated at the closing rate. Exchange differences arising are recognised in other comprehensive income. The exchange rates of currencies of non-Euro zone countries used for the unaudited interim condensed consolidated financial statements are listed below (expressed in foreign currency units per Euro): Foreign currencies Closing rates Average rates Closing rates Average rates Closing rates
June 30, 2017 Period ended June 30, 2017
June 30, 2016 Period ended June 30, 2016
March 31, 2017
Brazilian Real BRL 3.78 3.54 3.57 3.95 3.33 Mexican Peso MXN 20.70 20.40 20.28 20.42 19.93 Chinese Yuan CNY 7.74 7.55 7.38 7.37 7.33 US Dollar USD 1.14 1.10 1.11 1.13 1.06 Great British Pound GBP 0.88 0.86 0.83 0.79 0.85 Korean Won KRW 1,307.28 1,242.81 1,278.06 1,311.73 1,189.12 Indian Rupee INR 73.76 70.92 74.97 75.53 69.05 Thai Bhat THB 38.75 37.72 38.98 39.80 36.57 Hungarian Forint HUF 308.47 309.70 315.30 312.85 308.34 Japanese Yen JPY 128.34 122.20 114.65 121.94 118.61 Australian Dollar AUD 1.49 1.47 1.49 1.51 1.40
Interim Report for the period ended June 30, 2017 Unaudited Interim Condensed Consolidated Financial Statements All amounts in Euro’000, unless otherwise stated
Page | 37
A.6.2.3 Principles of consolidation
Subsidiaries
Subsidiaries are all entities over which the Group has control. The Group controls an entity when the Group is exposed to, or has rights to, variable returns from its involvement with the entity and has the ability to affect those returns through its power over the entity. Subsidiaries are fully consolidated from the date on which control is transferred to the Group. They are deconsolidated from the date that control ceases. Joint ventures Joint ventures are companies over which the Group holds joint control as a result of contractual agreements. The group applies IFRS 11 to all joint arrangements. Under IFRS 11 investments in joint arrangements are classified as either joint operations or joint ventures depending on the contractual rights and obligations of each investor. The group has assessed the nature of its joint arrangements and determined them to be joint ventures. Joint ventures are accounted for using the equity method. Interest in associates Associates are all entities over which the Group has significant influence but not control, generally accompanying a shareholding of 20% to 50% of the voting rights. Investments in associate are accounted for using the equity method of accounting. Under the equity method, the investment is initially recognized at cost, and the carrying amount is increased or decreased to recognize the investor’s share of profit or loss of the investee after the date of acquisition. The Group’s investment in associates includes goodwill identified on acquisition. If the ownership interest in an associate is reduced but significant influence is retained, only a proportionate share of the amounts previously recognised in other comprehensive income is reclassified to profit or loss where appropriate. Equity Method The Group’s share of post-acquisition profit or loss is recognised in the income statement, and its share of post-acquisition movements in other comprehensive income is recognized in other comprehensive income with a corresponding adjustment to the carrying amount of the investment. When the Group’s share of losses in the associate/joint venture equals or exceeds its interest in the associate/joint venture, including any other long-term receivables, the Group does not recognise further losses, unless it has incurred legal or constructive obligations or made payments on behalf of the associate/joint venture. The Group determines at each reporting date whether there is any objective evidence that the investment in the associate/joint ventures is impaired. If this is the case, the Group calculates the amount of impairment as the difference between the recoverable amount of the associate/joint ventures and its carrying value and recognizes the amount of impairment adjacent to share of profit/(loss) of an associate/joint ventures in the income statement. Accounting policies of the associates/joint ventures have been changed where necessary to ensure consistency with the policies adopted by the Group.

Interim Report for the period ended June 30, 2017 Unaudited Interim Condensed Consolidated Financial Statements All amounts in Euro’000, unless otherwise stated
Page | 38
Dilution gains and losses arising in investments in associates/joint ventures are recognized in the income statement. Elimination of business transactions in the course of consolidation Inter-company transactions, balances, income and expenses on transactions between group companies are eliminated. Profits and losses resulting from inter-company transactions that are recognised in assets are also eliminated. Profits and losses resulting from unrealised upstream and downstream transactions between the Group and its associate / joint ventures are recognized in the Group’s financial statements only to the extent of unrelated investor’s interests in the associates / joint ventures. Unrealised losses are eliminated unless the transaction provides evidence of an impairment of the asset transferred. Unrealised gains or losses from business transactions with joint ventures accounted for using the equity method have been eliminated from the investments in accordance with the amount of the holding. Business combinations The acquisition method of accounting is used to account for all business combinations, regardless of whether equity instruments or other assets are acquired. The consideration transferred for the acquisition of a subsidiary comprises the:
fair values of the assets transferred
liabilities incurred to the former owners of the acquired business
equity interests issued by the group
fair value of any asset or liability resulting from a contingent consideration arrangement, and
fair value of any pre-existing equity interest in the subsidiary. Identifiable assets acquired and liabilities and contingent liabilities assumed in a business combination are, with limited exceptions, measured initially at their fair values at the acquisition date. The group recognises any non-controlling interest in the acquired entity on an acquisition-by-acquisition basis either at fair value or at the non-controlling interest’s proportionate share of the acquired entity’s net identifiable assets. Acquisition-related costs are expensed as incurred. The excess of the
consideration transferred,
amount of any non-controlling interest in the acquired entity, and
acquisition-date fair value of any previous equity interest in the acquired entity over the fair value of the net identifiable assets acquired is recorded as goodwill. If those amounts are less than the fair value of the net identifiable assets of the business acquired, the difference is recognised directly in profit or loss as a bargain purchase. Where settlement of any part of cash consideration is deferred, the amounts payable in the future are discounted to their present value as at the date of exchange. The discount rate used is the entity’s incremental borrowing rate, being the rate at which a similar borrowing could be obtained from an independent financier under comparable terms and conditions.
Interim Report for the period ended June 30, 2017 Unaudited Interim Condensed Consolidated Financial Statements All amounts in Euro’000, unless otherwise stated
Page | 39
Contingent consideration is classified either as equity or a financial liability. Amounts classified as a financial liability are subsequently remeasured to fair value with changes in fair value recognised in profit or loss. If the business combination is achieved in stages, the acquisition date carrying value of the acquirer’s previously held equity interest in the acquire is remeasured to fair value at the acquisition date. Any gains or losses arising from such remeasurement are recognised in profit or loss. The Group recognises any non-controlling interest in the acquiree on an acquisition-by-acquisition basis,
either at fair value or at the non-controlling interest’s proportionate share of the recognised amounts of
acquiree’s identifiable net assets.
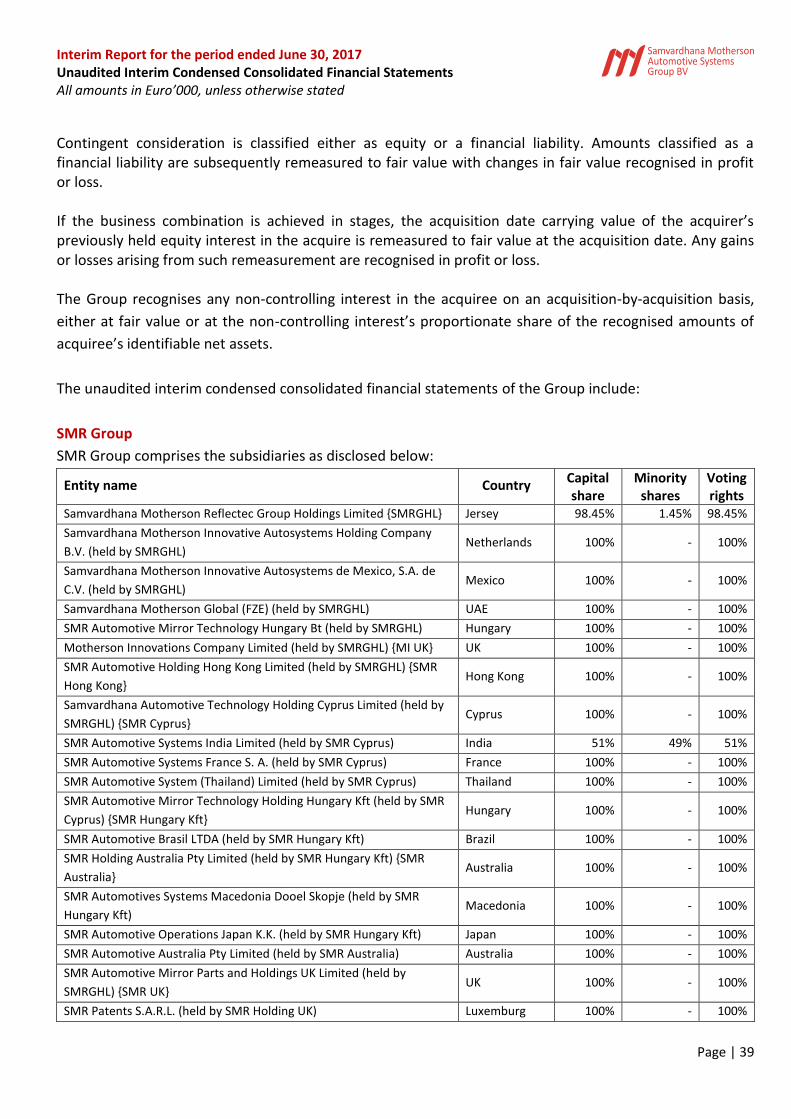
The unaudited interim condensed consolidated financial statements of the Group include:
SMR Group
SMR Group comprises the subsidiaries as disclosed below:
Entity name Country Capital share
Minority shares
Voting rights
Samvardhana Motherson Reflectec Group Holdings Limited {SMRGHL} Jersey 98.45% 1.45% 98.45%
Samvardhana Motherson Innovative Autosystems Holding Company
B.V. (held by SMRGHL) Netherlands 100% - 100%
Samvardhana Motherson Innovative Autosystems de Mexico, S.A. de
C.V. (held by SMRGHL) Mexico 100% - 100%
Samvardhana Motherson Global (FZE) (held by SMRGHL) UAE 100% - 100%
SMR Automotive Mirror Technology Hungary Bt (held by SMRGHL) Hungary 100% - 100%
Motherson Innovations Company Limited (held by SMRGHL) {MI UK} UK 100% - 100%
SMR Automotive Holding Hong Kong Limited (held by SMRGHL) {SMR
Hong Kong} Hong Kong 100% - 100%
Samvardhana Automotive Technology Holding Cyprus Limited (held by
SMRGHL) {SMR Cyprus} Cyprus 100% - 100%
SMR Automotive Systems India Limited (held by SMR Cyprus) India 51% 49% 51%
SMR Automotive Systems France S. A. (held by SMR Cyprus) France 100% - 100%
SMR Automotive System (Thailand) Limited (held by SMR Cyprus) Thailand 100% - 100%
SMR Automotive Mirror Technology Holding Hungary Kft (held by SMR
Cyprus) {SMR Hungary Kft} Hungary 100% - 100%
SMR Automotive Brasil LTDA (held by SMR Hungary Kft) Brazil 100% - 100%
SMR Holding Australia Pty Limited (held by SMR Hungary Kft) {SMR
Australia} Australia 100% - 100%
SMR Automotives Systems Macedonia Dooel Skopje (held by SMR
Hungary Kft) Macedonia 100% - 100%
SMR Automotive Operations Japan K.K. (held by SMR Hungary Kft) Japan 100% - 100%
SMR Automotive Australia Pty Limited (held by SMR Australia) Australia 100% - 100%
SMR Automotive Mirror Parts and Holdings UK Limited (held by
SMRGHL) {SMR UK} UK 100% - 100%
SMR Patents S.A.R.L. (held by SMR Holding UK) Luxemburg 100% - 100%

Interim Report for the period ended June 30, 2017 Unaudited Interim Condensed Consolidated Financial Statements All amounts in Euro’000, unless otherwise stated
Page | 40
Entity name Country Capital share
Minority shares
Voting rights
SMR Automotive Technology Valencia SAU (held by SMR Holding UK) Spain 100% - 100%
SMR Automotive Mirrors UK Limited (held by SMR Holding UK) UK 100% - 100%
SMR Automotive Services UK Limited (held by SMR Holding UK,
liquidated March 05, 2015) UK 100% - 100%
SMR Automotive Vision System Operations USA INC. (held by SMR
Holding UK) {SMR USA} USA 100% - 100%
SMR Automotive Mirror Systems Holding Deutschland GmbH (held by
SMR Holding UK) {SMR Holding Deutschland} Germany 100% - 100%
SMR Mirrors UK Limited (held by SMR USA) {SMR UK} UK 100% - 100%
SMR Automotive Mirror International USA Inc. (held by SMR UK) {SMR
International USA} USA 100% - 100%
SMR Automotive Systems USA Inc. (held by SMR International USA) USA 100% - 100%
SMP Automotive Systems Alabama Inc. (held by SMR International
USA) USA 100% - 100%
SMR Automotive Beijing Company Limited (held by SMR Hong Kong) China 100% - 100%
SMR Automotive Yancheng Company Limited (held by SMR Hong Kong) China 100% - 100%
SMR Automotive Modules Korea Limited (held by SMR Holding
Deutschland) {SMR Korea}* (earlier known as SMR Poong Jeong
Automotive Mirrors Korea Limited)
South Korea 100% - 100%
SMR Hyosang Automotive Limited (held by SMR Korea) South Korea 100% - 100%
SMR Automotive (Langfang) Co. Limited (held by SMR Korea) China 100% - 100%
SMR Automotive Beteiligungen Deutschland GmbH (held by SMR
Holding Deutschland) Germany 100% - 100%
SMR Automotive Mirrors Stuttgart GmbH (held by SMR Holding
Deutschland) {SMR Stuttgart} Germany 100% - 100%
SMR Grundbesitz GmbH & Co KG (held by SMR Holding Deutschland) Germany 93.07% 6.93% 93.07%
SMR Automotive Systems Spain S.A.U. (held by SMR Stuttgart) Spain 100% - 100%
SMR Automotive Vision Systems Mexico S.A. de C.V. (held by SMR
Stuttgart) {SMR Mexico} Mexico 100% - 100%
SMR Automotive Servicios Mexico S.A. de C.V. (held by SMR Mexico) Mexico 99.99% 0.01% 99.99%
Motherson Innovations Deutschland GmbH (held by MI UK) Germany 100% - 100%
SMR Automotive Industries Rus Limited Liability Company (held by SMR
Hungary Kft) {w.e.f. October 2016} Russia 100% - 100%
* Minority interest of 10.14% bought back during May 2016.
SMR Group comprises joint ventures and associates as disclosed below:
Entity name Country Capital
share
Ningbo SMR Huaxiang Automotive Mirrors Co. Limited China 50%
Chongqing SMR Huaxiang Automotive Products Limited China 50%
Re-Time Pty Limited Australia 35%

Interim Report for the period ended June 30, 2017 Unaudited Interim Condensed Consolidated Financial Statements All amounts in Euro’000, unless otherwise stated
Page | 41
SMP Group
SMP Group comprises the subsidiaries as disclosed below:
Name Country Capital share
Minority shares
Voting rights
Samvardhana Motherson Peguform GmbH {SMP GmbH} Germany 100% - 100%
SMP Automotive Technology Ibérica, S.L. {SMP Iberica} Spain 100% - 100%
SMP Automotive Interiors (Beijing) Co. Ltd China 100% - 100%
SMP Automotive Exterior GmbH (held by SMP GmbH) {SMP AE} Germany 100% - 100%
SMP Deutschland GmbH (held by SMP GmbH) {SMP Deutschland} Germany 94.80% 5.20% 94.80%
Samvardhana Motherson Innovative Autosystems B.V. & Co. KG (held by SMP GmbH)
Germany 100% - 100%
SMP Logistik Service GmbH (held by SMP Deutschland) Germany 100% - 100%
SMP Automotive Solutions Slovakia s.r.o. (held by SMP Deutschland) Slovakia 100% - 100%
Changchun Peguform Automotive Plastics Technology Ltd. (held by SMP Deutschland) {CPAT}
China 50% 50% 50%+1*
SMP Automotive Technology Management Services (Changchun) Co. Ltd. (held by SMP Deutschland)
China 100% - 100%
Foshan Peguform Automotive Plastics Technology Co. Ltd. (held by CPAT)
China 100% - 100%
Samvardhana Motherson Peguform Automotive Technology Portugal, S.A. (held by SMP Iberica)
Portugal 100% - 100%
SMP Automotive Technologies Teruel, S.L. (held by SMP Iberica) {SMP Teruel}
Spain 100% - 100%
Samvardhana Motherson Peguform Barcelona, S.L.U. (held by SMP Iberica) {SMP Barcelona}
Spain 100% - 100%
SMP Automotive Produtos Automotivos do Brasil Ltda (held by SMP Teruel)
Brazil 100% - 100%-1
SMP Automotive Systems México, S. A. de C. V. (held by SMP Barcelona)
Mexico 100% - 100%-1
SM Real Estate GmbH (held by SMP AE) Germany 94.80% 5.20% 94.80%
Celulosa Fabril (Cefa) S.A.** (held by SMP Iberica) {CEFA} Spain 50% 50% 50%***
Modulos Ribera Alto S.LU.** (held by CEFA) {MRA} Spain 50% 50% 50%
Motherson Innovations Lights GmbH & Co. KG (held by SMP GmbH) {MIL}
Germany 100% - 100%
Motherson Innovations Lights Verwaltungs GmbH (held by MIL) Germany 100% - 100% *SMP Deutschland GmbH has 50% of the voting rights plus one additional vote.
** w.e.f. December 20, 2016
*** Represents shareholder voting rights however majority control over board of directors
SMP Group comprises joint ventures as disclosed below:
Name Country Capital
share
Celulosa Fabril (Cefa) S.A.**** Spain 50%
Modulos Ribera Alto S.LU.**** Spain 50%
Eissmann SMP Automotive Interieur Slovensko s.r.o. Slovakia 49%
**** till December 19, 2016
Interim Report for the period ended June 30, 2017 Unaudited Interim Condensed Consolidated Financial Statements All amounts in Euro’000, unless otherwise stated
Page | 42
A.6.2.4 Intangible assets
Intangible assets acquired separately are measured on initial recognition at cost. The cost of intangible
assets acquired in a business combination is the fair value as at the date of acquisition. Following initial
recognition, intangible assets with a finite useful life are carried at cost less accumulated amortisation and
any accumulated impairment losses.
Intangible assets with finite lives are amortised over the useful economic life and assessed for impairment
whenever there is an indication that the intangible asset may be impaired. The amortisation period and the
amortisation method for an intangible asset with a finite useful life are reviewed at least at each financial
year end. Changes in the expected useful life or the expected pattern of consumption of future economic
benefits embodied in the asset are accounted for by changing the amortisation period or method, as
appropriate, and are treated as changes in accounting estimates. The amortisation expense on intangible
assets with finite lives is recognised in the income statement.
Research and development costs
Research costs are expensed as incurred. Development expenditure on an individual project is capitalised if
it meets the definition of an intangible asset. Costs not eligible for capitalisation are expensed off and
disclosed under “Research and development costs” in the income statement.
The intangible assets are amortised on a straight-line basis over their useful lives, beginning at the time the
asset is first used and ending after a length of time usual for the asset in operation. The uniform useful lives
applied within the Group are as follows:
Description Useful life (in years) Concessions, intellectual property, software and similar rights 1-3
Contracts with customers 3-11 Patents & Technologies 5-13
The useful life of customer contracts, engineering contracts as well as technology is the result of the analyses and average useful life of the contracts.
A.6.2.5 Property, plant and equipment
A.6.2.5.1 Own assets
Property, plant and equipment are stated at cost less accumulated depreciation and impairment losses. Cost comprises the aggregate amount paid and the fair value of any other consideration given to acquire the asset and includes costs directly attributable to making the asset capable of operating as intended. When a major replacement is made, its cost is recognised in the carrying amount of the plant and equipment if the recognition criteria are satisfied. All other repair and maintenance costs are recognised in profit or loss as incurred.

Interim Report for the period ended June 30, 2017 Unaudited Interim Condensed Consolidated Financial Statements All amounts in Euro’000, unless otherwise stated
Page | 43
Subsequent costs are included in the asset’s carrying amount or recognised as a separate asset, as appropriate, only when it is probable that future economic benefits associated with the item will flow to the Group and the cost of the item can be measured reliably. The carrying amount of the replaced part is derecognised. All other repairs and maintenance are charged to the income statement during the financial period in which they are incurred. General and specific borrowing costs directly attributable to the acquisition, construction or production of qualifying assets, which are assets that necessarily take a substantial period of time to get ready for their intended use or sale, are added to the cost of those assets, until such time as the assets are substantially ready for their intended use or sale.
A.6.2.5.2 Leased assets
Leasing agreements in which the Group has essentially assumed all risks and opportunities are classified as finance leases. A property acquired under finance lease needs to be capitalized at the lower of its fair value or the present value of the minimum lease payments at the beginning of the lease period. Asset acquired under finance lease is depreciated over shorter of its useful life and lease term (provided that there is no transfer of the assets at the end of the lease term) or the estimated useful life (see A.6.2.5.3). Impairments are performed as necessary (see A.6.2.7).
If, from an economic perspective, not all substantial opportunities and risks have been transferred, leasing agreements are classified as operating leases and the income and expenses derived there from are recognised in the income statement.
A.6.2.5.3 Depreciation
Depreciation is calculated on a straight-line basis over the estimated useful lives of the assets, as follows:
Description Useful life (in years)
Buildings 40 – 50 Machinery and other technical facilities 10 -15 Tooling 1-7 Other plant and office equipment 5 – 15
The residual values, useful lives and methods of depreciation of property, plant and equipment are reviewed at each financial year end and adjusted prospectively, if appropriate. No depreciation is charged on land.
A.6.2.6 Investment Properties
Investment properties are stated at cost less accumulated depreciation. Transaction costs are included on initial measurement. The fair values of investment properties are disclosed in the notes. These are assessed using internationally accepted valuation methods. The fair values are calculated based on the income method and are supported by the results of the sales comparison method which compares a subject property’s characteristics with those of comparable properties which have recently sold in similar transactions and uses multiples to calculate the fair value. Comparable characteristics that are used for the multiples are the construction level and the specific rent level. Depreciation is provided on investment property other than land, on a straight-line basis over the expected useful life which is 30 years.

Interim Report for the period ended June 30, 2017 Unaudited Interim Condensed Consolidated Financial Statements All amounts in Euro’000, unless otherwise stated
Page | 44
A.6.2.7 Impairment of non-current assets
Assets that are subject to depreciation/amortisation are reviewed for impairment whenever events or changes in circumstances indicate that the carrying amount may not be recoverable (see A.6.2.7.1). For the purposes of assessing impairment, assets are grouped at the lowest levels for which there are largely independent cash inflows (cash-generating units), generally individual business units. Prior impairments of nonfinancial assets (other than goodwill) are reviewed for possible reversal at each reporting date. Impairment is recognised if the carrying value of an asset or its cash-generating unit exceeds the recoverable amount. Impairments are reported in the income statement. The Group performed reviews at the reporting date to determine whether there were indications that assets or their cash-generating units have to be impaired. The triggering event for the impairment of technology could also be a budget that causes revenues to be reduced in the future or material changes in determination of royalty rate. The triggering event for the impairment of patent and intellectual property is change in future economic benefits embodied in the asset.
A.6.2.7.1 Recoverable amounts
The recoverable amount of an asset or a cash-generating unit is the higher of fair value less costs of disposal and the value in use. In assessing the value in use, the estimated future cash flows are discounted to their present value using a pre-tax discount rate that reflects current market assessments of the time value of money and the risks specific to the asset. For assets that primarily do not generate independent cash flows, the recoverable amount was determined for the cash-generating units to which these assets belonged.
A.6.2.7.2 Impairment reversals
In case events which caused impairment initially ceases to exist, impairments are only reversed to the extent that increased carrying amount of the asset does not exceed the carrying amount that would have been in place had there no impairment been carried out in the first place, taking into account the normal depreciation/amortization.
A.6.2.8 Financial instruments
A financial instrument is any agreement that leads to the generation of financial asset at one company and/or to a financial liability or equity instrument at another. Financial instruments can be placed into one of four categories according to their intended purpose: financial assets measured at fair value through profit or loss, financial assets held to maturity, loans and receivables, financial assets available for sale. The Group classifies non-derivative financial liabilities into the other financial liabilities category.

Interim Report for the period ended June 30, 2017 Unaudited Interim Condensed Consolidated Financial Statements All amounts in Euro’000, unless otherwise stated
Page | 45
Financial instruments include primary financial instruments such as receivables and trade liabilities, securities, debt instruments and other financial liabilities. They also include derivative financial instruments used to hedge against risks arising from changes in exchange rates and interest rates. Recognition and measurement Regular purchases and sales of financial assets are recognised on the trade-date – the date on which the group commits to purchase or sell the asset. Investments are initially recognised at fair value plus transaction costs for all financial assets not carried at fair value through profit or loss. Financial assets carried at fair value through profit or loss are initially recognised at fair value, and transaction costs are expensed in the income statement. Available-for-sale financial assets and financial assets at fair value through profit or loss are subsequently carried at fair value. Loans and receivables are subsequently carried at amortised cost using the effective interest method. Gains or losses arising from changes in the fair value of the ‘financial assets at fair value through profit or loss’ category are presented in the income statement within ‘Other (losses)/gains – net’ in the period in which they arise. Dividend income from financial assets at fair value through profit or loss is recognised in the income statement as part of other income when the group’s right to receive payments is established. Gains or losses arising from changes in the fair value of the ‘financial assets at fair value through profit or loss’ category are presented in the income statement within ‘Other (losses)/gains – net’ in the period in which they arise. Dividend income from financial assets at fair value through profit or loss is recognised in the income statement as part of other income when the group’s right to receive payments is established. Changes in the fair value of monetary and non-monetary securities classified as available for sale are recognised in other comprehensive income. When securities classified as available for sale are sold or impaired, the accumulated fair value adjustments recognised in equity are included in the income statement as ‘Gains and losses from investment securities’. Non-derivative financial liabilities are initially recognised at fair value less any directly attributable transaction costs. Subsequent to the initial recognition, these liabilities are measured at amortised cost using the effective interest method. Liabilities from finance leases are measured at the present value of the remaining minimum lease payments on the basis of the interest rate underlying the leasing agreement. Financial liabilities with fixed or determinable payments that are neither debt instruments nor derivative financial instruments listed on an active market are reported in the statement of financial position under other liabilities at amortised cost. A financial asset is derecognised in the following circumstances:
The group transfers the contractual rights to receive the cash flow it generates have expired or have
been transferred, and

Interim Report for the period ended June 30, 2017 Unaudited Interim Condensed Consolidated Financial Statements All amounts in Euro’000, unless otherwise stated
Page | 46
The group has transferred substantially all the risk and rewards of the ownership.
As at June 30, 2017, the Group had an amount of € 262.8 million (March 31, 2017 : € 272.5 million) of
receivables derecognised from its balance sheet as the Group had transferred the contractual right and has
substantially transferred all risks and rewards of ownership of these receivables to various financial
institutions.
The Group derecognises a financial liability when its contractual obligations are discharged or cancelled or expire. Offsetting financial instruments Financial assets and liabilities are offset and the net amount reported in the balance sheet when there is a legally enforceable right to offset the recognised amounts and there is an intention to settle on a net basis or realise the asset and settle the liability simultaneously. The legally enforceable right must not be contingent on future events and must be enforceable in the normal course of business and in the event of default, insolvency or bankruptcy of The Group or the counterparty.
A.6.2.8.1 Classification of financial assets
Primary financial instruments are allocated to one of four categories according to their intended purpose. This allocation is re-assessed at each reporting date and it is determined whether the asset is to be reported as current or non-current. a. Financial assets carried at fair value through profit or losses are initially recognised at fair value, and transaction costs are expensed in the income statement. Changes in the fair value of financial assets measured at fair value – either because they have been designated as such upon initial recognition or are held for trading – are recognised directly in the income statement. They are also reported as current assets if they are being held for trading or it can be reasonably expected that they will be converted within twelve months from the reporting date.
b. Financial assets held to maturity are initially recognised at fair value plus transaction costs. Financial assets held to maturity which exhibit fixed or determinable payments and a fixed maturity period, and which the Group wishes and is able to hold until maturity are measured at amortised cost and reported depending on their maturity period as non-current or current assets. The amortisation and losses arising from impairments are recognised in the statement of profit or loss.
c. Loans and receivables are initially recognised at fair value plus transaction costs. Loans and receivables that have fixed or determinable payments and are not listed on an active market are measured at amortised cost using the effective interest method less any necessary write-downs arising from impairments. They are reported in the statement of financial position under other receivables and other assets unless they are trade receivables, and are recorded as non-current or current depending on their maturity period. d. Available-for-sale financial assets that have been classified as such upon initial recognition are measured at fair value, provided that this can be determined, and then reported as non-current or current assets, depending on the expected time of sale. Gains and losses from changes in fair value are recorded net, i.e.

Interim Report for the period ended June 30, 2017 Unaudited Interim Condensed Consolidated Financial Statements All amounts in Euro’000, unless otherwise stated
Page | 47
after tax, and taken directly to equity (“Other comprehensive income”) until the financial asset has been derecognised. In the event that an asset is impaired permanently, however, the loss must be recorded directly in the income statement. If it is not possible to determine the fair value, for example with holdings in non-consolidated affiliated companies or other investments in companies, these assets are measured at cost.
A.6.2.8.1 Impairment of financial assets
(a) Assets carried at amortised cost The group assesses at the end of each reporting period whether there is objective evidence that a financial asset or group of financial assets is impaired. A financial asset or a group of financial assets is impaired and impairment losses are incurred only if there is objective evidence of impairment as a result of one or more events that occurred after the initial recognition of the asset (a ‘loss event’) and that loss event (or events) has an impact on the estimated future cash flows of the financial asset or group of financial assets that can be reliably estimated. Evidence of impairment may include indications that the debtors or a group of debtors are experiencing significant financial difficulty, default or delinquency in interest or principal payments, the probability that they will enter bankruptcy or other financial reorganisation, and where observable data indicates that there is a measurable decrease in the estimated future cash flows, such as changes in arrears or economic conditions that correlate with defaults. For the loans and receivables category, the amount of the loss is measured as the difference between the asset’s carrying amount and the present value of estimated future cash flows (excluding future credit losses that have not been incurred) discounted at the financial asset’s original effective interest rate. The carrying amount of the asset is reduced and the amount of the loss is recognised in the consolidated income statement. If a loan or held-to-maturity investment has a variable interest rate, the discount rate for measuring any impairment loss is the current effective interest rate determined under the contract. As a practical expedient, the group may measure impairment on the basis of an instrument’s fair value using an observable market price. If, in a subsequent period, the amount of the impairment loss decreases and the decrease can be related objectively to an event occurring after the impairment was recognised (such as an improvement in the debtor’s credit rating), the reversal of the previously recognised impairment loss is recognised in the consolidated income statement. (b) Assets classified as available for sale The group assesses at the end of each reporting period whether there is objective evidence that a financial asset or a group of financial assets is impaired

Interim Report for the period ended June 30, 2017 Unaudited Interim Condensed Consolidated Financial Statements All amounts in Euro’000, unless otherwise stated
Page | 48
A.6.2.8.2 Derivative financial instruments
The Group enters into derivative financial instruments to manage its exposure of foreign exchange, viz. foreign exchange forward contracts and fixed to fixed cross currency swaps. Derivatives are initially recognised at fair value at the date the derivative contract is entered into, and are subsequently re-measured to their fair value at the end of each reporting period. The resulting gain or loss is recognised in profit or loss immediately unless the derivative is designated as a hedging instrument, in which event the timing of the recognition in profit or loss depends on the nature of the hedge relationship. The Group designates certain derivatives as hedges of highly probable forecast transactions or hedges of foreign currency risk of firm commitments as cash flow hedges. Derivative financial instruments that are not part of a hedging relationship are carried at fair value upon initial recognition, corresponding to the fair value of the consideration received or given in return. After initial recognition, derivative financial instruments are carried at fair value, which is based on the market value of the financial instrument. Any changes in fair value are recorded directly in profit or loss. Hedge accounting The Group designates fixed-to-fixed cross-currency interest-rate swaps as hedging instruments in cash flow hedges in respect of risk of variability, due to changes in foreign exchange rates, in EURO cash flows on financial assets and financial liabilities denominated in foreign currency. The Group also designates foreign currency forward contracts as hedging instruments in respect of risk of variability of cash flows due to cash flows in currencies denomination in other than the functional currency of the entity. Such hedges of foreign exchange risk on highly probable forecast cash flows are accounted for as cash flow hedges. At the inception of the hedge relationship, the entity documents the relationship between the hedging instrument and the hedged item, along with its risk management objectives and its strategy for undertaking various hedge transactions. Furthermore, at the inception of the hedge and on an ongoing basis, the Group documents whether the hedging instrument is highly effective in offsetting changes in fair values of the hedged item. Cash flow hedges The effective portion of changes in the fair value of derivatives that are designated and qualify as cash flow hedges is recognised in equity in ‘Cash Flow Hedge Reserve’. The gain or loss relating to the ineffective portion is recognised immediately in the income statement, and is included in the line ‘Other Income or Other Operating Expenses’. Amounts previously recognised in ‘Cash Flow Hedge Reserve’ and accumulated in equity are reclassified to the income statement in the periods when the hedged item affects income statement. The gain or loss relating to the effective portion of cross-currency interest-rate swaps is recognised in profit or loss within ‘finance costs’. However, when the forecast transaction that is hedged results in the recognition of a non-financial asset (for example, inventory or fixed assets) the gains and losses previously deferred in equity are reclassified from equity and included in the initial measurement of the cost of the asset. The deferred amounts are ultimately recognised in profit or loss as cost of goods sold in the case of inventory, or as depreciation or impairment in the case of fixed assets.

Interim Report for the period ended June 30, 2017 Unaudited Interim Condensed Consolidated Financial Statements All amounts in Euro’000, unless otherwise stated
Page | 49
Discontinuation of hedge accounting Hedge accounting is discontinued when the Group revokes the hedging relationship, when the hedging
instrument expires or is sold, terminated, or exercised, or it no longer qualifies for hedge accounting. Any
gain or loss accumulated in equity is reclassified from equity to income statement in the same period or
periods during which the hedged forecast cash flows affect the income statement. If the underlying hedge
transaction is no longer expected to occur, the amounts accumulated in equity are immediately reclassified
in full to the income statement.
A.6.2.9 Inventories
Inventories are initially measured at cost, which comprises those costs directly attributable to the production process and an appropriate share of production overheads based on normal operating capacity. This includes write-downs related to production and a reasonable proportion of the administrative and social security costs. Financing costs are not included in the acquisition or production costs. Costs for raw materials and supplies are determined using the moving weighted average prices.
Inventories are carried at the lower of the cost or net realisable value at the reporting date. The net realisable value is the estimated selling price that could be achieved in the course of normal business less estimated costs of completion and estimated costs necessary to make the sale.
A.6.2.10 Construction contracts
When the outcome of a construction contract can be estimated reliably and it is probable that the contract will be profitable, contract revenue is recognised over the period of the contract by reference to the stage of completion. Contract costs are recognised as expenses by reference to the stage of completion of the contract activity at the end of the reporting period. When it is probable that total contract costs will exceed total contract revenue, the expected loss is recognised as an expense immediately. The Group uses the ‘percentage-of-completion method’ to determine the appropriate amount to recognise in a given period. The Group determines the level of completion on the basis of milestones achieved to date. If it is not possible to determine the level of completion reliably, revenue is recognised only to the extent of contract costs incurred that is probable will be recoverable. Therefore, no profit is reported in such a situation (“zero profit margin method”). The costs include all expenses incurred in direct relation to the specific projects and a proportion of the fixed and variable general costs incurred on the basis of normal capacity for the Group’s construction contracts. On the balance sheet, the Group reports the net contract position for each contract as either an asset or a liability. A contract represents an asset where costs incurred plus recognised profits (less recognised losses) exceed progress billings; a contract represents a liability where the opposite is the case.
A.6.2.11 Trade receivables
Trade receivables are amounts due from customers for goods sold or services performed in the ordinary course of business. If collection is expected in one year or less (or in the normal operating cycle of the business if longer), they are classified as current assets. If not, they are presented as non-current assets. Trade receivables are recognised initially at fair value and subsequently measured at amortised cost using the effective interest method, less provision for impairment.

Interim Report for the period ended June 30, 2017 Unaudited Interim Condensed Consolidated Financial Statements All amounts in Euro’000, unless otherwise stated
Page | 50
A.6.2.12 Cash and cash equivalents
Cash and cash equivalents consist of cash on hand and short-term deposits with an original maturity three months or less. Cash and cash equivalents are measured at cost.
A.6.2.13 Income taxes
Current taxes are those taxes foreseeably payable on a year’s taxable income in accordance with the statutory tax rates or tax rates that had been substantially adopted as of the reporting date, as well as all adjustments to payable taxes in relation to previous reporting periods. Deferred tax assets and liabilities are recognised for all temporary differences between the carrying amount as per IFRS and the relevant tax assessment basis. Deferred tax liabilities are not recognised for temporary differences (“outside-basis differences”) if the timing of the reversal of the temporary difference is controlled by the Group and it is probable that the temporary difference will not reverse in the foreseeable future. Deferred tax liabilities for dividends from subsidiaries will be recognised if the parent company determines that the profits of the respective subsidiary will be distributed in the foreseeable future. Deferred tax assets contain tax assets that are derived from the expected utilization of unused tax losses and unused tax credits, unless it is improbable that the future taxable profits will be available against which the temporary differences can be utilized. Deferred taxes are calculated on the basis of the tax rates that are expected to apply to the period when the asset is realized and the liability is settled, based on the tax rates that have been enacted or substantively enacted by the end of the reporting period in the respective country. Income taxes for the annual result reported in the income statement comprise current taxes and deferred taxes. Income taxes are recorded in the income statement unless they relate to items recognised directly in equity or in other comprehensive income. In this case, the income taxes incurred are also recognised directly in equity or in other comprehensive income.
A.6.2.14 Provisions
A.6.2.14.1 Pension provisions
Companies within the Group operate various pension schemes. The schemes are generally funded through payments to insurance companies or trustee-administered funds. The Group has both defined benefit and defined contribution plans. A defined contribution plan is a pension plan under which the Group pays fixed contributions into a separate entity. The Group has no legal or constructive obligations to pay further contributions if the fund does not hold sufficient assets to pay all employees the benefits relating to employee service in the current and prior periods. A defined benefit plan is a pension plan that is not a defined contribution plan. Typically defined benefit plans define an amount of pension benefit that an employee will receive on retirement, usually dependent on one or more factors such as age, years of service and compensation. The liability recognised in the balance sheet in respect of defined benefit pension plans is the present value of the defined benefit obligation at the end of the reporting period less the fair value of plan assets. The defined benefit obligation is calculated annually by independent actuaries using the projected unit credit

Interim Report for the period ended June 30, 2017 Unaudited Interim Condensed Consolidated Financial Statements All amounts in Euro’000, unless otherwise stated
Page | 51
method. The present value of the defined benefit obligation is determined by discounting the estimated future cash outflows using interest rates of high-quality corporate bonds that are denominated in the currency in which the benefits will be paid, and that have terms to maturity approximating to the terms of the related pension obligation. In countries where there is no deep market in such bonds, the market rates on government bonds are used. Actuarial gains and losses arising from experience adjustments and changes in actuarial assumptions are charged or credited to equity in other comprehensive income in the period in which they arise. Past-service costs are recognised immediately in income. When a settlement or a curtailment occurs, the obligation and related plan assets are re-measured using current actuarial assumptions and the resultant gain or loss is recognised in the income statement during the period in which the settlement or curtailment occurs. The value of a net pension benefit asset is restricted to the present value of any amount the Group expects to recover by way of refunds from the plan or reductions in the future contributions after considering any legal or contractual minimum funding requirements. The minimum funding requirements stipulate a minimum amount or level of contributions that must be made to a plan over a given period and may limit the ability of the entity to reduce future contributions and considered respectively in determining the economic benefit from the plan.
For defined contribution plans, the Group pays contributions to publicly or privately administered pension
insurance plans on a mandatory, contractual or voluntary basis. The Group has no further payment
obligations once the contributions have been paid. The contributions are recognised as employee benefit
expense when they are due. Prepaid contributions are recognised as an asset to the extent that a cash
refund or a reduction in the future payments is available.
A.6.2.14.2 Warranties
A provision is recognised for expected warranty claims on products sold during the year, based on past experience of the level of repairs and returns although it is expected that most of these costs will be paid out in the next financial year. Assumptions used to calculate the provision for warranties were based on current sales levels and current information available about returns based on the warranty period for all products sold.
A.6.2.14.3 Other provisions
Provisions are recognised to accommodate the possibility that current legal or constructive obligations against third parties resulting from a past event exist, and that it is probable that an outflow of economic benefits will be required to settle the obligation, and that the amount of these obligations can be estimated reliably. Long-term provisions are determined by discounting the expected future cash flows at a pre-tax rate that reflects current market assessments of the time value of money. Short term provisions are carried at their redemption value and are not offset against receivables from reimbursements.
Interim Report for the period ended June 30, 2017 Unaudited Interim Condensed Consolidated Financial Statements All amounts in Euro’000, unless otherwise stated
Page | 52
A.6.2.15 Government Grants and grants from private companies & institutions
Government grants are recognised when it is reasonable to expect that the grants will be received and that all related conditions will be met, usually on submission of a valid claim for payment. Government grants in respect of capital expenditure are credited to the acquisition costs of the respective fixed asset and thus are released as income over the expected useful lives of the relevant assets. Grants of a revenue nature are credited to income so as to match them with the expenditure to which they relate as the conditions attached to the grants are met. Grants from private companies and institutions are accounted for in a manner similar to the accounting for government grants, if the grants are comparable to government grants in their nature and the conditions related to these grants are satisfied.
A.6.2.16 Liabilities from finance lease
Liabilities from finance lease are initially carried at equal to the fair value of leased property, or if lower, the present value of minimum lease payments. The lease payments are then separated into financing costs and the redemption of the remaining liability.
A.6.2.17 Borrowings
Borrowings are recognised initially at fair value, net of transaction costs incurred. Borrowings are subsequently carried at amortized cost; any difference between the proceeds (net of transaction costs) and the redemption value is recognised in the income statement over the period of the borrowings using the effective interest method. Fees paid on the establishment of loan facilities are recognised as transaction costs of the loan to the extent that it is probable that some or all of the facility will be drawn down. In this case, the fee is deferred until the draw-down occurs. To the extent there is no evidence that it is probable that some or all of the facility will be drawn down, the fee is capitalized as a pre-payment for liquidity services and amortized over the period of the facility to which it relates. General and specific borrowing costs directly attributable to the acquisition, construction or production of qualifying assets, which are assets that necessarily take a substantial period of time to get ready for their intended use or sale, are added to the cost of those assets, until such time as the assets are substantially ready for their intended use or sale. Investment income earned on the temporary investment of specific borrowings pending their expenditure on qualifying assets is deducted from the borrowing costs eligible for capitalization.
A.6.2.18 Recognition of income and expenses
Sales revenue and other operating income is recognised when ownership of an asset changes hands or the opportunities and risks related to the property are transferred to the customer, when the amount of the income has been determined or can be determined, and when there is sufficient likelihood that the economic benefit from the sale will flow to the Group. Sales revenue from the sale of goods is measured at the fair value of the consideration received or to be received less product returns, rebates and discounts for early payment. Revenues from the sale of services are recorded with respect to the stage of completion as of the reporting date in relation to the total service to be provided in the course of the transaction.

Interim Report for the period ended June 30, 2017 Unaudited Interim Condensed Consolidated Financial Statements All amounts in Euro’000, unless otherwise stated
Page | 53
Operating expenses are recognised when goods or services are used or when the expense is incurred. Anticipated losses from construction contracts are directly recognised as expenses. Interest is recognised using the effective interest method as an expense or income for the period in which it occurs. Interest payments for finance leases are calculated by breaking down the minimum lease payments into financing costs and redemption payments for the remainder of the liability and spreading the financing costs over the periods covered by the term of the leasing agreement. This allows a constant, periodic interest rate for the remainder of the liability to be calculated. Payments from operating leases are recognised over the term of the leasing agreement using a straight-line distribution in the income statement. Dividend income is recognised when the right to receive payment is established.
A.6.2.19 Segment information
Operating segments are reported in a manner consistent with the internal reporting provided to the chief operating decision-maker. The management and supervisory board of The Group assesses financial performance and position of the Group, and makes strategic decisions. The management and supervisory board which consists of chief executive officer, chief operating officer and head of strategy has been identified as chief operating decision maker.

Interim Report for the period ended June 30, 2017 Unaudited Interim Condensed Consolidated Financial Statements All amounts in Euro’000, unless otherwise stated
Page | 54
A.6.3 Disclosures regarding the Consolidated Statement of Financial Position
A.6.3.1 Property, plant and equipment
During the period ended June 30, 2017 the Group acquired assets with a cost of k€ 57,260.
Assets with a net book value of k€ 341 were disposed by the Group during the period ended June 30, 2017.
Refer to note A.6.6.1 for capital commitments.
A.6.3.2 Other financial instruments
June 30, 2017 March 31, 2017
Assets Liabilities Assets Liabilities
Non-current Forward contracts - - - 151 Cross currency swaps - 7,467 3,503 - Other financial investments 5 - 5 -
Total 5 7,467 3,508 151
Current Forward contracts 804 340 719 961 Cross currency swaps - - - -
Total 804 340 719 961
The maximum exposure to the credit risk is carrying value of instruments.
A.6.3.3 Cash and cash equivalents June 30, 2017 March 31, 2017
Cash at bank 392,298 505,920 Cash on hand 105 128
392,403 506,048
There are no contractual or other restrictions on the use of cash and cash equivalents.

Interim Report for the period ended June 30, 2017 Unaudited Interim Condensed Consolidated Financial Statements All amounts in Euro’000, unless otherwise stated
Page | 55
A.6.3.4 Borrowings June 30, 2017 March 31, 2017
Non-current Notes 943,981 959,303 Bank loans 5,321 4,172 Finance lease liabilities 4,493 4,777 Other loans 11,341 11,864
Non-current borrowings 965,136 980,116
Current
Bank loans 70,121 35,570 Finance lease liabilities 2,284 3,000 Other loans 954 3,192
Current borrowings 73,359 41,762
(i) Secured liabilities and assets pledged as security
The Notes are structured as senior secured obligations and rank ‘pari passu’ in right of payment with all the existing and future senior obligations of SMRP BV, including the obligations under the Revolving Credit Facility. The Notes are guaranteed on a senior secured basis by certain subsidiaries of SMRP BV and are secured by share pledge and security interests granted over certain property and assets of SMRP BV and certain of its subsidiaries. As of June 30, 2017 The Group has issued below mentioned notes which were outstanding on the date referred – Principal amount Coupon rate (fixed) Maturity
€ 500 million 4.125% 15 July 2021 € 100 million 3.700% 18 June 2025 US$ 400 million 4.875% 16 December 2021 Of the remaining borrowings, secured loans from banks and others amount to k€ 61,546. Borrowings are secured by pledge of various assets mainly comprising of inventories, trade receivables, cash and cash equivalents etc. of respective borrowing entity. Finance lease liabilities are secured by the respective assets under lease.

Interim Report for the period ended June 30, 2017 Unaudited Interim Condensed Consolidated Financial Statements All amounts in Euro’000, unless otherwise stated
Page | 56
(ii) New Revolving Credit Facilities Agreement On June 20, 2017 the Company entered into a new Revolving Credit Facilities Agreement (“RCF 2017”) with various banks.
The RCF 2017 is guaranteed by the Company and certain of its subsidiaries, and will benefit from the same collaterals as all the existing Senior Secured Notes issued by the Company. The RCF 2017 establishes multi-currency revolving credit facilities for an aggregate principal amount of €480,000,000 (subsequently increased to €500,000,000 in July 2017) which will mature on the date falling four years from the issue date i.e. June 20, 2021.
The existing Revolving Credit Facility Agreement entered into on June 23, 2015 (“RCF 2015”) for an aggregate principal amount of €350,000,000 has been subsequently terminated on June 21, 2017.
This space has been intentionally left blank

Interim Report for the period ended June 30, 2017 Unaudited Interim Condensed Consolidated Financial Statements All amounts in Euro’000, unless otherwise stated
Page | 57
A.6.4 Disclosures regarding the Consolidated Income Statement
A.6.4.1 Revenues
Period ended June 30, 2017
Period ended June 30, 2016
Sale of products 1,104,380 1,015,619 Sale of tooling 144,873 94,431
Total 1,249,253 1,110,050
A.6.4.2 Changes in inventories
Period ended June 30, 2017
Period ended June 30, 2016
Opening stock of finished goods (38,867) (41,220) work-in-progress (27,619) (24,280) Less: closing stock of finished goods 44,175 42,774 work-in-progress 30,979 25,522
Total 8,668 2,796
A.6.4.3 Other operating income
Period ended June 30, 2017
Period ended June 30, 2016
Subsidies /Income from investment Grants 2,233 931 Net foreign exchange gain 1,371 - Income from development work and other recoveries from Customers 1,334 1,287 Rental income 206 212 Royalty income 552 925 Gain from the sale of property, plant and equipment and Intangible assets
4 -
Provisions written back/Gain on reversal of bad debt allowance 58 193
Other Income 7,088 3,603
Total 12,846 7,151

Interim Report for the period ended June 30, 2017 Unaudited Interim Condensed Consolidated Financial Statements All amounts in Euro’000, unless otherwise stated
Page | 58
A.6.4.4 Personnel expenses
Period ended June 30, 2017
Period ended June 30, 2016
Wages and salaries 167,775 150,350 Paid labour rendered by third parties 44,984 37,976 Social security costs 29,299 26,300
Pensions costs from defined benefit plans 671 591
242,729 215,217
A.6.4.5 Depreciation and amortization
Period ended June 30, 2017
Period ended June 30, 2016
Depreciation of property, plant and equipment 27,975 26,150 Depreciation on investment properties 67 67 Amortisation of intangible assets 2,027 2,623
Total 30,069 28,840
A.6.4.6 Other operating expenses
Period ended June 30, 2017
Period ended June 30, 2016
General administration expenses 42,500 37,694
Energy 18,635 15,318 Repairs and maintenance 23,605 19,538 Rent and lease 12,801 11,132 Freight and forwarding 12,007 10,973 Bad debts/advances written off 666 676 Auditors remuneration 1,880 1,559 Net foreign exchange loss - 322 Legal and professional expenses 9,992 10,961
Total 122,086 108,173
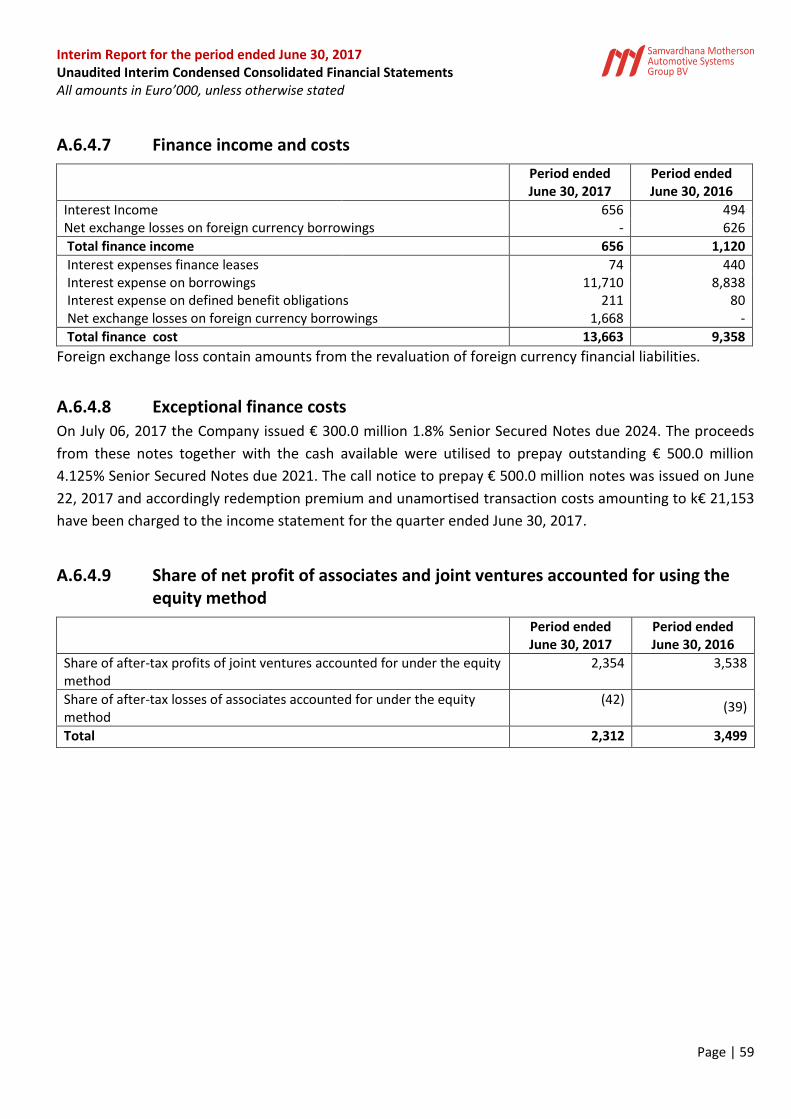
Interim Report for the period ended June 30, 2017 Unaudited Interim Condensed Consolidated Financial Statements All amounts in Euro’000, unless otherwise stated
Page | 59
A.6.4.7 Finance income and costs
Period ended June 30, 2017
Period ended June 30, 2016
Interest Income
656 494 Net exchange losses on foreign currency borrowings - 626
Total finance income 656 1,120
Interest expenses finance leases 74 440 Interest expense on borrowings 11,710 8,838 Interest expense on defined benefit obligations 211 80 Net exchange losses on foreign currency borrowings 1,668 -
Total finance cost 13,663 9,358
Foreign exchange loss contain amounts from the revaluation of foreign currency financial liabilities.
A.6.4.8 Exceptional finance costs
On July 06, 2017 the Company issued € 300.0 million 1.8% Senior Secured Notes due 2024. The proceeds
from these notes together with the cash available were utilised to prepay outstanding € 500.0 million
4.125% Senior Secured Notes due 2021. The call notice to prepay € 500.0 million notes was issued on June
22, 2017 and accordingly redemption premium and unamortised transaction costs amounting to k€ 21,153
have been charged to the income statement for the quarter ended June 30, 2017.
A.6.4.9 Share of net profit of associates and joint ventures accounted for using the equity method
Period ended June 30, 2017
Period ended June 30, 2016
Share of after-tax profits of joint ventures accounted for under the equity method
2,354 3,538
Share of after-tax losses of associates accounted for under the equity method
(42) (39)
Total 2,312 3,499

Interim Report for the period ended June 30, 2017 Unaudited Interim Condensed Consolidated Financial Statements All amounts in Euro’000, unless otherwise stated
Page | 60
A.6.5 Income taxes
Deferred income taxes are calculated using the balance-sheet based liability method. Deferred tax assets and liabilities are recognised for all temporary differences between the carrying amount of an asset or liability and the values used for taxation purposes. Deferred tax assets are also recognised for tax-loss carry forwards to the extent it is probable that future taxable profits will be available. For this reason, the recognition of all deferred tax assets based on tax losses is carried out with suitable consideration given to their realisation. Deferred taxes are determined on the basis of tax rates that have been enacted or substantially enacted by the end of the reporting period.
The income tax credit/expense for the year comprises the following:
Period ended June 30, 2017
Period ended June 30, 2016
Current tax expense 20,198 12,161
Deferred tax expense (4,780) 2,849
Income tax expense 15,418 15,010
There is no significant change in corporate tax rates, in jurisdictions where group operates, having material impact on current charge and future adjustment to the carrying amounts of assets and liabilities.

Interim Report for the period ended June 30, 2017 Unaudited Interim Condensed Consolidated Financial Statements All amounts in Euro’000, unless otherwise stated
Page | 61
A.6.6 Other disclosures
A.6.6.1 Contingent Liabilities
In the ordinary course of business activities, the Group may be contingently liable for litigation and claims with customers, suppliers, former employees and other parties. In addition, the Group may be, or could become, liable to incur environmental remediation costs to bring environmental contamination levels back within acceptable legal limits. On an on-going basis, the Group assesses the likelihood of any adverse judgments or outcomes to these matters as well as potential ranges of probable costs and losses. A determination of the provision required, if any, for these contingencies is made after analysis of each individual issue. The required provision may change in the future due to new developments in each matter or changes in approach such as a change in settlement strategy in dealing with these matters. The tax position taken by the Group with respect to certain transactions and calculations may be challenged by tax authorities for reasons including transfer pricing, the availability of deductions for interest expense and other deductible items, the treatment of acquisition, refinancing and reorganization transactions, intercompany funding arrangements, the application and effect of tax “holidays” and the calculation of deferred tax assets and liabilities. The Group does not expect any significant cash outflow in respect of these contingencies. As at the year end, the Group has following contingent liabilities:
As at June 30, 2017
Indirect tax matters 55 Direct tax matters 387 Others (refer note below) 10,731
Total 11,173
The Group has acted as surety in respect of subsidy received by one of its subsidiary, which limits the total
liability of the Group to the amount of subsidy granted. As at June 30, 2017 the Group may be contingently
liable for k€ 10,309 in the event of non-compliance of subsidy conditions by the subsidiary.
Capital expenditure commitments
The group has outstanding capital expenditure commitments which represents outstanding amount of
contracts for capital expenditure against which work is yet to be executed by the contractor or supplies to
be received. Capital expenditure contracted for at the end of the year but not yet incurred is as follows:
As at June 30, 2017
Property, plant and equipment (net of advances) 49,533
Interim Report for the period ended June 30, 2017 Unaudited Interim Condensed Consolidated Financial Statements All amounts in Euro’000, unless otherwise stated
Page | 62
A.6.6.2 Operating Segment Information
Management has determined the operating segments based on the reports reviewed by the Chief Operating Decision Maker (“CODM”) in taking strategic decisions. Those operating segments are SMR Group and SMP Group which are also the reportable segments.
SMR Group SMR Group produces a wide range of rear view vision systems primarily for light vehicles. SMR is active in every phase of the product development cycle, and its product portfolio covers a wide spectrum of vehicle and price segments, from low-cost mirrors to highly complex premium mirrors incorporating a variety of electronic features. SMR’s focus on research & development and customer collaboration has resulted in various first-to-market innovations and a variety of full system solutions tailored to the needs of OEMs and end consumers, including Blind Spot Detection Systems (BSDS) and Telescopic Trailer Tow (TTT) mirrors. It has production facilities and engineering centres in 16 countries across the globe. SMP Group SMP Group produce various polymer-based interior and exterior products for light vehicles. SMP’s product portfolio is primarily comprised of complete modules, including door panels, instrument panels and bumpers as well as other plastic components and systems, such as centre consoles, decorative interior trims and plastic body parts. These products involve a complex manufacturing and assembly processes, require significant systems integration expertise and represent key comfort and aesthetic features of the vehicles in which they are integrated. The product range encompasses individual parts and complete modules, with engineering and tooling services also being provided. It has production facilities and engineering centres in 9 countries across the globe.
The CODM considers revenues from external parties, EBITDA, profit before taxes and assets of each of the segments in taking strategic decisions. These amounts are measured in a manner consistent with that of the financial statements. Segment assets comprise of trade receivables, inventories and cash and cash equivalents. Geographically, the CODM considers the performance of sales in the Americas, Europe, and Asia Pacific.
Transfer prices for transactions between operating segments are on an arm’s length basis in a manner similar to transactions with third parties.

Interim Report for the period ended June 30, 2017 Unaudited Interim Condensed Consolidated Financial Statements All amounts in Euro’000, unless otherwise stated
Page | 63
June 30, 2017 June 30, 2016
SMR SMP Unallocated / Inter-segment eliminations
Total SMR SMP Unallocated / Inter-segment eliminations
Total
Segment revenue:
Sales to external customers 399,106 851,050 (903) 1,249,253 373,727 737,039 (716) 1,110,050
Total revenue 399,106 851,050 (903) 1,249,253 373,727 737,039 (716) 1,110,050
Results:
EBITDA 43,475 44,657 - 88,132 32,852 46,011 - 78,863
Depreciation and amortization (10,937) (19,132) - (30,069) (9,650) (19,190) - (28,840)
Operating profit 32,538 25,525 - 58,063 23,202 26,821 - 50,023
Interest Income 2,195 518 (2,057) 656 1,113 670 (663) 1,120
Interest expense (1,203) (35,670) 2,057 (34,816) (1,147) (8,874) 663 (9,358)
Share of profit from joint venture 2,071 283 - 2,354 1,387 2,151 - 3,538
Share of profit from associate (42) - - (42) (39) - - (39)
Profit before tax 35,559 (9,344) - 26,215 24,516 20,768 - 45,284
Income Taxes (11,138) (4,280) - (15,418) (7,962) (7,048) - (15,010)
Profit after tax 24,421 (13,624) - 10,797 16,554 13,720 - 30,274
Segment assets:
Inventory, Debtors and Cash 246,563 1,102,434 (4,614) 1,344,383 243,776 880,582 (110) 1,124,248
Others 530,723 1,911,892 (1,059,228) 1,383,387 424,992 1,668,371 (975,299) 1,118,064
Total assets 777,286 3,014,326 (1,063,842) 2,727,770 668,768 2,548,953 (975,409) 2,242,312
Other items:
Capital expenditure 16,220 41,040 - 57,260 18,257 28,630 - 46,887
Investment in joint venture 14,747 5,388 - 20,135 8,545 22,552 - 31,097
Investment in associate 85 - - 85 218 - - 218

Interim Report for the period ended June 30, 2017 Unaudited Interim Condensed Consolidated Financial Statements All amounts in Euro’000, unless otherwise stated
Page | 64
A.6.6.3 Related parties
During the year the Group entered into transactions, in the ordinary course of business, with related parties. Transactions entered into, include the sale and purchase of goods and services. In addition, financing transactions have been undertaken. Entities with significant influence over the Group
SMRP BV, SMP Group and SMR Group were jointly controlled by Motherson Sumi Systems Limited and Samvardhana Motherson International Limited prior to June 13, 2014. On June 13, 2014 SMRP BV acquired the majority of the outstanding shares of SMR Group through the issuance of new shares to the shareholders of SMR Group. Samvardhana Motherson Global Holdings Limited, Cyprus, the direct parent company of Samvardhana Motherson Automotive Systems Group B.V (SMRP) (earlier known as Samvardhana Motherson B.V.) holds 69% of the voting shares of the Group. Samvardhana Motherson Polymers Limited, India holds 31% of the voting shares of SMRP BV. Samvardhana Motherson Global Holdings Limited and Samvardhana Motherson Polymers Limited both are indirectly held by MSSL India, which prepares financial statements available for public use and by SMIL India. MSSL and SMIL are referred to as the substantial shareholders of the Group. SMIL is owned by Mr. V.C. Sehgal and family. SMIL holds an equity interest (34.81%) in MSSL. As a result, MSSL and SMIL and its direct and indirect held subsidiaries, except for the companies forming the subgroup of Samvardhana Motherson Automotive Systems Group B.V are considered as related parties. Key Management Personnel Members of the management and supervisory board are considered to be Key Management Personnel as they are charged with the responsibility for planning, directing and controlling the activities of the Group. Terms and conditions Transactions relating to sales and purchase of goods with related parties during the year are based on the price lists in force and terms that would be available to third parties. All other transactions were made on normal commercial terms and conditions and at market rates. There is no allowance account for impaired receivables in relation to any outstanding balances, and no expense has been recognised in respect of impaired receivables due from related parties. Outstanding balances are unsecured and are repayable in cash.

Interim Report for the period ended June 30, 2017 Unaudited Interim Condensed Consolidated Financial Statements All amounts in Euro’000, unless otherwise stated
Page | 65
Details of related party transactions
Period ended June 30, 2017
Substantial shareholders
Entities in which V.C. Sehgal and family holds significant
influence
Fellow Subsidiaries Joint venture Key Management Personnel
Entities in which Key management
personnel hold significant influence
Total
Sales 186 - 748 6,284 - - 7,218 Purchases 8,635 - 14,823 11,597 - 34 35,089 Remuneration - - - - 248 - 248 Miscellaneous expenses 43 948 3,810 12 - - 4,813 Loans given - 1 - - - - 1 Loans taken - - 44 3 - - 47 Purchase of assets - 86 13 - - - 99 Miscellaneous income 407 30 435 196 - - 1,068
Details of related party balances
As at June 30, 2017
Substantial shareholders
Entities in which V.C. Sehgal and family holds significant
influence
Fellow Subsidiaries Joint venture Key Management Personnel
Entities in which Key management
personnel hold significant influence
Total
Trade receivables 515 512 2,409 6,647 - - 10,083 Other receivables - 544 - - - - 544 Trade and other payables
5,200 2,480 11,684 4,808 - - 24,172
Loans payable - - 306 - - - 306

Interim Report for the period ended June 30, 2017 Unaudited Interim Condensed Consolidated Financial Statements All amounts in Euro’000, unless otherwise stated
Page | 66
A.6.7 Accounting estimates and evaluations
The Group makes estimates and assumptions concerning the future and makes significant judgements in the process of application of accounting policies. The resulting accounting estimates will, by definition, seldom equal the related actual results. The estimates and assumptions that have a significant risk of causing a material adjustment to the carrying amounts of assets and liabilities within the next financial year are addressed below:
Determination of the useful life of intangible assets and property, plant and equipment (see A.6.3.2 and A.6.3.3).
Valuation of customer and engineering agreements as well as technology and property, plant and equipment, particularly with regard to their underlying cash flow forecasts and discount rates (see A.6.3.2 and A.6.3.3).
Determination of the level of completion, the contract revenues and contract costs of construction contracts. The Group uses the percentage-of-completion method in accounting for its fixed price contracts to deliver design services. Use of the percentage-of-completion method requires the Group to estimate the services performed to date as a proportion of the total services to be performed. (see A.6.3.15).
Valuation of recoverable income tax assets especially with respect to deferred tax assets on tax loss carry forwards. The Group is subject to income taxes in numerous jurisdictions. Significant judgement is required in determining the worldwide provision for income taxes. The Group recognises liabilities for anticipated tax audit issues based on estimates of whether additional taxes will be due. Where the final tax outcome of these matters is different from the amounts that were initially recorded, such differences will impact the current and deferred income tax assets and liabilities in the period in which such determination is made. (see A.6.5).
Recognition and presentation of provisions and liabilities for pensions and other post-employment benefits. The present value of the pension obligations depends on a number of factors that are determined on an actuarial basis using a number of assumptions. The assumptions used in determining the net cost (income) for pensions include the discount rate. Any changes in these assumptions will impact the carrying amount of pension obligations. The Group determines the appropriate discount rate at the end of each year. This is the interest rate that should be used to determine the present value of estimated future cash outflows expected to be required to settle the pension obligations. In determining the appropriate discount rate, the Group considers the interest rates of high-quality corporate bonds that are denominated in the currency in which the benefits will be paid and that have terms to maturity approximating the terms of the related pension obligation. Other key assumptions for pension obligations are based in part on current market conditions. (see A.6.2.14.1 and A.6.3.11).
Recognition and presentation of provisions and liabilities (esp. the accrual for price differences and the liabilities out of contract work) and to the probability of expenses arising from warranty claims and claims from legal disputes. Price accruals primarily represent the amount of price down to be given to customers, the final outcome of these price accruals is dependent on negotiation with customers (see A.6.2.14).

Interim Report for the period ended June 30, 2017 Unaudited Interim Condensed Consolidated Financial Statements All amounts in Euro’000, unless otherwise stated
Page | 67
These estimates and assumptions are based on the latest information available at the time that the unaudited interim condensed consolidated financial statements were prepared. The assumptions and estimates are checked and updated regularly to accommodate any actual developments that may arise.
A.6.8 Subsequent events
On July 06, 2017, the Company issued €300 million 1.8% Senior Secured Notes due 2024 (the "Notes") at
99.299% of the nominal value. The Notes carry coupon at a rate of 1.80% payable annually on 06 July each
year and will mature on 06 July 2024. The Notes are listed on the Irish Stock Exchange and trade on the
Global Exchange Market.
The Notes are senior obligations of the Company and rank pari passu in right of payment with all the
Company’s existing and future senior obligations that are not subordinated in right of payment to the
Notes, including the Company’s obligations under the existing Notes and the Revolving Credit Facilities. The
Notes are guaranteed on a senior basis by the Company and certain of its subsidiaries and are also secured
by security interests granted over certain property and assets of the Company and certain of its
subsidiaries.
The entire proceeds from the issue of the Notes along with a portion of cash balance of the Company has
been utilized on July 06, 2017 to prepay existing €500 million 4.125% Notes due 2021.
Interim Report for the period ended June 30, 2017 Unaudited Interim Condensed Consolidated Financial Statements All amounts in Euro’000, unless otherwise stated
Page | 68
ABBREVIATIONS
€ Euro (European currency) k€ Thousands of Euros $ US Dollar (US currency) IASB International Accounting Standards Board IFRS International Financial Reporting Standards EU European Union
Abbreviations used for companies
SMRP BV or SMRP BV Group Samvardhana Motherson Automotive Systems Group B.V. & its subsidiaries SMR or SMR Group Samvardhana Motherson Reflectec Group Holdings Limited & its subsidiaries SMP Group Samvardhana Motherson Peguform GmbH & its subsidiaries, SMP
Automotive Technology Ibérica S.L. & its subsidiaries and SMP Automotive Interiors (Beijing) Co. Ltd.
SMPL Samvardhana Motherson Polymers Limited, India SMGHL Samvardhana Motherson Global Holdings Ltd, Cyprus MSSL Motherson Sumi Systems Limited, India SMIL India Samvardhana Motherson International Limited, India SMG Samvardhana Motherson Group

Interim Report for the period ended June 30, 2017 Unaudited Interim Condensed Consolidated Financial Statements All amounts in Euro’000, unless otherwise stated
Page | 69
Samvardhana Motherson Automotive Systems Group B.V. Hoogoorddreef 15, 1101 BA Amsterdam The Netherlands www.smrpbv.com [email protected]