Embed Size (px)
Citation preview
1
5 December 2018
Interim ResultsHalf-year ended 27 October 2018
2
Cautionary statement
This document is solely for use in connection with a briefing on the group headed by Stagecoach Group plc (“the Group”).
This document contains forward-looking statements that are subject to risk factors associated with, amongst other things, the economic and business circumstances occurring from time to time in the countries, sectors and markets in which the Group operates. It is believed that the expectations reflected in these statements are reasonable but they may be affected by a wide range of variables which could cause actual results to differ materially from those currently anticipated. No assurances can be given that the forward-looking statements in this presentation will be realised. The forward-looking statements reflect the knowledge and information available at the date of preparation.
This document is not a full record of the presentation because it does not include comments made verbally by Stagecoach Group management or by others.
3
ROSS PATERSONFINANCE DIRECTOR
4
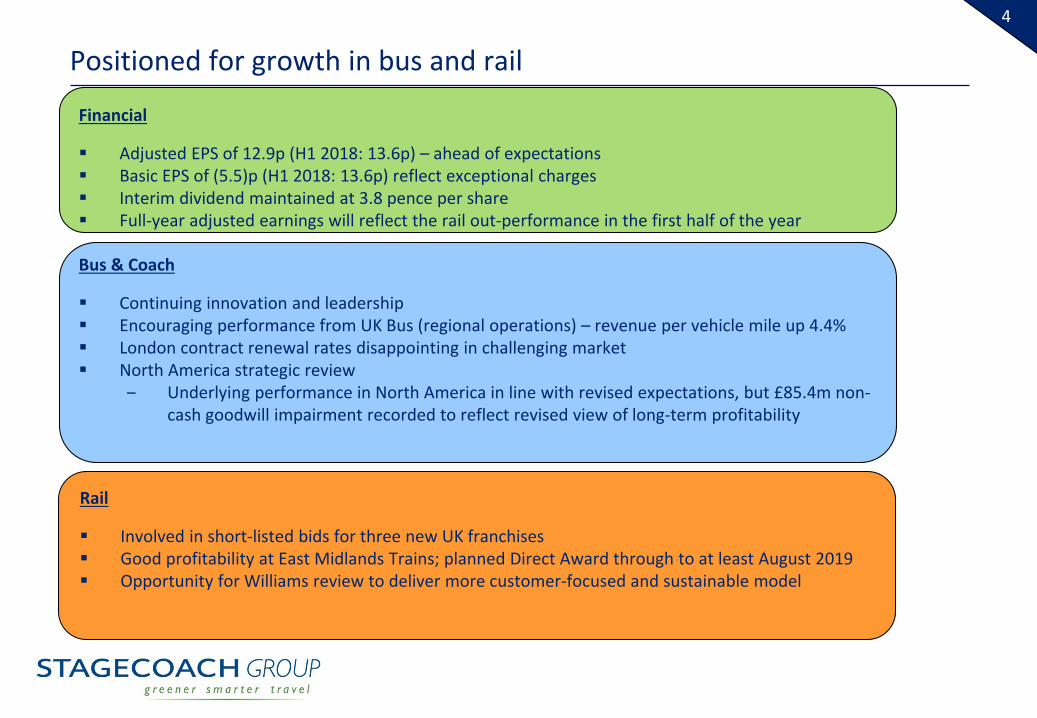
Positioned for growth in bus and rail
Financial
Adjusted EPS of 12.9p (H1 2018: 13.6p) – ahead of expectations Basic EPS of (5.5)p (H1 2018: 13.6p) reflect exceptional charges Interim dividend maintained at 3.8 pence per share Full-year adjusted earnings will reflect the rail out-performance in the first half of the year
Bus & Coach
Continuing innovation and leadership Encouraging performance from UK Bus (regional operations) – revenue per vehicle mile up 4.4% London contract renewal rates disappointing in challenging market North America strategic review
‒ Underlying performance in North America in line with revised expectations, but £85.4m non-cash goodwill impairment recorded to reflect revised view of long-term profitability
Rail
Involved in short-listed bids for three new UK franchises Good profitability at East Midlands Trains; planned Direct Award through to at least August 2019 Opportunity for Williams review to deliver more customer-focused and sustainable model
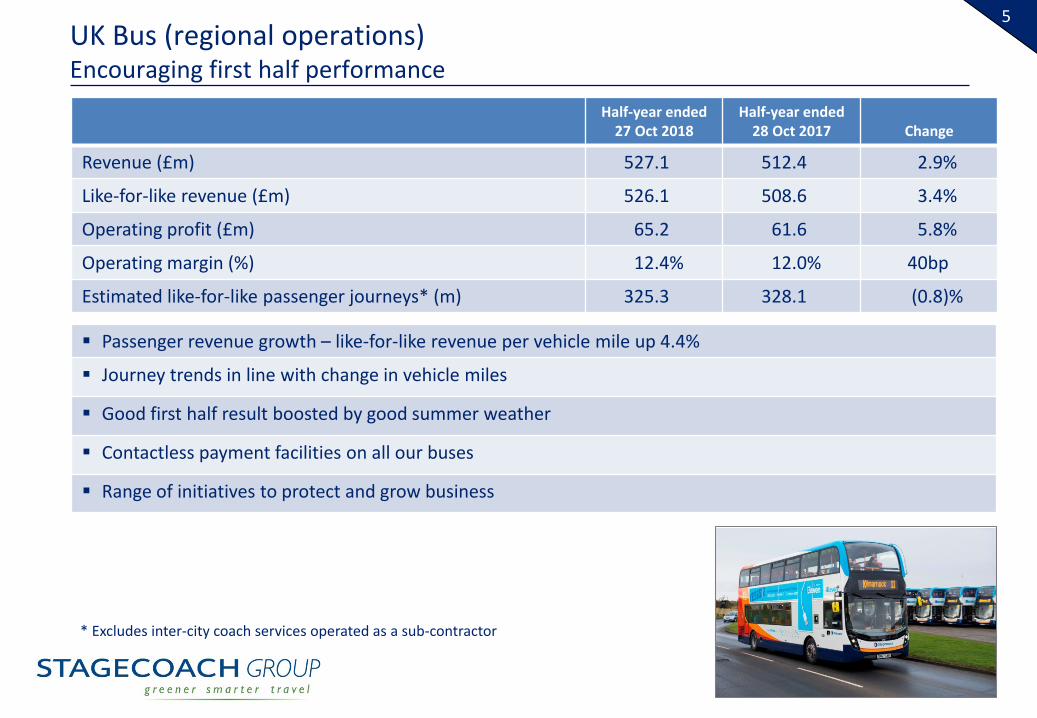
5UK Bus (regional operations)Encouraging first half performance
* Excludes inter-city coach services operated as a sub-contractor
Half-year ended27 Oct 2018
Half-year ended28 Oct 2017 Change
Revenue (£m) 527.1 512.4 2.9%
Like-for-like revenue (£m) 526.1 508.6 3.4%
Operating profit (£m) 65.2 61.6 5.8%
Operating margin (%) 12.4% 12.0% 40bp
Estimated like-for-like passenger journeys* (m) 325.3 328.1 (0.8)%
Passenger revenue growth – like-for-like revenue per vehicle mile up 4.4%
Journey trends in line with change in vehicle miles
Good first half result boosted by good summer weather
Contactless payment facilities on all our buses
Range of initiatives to protect and grow business
6UK Bus (London)Actions to improve competitiveness and benefit from longer term opportunities
Half-year ended27 Oct 2018
Half-year ended28 Oct 2017 Change
Revenue and like-for-like revenue (£m) 128.6 128.4 0.2%
Operating profit (£m) 6.1 6.5 (6.2)%
Operating margin (%) 4.7% 5.1% (40)bp
Disappointing tender results in year in increasingly competitive bidding environment
Holding our nerve – maintaining sustainable contract pricing
Reviewing bid models, financial forecasts, contract pricing and cost efficiency to identify opportunities to improve competitiveness
Good progress on cost reduction programme
Margin pressure expected to continue in short-term
Longer term opportunities from planned housing development
7North AmericaFocused on new opportunities
Half-year ended27 Oct 2018
Half-year ended28 Oct 2017 Change
Revenue (US$m) 323.3 333.9 (3.2)%
Like-for-like revenue (US$m) 323.9 333.9 (3.0)%
Operating profit (US$m) 21.2 27.6 (23.2)%
Operating margin (%) 6.6% 8.3% (170)bp
No significant change since September trading update in expected 2018/19 profit
Focus is on growing scheduled service (including megabus.com) and contract revenue business
Further reviewing cost base
Non-cash impairment charge of £85.4m, reflecting revised view of long-term profitability
Reviewing strategic options – in discussions regarding possible sale
8RailGood financial performance and new contract opportunities
Half-year ended27 Oct 2018
Half-year ended28 Oct 2017(restated) Change
Revenue (£m) 335.1 899.2 (62.7)%
Like-for-like revenue (£m) 202.1 201.3 0.4%
Operating profit (£m) 11.5 21.7 (47.0%)
Operating margin (%) 3.4% 2.4% 100bp
Positive resolution of contractual matters for former South West Trains franchise
Good operational delivery and financial performance at East Midlands Trains
Reduction in reported revenue and operating profit reflects ends of South West Trains franchise (in August 2017) and Virgin Trains East Coast franchise (in June 2018)
Lower than usual like-for-like revenue growth reflects effects of Thameslink timetable changes and Derby re-signalling work on East Midlands Trains – profit contractually protected from adverse impact
Involved in short-listed bids for three UK franchises
Expected short-term East Midlands direct award from March 2019 until at least August 2019
9Virgin Rail Group (incorporates West Coast franchise)Industry-leading innovations and strong financial performance
Half-year ended27 Oct 2018
Half-year ended28 Oct 2017 Change
Revenue – 49% share (£m) 303.2 288.5 5.1%
Operating profit – 49% share (£m) 13.7 14.8 (7.4)%
Operating margin (%) 4.5% 5.1% (60)bp
Estimated passenger miles (m) 2,410.3 2,387.4 1.0%
Continued strong financial performance‒ margin slightly down reflecting new franchise terms
Customer-focused innovation – removing Friday peak-hour restrictions from London Euston
Digital enhancements include selling tickets through Amazon Alexa platform
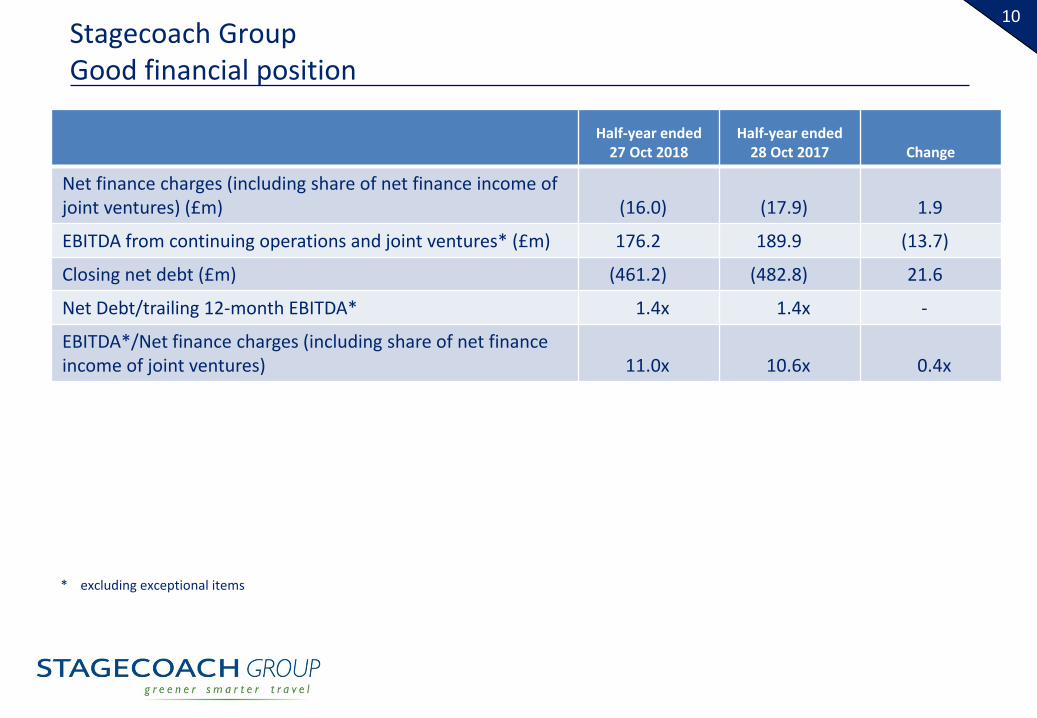
10Stagecoach GroupGood financial position
Half-year ended27 Oct 2018
Half-year ended28 Oct 2017 Change
Net finance charges (including share of net finance income of joint ventures) (£m) (16.0) (17.9) 1.9
EBITDA from continuing operations and joint ventures* (£m) 176.2 189.9 (13.7)
Closing net debt (£m) (461.2) (482.8) 21.6
Net Debt/trailing 12-month EBITDA* 1.4x 1.4x -
EBITDA*/Net finance charges (including share of net finance income of joint ventures) 11.0x 10.6x 0.4x
* excluding exceptional items

11
MARTIN GRIFFITHSCHIEF EXECUTIVE
12
Overview
Good business fundamentals and strong financial position
Growth in core regional bus operations and well positioned in de-risked rail market
Clear understanding of changing dynamics and trends in our public transport markets
Focus on growing demand through data, technology, innovation + better policy
Leveraging technology and engaging with our people to make bus and rail services easier for customers, reduce costs and improve efficiency
Positive outlook from growing pressure on governments to address road congestion, air quality and maximise benefit of public transport to economy
13
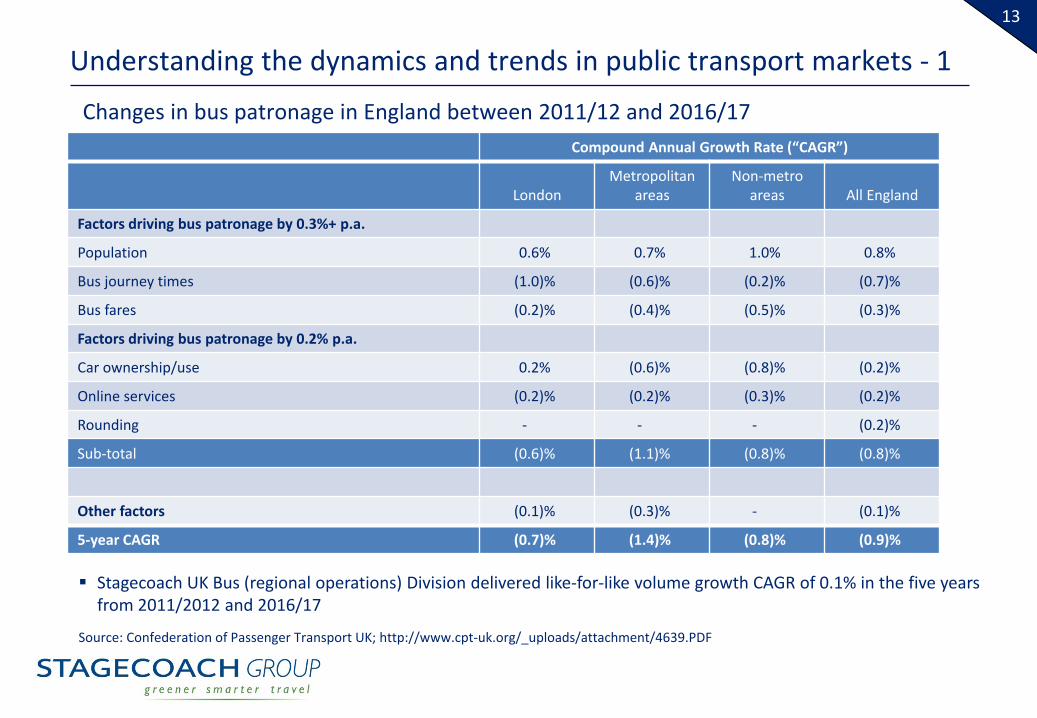
Understanding the dynamics and trends in public transport markets - 1
Compound Annual Growth Rate (“CAGR”)
LondonMetropolitan
areasNon-metro
areas All England
Factors driving bus patronage by 0.3%+ p.a.
Population 0.6% 0.7% 1.0% 0.8%
Bus journey times (1.0)% (0.6)% (0.2)% (0.7)%
Bus fares (0.2)% (0.4)% (0.5)% (0.3)%
Factors driving bus patronage by 0.2% p.a.
Car ownership/use 0.2% (0.6)% (0.8)% (0.2)%
Online services (0.2)% (0.2)% (0.3)% (0.2)%
Rounding - - - (0.2)%
Sub-total (0.6)% (1.1)% (0.8)% (0.8)%
Other factors (0.1)% (0.3)% - (0.1)%
5-year CAGR (0.7)% (1.4)% (0.8)% (0.9)%
Source: Confederation of Passenger Transport UK; http://www.cpt-uk.org/_uploads/attachment/4639.PDF
Changes in bus patronage in England between 2011/12 and 2016/17
Stagecoach UK Bus (regional operations) Division delivered like-for-like volume growth CAGR of 0.1% in the five years from 2011/2012 and 2016/17
14
Understanding the dynamics and trends in public transport markets - 2
Population growth is the biggest positive driver of bus patronage across England.
The biggest negative drivers of patronage are factors linked to road congestion: car ownership, increased bus journey times and higher bus fares
Public policy decisions have also negatively impacted bus use:
‒ Cuts to local authority supported services have reduced the scope of bus networks
‒ the Government’s decision to reduce the rate of Bus Service Operators Grant (fuel duty rebate) from April 2012 has increased bus operator costs and fares
Online services (e.g. online shopping and delivery services) have had a lesser adverse impact on bus use
The incremental impact from new taxi competition has been relatively modest
15
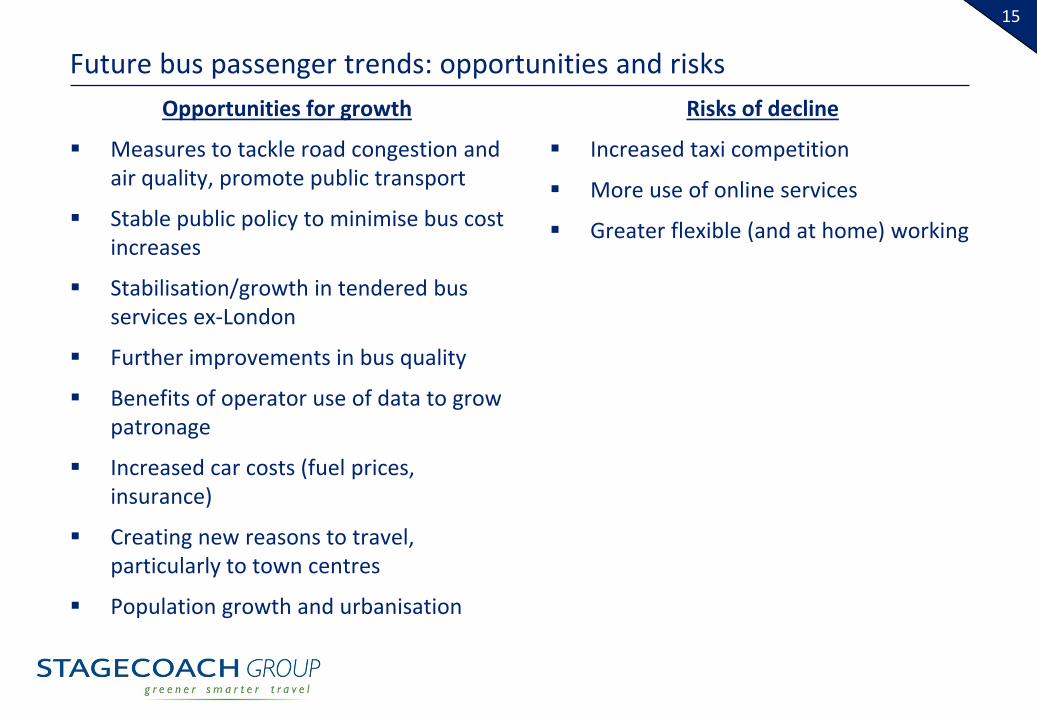
Future bus passenger trends: opportunities and risksOpportunities for growth
Measures to tackle road congestion and air quality, promote public transport
Stable public policy to minimise bus cost increases
Stabilisation/growth in tendered bus services ex-London
Further improvements in bus quality
Benefits of operator use of data to grow patronage
Increased car costs (fuel prices, insurance)
Creating new reasons to travel, particularly to town centres
Population growth and urbanisation
Risks of decline
Increased taxi competition
More use of online services
Greater flexible (and at home) working
16
Making our bus services easier for customers
Growth in new and refreshed inter-urban services by reflecting changing customer needs/expectations in product offer
Partnership with Deloitte digital arm to deliver radical simplification of passenger information, with prioritisation of digital
Brand strategy review to reconnect with customers and leverage strength of our market leading offer
Completion of roll-out of Britain’s biggest deployment of contactless technology on bus, with plans for QR code mobile ticketing on bus in 2019
17
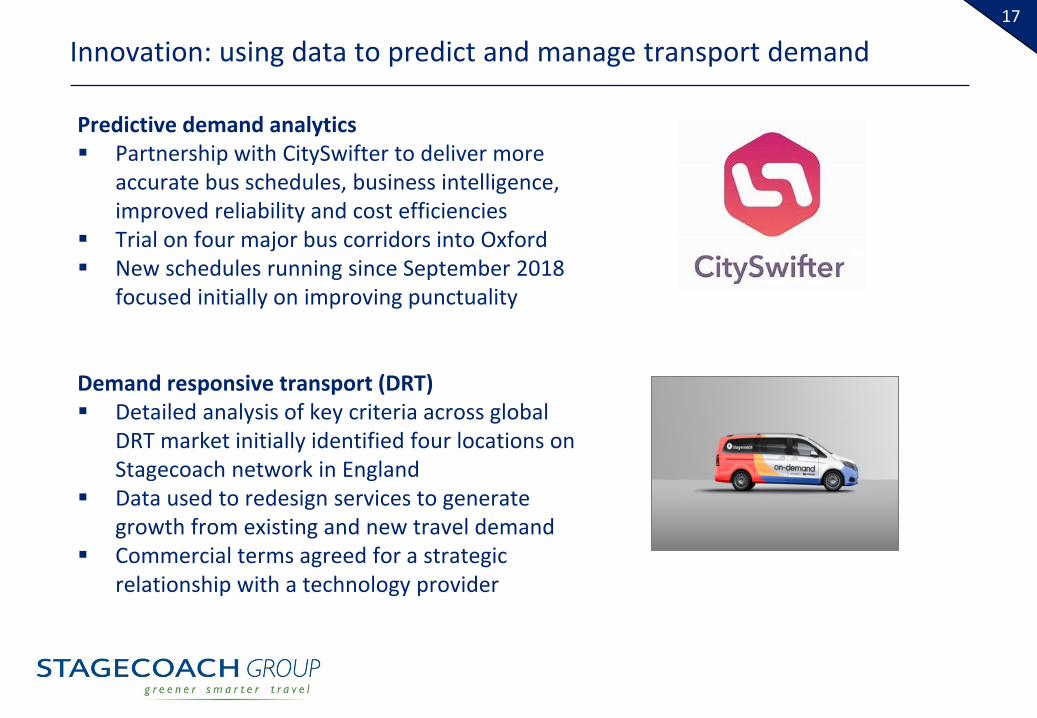
Predictive demand analytics Partnership with CitySwifter to deliver more
accurate bus schedules, business intelligence, improved reliability and cost efficiencies
Trial on four major bus corridors into Oxford New schedules running since September 2018
focused initially on improving punctuality
Demand responsive transport (DRT) Detailed analysis of key criteria across global
DRT market initially identified four locations on Stagecoach network in England
Data used to redesign services to generate growth from existing and new travel demand
Commercial terms agreed for a strategic relationship with a technology provider
Innovation: using data to predict and manage transport demand
18
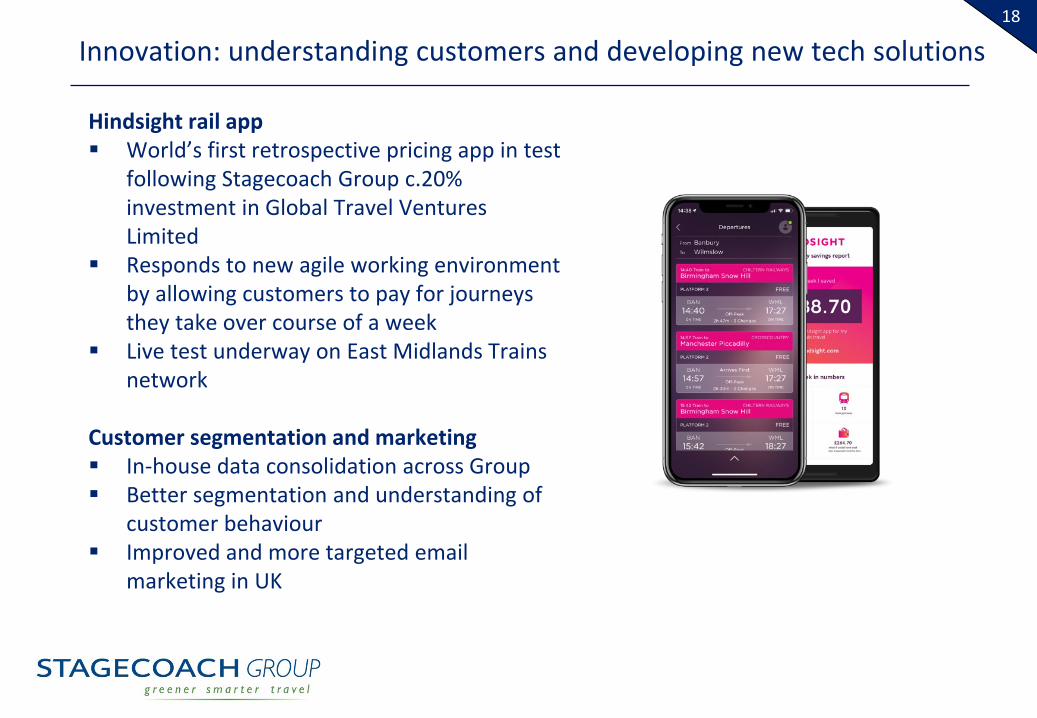
Innovation: understanding customers and developing new tech solutions
Hindsight rail app World’s first retrospective pricing app in test
following Stagecoach Group c.20% investment in Global Travel Ventures Limited
Responds to new agile working environment by allowing customers to pay for journeys they take over course of a week
Live test underway on East Midlands Trains network
Customer segmentation and marketing In-house data consolidation across Group Better segmentation and understanding of
customer behaviour Improved and more targeted email
marketing in UK
19
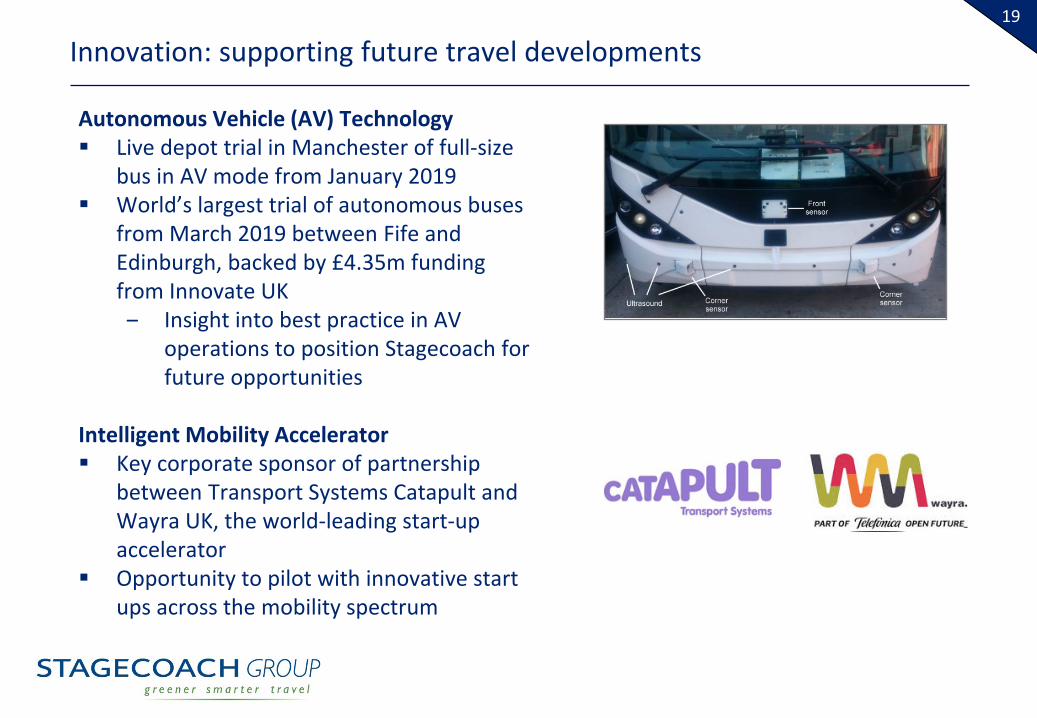
Innovation: supporting future travel developments
Autonomous Vehicle (AV) Technology Live depot trial in Manchester of full-size
bus in AV mode from January 2019 World’s largest trial of autonomous buses
from March 2019 between Fife and Edinburgh, backed by £4.35m funding from Innovate UK‒ Insight into best practice in AV
operations to position Stagecoach for future opportunities
Intelligent Mobility Accelerator Key corporate sponsor of partnership
between Transport Systems Catapult and Wayra UK, the world-leading start-up accelerator
Opportunity to pilot with innovative start ups across the mobility spectrum
20
Influencing transport policy
Urban Mobility Partnership Formed by Stagecoach Group and car
rental group, Enterprise Holdings Brings together key stakeholders to
develop practical policy solutions aimed at reducing congestion, improving air quality and making journeys easier in UK towns and cities
Initial policy proposals focus on mobility credits, planning and grey fleets
21
UK rail market and government policy review
Group well-positioned in UK rail market
‒ Three live contract bids both individually and with strong partners‒ Direct Award at East Midlands Trains through to at least August 2019
expected shortly‒ More than 20 years' experience of delivering benefits for customers,
taxpayers, investors Williams rail review presents opportunity for a more sustainable franchising
model and a successful railway for customers and taxpayers
22
Strong Group financial position and positive outlook
Disciplined capital investment across the business
Increase in expected 2018/19 adjusted earnings per share
Brexit risks evaluated and manageable
Opportunities from innovation, new initiatives and growing pressure on government to address congestion and air quality

23
INTERIM RESULTSHALF-YEAR ENDED 27 OCTOBER 2018
24
APPENDICES
25
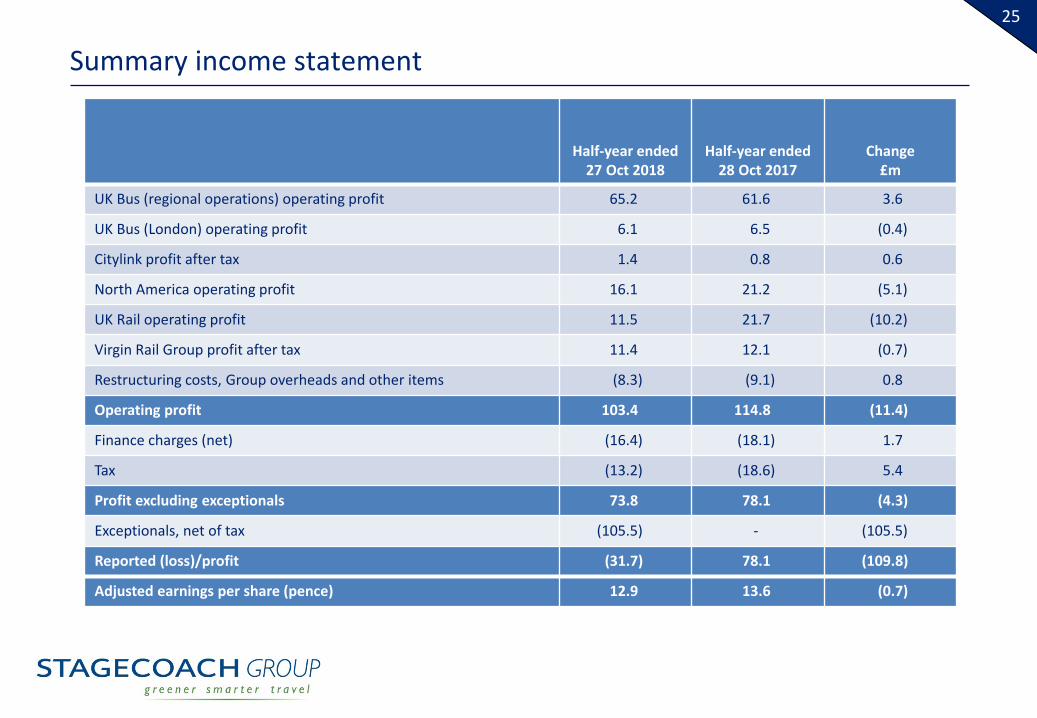
Summary income statement
Half-year ended27 Oct 2018
Half-year ended28 Oct 2017
Change£m
UK Bus (regional operations) operating profit 65.2 61.6 3.6
UK Bus (London) operating profit 6.1 6.5 (0.4)
Citylink profit after tax 1.4 0.8 0.6
North America operating profit 16.1 21.2 (5.1)
UK Rail operating profit 11.5 21.7 (10.2)
Virgin Rail Group profit after tax 11.4 12.1 (0.7)
Restructuring costs, Group overheads and other items (8.3) (9.1) 0.8
Operating profit 103.4 114.8 (11.4)
Finance charges (net) (16.4) (18.1) 1.7
Tax (13.2) (18.6) 5.4
Profit excluding exceptionals 73.8 78.1 (4.3)
Exceptionals, net of tax (105.5) - (105.5)
Reported (loss)/profit (31.7) 78.1 (109.8)
Adjusted earnings per share (pence) 12.9 13.6 (0.7)
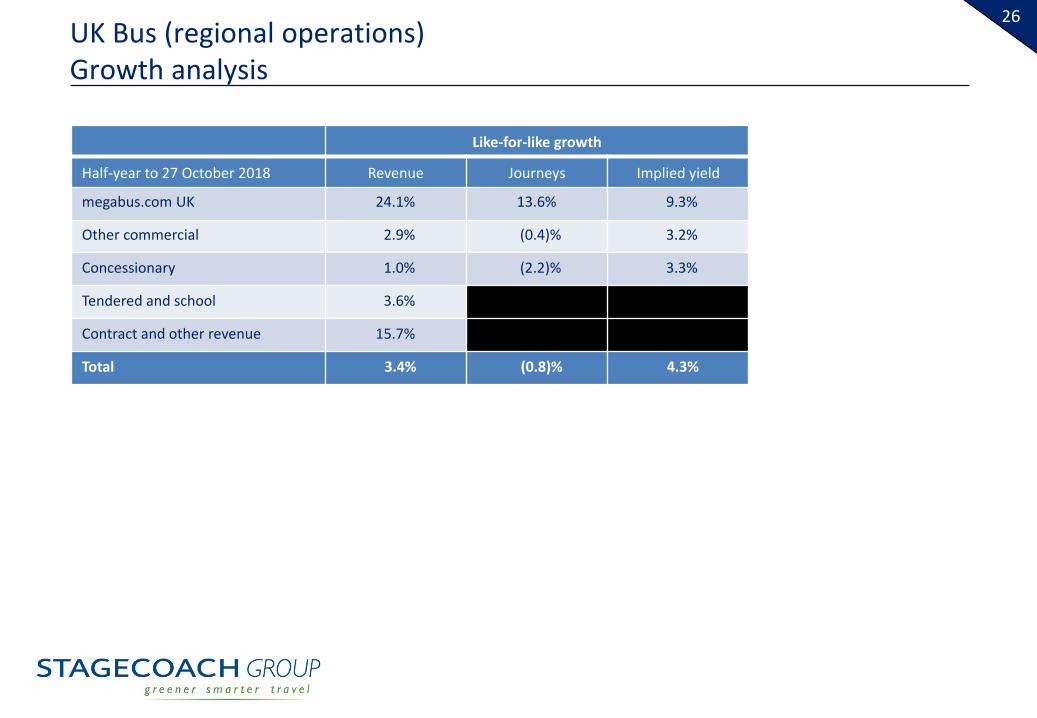
26UK Bus (regional operations)Growth analysis
Like-for-like growth
Half-year to 27 October 2018 Revenue Journeys Implied yield
megabus.com UK 24.1% 13.6% 9.3%
Other commercial 2.9% (0.4)% 3.2%
Concessionary 1.0% (2.2)% 3.3%
Tendered and school 3.6%
Contract and other revenue 15.7%
Total 3.4% (0.8)% 4.3%
27
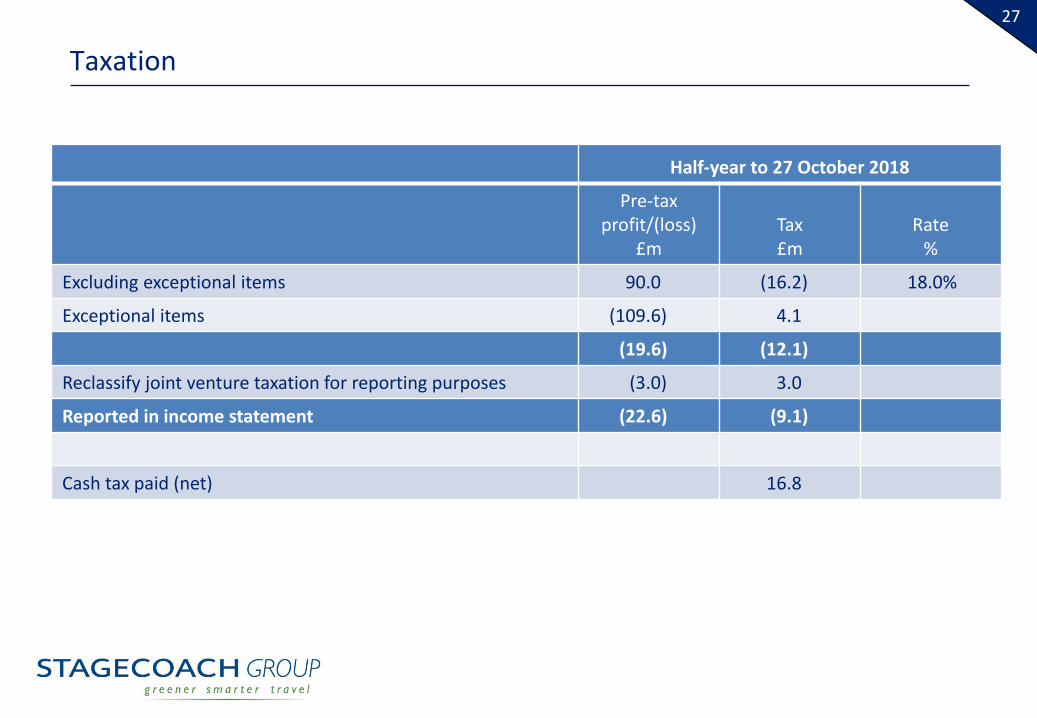
Taxation
Half-year to 27 October 2018
Pre-tax profit/(loss)
£mTax£m
Rate%
Excluding exceptional items 90.0 (16.2) 18.0%
Exceptional items (109.6) 4.1
(19.6) (12.1)
Reclassify joint venture taxation for reporting purposes (3.0) 3.0
Reported in income statement (22.6) (9.1)
Cash tax paid (net) 16.8
28
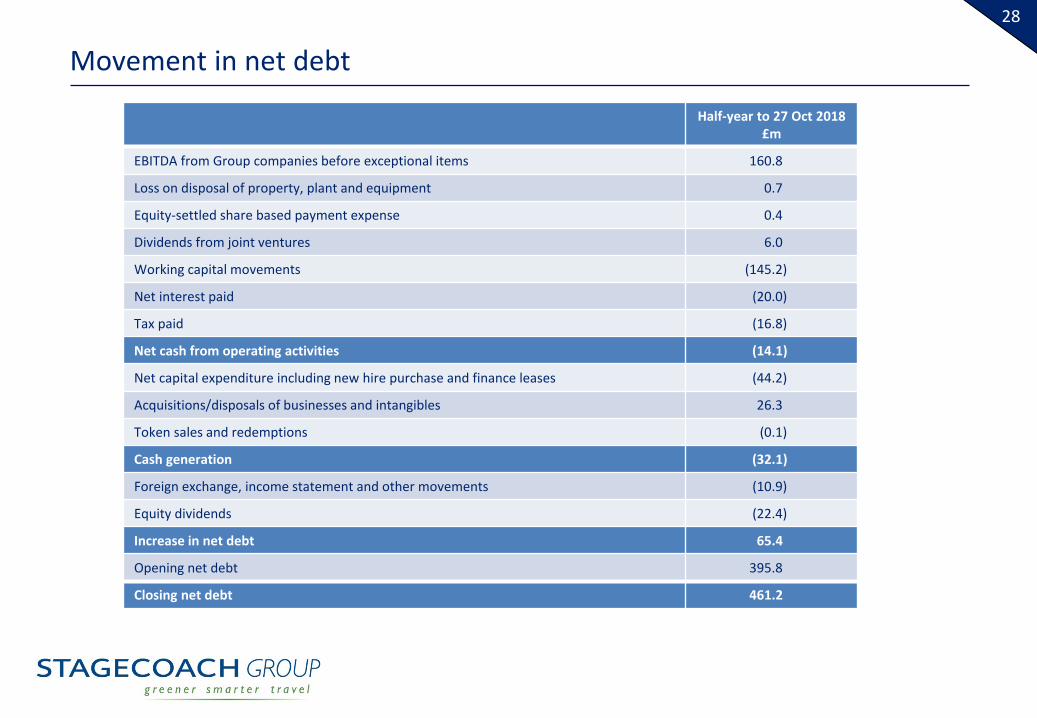
Movement in net debt
Half-year to 27 Oct 2018£m
EBITDA from Group companies before exceptional items 160.8
Loss on disposal of property, plant and equipment 0.7
Equity-settled share based payment expense 0.4
Dividends from joint ventures 6.0
Working capital movements (145.2)
Net interest paid (20.0)
Tax paid (16.8)
Net cash from operating activities (14.1)
Net capital expenditure including new hire purchase and finance leases (44.2)
Acquisitions/disposals of businesses and intangibles 26.3
Token sales and redemptions (0.1)
Cash generation (32.1)
Foreign exchange, income statement and other movements (10.9)
Equity dividends (22.4)
Increase in net debt 65.4
Opening net debt 395.8
Closing net debt 461.2
29
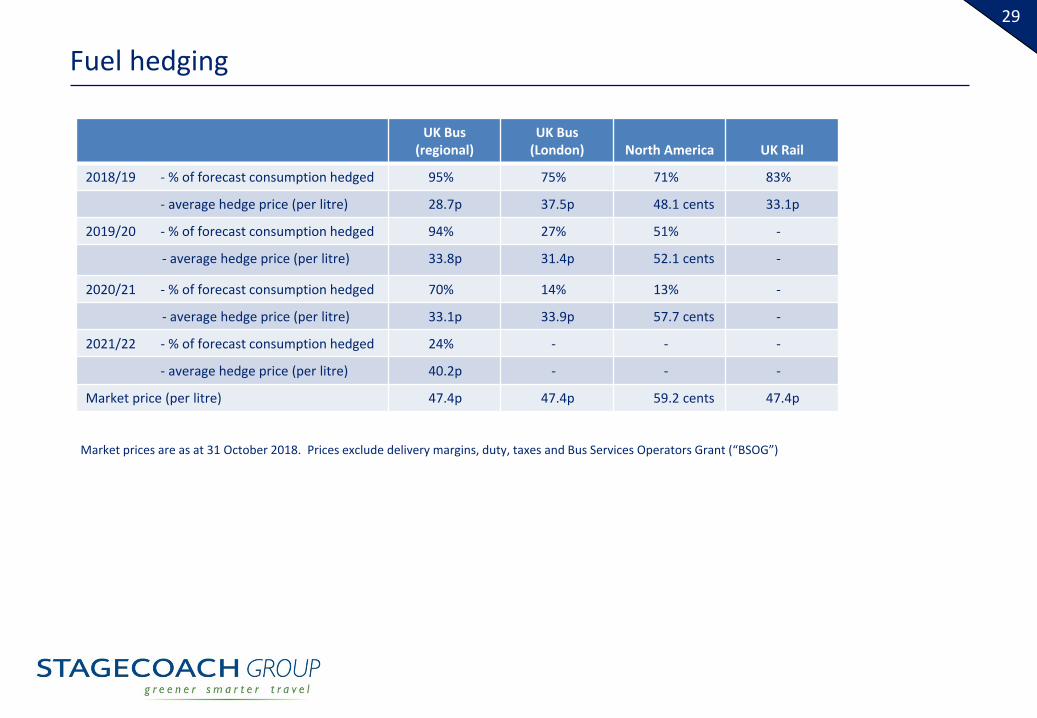
Fuel hedging
UK Bus(regional)
UK Bus (London) North America UK Rail
2018/19 - % of forecast consumption hedged 95% 75% 71% 83%
- average hedge price (per litre) 28.7p 37.5p 48.1 cents 33.1p
2019/20 - % of forecast consumption hedged 94% 27% 51% -
- average hedge price (per litre) 33.8p 31.4p 52.1 cents -
2020/21 - % of forecast consumption hedged 70% 14% 13% -
- average hedge price (per litre) 33.1p 33.9p 57.7 cents -
2021/22 - % of forecast consumption hedged 24% - - -
- average hedge price (per litre) 40.2p - - -
Market price (per litre) 47.4p 47.4p 59.2 cents 47.4p
Market prices are as at 31 October 2018. Prices exclude delivery margins, duty, taxes and Bus Services Operators Grant (“BSOG”)
30
Definitions
Like-for-like amounts are derived, on a constant currency basis, by comparing the relevant year-to-date amount with the equivalent prior year period for those businesses and individual operating units that have been part of the Group throughout both periods. Where the number of days differs between the current and prior year periods, the prior year amount is normalised for that when calculating like-for-like amounts.
Operating profit or loss for a particular business unit or division within the Group refers to profit or loss before net finance income/costs, taxation, non-controlling interests, non-software intangible asset amortisation, exceptional items and restructuring costs.
Operating margin for a particular business unit or division within the Group means operating profit or loss as a percentage of revenue.
Exceptional items means items which individually or, if of a similar type, in aggregate need to be disclosed by virtue of their nature, size or incidence in order to allow a proper understanding of the underlying financial performance of the Group.
Gross debt is borrowings as reported on the consolidated balance sheet, adjusted to exclude accrued interest and the effect of fair value hedges on the carrying value of borrowings.
Net debt (or net funds) is the net of cash/cash equivalents and gross debt.
TfL refers to Transport for London, a governmental body.
31
INTERIM RESULTSHALF-YEAR ENDED 27 OCTOBER 2018