Embed Size (px)
Citation preview

Intermediate_GIS_Skills_With_Arcgis_931.Doc Page 1 of 14
The Yale Map Collection At Sterling Memorial Library 130 Wall Street, Room 707
Stacey Maples – GIS Assistant 203-432-8269 / [email protected] www.library.yale.edu/maps
Intermediate GIS Skills UsingIntermediate GIS Skills UsingIntermediate GIS Skills UsingIntermediate GIS Skills Using ESRI’s ArcGIS SoftwareESRI’s ArcGIS SoftwareESRI’s ArcGIS SoftwareESRI’s ArcGIS Software
ObjectivesObjectivesObjectivesObjectives
In this exercise you are introduced to the ArcMap interface and some of the basic skills necessary to begin exploring geospatial data and create simple maps. Once you have successfully completed this part of the tutorial, you should know:
• How to use the Union Tool to combine to feature data sets
• How to create new fields in a feature dataset or table
• How to calculate the geometric attributes of a feature
• How to calculate attribute values across feature attribute fields
• How to Join datasets based on attribute values
• How to Join datasets based upon location
• How to create Summary Statistics tables from datasets
• How to Geocode tables of street addresses • How to create a distance raster to measure
distance for a feature dataset • How to extract raster values to a point
feature dataset • How to aggregate point features to counts
in a polygon dataset • How to set Relative Pathnames to make
your GIS Projects more portable
Download the DataDownload the DataDownload the DataDownload the Data
The datasets used in this tutorial are available for download on the Map Collection Website. Feel free to download and use these tutorial materials, as you wish, and to pass them along to interested colleagues. Go To the Map Collection Homepage (www.library.yale.edu/maps) in your Web Browser . Under the Quick Links Section on the right, Click on the “Download GIS Workshop Materials” link. Find the “Data” Link for the ArcGIS 9.3.1 “Intermediate GIS Skills Using ESRI’s ArcGIS Softwar e” and Right-Click on the Link. In Firefox, Select “Save Link As,” in Internet Explorer, Select “Save Target As…” Depending on your browser and setup, you may be offered a Browse Window , to select the folder into which you want the downloaded file placed. If so, Browse to a Folder on your hard drive that you have write permission for. For this tutorial, we will assume that you are using the C:\temp folder of the machine you are working on. Save the Downloaded File to the C:\Temp Folder.
Unzip the DataUnzip the DataUnzip the DataUnzip the Data
You should now have a file called “Intermediate_GIS_Skills.zip” in your new folder. It is now necessary to decompress, or unzip, the tutorial data for use. Note that in Microsoft Windows XP and Vista, it is possible to “Explore” a compressed file, as if it were a folder. ArcMap does not support this type of browsing, so it is

Intermediate_GIS_Skills_With_Arcgis_931.Doc Page 2 of 14
The Yale Map Collection At Sterling Memorial Library 130 Wall Street, Room 707
Stacey Maples – GIS Assistant 203-432-8269 / [email protected] www.library.yale.edu/maps
necessary to actually unzip the file for use. This part of the tutorial assumes that you are using Windows’ built in Compressed File support.
1. Browse into the Folder where you saved the Intermediate_GIS_Skills.zip file.
2. Right-Click on the File and Select “Extract All…”
3. Click Next to arrive at the window shown at the right.
4. Click Next to Extract the File.
5. When finished, browse to the C:\temp\Intermediate_GIS_Skills\ and double-click on the Intermediate_GIS_Skills.mxd Map Document file to open it.
Analysis with ArcGISAnalysis with ArcGISAnalysis with ArcGISAnalysis with ArcGIS
In this tutorial, we will be performing what is referred to as “Areal Interpolation” of Census Attributes. We have a set of boundaries (in this case the Major Watershed Basins of Connecticut, our CT_Major_Basins Layer) for which we would like to summarize the population. Our problem is that these watershed boundaries do not correspond with the geographic units that the U.S. Census uses to collect and tabulate demographic data. Some of the Census Block Groups in our CT_Block_Groups layer overlaps more than one Watershed basin unit. What we will do in the following steps is calculate the proportion of overlap for each Census Block Group, relative to the Watershed Boundaries, and use these proportions to assign an appropriate estimate of the population to each watershed.
Calculating Geometry for a Calculating Geometry for a Calculating Geometry for a Calculating Geometry for a Data LayerData LayerData LayerData Layer
First, we need to determine the initial area of each of our “intact” Census Block Groups. We can refer to these as the “Parent” features.
1. Right-Click on the CT_Block_Group Layer and Open the Attribute Table.

Intermediate_GIS_Skills_With_Arcgis_931.Doc Page 3 of 14
The Yale Map Collection At Sterling Memorial Library 130 Wall Street, Room 707
Stacey Maples – GIS Assistant 203-432-8269 / [email protected] www.library.yale.edu/maps
2. Take a few seconds to examine the data available in this dataset. This data describes the demographic characteristics of every Census Block Group in our area of interest.
3. Click the Options Button at the Bottom of the Attribute Table and Select Add Field...
4. Add a Field with Name = AREA, and Type = Float.
5. Click OK.
6. Scroll to the far right of the Attribute Table to view the newly added AREA Field.
7. Right-Click on the Area Field Header and Select Calculate Geometry… Click Yes when warned about “Calculating Outside and Edit Session.”
8. Change the Units to Square Miles US [sq mi].
9. Click OK.
10. Note that the AREA Field should now be populated with the new values.
11. Close the Attribute Table
Geoprocessing: Using the Union ToolGeoprocessing: Using the Union ToolGeoprocessing: Using the Union ToolGeoprocessing: Using the Union Tool
Now, we need to merge the Block Group and Watershed boundary files, so that those Block Groups that span more than one watershed will be split into their sub-units of overlap, or “child” features. To do this, we will use a technique generically referred to as “Geoprocessing.” Geoprocessing is the act of applying any number of spatially transforming tools to a dataset. In this case, we will use the Union Tool to create a new dataset.
12. Open the ArcToolbox using the ArcToolbox Button on the Standard Toolbar.
13. Click on the Search Tab, at the bottom of the ArcToolbox Panel.
14. Enter “union” as your search term and click Search.
15. Double-Click on the Union Tool, from the Analysis Tools Toolbox.
16. Select the CT_Major_Basins and CT_Block_Groups Layers as the Input Features.

Intermediate_GIS_Skills_With_Arcgis_931.Doc Page 4 of 14
The Yale Map Collection At Sterling Memorial Library 130 Wall Street, Room 707
Stacey Maples – GIS Assistant 203-432-8269 / [email protected] www.library.yale.edu/maps
17. Click on the Show Help>> Button at the bottom of the Dialog Box and note that the Help System is Context-Sensitive.
18. Save the Output Feature Class to your C:\temp\Intermediate_GIS_Skills\CT_Watershed_Data.gdb and name it “Union”
19. Leave the remaining options at their default settings.
20. Click OK to Apply the Union Tool.
21. Click Close once the process has completed.
22. You should be left with a new Union Layer, at the top of your Table of Contents.
Calculating the New Area of the Union ResultsCalculating the New Area of the Union ResultsCalculating the New Area of the Union ResultsCalculating the New Area of the Union Results
Now we need to calculate the NEW AREA of those “Child” Block Groups that were split by the Union Process and then the proportion of their original AREA.
23. Right-Click on the Union Layer and Open the Attribute Table.
24. Click on the Options Button and Select Add Field…
25. Add a new field: Name = SUBAREA, Type = Float. Click OK.
26. Click on the Options Button and Select Add Field…
27. Add a new field: Name = WEIGHT, Type = Float. Click OK.
28. Click on the Options Button and Select Add Field…
29. Add a new field: Name = WTPOP, Type = Short Integer. Click OK.

Intermediate_GIS_Skills_With_Arcgis_931.Doc Page 5 of 14
The Yale Map Collection At Sterling Memorial Library 130 Wall Street, Room 707
Stacey Maples – GIS Assistant 203-432-8269 / [email protected] www.library.yale.edu/maps
30. Scroll to the right of the Attribute Table to find the newly added SUBAREA Field.
31. Right-Click on the SUBAREA field header and Select Calculate Geometry…
32. Change the Units to Square Miles US [sq mi].
33. Click OK to apply the calculation.
Now we will calculate the proportion of the child area to parent area, which will be used as a weight to apply to the demographics we are interested in. First, we must exclude those polygons that have an AREA=’0’ (these are coastal “slivers” and are not important to the results of our analysis).
34. Click on the Options Button and Select “Select by Attributes…”
35. In the Query Argument panel, at the bottom of the Select by Attributes Dialog Box, enter the query: "AREA" <>0
36. 37. This will select only those records that do not
have an AREA = 0.
38. Click on the Verify Button to check your SQL Query Syntax.
39. Click Apply.
40. Click Close.
41. Right-Click on the WEIGHT field header and Select Field Calculator…
42. Use the Field Calculator to build the following argument: [SUBAREA] / [AREA]
43. Click OK to apply the calculation and note that, because you have an active select, the calculation is only applied to the selected subset of records, thus avoiding a “divide by 0 error.”
44. Finally, Scroll to the far right of the Attribute Table, Right-Click on the WTPOP field header and select Field Calculator…

Intermediate_GIS_Skills_With_Arcgis_931.Doc Page 6 of 14
The Yale Map Collection At Sterling Memorial Library 130 Wall Street, Room 707
Stacey Maples – GIS Assistant 203-432-8269 / [email protected] www.library.yale.edu/maps
45. Use the Field Calculator to build the following argument: [POP2004] * [WEIGHT]
46. Click OK to apply the Calculation.
47. Save your work.
Summary StatisticsSummary StatisticsSummary StatisticsSummary Statistics
Now that we have a set of Census Boundary files that correspond to the watershed, and estimates of the population of those new boundary units, we need to summarize those population estimates for each of our watershed units.
48. On the Attribute Table Click the Options Button and select Clear Selection.
49. Close the Attribute Table.
50. Return to the ArcToolbox Search Tab, enter “summary” as the search term and click Search.
51. Double-Click on the Summary Statistics Tool.
52. Select the Union Layer as the Input Table.
53. Browse to the C:\temp\Intermediate_GIS_Skills\CT_Watershed_Data.gdb and save the Output Table as “Population_Summary”
54. Select WTPOP as the Statistics Field, and select SUM as the Statistic Type.
Intermediate_GIS_Skills_With_Arcgis_931.Doc Page 7 of 14
The Yale Map Collection At Sterling Memorial Library 130 Wall Street, Room 707
Stacey Maples – GIS Assistant 203-432-8269 / [email protected] www.library.yale.edu/maps
55. Select MAJOR as the Case field.
56. Click OK.
57. Click Close when the tool completes.
58. Click on the Source Tab, at the Bottom of the Table of Contents.
59. Right-Click on the Population _Summary Table and Open it to observe the population counts for the watersheds.
60. Close Attribute Table.
61. Save your work.
Joining the Summary Statistics Joining the Summary Statistics Joining the Summary Statistics Joining the Summary Statistics Table to the Watershed Boundary Table to the Watershed Boundary Table to the Watershed Boundary Table to the Watershed Boundary FileFileFileFile
Ultimately, what we want is a CT_Major_Basins Layer with the Population value as an attribute of each feature. This is achieved through the use of a table-to-table join.
62. Right-Click on the CT_Major_Basins Layer and Select Joins and Relates>Join…
63. Set the Options as shown in the image to the right:
64. Click OK.
65. Right-Click the CT_Major_Basins Layer and open its attribute table. Note that the population counts have now been joined to the boundary file.
Intermediate_GIS_Skills_With_Arcgis_931.Doc Page 8 of 14
The Yale Map Collection At Sterling Memorial Library 130 Wall Street, Room 707
Stacey Maples – GIS Assistant 203-432-8269 / [email protected] www.library.yale.edu/maps
GeocodiGeocodiGeocodiGeocoding Address ng Address ng Address ng Address Data from a TableData from a TableData from a TableData from a Table
Examine the Street Reference DataExamine the Street Reference DataExamine the Street Reference DataExamine the Street Reference Data
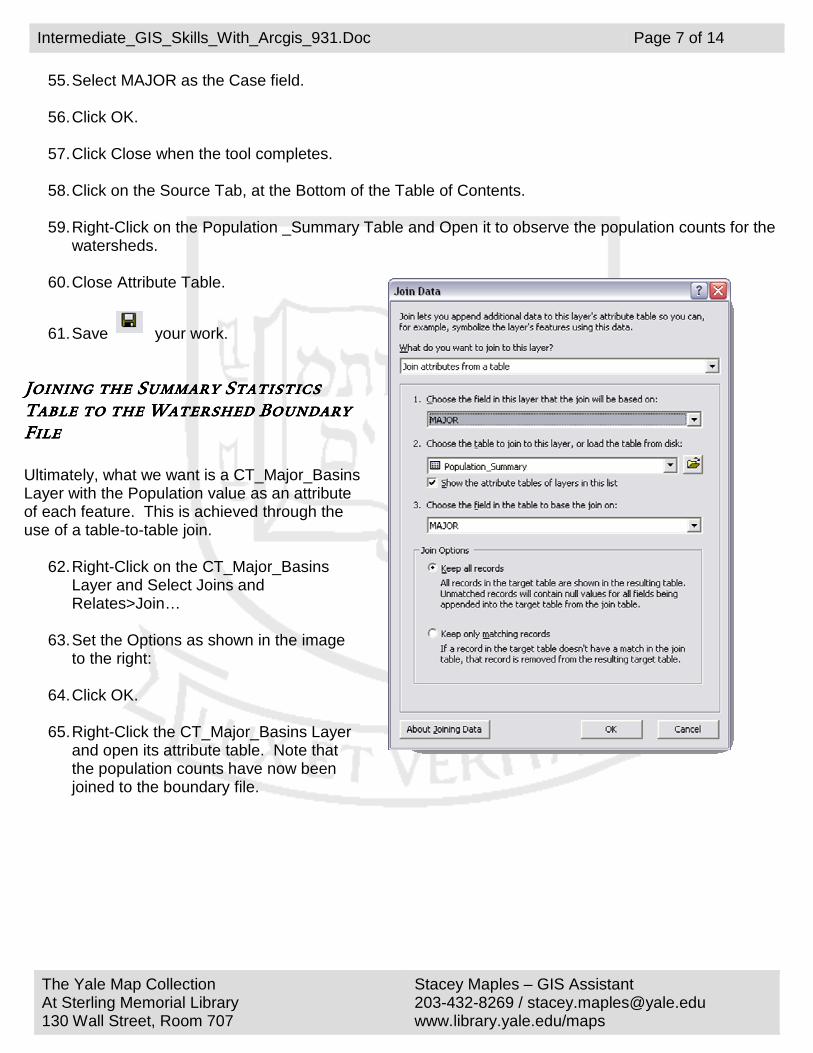
1. Right-Click on the CT_Streets Layer and Open the Attribute Table.
Note the fields included in this reference data set. This streets reference data is ‘topologically integrated,’ meaning that there is information encoded into the dataset. Fields included for each street segment that are essential to the geocoding process include:
• FNODE – This is an identifying number for the point FROM WHICH the street segment begins.
• TNODE – This is an identifying number for the point TO WHICH the street segment extends.
• FRADDL & FRADDR – These are the values of the address range for the given street segment at the FNODE for the LEFT & RIGHT side of the street, respectively.
• TOADDL & TOADDR - These are the values of the address range for the given street segment at the TNODE for the LEFT & RIGHT side of the street, respectively.
Together, the FRADDL, FRADDR, TOADDL & TOADDR values provide the numeric range of addresses for both sides of a given street segment. This information is used to calculate the “percent along” the street segment that a given address lays.
2. Close the CT_Streets table.
Examine the Address DataExamine the Address DataExamine the Address DataExamine the Address Data
3. If you are not still in the Source Tab of the Table of Contents, click on it.
4. Right-Click the
CT_TRI_Facilities table and Open it.
Note that this table contains data about facilities cataloged and reported in the Toxic Relief Inventory. The FStreet and other fields prefixed with “F” are attributes of the facility locations. We will use these address

Intermediate_GIS_Skills_With_Arcgis_931.Doc Page 9 of 14
The Yale Map Collection At Sterling Memorial Library 130 Wall Street, Room 707
Stacey Maples – GIS Assistant 203-432-8269 / [email protected] www.library.yale.edu/maps
attributes to create an explicitly spatial dataset from a dataset with ‘implicit’ spatial data (street addresses). Note also that the format of the addresses in the table differs from that in the reference street data. This format, where the full street address is concatenated into a single field is how ArcGIS “prefers” address data.
5. Close the CT_TRI_Facilities table.
Examine the Address LocatorExamine the Address LocatorExamine the Address LocatorExamine the Address Locator
The Address Locator is an indexing device that “connects” your street reference data to your address data by mapping the appropriate fields in each dataset to one another. The Address Locator also allows you to “encapsulate” specific settings for how the data should be geocoded, so that you can provide an optimized solution for repeatable geocoding of data.
6. Click on the
ArcCatalog Icon to Open ArcCatalog.
7. In the Catalog Tree, at the left of the ArcCatalog application, Browse to the C:\temp\Intermediate_GIS_Skills\CT_Watershed_Data.gdb database and find the CT_Address_Locator file.
8. Right-Click on the CT_Address_Locator and open it’s Properties.
9. Note the mapping ot the attributes from the CT_Streets reference dataset to the necessary geocoding fields.
10. Note, also, that many of the setting can be changed in this dialogue.
11. Click Cancel to close the Address Locator Dialog.
12. Minimize ArcCatalog and return to ArcMap.

Intermediate_GIS_Skills_With_Arcgis_931.Doc Page 10 of 14
The Yale Map Collection At Sterling Memorial Library 130 Wall Street, Room 707
Stacey Maples – GIS Assistant 203-432-8269 / [email protected] www.library.yale.edu/maps
StarStarStarStarting the Geocoding Processting the Geocoding Processting the Geocoding Processting the Geocoding Process
1. In the Source Tab of the Table of Contents, right-click on
the CT_TRI_Facilities table and select Geocode Addresses…
2. Click Add and Browse to the C:\temp\Intermediate_GIS_Skills\CT_Watershed_Data.gdb\CT_Address_Locator.
3. Click Add.
4. Click OK.
5. For the Address Input Fields, map the appropriate fields as shown on the right:
6. For the Output Feature Class, suffix the default value with “_01” so that it becomes D:\Patrons_and_Projects\Stacey.Maples\Workshops\2009 Workshops\02 - Intermediate GIS Skills\Base\CT_Watershed_Data.gdb\Geocoding_Result_01.
7. Click OK.
8. When the “Geocoding Addresses…” Status Window finishes, click Rematch.
Investigating Unmatched AddressesInvestigating Unmatched AddressesInvestigating Unmatched AddressesInvestigating Unmatched Addresses
1. In the Interactive Rematch Dialog Box, right-click on
the Status Field header and select “Sort Descending.” This will place all Unmatched records at the top of the table.
2. Click in one of the cells for the first records to highlight it.
3. Note the available Candidates in the lower panel. Compare the values for these candidates to those of your unmatched record.
4. Select the first candidate and click on the Match button.

Intermediate_GIS_Skills_With_Arcgis_931.Doc Page 11 of 14
The Yale Map Collection At Sterling Memorial Library 130 Wall Street, Room 707
Stacey Maples – GIS Assistant 203-432-8269 / [email protected] www.library.yale.edu/maps
5. Repeat until you have matched as many records as possible.
6. Click on the Close button.
Cleaning Unmatched Addresses from your resultsCleaning Unmatched Addresses from your resultsCleaning Unmatched Addresses from your resultsCleaning Unmatched Addresses from your results
1. Right-click on the Geocoding_Result_01 Layer and Open its Attribute Table.
2. Click the Options button and Select “Select by Attributes.”
3. Use the Query Builder to create a query
that reads: "Status" <> 'U'
4. Click Verify, then Apply.
5. Click Close.
6. Close the Attribute Table.
7. Right-Click on the Geocoding_Result_01 Layer and Select Data>Export Data…
8. Note that the default in this case is to export selected features, since we have an active selection.
9. Under Output… Click on the Browse Button, change the type to “File and Personal Geodatabase Feature Class” and save the export as “C:\temp\Intermediate_GIS_Skills\CT_Watershed_Data.gdb\CT_TRI_Facilities_Clean_Geocodes .”
10. Click Save. Click OK.
11. Click “Yes” when prompted to add the data to the map as a layer and use the resulting layer’s checkbox to turn on visibility.
12. Right-click and remove the Geocoding_Result_01 layer.

Intermediate_GIS_Skills_With_Arcgis_931.Doc Page 12 of 14
The Yale Map Collection At Sterling Memorial Library 130 Wall Street, Room 707
Stacey Maples – GIS Assistant 203-432-8269 / [email protected] www.library.yale.edu/maps
Counting Incidents Using “Spatial Join”Counting Incidents Using “Spatial Join”Counting Incidents Using “Spatial Join”Counting Incidents Using “Spatial Join”
66. Right-Click on the CT_Major_Basins Layer and Select Joins and Relates>Join…
67. Change the First Drop-down to “Join Data from
another layer based on spatial location.”
68. Make sure CT)TRI_Facilities_Clean_Geocodes is the layer to join.
69. Leave the default settings.
70. Save the Output as C:\temp\Intermediate_GIS_Skills\CT_Watershed_Data.gdb\CT_Major_Basins_Pop2004_and_TRI_Facility_Counts .
71. Click OK.
72. Right-Click and open the Attribute Table of the resulting CT_Major_Basins_with_Discharge_Count Layer to note that a new “Count” Layer has been added, with the number of discharge sites per watershed unit.
73. Save your work.
Working with Working with Working with Working with Raster DataRaster DataRaster DataRaster Data
Now, you will use raster data methods to create new measurements of proximity, between your CT_Major_Rivers layer and your geocoded CT_TRI_Facilities. Remember that raster data is pixel based, with each pixel containing the numeric value of some variable of interest. In this case, our variable of interest is the distance to the nearest major river.
1. If it is not already, Open the ArcToolbox and click on the Search Tab.
2. Enter “distance” as your search term. Click Search.
3. In the results, look for the Euclidean Distance tool from the Spatial Analyst Toolset. Double-click to launch the Euclidean Distance tool.

Intermediate_GIS_Skills_With_Arcgis_931.Doc Page 13 of 14
The Yale Map Collection At Sterling Memorial Library 130 Wall Street, Room 707
Stacey Maples – GIS Assistant 203-432-8269 / [email protected] www.library.yale.edu/maps
4. Select the CT_Major_Rivers Layer as the Inpurt Feature Source Data.
5. Change the Output Distance Raster to “C:\temp\Intermediate_GIS_Skills\Data\Dist2River,” saving the output to the C:\temp\Intermediate_GIS_Skills\Data\ folder created when you unzipped the tutorial data.
6. Click on the Environments button.
7. Click on General Setting to expand the item, and set the Extent to “Same as CT_Block_Groups”
8. Click OK.
9. Click OK, again.
10. Turn the visibility of the resulting layer on, if it is not enabled by default.
Note that you have created a new raster layer, whose pixels have the value of the distance to the nearest feature in the ST_Major_Rivers layer.
Extracting Raster Values to Extracting Raster Values to Extracting Raster Values to Extracting Raster Values to PointsPointsPointsPoints
Ultimately, we would like to make the “Distance to River” an attribute of each or our Toxic Release facilities. Here we will use the Extract Values to Points tool to do just that. This tool will take a set of points and make the value of the raster pixel, or cell, that is directly beneath that point, an attribute of the point.
1. Return to the ArcToolbox panel and Search on the term “Extract Values.”
2. In the results, double-click on the Extract Values to Points tool from the Spatial Analyst Toolbox.
3. Select the CT_TRI_Facilities_Clean_Geocodes layer as the input point feature layer.
Intermediate_GIS_Skills_With_Arcgis_931.Doc Page 14 of 14
The Yale Map Collection At Sterling Memorial Library 130 Wall Street, Room 707
Stacey Maples – GIS Assistant 203-432-8269 / [email protected] www.library.yale.edu/maps
4. Select the dist2river layer as the input raster.
5. Change the Output Point Features to “C:\temp\Intermediate_GIS_Skills\CT_Watershed_Data.gdb\CT_TRI_Facilities_Clean_Geocodes_with_dist2river ”
6. Check the Interpolate values… option.
7. Click OK.
8. Dismiss the Datum Warning.
9. Right-click on the new CT_TRI_Facilities_Clean_Geocodes_with_dist2river layer and open it’s attribute table.
10. Scroll to the far right of the table and note that the RASTERVALU field is populated with the interpolated distance value for the raster cell that each point falls inside.
Setting Relative Pathnames & Making ArcMap Projects PortableSetting Relative Pathnames & Making ArcMap Projects PortableSetting Relative Pathnames & Making ArcMap Projects PortableSetting Relative Pathnames & Making ArcMap Projects Portable
By setting “Relative Pathnames” in File>Map Properties>Data Source Options, you can move your ArcMap Project Folder as a single unit, preserving the location of your data files relative to your MXD document, without breaking the internal links to the datasets. You can also Zip the folder and send it through the email to colleagues.
1. On the Main Menu , Go To File>Document Properties.
2. Click on the Data Source Options Button.
3. Set the Option to “Store relative path names to data sources.”
4. Check the “Make relative paths the default for new map documents I create” Checkbox , if it is not already.
5. Click Ok.
6. Click Ok. You can now move your project by copying or zipping the C:\temp\Intermediate_GIS_Skills\ Folder , in its entirety, without having the problem of broken links that we experienced at the beginning of the tutorial.
• ArcMap supports long filenames for MXD Document, table and shapefile names. Use this to your advantage by giving these files very specifically descriptive names. Coverage and raster filenames are limited to 13 characters.

![Python and ArcGIS Enterprise - static.packt-cdn.com€¦ · Python and ArcGIS Enterprise [ 2 ] ArcGIS enterprise Starting with ArcGIS 10.5, ArcGIS Server is now called ArcGIS Enterprise](https://img.pdfslide.net/doc/110x75/5ecf20757db43a10014313b7/python-and-arcgis-enterprise-python-and-arcgis-enterprise-2-arcgis-enterprise.jpg)