Embed Size (px)
Citation preview

Meteorologische Zeitschrift Vol 18 No 4 433-443 (August 2009) Articleccopy by Gebruder Borntraeger 2009
Internal and external North Atlantic Sector variability in theKiel Climate ModelMOJIB LATIFlowast WONSUN PARK HUI DING and NOEL S KEENLYSIDE
Leibniz-Institut fur Meereswissenschaften Kiel Germany
(Manuscript received October 31 2008 in revised form March 19 2009 accepted April 4 2009)
AbstractThe internal and external North Atlantic Sector variability is investigated by means of a multimillennialcontrol run and forced experiments with the Kiel Climate Model (KCM) The internal variability is studiedby analyzing the control run The externally forced variability is investigated in a run with periodic millennialsolar forcing and in greenhouse warming experiments with enhanced carbon dioxide concentrations Thesurface air temperature (SAT) averaged over the Northern Hemisphere simulated in the control run displaysenhanced variability relative to the red background at decadal centennial and millennial timescales Specialemphasis is given to the variability of the Meridional Overturning Circulation (MOC) The MOC plays animportant role in the generation of internal climate modes Furthermore the MOC provides a strong negativefeedback on the Northern Hemisphere SAT in both the solar and greenhouse warming experiments therebymoderating the direct effects of the external forcing in the North Atlantic The implications of the results fordecadal predictability are discussed
ZusammenfassungDie interne und externe Variabilitat im nordatlantischen Raum wurde mit Hilfe einer Kontrollsimulationund angetriebenen Experimenten mit dem Kiel Climate Model (KCM) untersucht Die interne Variabilitatwird anhand der Kontrollintegration analysiert die externe Variabilitat in Integrationen mit periodischemsolarem Antrieb und in Treibhausgas-Experimenten mit erhohter Kohlendioxidkonzentration Die nord-hemispharische Oberflachenlufttemperatur zeigt in der Kontrollsimulation starke uber den roten Hinter-grund herausragende Variabilitat auf Zeitskalen von Dekaden Jahrhunderten und Jahrtausenden Beson-dere Aufmerksamkeit gilt der Meridionalen Umwalzbewegung (MOC) Sie spielt eine wichtige Rolle hin-sichtlich der Generierung interner Klimamoden Daruber hinaus wirkt die MOC sowohl in den Expe-rimenten mit solarem als auch mit Treibhausgas-Antrieb als eine negative Ruckkopplung fur die nord-hemispharische Oberflachenlufttemperatur wodurch der Einfluss des direkten Antriebs im Bereich des Nord-atlantiks abgeschwacht wird Die Bedeutung der Ergebnisse fur die dekadische Vorhersagbarkeit wird disku-tiert
1 Introduction
Climate variability can be either generated internally byinteractions within or between the individual climatesubcomponents (e g atmosphere ocean and sea ice)or externally by e g volcanic eruptions variations in thesolar insolation at the top of the atmosphere or changedatmospheric greenhouse gas concentrations in responseto anthropogenic emissions Examples of internal varia-tions are the El NinoSouthern Oscillation (ENSO) thePacific Decadal Variability (PDV) the North AtlanticOscillation (NAO) or the Atlantic Multidecadal Vari-ability (AMV) The existence of the internal variabilitycan readily explain not only the redness of typical cli-mate spectra but also some of the peaks superimposedon them The general stochastic climate model concept(HASSELMANN 1976) is a suitable zero-order model ofthese features
Externally driven climate variability can result forinstance from variations in the Earthrsquos orbital param-eters which are the pacemakers of the ice age cycles on
lowastCorresponding author Mojib Latif Ozeanzirkulation und Klimadynamik- Maritime Meteorologie - Leibniz-Institut fur MeereswissenschaftenDuesternbrooker Weg 20 24105 Kiel e-mail mlatififm-geomarde
timescales of many millennia (HAYS et al 1976) Onshorter timescales of decades to a few millennia internalsolar physics causes variations of the solar output Theclimate record of the Holocene can only be understoodwhen taking into account these variations in solar inputto the Earth (CROWLEY 2000 JANSEN et al 2007)BOND et al (2001) describe a solar forcing mechanismwhich may underlie at least the Holocene segment ofthe North Atlanticrsquos quasi-periodic 1500-year cycle Icerecords from Greenland also show fluctuations on a sim-ilar timescale during the last glacial period strong warmphases referred to as ldquoDangaard-Oeschger eventsrdquo oc-curred on average around every 1500 years It is un-clear whether Dansgaard-Oeschger events are externallyor internally driven but the similarity in the periodic-ity to that described by BOND et al (2001) suggestssome external origin This is supported by GANOPOL-SKI and RAHMSTORF (2001) who argue based on sim-ulations with a climate model of intermediate complex-ity that Dansgaard-Oeschger events are triggered by aweak millennial-scale solar forcing which excites an in-ternal millennial mode of the climate system HoweverMUSCHELER and BEER (2006) do not find evidence forthis hypothesis in Greenland isotope records Finallyclimate reconstructions of the last two millennia also
0941-294820090395 $ 495DOI 1011270941-294820090395 ccopy Gebruder Borntraeger Berlin Stuttgart 2009
eschweizerbartxxx ingenta
434 M Latif et al Internal and external North Atlantic Sector variability Meteorol Z 18 2009
Figure 1 From top to bottom Annual mean European SAT (5Wndash10E 35ndash60N) linearly de-trended annual mean European SATlinearly de-trended North Atlantic SST (0ndash60N) summer Sahelrainfall Atlantic hurricane activity (ACE index) and North AtlanticSST repeated from above All time series are deviations from thelong-term mean All temperature time series are in units of [C]The Sahel rainfall and the ACE index were normalized with the long-term standard deviation
suggest a millennial solar forcing The Medieval WarmPeriod around 1000ndash1200 and the Little Ice Age around1500ndash1700 were presumably driven at least partly byvariations in solar radiation (e g CROWLEY 2000)However it is still uncertain how widespread and co-herent these fluctuations were so that we cannot confi-dently attribute them to solar (ie a global) forcing Thelatter attained a maximum during the Middle Ages abroad minimum around the middle of the last millen-nium and high values again during the 20th century An-thropogenic climate change such as global warming asa result of an enhanced greenhouse effect in response toincreased greenhouse gas concentrations is also consid-ered as externally driven
Here we consider both the internal and external vari-ability as simulated in a series of numerical experimentswith the Kiel Climate Model (KCM) Special attention isgiven to the Meridional Overturning Circulation (MOC)
(see eg SCHMITTNER et al 2005 for review) Sincethe observational database is insufficient to describe thelow-frequency MOC variability long control integra-tions of climate models have been used to obtain insightinto the dynamics of MOC variability (eg DELWORTHet al 1993 TIMMERMANN et al 1998 DELWORTHand MANN 2000 LATIF et al 2004 KNIGHT et al2005 and KNIGHT et al 2006) Such models simulateMOC variability on a wide range of timescales frommonthly to centennial LATIF et al (2004) showed arather strong connection between indices of MOC andNorth Atlantic SST in a multicentury control integrationof a climate model This was followed up by LATIF atal (2006) who reconstructed the relative MOC changesduring the 20th century with observed Atlantic sea sur-face temperature (SST) They used the inter-hemisphericSST dipole a pattern with opposite polarities in theNorth and South Atlantic (eg FOLLAND et al 1986)as a fingerprint of MOC change and report strong mul-tidecadal variability with an increase in MOC strengthfrom the 1970s to the 1990s This although supportedby forced ocean model simulations (LATIF et al 2007)can of course be considered only as a very crude esti-mate of the multidecadal MOC variability
The strong multidecadal or even longer-timescalevariability internally or externally driven may maskanthropogenic climate signals which evolve on similartimescales LATIF et al (2006) for instance concludedthat the expected anthropogenic weakening of the MOCmay not be detectable during the next decades due tothe presence of the strong internal multidecadal vari-ability This may not only apply to the MOC itself butalso to other potentially related quantities such as Eu-ropean surface air temperature (SAT) Sahel rainfall orAtlantic hurricane activity (Fig 1) which are also char-acterized by pronounced multidecadal variability (e gZHANG and DELWORTH 2006) and may hinder earlydetection of an anthropogenic signal In this study weinvestigate the results from integrations with KCM in or-der to explore the level of internal Northern HemisphereSAT and MOC variability up to millennial timescalesand to investigate the modelrsquos response to external (so-lar and greenhouse gas) forcing The paper is organizedas follows We describe in section 2 the model and theexperimental setups The internal variability is presentedin section 3 the external variability in section 4 The im-plications for decadal predictability are discussed in sec-tion 5 The paper is concluded with a brief summary anda discussion of the main findings in section 6
2 Model and experiments
The Kiel Climate Model (KCM) described in de-tail by PARK et al (2009) consists of the ECHAM5(ROECKNER et al 2003) atmosphere general circula-tion model and the NEMO (MADEC 2008) ocean-seaice general circulation model coupled with the OASIS3coupler (VALCKE 2006) No form of flux correction oranomaly coupling is used The atmospheric resolution isT31 (375 x 375) horizontally with 19 vertical levels
eschweizerbartxxx ingenta
Meteorol Z 18 2009 M Latif et al Internal and external North Atlantic Sector variability 435
2500 3500 4500 5500 6500TIME (MODEL YEAR)
-08
-06
-04
-02
0
02
04
06
08
TE
MPE
RA
TU
RE
AN
OM
AL
IES
(o C)
(a) Northern Hemisphere Temperature anomalies annual valuesIntegration with the Kiel Climate Model
0001 001 01FREQUENCY (1a)
00001
0001
001
01
1
10
POW
ER
(o C
2 )
reshaped median 90 95
(b) Northern Hemisphere Temperature spectrum annual valuesIntegration with the Kiel Climate Model
Figure 2 a) Timeseries of annual anomalies of the Northern Hemi-sphere SAT [C] simulated in the control run with the Kiel ClimateModel b) Spectrum [C2] of simulated Northern Hemisphere SATanomalies were computed relative to the long-term mean The timeseries was linearly de-trended before calculating the spectrum
The horizontal ocean resolution is based on a 2 Merca-tor mesh and is on average 13 with enhanced merid-ional resolution of 05 in the equatorial region and with31 levels in the vertical
The internal variability is investigated with a multi-millennial control run KCM was integrated for 5000years in total using the same model version describedin PARK et al (2009) but with slightly different parame-ters We consider here only the last 4200 years after skip-ping the initial 800 years to account for model spin upIt should be mentioned that the orbital parameters varyslowly according to the Milankovitch Cycles in the con-trol run as predicted for the next millennia This how-ever should not have a strong influence on the resultsdescribed below PARK and LATIF (2008) described theinternal MOC variability simulated in the control runThe solar constant (1365 Wm2) was varied sinusoidalby plusmn2Wm2 with a period of 1000 years in the secondexperiment This run is referred to as solar forcing ex-periment Four complete cycles were computed In or-
0001 001 01FREQUENCY (1a)
001
01
1
10
100
POW
ER
(Sv2 )
reshaped median 90 95 99
(c) Maximum MOC strength spectrum annual values
MC MD
Figure 3 a) Mean MOC [Sv] averaged over all 4200 years b) timeseries of MOC strength [Sv] defined as the maximum of the streamfunction at 30N based on annual averages (σ=102 Sv) and c)power spectrum of the MOC strength [Sv2] as function of frequency[1a] The multicentennial (MC) and multidecadal bands (MD) aredenoted by horizontal lines
der to study the role of ocean dynamics in the responseto solar forcing an additional experiment was performedin which the dynamical ocean model was replaced by aconstant-depth (50 m) mixed layer ocean model Onlyone complete cycle was computed The investigation ofthe longer run with KCM revealed that the large-scaleresponse patterns do not change much from cycle to cy-cle so that we can assume that just one cycle is sufficient
eschweizerbartxxx ingenta
436 M Latif et al Internal and external North Atlantic Sector variability Meteorol Z 18 2009
Figure 4 MOC (high minus low) composite [Sv] for strong phasesof a) multicentennial and b) multidecadal MOC variability Compos-ites were computed applying a one-standard deviation criterion Alltime series were linearly de-trended prior to the analysis
We investigate the model response under ldquopresent-dayrdquoconditions with a CO2 concentration of 348 ppm thatwas also used in the control run The solar forcing exper-iments should be considered as sensitivity experimentsto better understand the climate response to direct so-lar forcing The CO2 concentration is increased by 1 (compound) in an ensemble of four 100 year long green-house warming experiments in which the concentrationdoubles after about 70 years and is stabilized thereafterfor another 30 years
3 Internal variability
Figure 2 displays the evolution of SAT averaged overthe Northern Hemisphere simulated in the control runtogether with the corresponding spectrum Surprisinglythe level of decadal to centennial variability in NorthernHemisphere surface air temperature (SAT) simulated byKCM is consistent with that obtained from the JONESand MANN (2004) reconstruction (Table 1) Statisticallysignificant peaks above the 90 level (relative to thespectrum of a fitted AR1-process) are found at three pe-riods sim60ndash90 years sim300-400 years and sim800ndash1000years The multidecadal peak however is quite modestAn interesting result of the control run is the strong levelof multicentennial to millennial variability simulated un-der (almost) constant boundary conditions We focus inthe following on the Atlantic MOC The mean MOCas described by the overturning streamfunction is sim-ulated reasonably well (Fig 3a) and consistent with thatsimulated by other climate models We computed first
an index of the MOC strength as the maximum of theoverturning streamfunction at 30N The annual index(Fig 3b) has a mean value of 136 Sv and exhibits richvariability on different timescales MOC strength variesbetween about 11ndash18 Sv and decadal to centennial vari-ability is obvious with strong year-to-year fluctuationssuperimposed The corresponding spectrum (Fig 3c) isred up to millennial timescales At decadal timescales abroad and statistically significant (above the 99 level)peak (relative to the spectrum of a fitted AR1-process)is seen at periods of about 50ndash100 years Thus KCMrsquosmultidecadal AMV-type MOC variability seems to beoscillatory in nature It should be mentioned howeverthat the modelrsquos AMV is centred at periods of about 60ndash80 years and that the related SAT variability at a periodof about 100 years has a different spatial structure indi-cating it is governed by different dynamics
Since we are interested here only in the long-termMOC variability we averaged the annual data to 5-yearmeans in the subsequent analyses In order to separatethe multidecadal from the multicentennial variability weemploy temporal filtering first a low-pass filter retain-ing variability with periods longer than 90 years is ap-plied to investigate multicentennial variability and sec-ond a band-pass filter retaining variability with periodsbetween 30 and 90 years to study multidecadal variabil-ity The two filtered time series (not shown) are equiva-lent to those in PARK and LATIF (2008) except for the200 year longer time period analyzed here The corre-sponding standard deviations are 1) annual MOC in-dex = 102 Sv 2) band-pass filtered (multidecadal) in-dex = 046 Sv and 3) low-pass filtered (multicenten-nial) index = 045 Sv Composites for the overturningstreamfunction were computed using the two filteredtime series applying a one standard deviation thresholdThe high minus low composite for the multicentennialvariability (Fig 4a) yields an intensified North AtlanticDeep Water (NADW) cell that extends to deeper lev-els The strongest change is simulated at 30S suggest-ing that the multicentennial MOC variability is driven inthe Southern Hemisphere The composite for the multi-decadal variability shows a similar strengthening of theNADW cell (Fig 4b) The maximum change howeveris simulated near 40N suggesting a northern control ofthe multidecadal variability as in many other models
The SAT pattern associated with the multicentennialand multidecadal variability was computed by linearregression upon the corresponding filtered MOC timeseries Again 5-year means were used The SAT re-gression patterns (Figs 5a b) support the picture thatthe multicentennial variability is driven in the SouthernHemisphere while multidecadal variability originates inthe Northern Hemisphere The multicentennial SAT pat-tern (Fig 5a) has strongest loadings in the South At-lantic with maximum changes of 2CSv Explainedvariances relative to the 5-year means are typically inthe range of 10ndash20 in this region The North Atlanticis mostly covered by weaker positive anomalies extend-ing to about 60N (please note the non-linear scale) Ex-plained variances in the North Atlantic however aregenerally low with the exception of the region 40ndash50N The SAT pattern associated with the multidecadal
eschweizerbartxxx ingenta
Meteorol Z 18 2009 M Latif et al Internal and external North Atlantic Sector variability 437
Figure 5 Maps of linear regression coefficients for SAT [KSv] upon a) the low-pass filtered MOC strength highlighting the multicentennialvariability and b) the band-pass filtered MOC strength highlighting the multidecadal variability Shading denotes the regression valuescontours explained variances (contour interval amounts to 01) All time series were linearly de-trended prior to the analysis
Table 1 Standard deviations computed for 10-year and 100-year means of the Northern Hemisphere surface air tempera-ture (NH-SAT) and Meridional Overturning Circulation (MOC) for control and solar forcing experiments Reconstructed NH-SAT data for the period 200ndash1899 were taken from JONES and MANN (2004) The latter dataset was obtained fromhttpwwwncdcnoaagovpaleopubsjones2004jones2004html
Standard deviation
NH-SAT MOC
JONES and
MANNctrl solar ctrl solar
10yr means 0089 0111 0233 066 086
100yr means 0068 0061 0212 034 051
variability is clearly dominated by SAT anomalies in theNorth Atlantic (Fig 5b) In comparison with the mul-ticentennial pattern the North Atlantic anomalies aremuch stronger relative to those in the South Atlantic andthey extend farther north into the Arctic Explained vari-ances are rather small and generally well below 10 except in a region extending from the Iberian Penin-sula into the Tropics We also investigated the impact ofMOC variability on sea ice (not shown) The multicen-tennial MOC variability is connected to strong changesin Southern Hemisphere sea ice extent During phasesof strong multicentennial events maximum sea ice ex-tent changes from about 15 to almost 20middot106 km2 achange of 25 Such a strong internal fluctuation ismuch larger than the observed increase in Antarctic seaice extent since the late 1970s of about 01-02middot106 km2The Northern Hemisphere sea ice extent does not dis-play any strong centennial-timescale variability In con-trast sea ice fraction anomalies associated with the mul-tidecadal MOC variability yield coherent changes in theNorthern Hemisphere of up to 20 Sv but are not co-herent in the Southern Hemisphere In summary pro-nounced internal multidecadal and multicentennial SATand MOC variability is simulated by KCM in the controlrun Furthermore a clear timescale separation exists inthe spatial structures associated with multidecadal andmulticentennial MOC variability KCM even simulatesstrong internal variability at millennial timescales How-
ever the control is too short to investigate the millennialvariability in a meaningful manner
4 External variability
Northern Hemisphere SAT variability is much strongerin the solar forcing experiment than in the control run(Table 1 Figure 6) and clearly varies approximately inphase with the solar forcing as indicated by the corre-sponding cross correlations amounting to more than 08for both decadal and centennial means (Table 2) Thedecadal standard deviation in the solar forcing experi-ment is twice as large as that simulated in the controlrun and the centennial standard deviation is three timesas large Consequently the variability in the former isalso much stronger than that obtained from the JONESand MANN (2004) reconstruction (Table 1) JANSEN etal (2007) however report a rather large spread betweenthe different Northern Hemisphere SAT reconstructionsThe decadal to centennial variability in the solar forcingexperiment ranges at the upper limit of the reconstruc-tions given in JANSEN et al (2007) European (10Wndash30E 40ndash60N) and Arctic (60ndash90N) SAT (Figs 6cd) also exhibit a clear forced response that can be readilydetected without further statistical analyses The Arc-tic response is clearly stronger than the European onewhich suggests that different feedbacks operate in thetwo regions
eschweizerbartxxx ingenta
438 M Latif et al Internal and external North Atlantic Sector variability Meteorol Z 18 2009
Figure 6 a) Northern Hemisphere SAT anomalies reconstruction from JONES and MANN (2004) b) Northern Hemisphere SAT anomaliessimulated in the solar forcing experiment and the control integration c) European SAT (10Wndash30E 40ndash60N) from the two experimentsand d) Arctic SAT anomalies (60ndash90N) Blue (red) lines indicate the control (solar forcing) experiment A 21-year running mean filterwas applied to the model time series Units are C All time series were linearly de-trended The green curves show the phase of the solarforcing
Table 2 Cross correlations between 10-year and 100-year means of selected time series computed from the control and solar forcingexperiments
Correlation
10yr means 100yr means
ctrl solar ctrl solar
MOC ndash NH-SAT 011 -027 010 -058
Solar constant - MOC - -041 - -067
Solar constant ndash NH-SAT - 082 - 089
eschweizerbartxxx ingenta
Meteorol Z 18 2009 M Latif et al Internal and external North Atlantic Sector variability 439
0001 001 01FREQUENCY (1a)
001
01
1
10
PO
WE
R (
Sv
2)
reshaped median 90 95
(c) MOC spectrum 10yr mean values ctrl
0001 001 01FREQUENCY (1a)
001
01
1
10P
OW
ER
(S
v2)
reshaped median 90 95
(d) MOC spectrum 10yr mean values solf
Figure 7 Timeseries of 10-year (thin lines) and 100-year (thick lines) means of MOC strength [Sv] at 30N (as defined as the maximumof the overturning streamfunction) simulated in the a) control integration and b) solar forcing experiment The green line in b) shows theevolution of the solar constant to ease comparison Power spectra [Sv2] based on 10-year mean MOC time series from the c) control and d)solar forcing experiments
The MOC strongly responds to the solar forcing inKCM (Fig 7) An MOC response was also found byCUBASCH and VOSS (2000) in one of their climatemodel experiments with different solar forcing recon-structions for the last centuries The lag between the so-lar forcing and the MOC is small and of the order ofa decade The MOC variability (Figs 7a b) is stronglyconstrained by the forcing frequency as seen in the cor-responding spectra (Figs 7c d) The decadal standarddeviation increases by about 20 compared to that sim-ulated in the control run (Fig 7a) and the centennialstandard deviation by about 50 The forced MOC re-sponse has a strong impact on SAT A high-MOC minuslow-MOC SAT composite was computed using 100-yearperiods centred on the four maxima and minima in thesolar forcing and introducing a lag of 50 years to ac-count for the inertia (Fig 8a) As expected most regionsexhibit warming In the North Atlantic however the re-sponse consists of cooling Cross correlations betweenthe solar forcing and the MOC changes amount to ndash041
and ndash067 for decadal and centennial means respec-tively Cross correlations were also computed betweenthe changes in MOC and Northern Hemisphere SAT (Ta-ble 2) In the control run the correlations are positive butweak on both decadal and centennial timescales Thesign of the correlation changes in the solar forcing ex-periment indicating the MOC acts as a strong negativefeedback not only locally in the North Atlantic but alsofor Northern Hemisphere SAT In the North Atlanticthe MOC response even overrides the effect of the di-rect forcing in this region LUTERBACHER et al (2004)for instance show indeed strongest changes over East-ern Europe and little or no cooling in Western Europein their reconstructions of European temperatures dur-ing the Little Ice Age This finding is consistent with thenegative MOC feedback described here but other pro-cesses such as a persistent change in the atmosphericcirculation have also to be considered in this context
In order to separate more clearly the influence of theocean dynamics specifically that of the MOC from at-
eschweizerbartxxx ingenta
440 M Latif et al Internal and external North Atlantic Sector variability Meteorol Z 18 2009
Figure 8 Composite (high minus low) of a) SAT [C] and (b)SLP [hPa] from the solar forcing experiment The composites werecomputed using 100-year periods centred on the four maxima andminima in the solar forcing and introducing a lag of 50 years toaccount for the inertia
mospheric mechanisms a second forced integration wasperformed in which the dynamical ocean model wasreplaced by a fixed-depth (50 m) mixed layer modelthat by definition does not carry varying ocean dynam-ics The response of NH-SAT is about 40 strongerin the mixed layer run in comparison to that simulatedby KCM We display the difference of centennial meansaround year 250 (solar maximum) and year 750 (solarminimum) from the mixed layer run Again a lag (20years) was introduced to account for the inertia TheSAT response pattern (Fig 9a) in the run without vary-ing ocean dynamics is much more flat than that in the runwith varying ocean dynamics In particular no coolingis simulated over the North Atlantic which sharpens thepoint made above about the prominent role of the MOCin shaping the SAT response to solar forcing A weak lo-cal minimum in the North Atlantic is simulated whichis due to the stronger westerly winds in that region in re-sponse to anomalously low pressure in the high latitudesand anomalously high pressure further to the south (Fig9b) The strong cooling in the North Atlantic simulatedin the solar experiment with KCM (Fig 8a) can thus notbe explained by a changed atmospheric circulation and
Figure 9 Composite (high minus low) of a) SAT [C] and (b)SLP [hPa] from the solar forcing experiment when the dynamicalocean model is replaced by a fixed-depth (50 m) mixed layer modelwithout varying ocean dynamics The composites were computedusing 100-year periods centred on the maximum and minimum inthe solar forcing and introducing a lag of 20 years Only one cyclewas computed
the associated enhanced heat loss from the ocean to theatmosphere
The high-low SAT composite in KCM shows strongestchanges in the North Atlantic portion of the Arcticspecifically in the Barents Sea (Fig 8a) although aweakened MOC would imply the opposite Both ob-servations and modeling studies indicate the existenceof a positive dynamical feedback between sea ice theatmospheric and the oceanic circulation in this re-gion (IKEDA 1990 ADLANDSVIK and LOENG 1991MYSAK and VENEGAS 1998 BENGTSSON et al2004) Consider a situation in which the sea ice retreatsinitially in response to an enhanced solar forcing Thisleads to the generation of anomalous cyclonic circula-tion in the lower atmosphere and thus to strengthenedwesterly winds over the western opening of the Bar-ents Sea thereby increasing both the oceanic and atmo-spheric heat transport into the region which reinforcesthe initial change The mechanism for the amplificationof the response in the Barents Sea will be described inmore detail and in the context of rapid climate transi-tions in a forthcoming paper (SEMENOV et al in press)
eschweizerbartxxx ingenta
Meteorol Z 18 2009 M Latif et al Internal and external North Atlantic Sector variability 441
Figure 10 a) SAT [C] and b) SLP [hPa] response in the ensembleof double CO2 (1 yr) experiments See text for details Shown arethe differences between the means of the last and first 30 years Theresults were averaged over all 4 realisations
It has been suggested (SHINDELL et al 2001LUTERBACHER et al 2004) that the NAO is a mainagent in shaping the response to solar forcing Wefind only a small NAO-forced response in our experi-ment with periodically varying solar forcing (Fig 8b)For instance no statistically significant changes in theNAO-spectrum were found at the forcing frequency (notshown) It should be mentioned however that the SLPresponse pattern projects onto that of the Arctic Oscil-lation (AO) KCM simulates a strong sea level pressure(SLP) anomaly out-of-phase with the solar forcing overthe Atlantic portion of the Arctic and over Scandinaviawith strongest changes of up to 1 hPa over the BarentsSea (Fig 8b) and considerably weaker in-phase changesfurther to the south As described above this type of sealevel pressure response tends to amplify the solar-forcedtemperature change in this sector specifically over theBarents Sea most of Scandinavia and Eastern Europe
Additional experiments in which the CO2 concentra-tion was increased by 1 year yield very similar spa-tial response patterns in SAT and SLP over the NorthernHemisphere (Fig 10) We note however that the forc-ing amplitude in the solar experiment is much strongerthan the changes observed during the 20th century (egHEGERL et al 2007) Inferences about the role of so-
lar forcing for the 20th century warming can thus not bedrawn from the sensitivity experiment presented here
5 Decadal predictability
The results of the model simulations are of interest todecadal predictability In principle both the internal andexternal variability can give rise to predictability Twotypes of predictability are generally discussed the pre-dictability of the first and that of the second kind Theformer results from changes in the initial conditions thelatter from changes in the boundary conditions Herewe discuss the potential decadal predictability (BOER2004) ie the question of whether the decadal variabil-ity is strong enough to be clearly distinguished from thebackground climate noise We investigated the potentialpredictability only in the control run The ratio of theSAT variance in the band 10ndash100 years relative to thetotal SAT variance was computed using annual meanvalues (Fig 11a) The North Atlantic-Arctic Sector isclearly a region of high potential decadal predictabil-ity Other regions of high potential decadal predictabil-ity are the North Pacific and the South Atlantic Inter-estingly the decadal predictability potential is concen-trated in the mid- and high latitudes while the interan-nual predictability potential is concentrated in the Trop-ics specifically in the Equatorial Pacific (not shown)
Like in the North Atlantic the relatively high poten-tial decadal predictability in the South Atlantic orig-inates partly from the basin-wide decadal-scale MOCvariability The relationship between the decadal-scaleMOC and North Atlantic SST variability is shown bymeans of a lag-correlation analysis (Fig 11b) The MOCstrength as defined as the maximum of the overturn-ing streamfunction at 30N was lag-correlated with theNorth Atlantic SST averaged over the latitude belt 40ndash60N a region that is strongly influenced by the MOC(LATIF et al 2004) The correlation is highly signifi-cant (above the 95 level) and the MOC strength leadsthe North Atlantic SST by several years indicating theMOC drives the SST changes
6 Discussion
A series of extended-range integrations were performedwith the Kiel Climate Model (KCM) in order to studyinternal and external climate variability in the North At-lantic Sector KCM simulates pronounced internal vari-ability up to millennial timescales in the Northern Hemi-sphere surface air temperature (SAT) and the Merid-ional Overturning Circulation (MOC) in a multimil-lenial control integration Multicentennial MOC vari-ability is controlled by Southern Hemisphere and mul-tidecadal variability by Northern Hemisphere processesThe centennial-scale variability shares many commonaspects with that found in previous ocean model stud-ies (eg MIKOLAJEWICZ and MEIER-REIMER 1990PIERCE et al 1995 DRIJFHOUT et al 1996 OSBORN1997) while the decadal-scale variability is consistentwith that simulated in other coupled models (eg DEL-WORTH and MANN 2000 KNIGHT et al 2005 and
eschweizerbartxxx ingenta
442 M Latif et al Internal and external North Atlantic Sector variability Meteorol Z 18 2009
Figure 11 a) Potential predictability as defined by the ratio of SATvariance in the band 10ndash100 years relative to the total variancecomputed from the control run b) Lag-correlation between an indexof MOC strength and a North Atlantic SST index Annual data wereused in both panels Prior to the computation of the lag-correlationan 11-year running mean filter was applied
2006) The millennial variability was not studied in de-tail given the relatively short integration time We havealso investigated the climate response to periodic millen-nial solar forcing The simulated decadal to centennialNorthern Hemisphere SAT variability in the run withtime-varying solar forcing and the control run are bothconsistent with paleoclimatic reconstructions of the lasttwo millennia given the large uncertainty in these Thevariability in the solar forcing experiment however isat the high end of the reconstructions The changes inthe MOC provide a strong negative feedback on North-ern Hemisphere surface air temperature overriding thedirect effects of the local solar forcing over the North At-lantic Solar brightening was observed during the early20th century At that time the North Atlantic warmedrapidly rather than cooled This could suggest that inter-nal processes may have played a more important role indriving the warming than the anomalous solar forcing
The presence of natural climate variability internallyor externally driven makes the early detection of an an-thropogenic climate signal a challenge The results pre-sented here are important with respect to the detectionof anthropogenic climate change in different ways First
the presence of the strong internal variability may hin-der early detection of anthropogenic climate change asthe variability patterns are not orthogonal to the climatechanges patterns SAT variability associated with theAtlantic Multidecadal Variability (AMV) for instancedoes project onto the globally averaged SAT Secondthe surface response patterns associated with millennialsolar forcing a potentially important external naturaldriver of climate and greenhouse gas forcing are alsosimilar Third the observed Northern Hemisphere SATexhibited rather strong multidecadal variability duringthe 20th century In the Arctic for instance the rateat which warming evolved during 1920ndash1940 was asstrong as the warming rate observed during the mostrecent decades an observation also seen in North At-lantic SST and European SAT (Fig 1) Thus the re-cent strong climate changes in the Arctic including thestrong sea ice retreat may be caused by a superpositionof anthropogenic and natural (internal) factors Finallyfourth the AMV is oscillatory in nature in KCM andother climate models and probably also in the real world(Fig 1) which is supported by Northern HemisphereSAT reconstructions of the last millennium This pro-vides a decadal predictability potential Climate modelprojections for the next few decades could thus benefitfrom the initialization with present climate conditionsSMITH et al (2007) and KEENLYSIDE et al (2008)for instance show encouraging results with regard todecadal forecasting
Acknowledgments
We would like to thank D DOMMENGET and VSEMENOV for many fruitful discussions This workwas supported by the Sonderforschungsbereich 754(wwwsfb754de) of the German Research Foundation(DFG) the ldquoNordatlantikrdquo project of BMBF and theEU-projects Ensembles and Dynamite The model in-tegrations were performed at the Computing Centre atKiel University and the DKRZ Hamburg This paperis a contribution to the Excellence Cluster ldquoThe FutureOceanrdquo
ReferencesADLANDSVIK B H LOENG 1991 A study of a climatic
system in the Barents Sea ndash Polar Res 10 45ndash49BENGTSSON L V A SEMENOV O M JOHANNESSEN
2004 The early twentieth-century warming in the Arctic ndashA possible mechanism ndash J Climate 17 4045ndash4057
BOER G 2004 Long-timescale potential predictability inan ensemble of coupled climate models ndash Climate Dynam23 29ndash44
BOND G B KROMER J BEER R MUSCHELER MNEVANS W SHOWERS S HOFFMANN R LOTTI-BONDIRKA H G BONANI 2001 Persistent Solar Influence onNorth Atlantic Climate ndash Science 294 2130ndash2136 DOI101126science1065680
CROWLEY TJ 2000 Causes of climate change over thepast 1000 years ndash Science 289 270ndash277
CUBASCH U R VOSS 2000 The influence of total solarirradiance on climate ndash Space Science Reviews 94 185ndash198
eschweizerbartxxx ingenta
Meteorol Z 18 2009 M Latif et al Internal and external North Atlantic Sector variability 443
DELWORTH TL ME MANN 2000 Observed simulatedmultidecadal variability in the Northern Hemisphere ndashClimate Dynam 16 661ndash676
DELWORTH T S MANABE RJ STOUFFER 1993 Inter-decadal variations of the thermohaline circulation in a cou-pled ocean-atmosphere model J Climate 6 1993ndash2011
DRIJFHOUT S C HEINZE M LATIF E MAIER-REIMER 1996 Mean circulation internal variability in anocean primitive equation model ndash J Phys Oceanogr 26559ndash580
FOLLAND CK TN PALMER DE PARKER 1986 Sahelrainfall worldwide sea temperatures 1901ndash85 ndash Nature320 602ndash607 DOI101038320602a0
GANOPOLSKI AS RAHMSTORF 2001 Rapid changes ofglacial climate simulated in a coupled climate model ndashNature 409 153ndash158 DOI10103835051500
HASSELMANN K 1976 Stochastic climate models Part Itheory ndash Tellus 28 473ndash485
HAYS D J IMBRIE NJ SHACKLETON 1976 Variationsin the Earthrsquos Orbit Pacemaker of the Ice Ages ndash Science194 1121ndash1132
HEGERL G et al 2007 Understanding Attributing ClimateChange ndash In Climate Change 2007 The Physical ScienceBasis Contribution of Working Group I to the Fourth As-sessment Report of the Intergovernmental Panel on ClimateChange ndash Cambridge University Press Cambridge UnitedKingdom New York NY USA
IKEDA M 1990 Decadal oscillations of the air-ice-oceansystem in the Northern Hemisphere ndash Atmosphere-Ocean28 106ndash139
JANSEN E et al 2007 Palaeoclimate ndash In Climate Change2007 The Physical Science Basis Contribution of Work-ing Group I to the Fourth Assessment Report of the Inter-governmental Panel on Climate Change ndash Cambridge Uni-versity Press Cambridge United Kingdom New York NYUSA
JONES PD ME MANN 2004 Climate overpast millennia ndash Rev Geophys 42 RG2002DOI1010292003RG000143
KEENLYSIDE K M LATIF J JUNGCLAUS L KORN-BLUEH E ROECKNER 2008 Advancing decadal-scaleclimate prediction in the North Atlantic sector ndash Nature453 84ndash88 DOI101038nature06921
KNIGHT JR RJ ALLAN CK FOLLAND M VEL-LINGA ME MANN 2005 A signature of persis-tent natural thermohaline circulation cycles in ob-served climate ndash Geophys Res Lett 32 L20708Doi1010292005GL024233
KNIGHT JR CK FOLLAND AA SCAIFE 2006Climate impacts of the Atlantic MultidecadalOscillation ndash Geophys Res Lett 33 L17706DOI1010292006GL026242
LATIF M E ROECKNER M BOTZET M ESCH HHAAK S HAGEMANN J JUNGCLAUS S LEGUTKE SMARSLAND U MIKOLAJEWICZ 2004 Reconstructingmonitoring predicting multidecadal-scale changes in theNorth Atlantic thermohaline circulation with sea surfacetemperature ndash J Climate 17 1605ndash1614
LATIF M C BONING J WILLEBRAND A BIASTOCHJ DENGG N KEENLYSIDE G MADEC U SCHWECK-ENDIEK 2006 Is the Thermohaline Circulation Changingndash J Climate 19 4631ndash4637
LATIF M CW BONING J WILLEBRAND A BIAS-TOCH F ALVAREZ N KEENLYSIDE H POHLMANN2007 Decadal to Multidecadal Variability of the AtlanticMOC Mechanisms Predictability ndash In Ocean CirculationMechanisms Impacts ndash Past Future Changes of Meridional
Overturning A SCHMITTNER JCH CHIANG SRHEMMING (Eds) AGU Monograph 173 149ndash166
LUTERBACHER J D DIETRICH E XOPLAKI M GROS-JEAN H WANNER 2004 European Seasonal AnnualTemperature Variability Trends Extremes Since 1500 ndashScience 303 1499ndash1503 DOI 101126science1093877
MADEC G 2008 NEMO reference manual ocean dynam-ics component NEMO-OPA Preliminary version ndash Notedu Pole de modelisation Institut Pierre-Simon LaplaceIPSL France No 27 1288ndash1619
MIKOLAJEWICZ U E MAIER-REIMER 1990 Internal sec-ular variability in an ocean general circulation model ndash Cli-mate Dynam 4 145ndash156
MUSCHELER R J BEER 2006 Solar forced Dans-gaardOeschger events ndash Geophys Res Lett 33 L20706DOI1010292006GL026779
MYSAK LA SA VENEGAS 1998 Decadal climateoscillations in the Arctic A new feedback loop foratmosphere-ice-ocean interactions ndash Geophys Res Lett25 3607ndash3610
OSBORN TJ 1997 Thermohaline oscillation in the LSGOGCM Propagating anomalies sensitivity to parameteri-zations ndash J Phys Oceanogr 27 2233ndash2255
PARK W M LATIF 2008 Multidecadal Multicen-tennial Variability of the Meridional OverturningCirculation ndash Geophys Res Lett 35 L22703DOI1010292008GL035779
PARK W N KEENLYSIDE M LATIF A STROEH RREDLER E ROECKNER G MADEC 2009 Tropical Pa-cific Climate its Response to Global Warming in the KielClimate Model ndash J Climate 22 71ndash92
PIERCE D W T P BARNETT U MIKOLAJEWICZ 1995Competing roles of heat freshwater flux in forcing thermo-haline oscillations ndash J Phys Oceanogr 25 2046ndash2064
ROECKNER E G BAUML L BONAVENTURA RBROKOPF M ESCH M GIORGETTA S HAGEMANN IKIRCHNER L KORNBLUEH E MANZINI A RHODINU SCHLESE U SCHULZWEIDAA TOMPKINS 2003The atmospheric general circulation model ECHAM5 PartI Model description ndash Max Planck Institute for Meteorol-ogy Rep 349 127 pp
SCHMITTNER A M LATIF B SCHNEIDER 2005 Modelprojections of the North Atlantic thermohaline circulationfor the 21st century assessed by observations ndash GeophysRes Lett 32 L23710 DOI1010292005GL024368
SEMENOV VA W PARK M LATIF in pressBarents Sea inflow shutdown A new mechanismfor rapid climate changes ndash Geophys Res LettDOI1010292009GL038911
SHINDELL DT GA SCHMIDT ME MANN D RINDA WAPLE 2001 Solar forcing of regional climate changeduring the Maunder Minimum ndash Science 294 2149-2152DOI101126science1064363
SMITH DM S CUSACK AW COLMAN CK FOL-LAND GR HARRIS JM MURPHY 2007 Improvedsurface temperature prediction for the coming decade froma global climate model ndash Science 317 796ndash799
TIMMERMANN A M LATIF R VOSS A GROTZNER1998 Northern hemispheric interdecadal variability Acoupled air-sea mode ndash J Climate 11 1906ndash1931
VALCKE S 2006 OASIS3 user guide ndash PRISMtechnical report No 3 64 pp available onhttpwwwprismenesorg
ZHANG R TL DELWORTH 2006 Impact of Atlanticmultidecadal oscillations on IndiaSahel rainfall At-lantic hurricanes ndash Geophys Res Lett 33 L17712DOI1010292006GL026267
eschweizerbartxxx ingenta
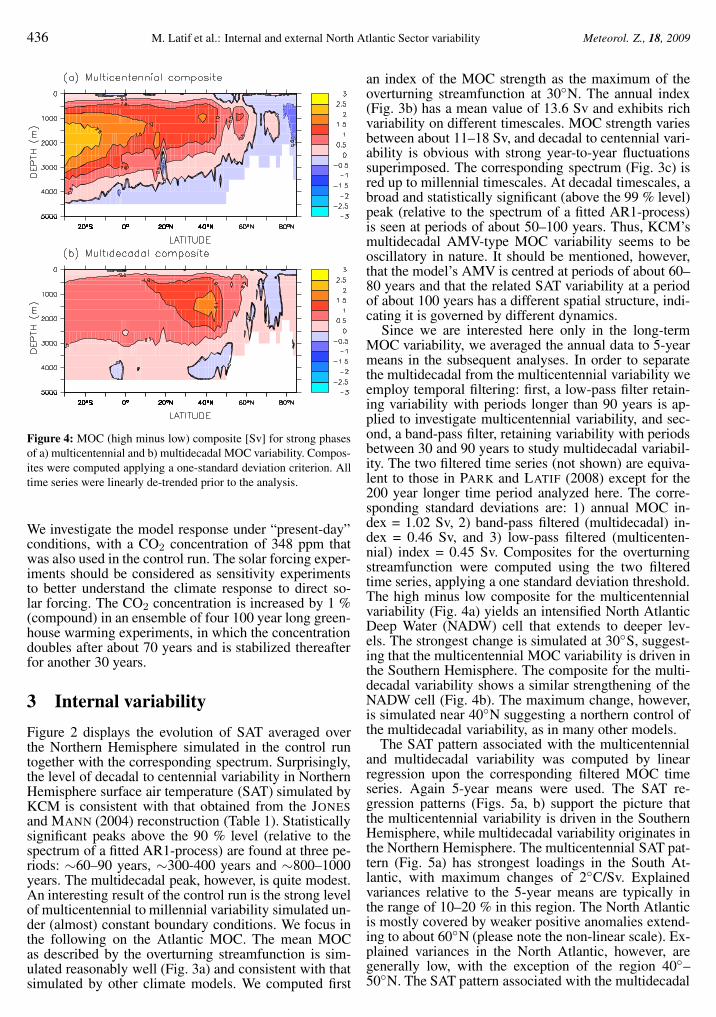