Embed Size (px)
Citation preview
International Journal of Engineering and Advanced Research Technology (IJEART)
ISSN: 2454-9290, Volume-2, Issue-5, May 2016
7 www.ijeart.com
Abstract—The internal flow field of a square container and a
circular container was simulated by finite element software. The
mixing result of fluid in the container and the influence on
growth of the flocs during coagulation mixing were analyzed
from the following four aspects: average turbulent dissipation
rate, average speed, average turbulent kinetic energy and the
scale of micro vortex. The result shows that the distribution of
velocity field, turbulent kinetic energy field and turbulent
dissipation energy field is more balanced in square container
and leads to the formation of more λ scale of micro vortex. The
hydrodynamic conditions are more favorable for the growth of
the flocs.
Index Terms—coagulation mixing; flocculation; scale of
micro vortex; numerical simulation
I. INTRODUCTION
In the process of water treatment, the growth of the flocs will
affect the efficiency of water treatment directly [1]. There are
many factors such as the shape of the container, mixing time,
mixing speed, the size and shape of the mixing paddle that
affect the growth of the flocs [2, 3]. In this paper, the
three-dimensional flow field in the container was calculated
and simulated by FLUENT software. The effect of circular
and square container on the growth of the flocs was studied
while the mixing speed, mixing time, and mixing paddle
shape remain unchanged. The calculated turbulent dissipation
rate and scale of micro vortex were used as the evaluation
index of the flocculation effect [4] and provide some
theoretical guidance for the practical engineering
II. NUMERICAL SIMULATION RESEARCH OF MIXING
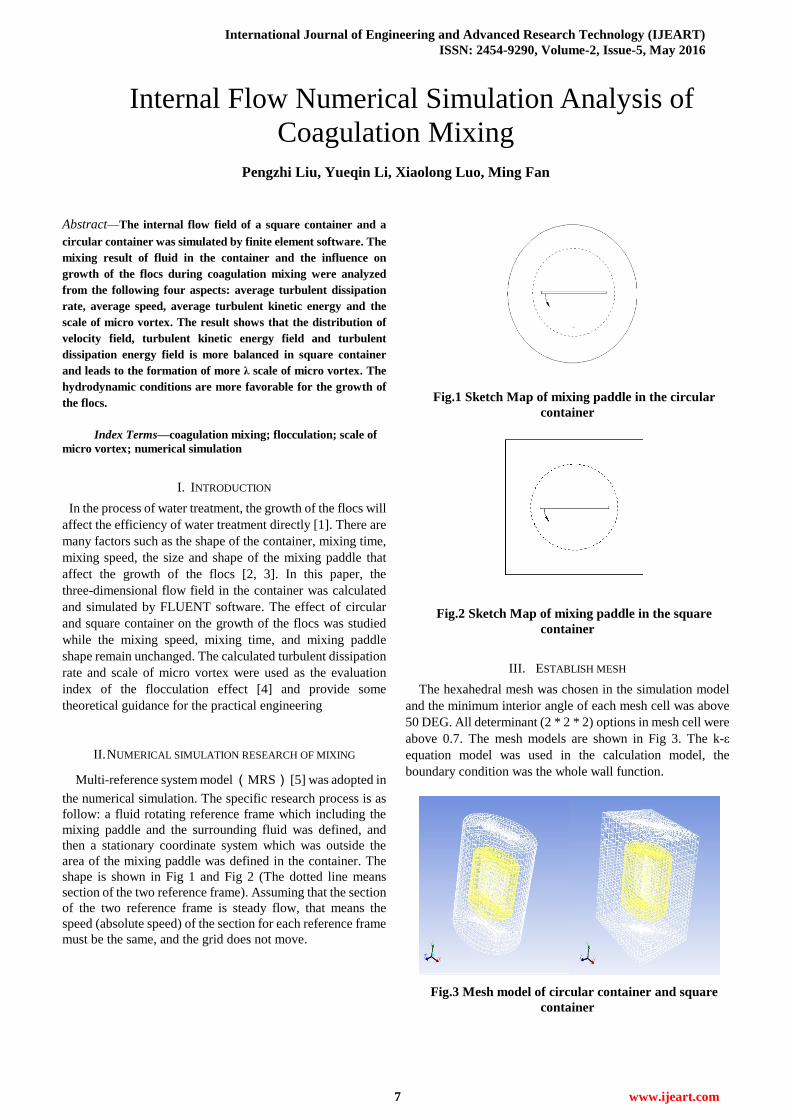
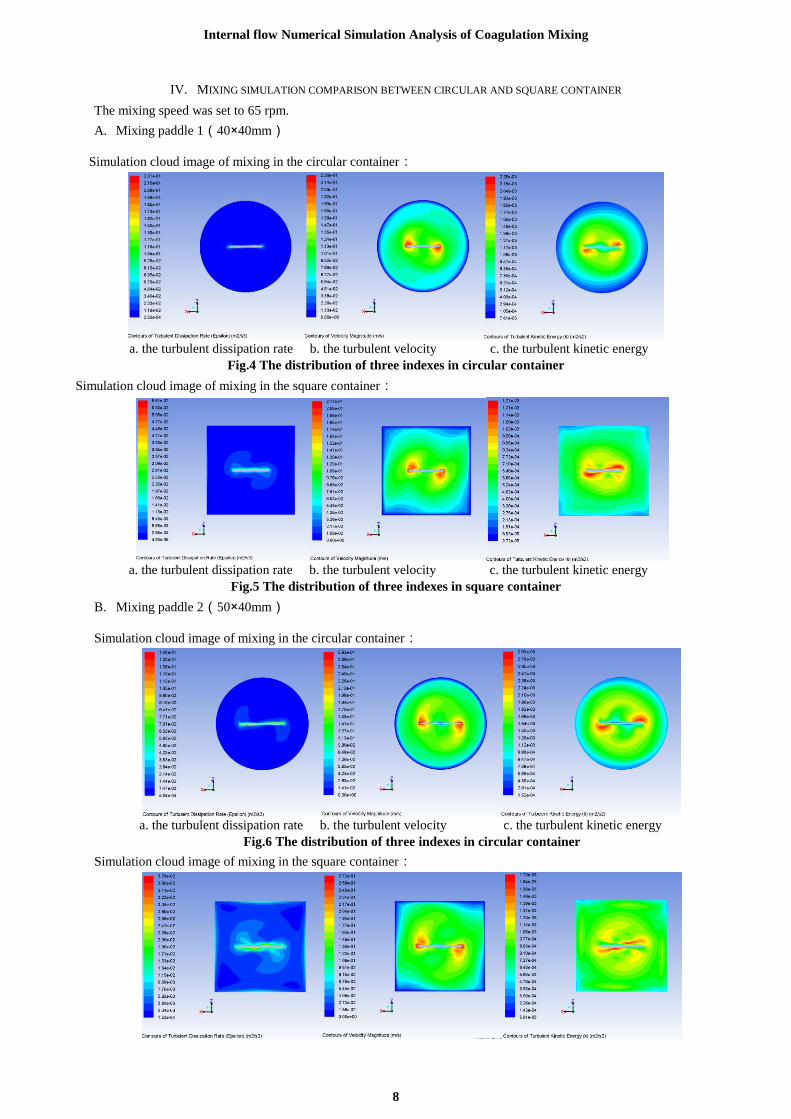
Multi-reference system model (MRS) [5] was adopted in
the numerical simulation. The specific research process is as
follow: a fluid rotating reference frame which including the
mixing paddle and the surrounding fluid was defined, and
then a stationary coordinate system which was outside the
area of the mixing paddle was defined in the container. The
shape is shown in Fig 1 and Fig 2 (The dotted line means
section of the two reference frame). Assuming that the section
of the two reference frame is steady flow, that means the
speed (absolute speed) of the section for each reference frame
must be the same, and the grid does not move.
Fig.1 Sketch Map of mixing paddle in the circular
container
Fig.2 Sketch Map of mixing paddle in the square
container
III. ESTABLISH MESH
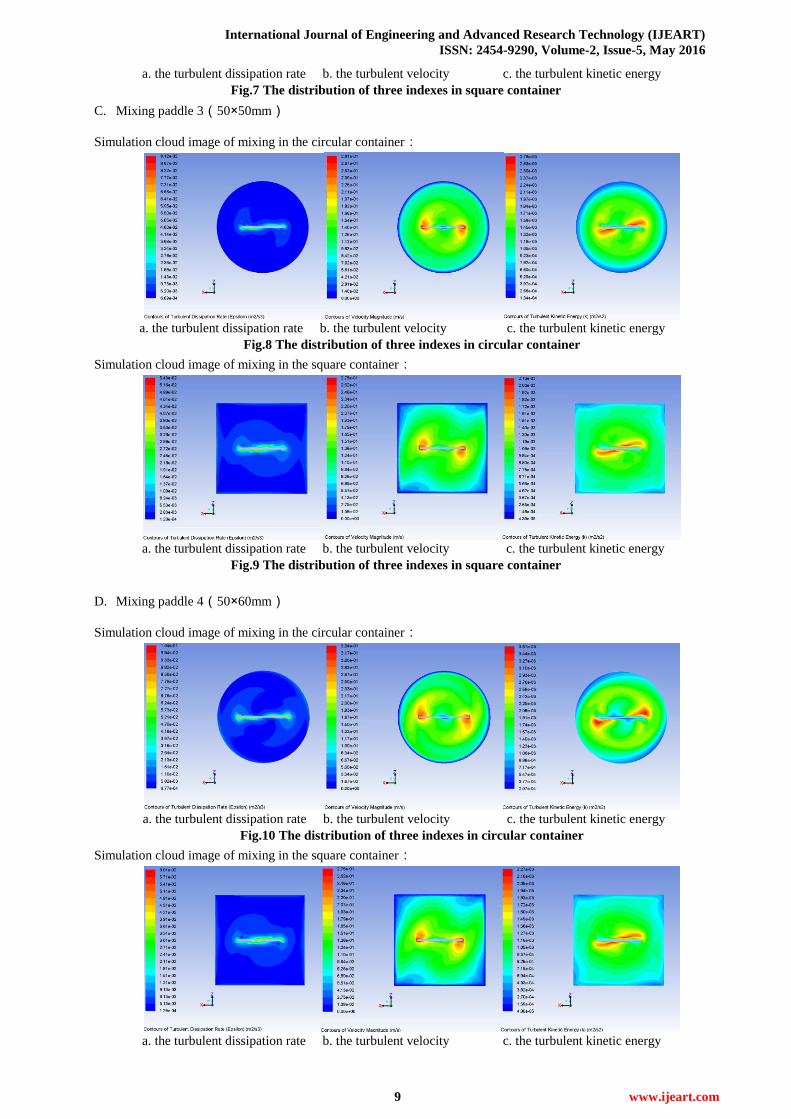
The hexahedral mesh was chosen in the simulation model
and the minimum interior angle of each mesh cell was above
50 DEG. All determinant (2 * 2 * 2) options in mesh cell were
above 0.7. The mesh models are shown in Fig 3. The k-ε
equation model was used in the calculation model, the
boundary condition was the whole wall function.
Fig.3 Mesh model of circular container and square
container
Internal Flow Numerical Simulation Analysis of
Coagulation Mixing
Pengzhi Liu, Yueqin Li, Xiaolong Luo, Ming Fan
Internal flow Numerical Simulation Analysis of Coagulation Mixing
8
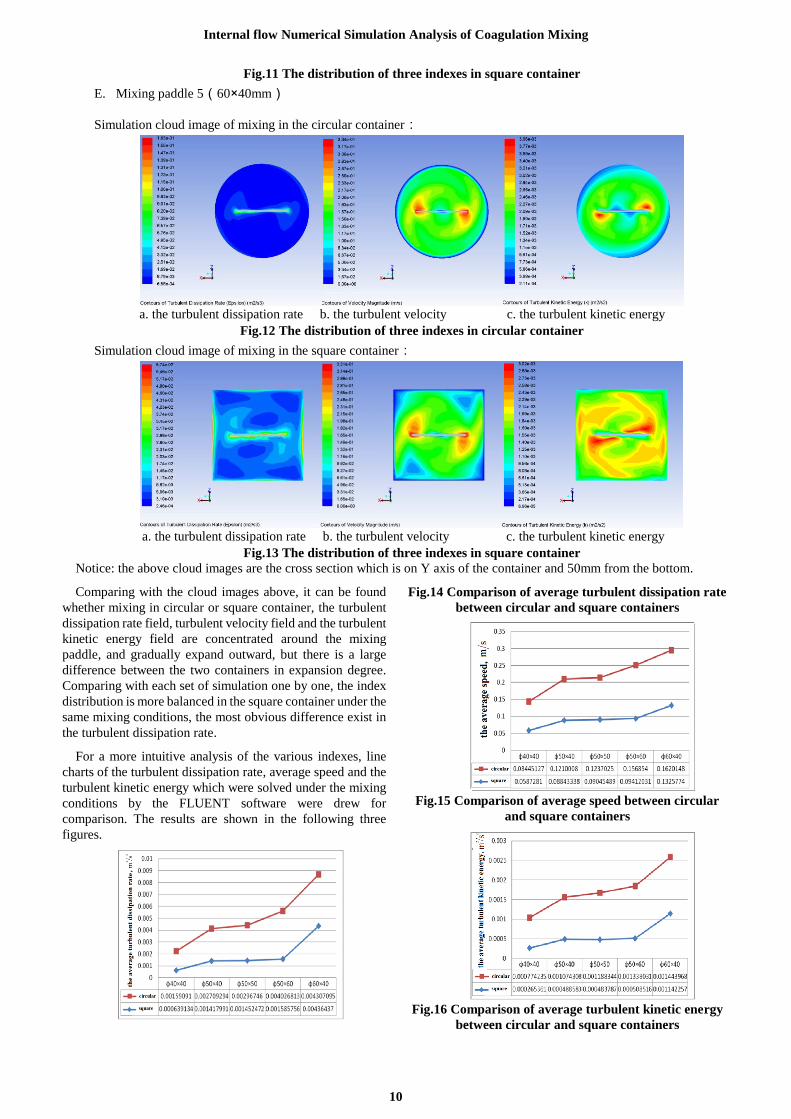
IV. MIXING SIMULATION COMPARISON BETWEEN CIRCULAR AND SQUARE CONTAINER
The mixing speed was set to 65 rpm.
A. Mixing paddle 1(40×40mm)
Simulation cloud image of mixing in the circular container:
a. the turbulent dissipation rate b. the turbulent velocity c. the turbulent kinetic energy
Fig.4 The distribution of three indexes in circular container
Simulation cloud image of mixing in the square container:
a. the turbulent dissipation rate b. the turbulent velocity c. the turbulent kinetic energy
Fig.5 The distribution of three indexes in square container
B. Mixing paddle 2(50×40mm)
Simulation cloud image of mixing in the circular container:
a. the turbulent dissipation rate b. the turbulent velocity c. the turbulent kinetic energy
Fig.6 The distribution of three indexes in circular container
Simulation cloud image of mixing in the square container:
International Journal of Engineering and Advanced Research Technology (IJEART)
ISSN: 2454-9290, Volume-2, Issue-5, May 2016
9 www.ijeart.com
a. the turbulent dissipation rate b. the turbulent velocity c. the turbulent kinetic energy
Fig.7 The distribution of three indexes in square container
C. Mixing paddle 3(50×50mm)
Simulation cloud image of mixing in the circular container:
a. the turbulent dissipation rate b. the turbulent velocity c. the turbulent kinetic energy
Fig.8 The distribution of three indexes in circular container
Simulation cloud image of mixing in the square container:
a. the turbulent dissipation rate b. the turbulent velocity c. the turbulent kinetic energy
Fig.9 The distribution of three indexes in square container
D. Mixing paddle 4(50×60mm)
Simulation cloud image of mixing in the circular container:
a. the turbulent dissipation rate b. the turbulent velocity c. the turbulent kinetic energy
Fig.10 The distribution of three indexes in circular container
Simulation cloud image of mixing in the square container:
a. the turbulent dissipation rate b. the turbulent velocity c. the turbulent kinetic energy
Internal flow Numerical Simulation Analysis of Coagulation Mixing
10
Fig.11 The distribution of three indexes in square container
E. Mixing paddle 5(60×40mm)
Simulation cloud image of mixing in the circular container:
a. the turbulent dissipation rate b. the turbulent velocity c. the turbulent kinetic energy
Fig.12 The distribution of three indexes in circular container
Simulation cloud image of mixing in the square container:
a. the turbulent dissipation rate b. the turbulent velocity c. the turbulent kinetic energy
Fig.13 The distribution of three indexes in square container
Notice: the above cloud images are the cross section which is on Y axis of the container and 50mm from the bottom.
Comparing with the cloud images above, it can be found
whether mixing in circular or square container, the turbulent
dissipation rate field, turbulent velocity field and the turbulent
kinetic energy field are concentrated around the mixing
paddle, and gradually expand outward, but there is a large
difference between the two containers in expansion degree.
Comparing with each set of simulation one by one, the index
distribution is more balanced in the square container under the
same mixing conditions, the most obvious difference exist in
the turbulent dissipation rate.
For a more intuitive analysis of the various indexes, line
charts of the turbulent dissipation rate, average speed and the
turbulent kinetic energy which were solved under the mixing
conditions by the FLUENT software were drew for
comparison. The results are shown in the following three
figures.
Fig.14 Comparison of average turbulent dissipation rate
between circular and square containers
Fig.15 Comparison of average speed between circular
and square containers
Fig.16 Comparison of average turbulent kinetic energy
between circular and square containers
International Journal of Engineering and Advanced Research Technology (IJEART)
ISSN: 2454-9290, Volume-2, Issue-5, May 2016
11 www.ijeart.com
It can be seen from the chart above, the average turbulent
dissipation rate, average speed and average turbulent kinetic
energy in circular containers are larger than the average
values in square container under the same mixing condition. It
can be seen obviously that the turbulence intensity in the
circular container is larger than the turbulence intensity in the
square container, from the perspective of the floc collision
theory [6], the floc collision will dissipate more energy in the
circular container than the square container, and it also
generate greater shear force which will break flocs; from the
perspective of the scale of micro vortex theory [7], the range
of the vortex scale is wider in circular container, but when the
ratio of scale of micro vortex which is similar to the flocs gets
smaller, the growth of flocs gets more difficult.
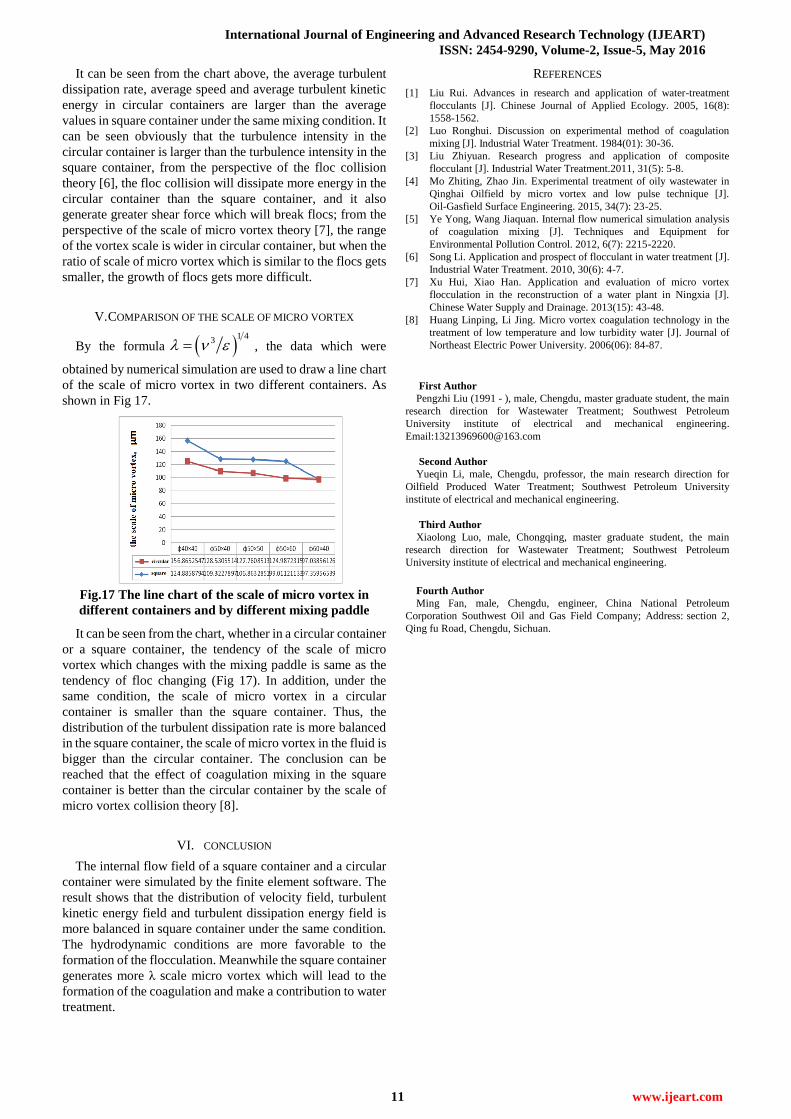
V. COMPARISON OF THE SCALE OF MICRO VORTEX
By the formula 1 4
3 , the data which were
obtained by numerical simulation are used to draw a line chart
of the scale of micro vortex in two different containers. As
shown in Fig 17.
Fig.17 The line chart of the scale of micro vortex in
different containers and by different mixing paddle
It can be seen from the chart, whether in a circular container
or a square container, the tendency of the scale of micro
vortex which changes with the mixing paddle is same as the
tendency of floc changing (Fig 17). In addition, under the
same condition, the scale of micro vortex in a circular
container is smaller than the square container. Thus, the
distribution of the turbulent dissipation rate is more balanced
in the square container, the scale of micro vortex in the fluid is
bigger than the circular container. The conclusion can be
reached that the effect of coagulation mixing in the square
container is better than the circular container by the scale of
micro vortex collision theory [8].
VI. CONCLUSION
The internal flow field of a square container and a circular
container were simulated by the finite element software. The
result shows that the distribution of velocity field, turbulent
kinetic energy field and turbulent dissipation energy field is
more balanced in square container under the same condition.
The hydrodynamic conditions are more favorable to the
formation of the flocculation. Meanwhile the square container
generates more λ scale micro vortex which will lead to the
formation of the coagulation and make a contribution to water
treatment.
REFERENCES
[1] Liu Rui. Advances in research and application of water-treatment
flocculants [J]. Chinese Journal of Applied Ecology. 2005, 16(8):
1558-1562.
[2] Luo Ronghui. Discussion on experimental method of coagulation
mixing [J]. Industrial Water Treatment. 1984(01): 30-36.
[3] Liu Zhiyuan. Research progress and application of composite
flocculant [J]. Industrial Water Treatment.2011, 31(5): 5-8.
[4] Mo Zhiting, Zhao Jin. Experimental treatment of oily wastewater in
Qinghai Oilfield by micro vortex and low pulse technique [J].
Oil-Gasfield Surface Engineering. 2015, 34(7): 23-25.
[5] Ye Yong, Wang Jiaquan. Internal flow numerical simulation analysis
of coagulation mixing [J]. Techniques and Equipment for
Environmental Pollution Control. 2012, 6(7): 2215-2220.
[6] Song Li. Application and prospect of flocculant in water treatment [J].
Industrial Water Treatment. 2010, 30(6): 4-7.
[7] Xu Hui, Xiao Han. Application and evaluation of micro vortex
flocculation in the reconstruction of a water plant in Ningxia [J].
Chinese Water Supply and Drainage. 2013(15): 43-48.
[8] Huang Linping, Li Jing. Micro vortex coagulation technology in the
treatment of low temperature and low turbidity water [J]. Journal of
Northeast Electric Power University. 2006(06): 84-87.
First Author
Pengzhi Liu (1991 - ), male, Chengdu, master graduate student, the main
research direction for Wastewater Treatment; Southwest Petroleum
University institute of electrical and mechanical engineering.
Email:[email protected]
Second Author
Yueqin Li, male, Chengdu, professor, the main research direction for
Oilfield Produced Water Treatment; Southwest Petroleum University
institute of electrical and mechanical engineering.
Third Author
Xiaolong Luo, male, Chongqing, master graduate student, the main
research direction for Wastewater Treatment; Southwest Petroleum
University institute of electrical and mechanical engineering.
Fourth Author
Ming Fan, male, Chengdu, engineer, China National Petroleum
Corporation Southwest Oil and Gas Field Company; Address: section 2,
Qing fu Road, Chengdu, Sichuan.