Embed Size (px)
Citation preview
AD
TECHNICAL REPORT ARCCB-TR-96001
INTERNAL FRICTION AND MODULUSSTUDIES ON AUSTEMPERED DUCTILE IRON
TAMMY HICKEYPAUL J. COTE
JANUARY 1996
US ARMY ARMAMENT RESEARCH,DEVELOPMENT AND ENGINEERING CENTERCLOSE COMBAT ARMAMENTS CENTER
BENET LABORATORIESWATERVLIET, N.Y. 12189-4050
APPROVED FOR PUBLIC RELEASE; DISTRIBUTION UNLIMITED
1 99604 110~62

DISCLAITER
The findings in this report are not to be construed as an official
Department of the Army position unless so designated by other authorized
documents.
The use of trade name(s) and/or manufacturer(s) does not constitute
an official indorsement or approval.
DESTRUCTION NOTICE
For classified documents, follow the procedures in DoD S200.22-M,
Industrial Security Manual, Section 11-19 or DoD 5200.1-R, Information
Security Program Regulation, Chapter IX.
For unclassified, limited documents, destroy by a.ny method that will
prevent disclosure of contents or reconstruction of the document.
For unclassified, unlimited documents, destroy when the report is
no longer needed. Do not return it to the originator.
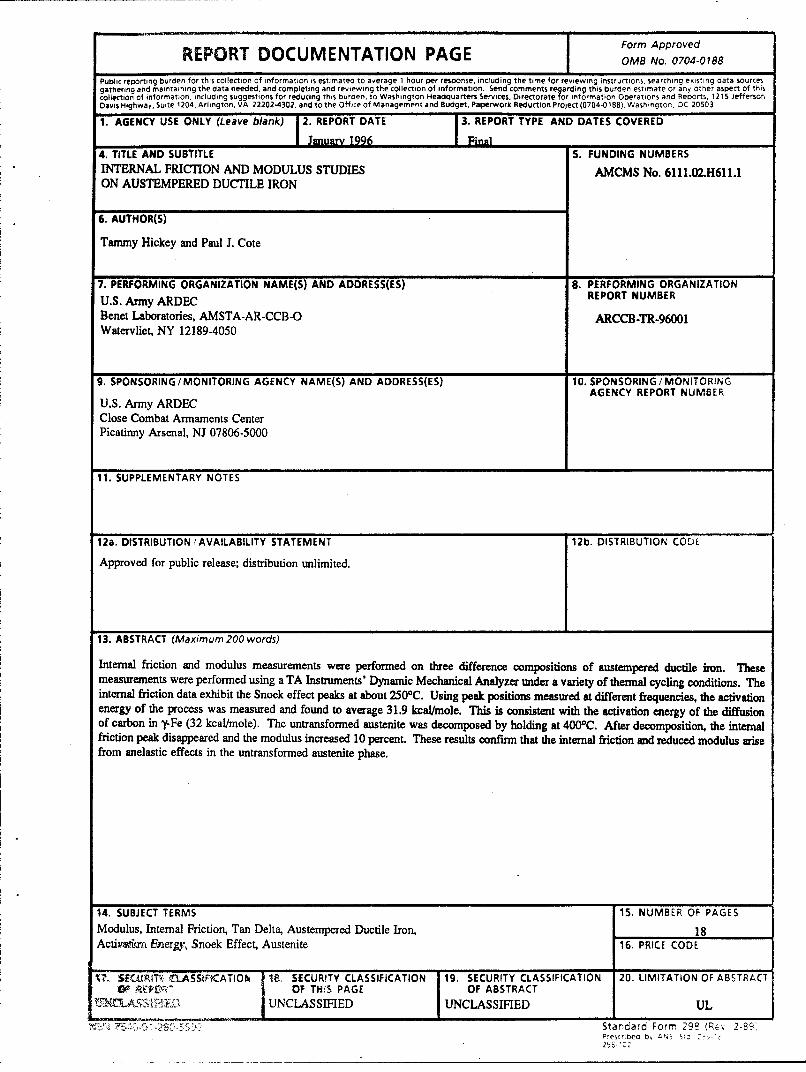
REPORT DOCUMENTATION PAGE Form Approved
___________________________________________________ I O MB No. 0704-0188
Public reporting burden for this collection of information is estimated to average 1 hour per response, including the time for reviewing instructions, searching existing data sourcesgathering and maintaining the data needed, and completing and rewewing the collection of information. Send comments regarding this burden estimate or any other aspect of thiscollection of information, including suggestions for reducing this burden. to Washington Headquarters Services. Directorate tor information Operations and Reports, 1215 JeffersornDavis Highway. Suite 1204, Arlington, VA 22202.4302. and to the Office of Management and Budget, Paperwork Reduction Project (0704-0188), Washington, DC 20503,
1. AGENCY USE ONLY (Leave blank) 2. REPORT DATE 3. REPORT TYPE AND DATES COVERED
I January 1996 IFinasl4. TITLE AND SUBTITLE 5. FUNDING NUMBERSINTERNAL FRICTION AND MODULUS STUDIES AMCMS No. 6111.02.H611.1ON AUSTEMPERED DUCTILE IRON
6. AUTHOR(S)
Tammy Hickey and Paul J. Cote
7. PERFORMING ORGANIZATION NAME(S) AND ADDRESS(ES) 8. PERFORMING ORGANIZATION
U.S. Army ARDEC REPORT NUMBER
Benet Laboratories, AMSTA-AR-CCB-O ARCCB-TR-96001Watervliet, NY 12189-4050
9. SPONSORING / MONITORING AGENCY NAME(S) AND ADDRESS(ES) 10. SPONSORING /MONITORINGAGENCY REPORT NUMBER
U.S. Army ARDECClose Combat Armaments CenterPicatinny Arsenal, NJ 07806-5000
11. SUPPLEMENTARY NOTES
12a. DISTRIBUTION /AVAILABILITY STATEMENT 12b. DISTRIBUTION CODL
Approved for public release; distribution unlimited.
13. ABSTRACT (Maximum 200 words)
Internal friction and modulus measurements were performed on three difference compositions of austempered ductile iron. Thesemeasurements were performed using a TA Instruments' Dynamic Mechanical Analyzer under a variety of thermal cycling conditions. Theinternal friction data exhibit the Snoek effect peaks at about 250°C. Using peak positions measured at different frequencies, the activationenergy of the process was measured and found to average 31.9 kcal/mole. This is consistent with the activation energy of the diffusionof carbon in y-Fe (32 kcal/mole). The untransformed austenite was decomposed by holding at 400°C. After decomposition, the internalfriction peak disappeared and the modulus increased 10 percent. These results confirm that the internal friction and reduced modulus arisefrom anelastic effects in the untransformed austenite phase.
14. SUBJECT TERMS 15. NUMBER OF PAGES
Modulus, Internal Friction, Tan Delta, Austempered Ductile Iron, 18Activayin EurerKv, Snoek Effect, Austenite 16. PRICE CODE
NT S .X'RIT, ZIASSWKCATION 16, SECURITY CLASSIFICATION 19. SECURITY CLASSIFICATION 20. LIMITATION OF ABSTRACT° • OF THIS PAGE OF ABSTRACT
UNCLASSIFIED UNCLASSIFIED ULStandard Form 295 (Rev 2-89'Prescr~•, o b, oN5 51--
TABLE OF CONTENTS
Page
INTRODUCTION ................................................... 1
SPECIMEN PREPARATION ........................................... 2
EXPERIMENTAL METHOD ........................................... 2
RESULTS AND DISCUSSION .......................................... 2
CONCLUSIONS .................................................... 4
REFERENCES ..................................................... 6
APPEND IX ...................................................... 15
TABLES
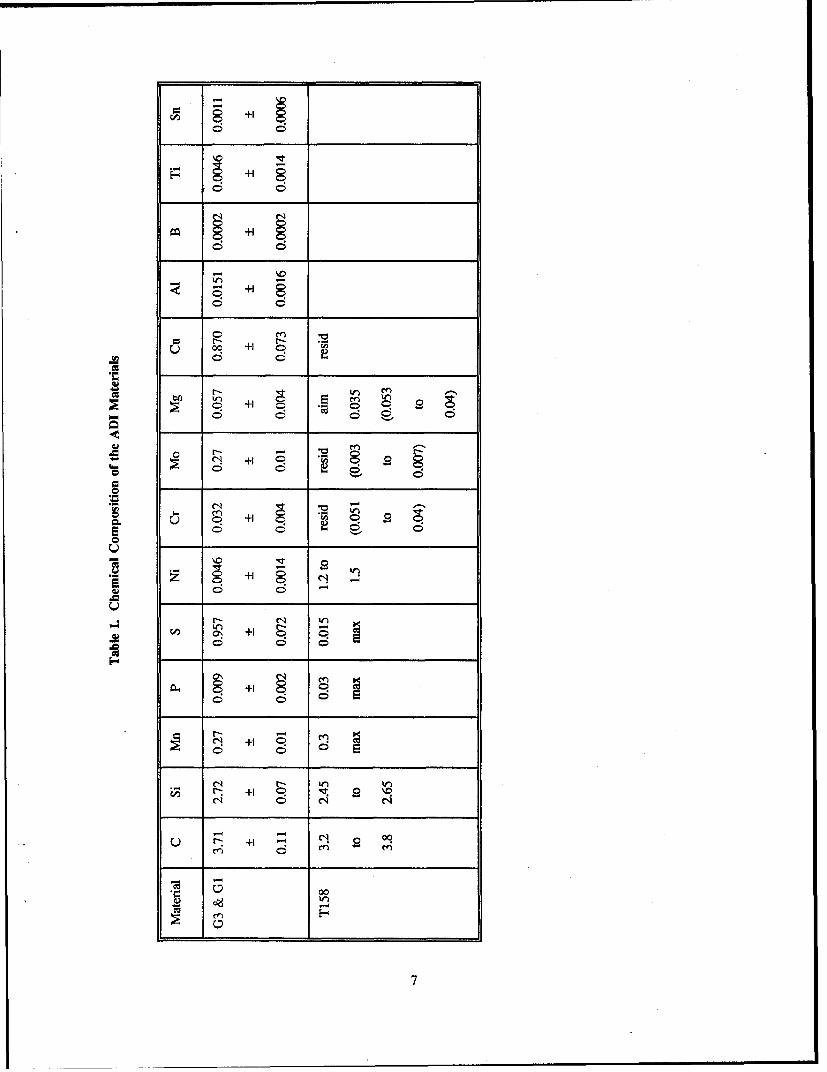
1. Chemical Composition of the ADI Materials ............................ 7
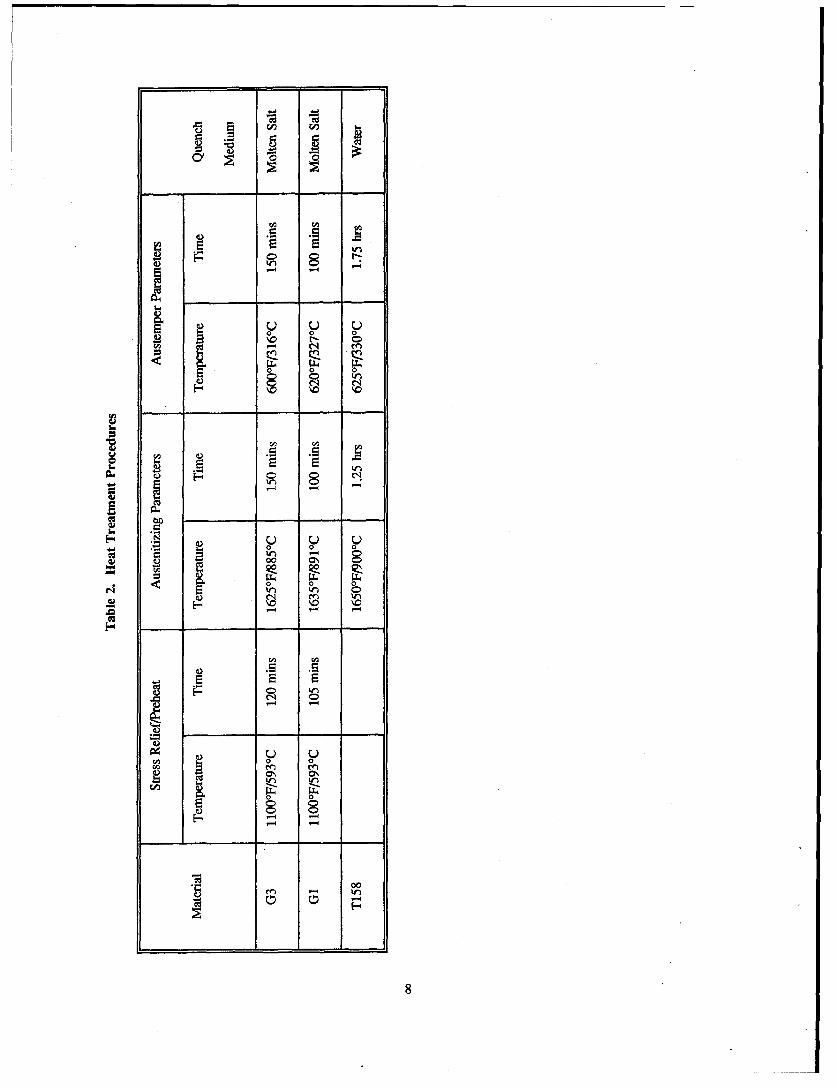
2. Heat Treatment Procedures ........................................ 8
LIST OF ILLUSTRATIONS
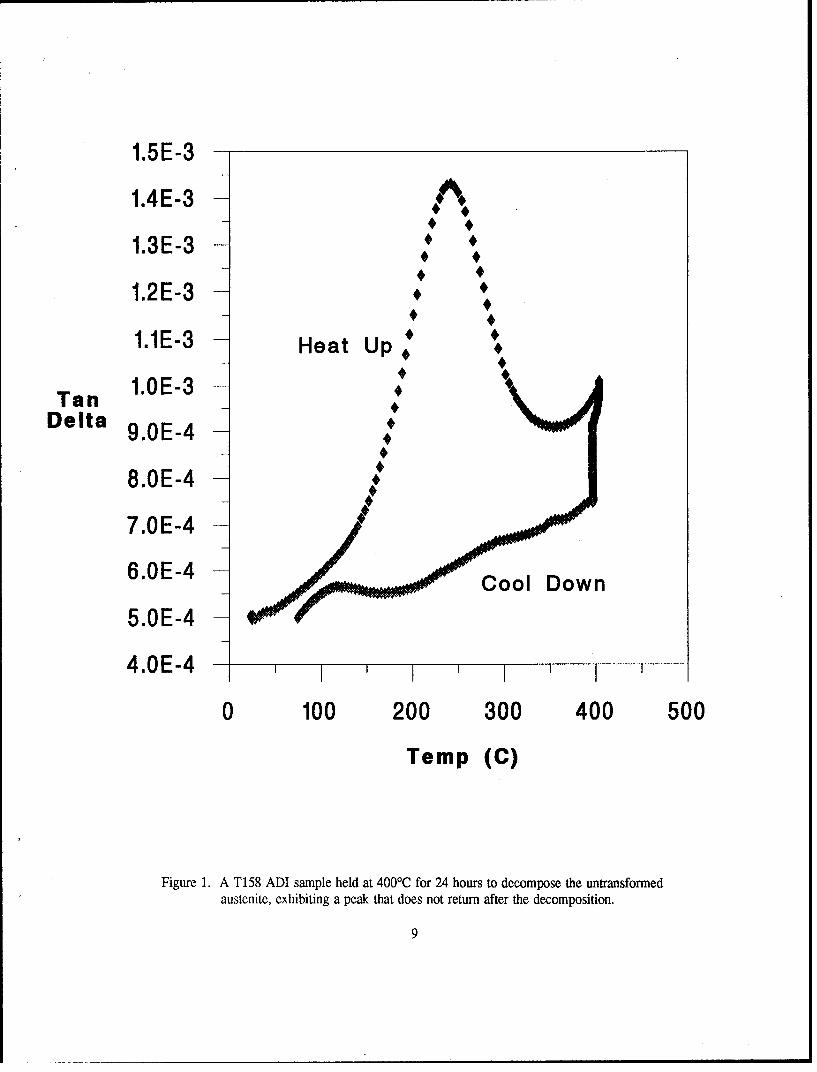
1. A T158 ADI sample held at 400'C for 24 hours to decompose the untransformedaustenite, exhibiting a peak that does not return after the decomposition ........ 9
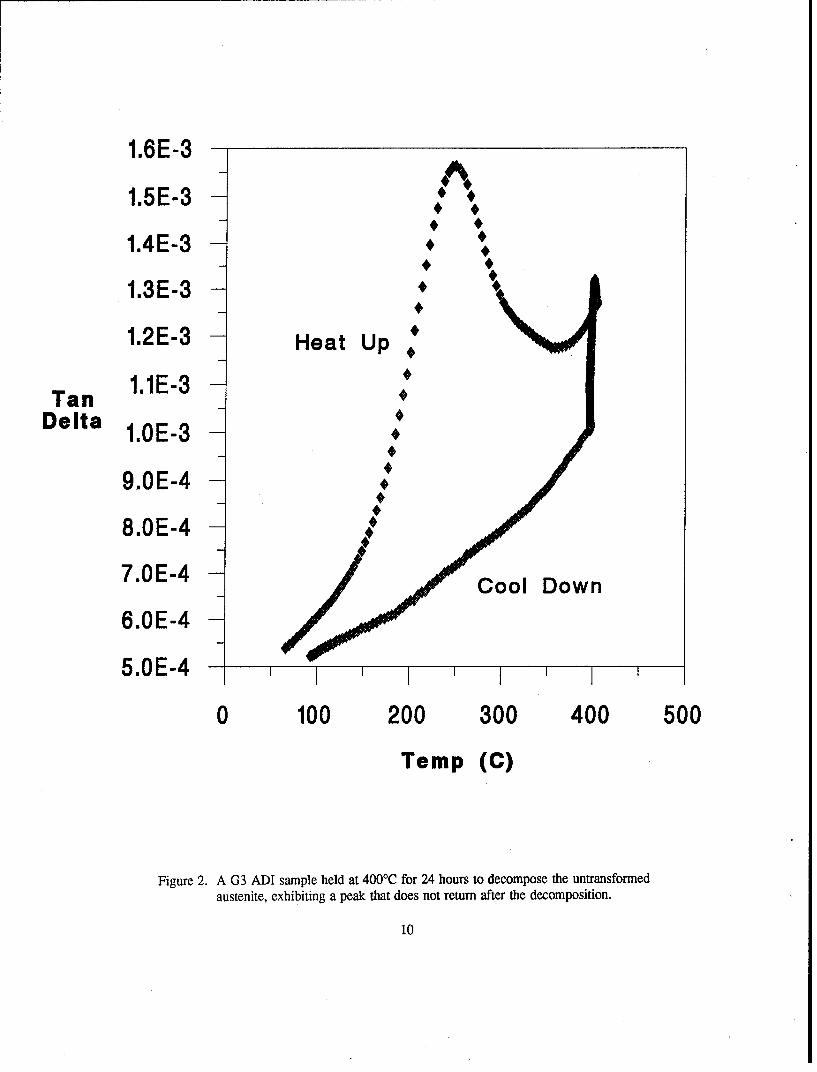
2. A G3 ADI sample held at 400'C for 24 hours to decompose the untransformedaustenite, exhibiting a peak that does not return after the decomposition ....... 10
3. Data points representing the Snoek peak temperature positions for the resonantfrequencies of the three T158 samples clamped at various lengths in the DMA 982 11
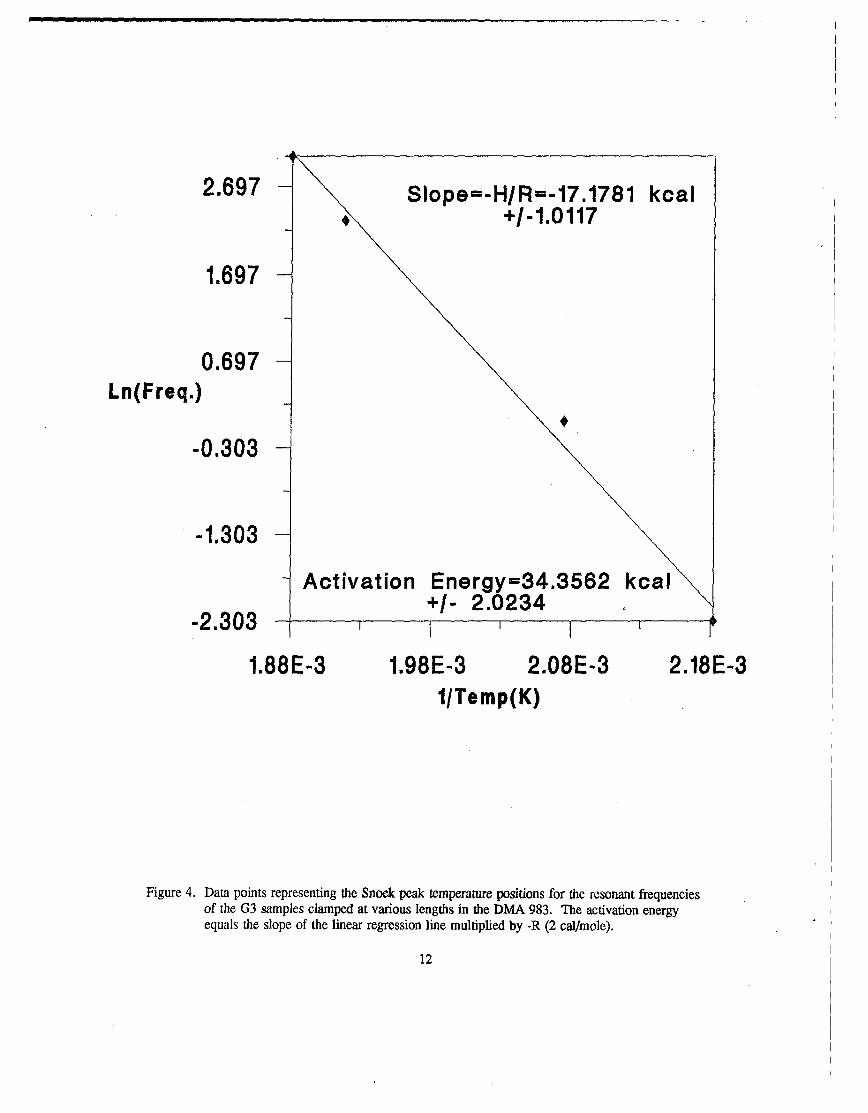
4. Data points representing the Snoek peak temperature positions for the resonantfrequencies of the G3 samples clamped at various lengths in the DMA 983 ..... 12
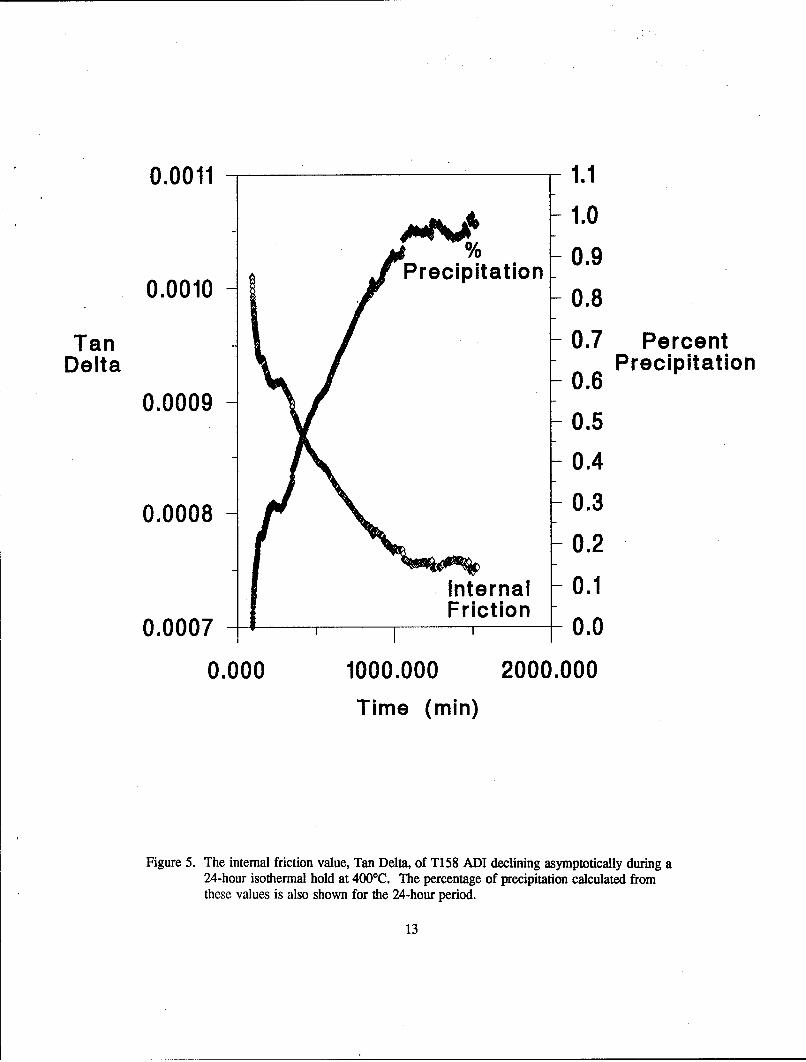
5. The internal friction value, Tan Delta, of T158 ADI declining asymptoticallyduring a 24-hour isothermal hold at 400'C ......... .................. 13
6. The internal friction value, Tan Delta, of G3 ADI declining asymptoticallyduring a 24-hour isothermal hold at 400'C ............................ 14
INTRODUCTION
Austempered ductile iron (ADI) is cast as conventional nodular iron. The carbon inthis type of iron forms into spheroids of graphite during solidification. The standard heattreatment for ADI involves austenitizing followed by a quench and hold at an austemperingtemperature for a time that yields optimum properties. A bainitic-type reaction takes placeduring austempering. As the bainite reaction proceeds, carbon partitions from the ferriteregion into the remaining austenite. This untransformed austenite decomposes to ferrite andcarbide at 400'C and above. The percentage of untransformed austenite is a strong functionof austenitization temperature, austempering temperature, and composition. For this study weused the compositions and heat treatments listed in Tables 1 and 2.
A properly optimized austempered ductile iron material is reported to exhibit a goodcombination of strength and ductility (refs 1-4). Toughness measurements of ductile ironsusing unnotched specimens have been found to give good results under static conditions (refs2-4). It is known that ADI has good dumping properties which were assumed to be derivedfrom the spheroidal graphite nodules intermixed in the ausferrite matrix (refs 5,6). This studyof modulus and internal friction provides new information on the inherent damping propertiesof ADI.
Internal friction measurements provide useful information about the structure andcomposition of a material (refs 1-9). The purpose of this report is to present the results ofthese measurements on ADI. The internal friction and modulus measurements wereperformed on the TA Instruments' Dynamic Mechanical Analyzers (DMA), models 982 and983. The activation energy of the internal friction process was obtained from the frequencydependence of the internal friction peak. Changes in internal friction peak amplitude duringan isothermal hold were used to measure the carbon precipitation in the untransformedaustenite.
Internal friction relates to the ability of a material to absorb vibrational energy (ref10). One mechanism for vibrational energy absorption arises from the presence of a solute ina metallic solid solution. Interstitial positions can alternately enlarge and contract during eachcycle in a vibrating system. Solute atoms respond to the strain pattern by jumping fromcontracted to expanded interstitial sites. For example, in dilute iron-carbon alloys, this occursalong the (100) direction. This stress-induced atomic motion is accompanied by an energyloss. For a given carbon concentration, the energy loss reaches a maximum when thevibrational frequency of the metal approaches the carbon atoms' normal atomic jump rate.For example, this maximum energy loss appears at a 1 cycle/sec vibration rate in iron at roomtemperature. The energy loss of an iron sample thus vibrated is found to be proportional tothe carbon in solid solution. This technique has been used to obtain the carbon concentrationin iron ferrite (ref 8). Internal friction can, therefore, provide valuable information aboutsolute distribution, alloy structure, precipitation effects, and diffusivity in some cases.
1
SPECIMEN PREPARATION
The DMA specimens were machined from ADI material labeled T158, G1, and G3into rectangular strips, 0.95 to 1 mm thick and 9.5 to 11.5 mm wide. The length of thespecimen is the distance between the clamps, which ranged from 20 mm to 55 mm. Thematerials were cast using the chemistry requirements in Table 1 and heat treated as describedin Table 2.
EXPERIMENTAL METHOD
The DMA 982 and 983 operate by forcing a constant amplitude oscillation at resonantor user-selected frequency. The sample is flexed by two parallel arms oscillated by anelectromagnetic driver at a user-selected amplitude. The sample's viscoelastic propertiesdetermine the resonant frequency of the system. As these properties change withtemperature and time, the modules adjust the electric energy to maintain the selectedamplitude as the resonant frequency varies. The DMAs measure the frequency of theoscillation (which relates to the elastic modulus) and the electrical energy necessary tomaintain the oscillation amplitude (which relates to the material's inherent damping). Thesevalues are used by the TA analysis software to calculate E' (tensile storage modulus), E"(tensile loss modulus), G' (shear storage modulus), G" (shear loss modulus), and Tan Delta(loss factor, E"/E'), using the equations and variables found in the Appendix.
In fixed frequency mode, the DMA 983 forces the sample to oscillate at a user-definedfrequency using a sinusoidal driver signal. The lag between the driver signal and the LVDT-monitored sample displacement is the phase angle. The phase angle and drive signal are thevariables used to calculate the properties.
The DMA samples were positioned perpendicular to clamps, carefully tightened to 18ft-lbs by alternating tightening of the clamps in 2 ft-lb steps. The system operated in an inertatmosphere of helium at a flow rate between 1750 and 2150 cc/min in the DMA 982 andbetween 1300 cc/min and 1750 cc/min in the DMA 983 to maintain a comparable flow rate atthe gas outlet. After a twenty-minute purge, the samples were ramped up at 5FC/minute tothe set point (usually 3000C). In a half dozen experiments, the samples were held at 400'Cfor 24 hours, to study the effect of decomposition of the untransformed austenite on modulusand internal friction. The raw data was analyzed by the TA DMA analysis software andconverted to ASCII for spreadsheet analysis.
RESULTS AND DISCUSSION
The internal friction data exhibit Snoek peaks (Figures 1 and 2). The peak positionswere determined by fitting the upper 10 percent of the measured peaks to a quadratic
2
equation.1 The internal friction, as represented by Tan 8, is a function of frequency, v, andrelaxation time, r, where
"T = e -HIRT (1)
and H = activation energy, and R = universal gas constant = 2 cal/mole/"K.
If Tan 8 versus I/Temperature curves are obtained for different frequencies, they canbe superimposed by a horizontal shift, since Tan 8 is a function of ut and 'r is an Arrheniusequation. Thus, the positions (in temperature) of the Snoek peaks exhibited by the internalfriction data and the frequency of the peaks can be related by (ref 9)
ln(f21f1) = -(H/1) *A(1/7) (2)
Plotting 1/Tempab. against the In(freq.) gives a straight line with a slope of -H/R. Theslopes of these graphs were obtained by linear regression. Figures 3 and 4 show results forinternal friction measurements of ADI performed in the resonant mode on the DMA 982 andin the fixed frequency mode on the DMA 983, respectively.
The resonant mode internal friction measurements were performed on three T158specimens on the DMA 982 over a frequency range of 10 to 30 Hz. The peak positions wereanalyzed and plotted against the natural log of the frequency as described above. Theactivation energy was calculated to be 29.5 kcal/mole. The fixed frequency mode internalfriction measurements were performed on the DMA 983 and G3 samples over a widerfrequency range (0.01 to 20 Hz). The activation energy was calculated to be 34.4 kcal/mole.
The activation energy values indicate that the Snoek peaks arise from diffusion ofcarbon in a face-centered-cubic y-Fe. The published activation energy value for the diffusionof carbon in y-Fe is 32 kcal/mole, and the value for diffusion of carbon in a-Fe is 18kcal/mole (ref 9). The average of the activation energies by the two modes is 31.9 kcal/mole,which corresponds to the value for y-Fe. In ADI the body-centered-cubic ferrite (a-Fe)contains a negligible level of carbon, and the untransformed austenite (y-Fe) possesses a largepercentage of carbon, 1.5 to 2 percent, so that the effect can only arise from theuntransformed austenite.
Internal friction and modulus measurements were also made during twenty-four hourisothermal hold experiments at 400'C. Under these conditions, the untransformed austenitedecomposes to bainite, which is a mixture of ferrite and carbides. In 300'C runs performed
1 The raw data had been smoothed by the TA data analysis software. The curve fitting was performed by Jandel'sTableCurve version 3.10. The first derivatives of the quadratic equation were solved for peak positions.
3

after the 400'C twenty-four hour runs, the Snoek peaks completely disappear (Figures 1 and2), and the internal friction values are all lowered to the "baseline" values.2
Snoek peak amplitudes for carbon in iron are proportional to the carbon content (refs7,8). Thus, the decline in the internal friction during the isothermal hold is a measure of theprecipitation of the carbon. This percentage of carbon precipitating out of the untransformedaustenite can be found using the internal friction values and the equation
W = - - QJ) (3)
where
Q= starting internal friction value
Qt= internal friction value at time t
Qf= final internal friction value
The results of these calculations during the isothermal holds are shown in Figures 5 and 6.The untransformed austenite decomposes into ferrite and carbides.
The modulus showed the same asymptotically changing values during the twenty-fourhour hold at 400'C. By the end of the twenty-four hour hold at 400'C, the room temperaturemodulus values had increased by approximately 10 percent, and the 400'C values increasedby 13 percent. The initial decrease in modulus on heating to 400'C is 15 percent beforedecomposition and 7.5 percent after decomposition. An inflection in the modulus-temperaturecurve occurs at approximately 250'C. This break corresponds to the Snoek peak position inthe internal friction. It disappears, like the Snoek peak, after decomposition. The presence offree graphite nodules has been considered as the cause of the lower modulus values typical ofADI (ref 6). However, as demonstrated in this report, the untransformed austenite accountsfor the lowered values.3
CONCLUSIONS
The dominant contribution of the untransformed austenite in ADI to internal frictionhas been demonstrated. The activation energy of the process generating the internal friction
2 A previously performed gunsteel internal friction measurement is given in the Appendix. Its maximum valueat 400TC of approximately 8e4 compares to the after-decomposition results. Since steel has a negligible internalfriction signal, this supports the conclusion that the internal friction values and good inherent damping propertiesmeasured were derived from the untransformed austenite.
Previous measurements performed on gunsteel show a modulus range of 200 to 210 GPa.
4
peaks in ADI was measured and found to be consistent with the Snoek effect of carbon in 7,-Fe (untransformed austenite). Therefore, these peaks are associated with the diffusion ofcarbon in y-Fe. The internal friction peaks were diminished to baseline values after thedecomposition of the untransformed austenite. Similarly, the modulus experienced asignificant increase in value and decrease in temperature dependence with decomposition ofuntransformed austenite. Internal friction and modulus measurements provide a usefulalternative method for ADI transformation behavior analysis.
5
REFERENCES
1. L. Sidjanin and R. E. Smallman, Mater. Sci. Technol., Vol. 8, 1992, p. 1095.
2. J. Aranzabel, I. Gutierrez, J. M. Rodriques-Ilsabe, and J. J. Urcola, Mater. Sci.Technol., Vol. 8, 1992, p. 263.
3. R. B. Gunlach and J. F. Janowak, Met. Prog., Vol. 19, 1985.
4. M. Grech and J. M. Young, Mater. Sci. Technol., Vol. 6, 1990, p. 415.
5. ASME Gear Research Institute: Austempered Ductile Iron - Database, NationalTechnical Information Service, U.S. Department of Commerce, Springfield, VA, 1989.
6. H. Era, K. Kishitake, K. Nagai, and Z. Z. Zhang, Mater. Sci. Technol., Vol. 8, 1992,p. 257.
7. C. Wert, Thermodynamics in Physical Metallurgy, American Society for Metals,Cleveland, OH, 1952, pp. 178-189.
8. R. H. Doremus, Acta. Met., Vol. 6, 1958, p. 674.
9. C. Zener, Elasticity and Anelasticity, University of Chicago Press, Chicago, IL, 1960.p. 60.
10. R. E. Reed-Hill, Physical Metallurgy Principles, 2nd edition, PWS Engineering, PWSPublishers, Boston, MA, 1973, p. 366.
6
+1
-H
cc +1 q
+1 +1
- 0 6o ~.
ol g-.-m n en
o 06CW
-Ol
0~ 0
o 0
4)4
e4 -' tn C
E c'cef
en mf
400Ht
1.5E-3
1.4E-3 -
1.3E-3 ,
1.2E-3
1.1E-3 Heat Up,
Tan 1.OE-3Delta 9.OE-4
8.OE-4
7.OE-4
6.OE-4 Cool Down
5.OE-4
4.OE-4' I ' I I
0 100 200 300 400 500
Temp (C)
Figure 1. A T158 ADI sample held at 400TC for 24 hours to decompose the untransformedaustenite, exhibiting a peak that does not return after the decomposition.
9
1.6E-3
1.5E-3
1.4E-31.3E-3
1.2E-3 Heat Up ,
1.1E-3TanDelta ES1.0E-3-
9.OE-4
8.OE-4
7.0E-4 Cool Down
6.0E-4-
5.OE-4 I I I
0 100 200 300 400 500
Temp (C)
Figure 2. A G3 ADI sample held at 4000C for 24 hours to decompose the untransformedaustenite, exhibiting a peak that does not return after the decomposition.
10

3.500 -
Slope=-H/R=-14.796 kcal3.400 +/-1.449053
3.300
3.200
3.100Ln(Freq)
3.000
2.900 ,2.800
2.700 Activation Energy=29.510KCaI+/- 2.909
2.600 1 I I I
1.88E-31.89E-31.90E-31.91E-31.92E-31.93E-31/Temp(K)
Figure 3. Data points representing the Snoek peak temperature positions for the resonant frequenciesof the three T158 samples clamped at various lengths in the DMA 982. The activationenergy equals the slope of the linear regression line multiplied by -R (2 cal/mole).
11
2.697 Slope=-H/R=-17.1781 kcal+/-1.0117
1.697
0.697Ln(Freq.)
-0.303
-1.303
Activation Energy=34.3562 kcal-2ti303ion+/- 2.0234-2.303
1.88E-3 1.98E-3 2.08E-3 2.18E-31/Temp(K)
Figure 4. Data points representing the Snoek peak temperature positions for the resonant frequenciesof the G3 samples clamped at various lengths in the DMA 983. The activation energyequals the slope of the linear regression line multiplied by -R (2 cal/mole).
12
0.0011 1.1p- 1.0
Precipitation 0.90.0010 0.8
Tan 0.7 PercentDelta 0.6 Precipitation
0.00090.5
0.4
0.0008 0.3
0.2.Internal -0.1Friction
0.0007 - -0.0
0.000 1000.000 2000.000
Time (min)
Figure 5. The internal friction value, Tan Delta, of T158 ADI declining asymptotically during a24-hour isothermal hold at 400TC. The percentage of precipitation calculated fromthese values is also shown for the 24-hour period.
13

0.0014 1.11.0
'% -0.9
Precipitation 0.80.00130.7
Tan- 06 PercentDelta 0 Precipitation
0.0012 0.5
-0.40.30.2
0.0011 0.10.0
Internal -0.1;tion
0.0010 - -0.2
0.000 1000.000 2000.000
Time (min)
Figure 6. The internal friction value, Tan Delta, of G3 ADI declining asymptotically during a24-hour isothermal hold at 4001C. The percentage of precipitation calculated fromthese values is also shown for the 24-hour period.
14
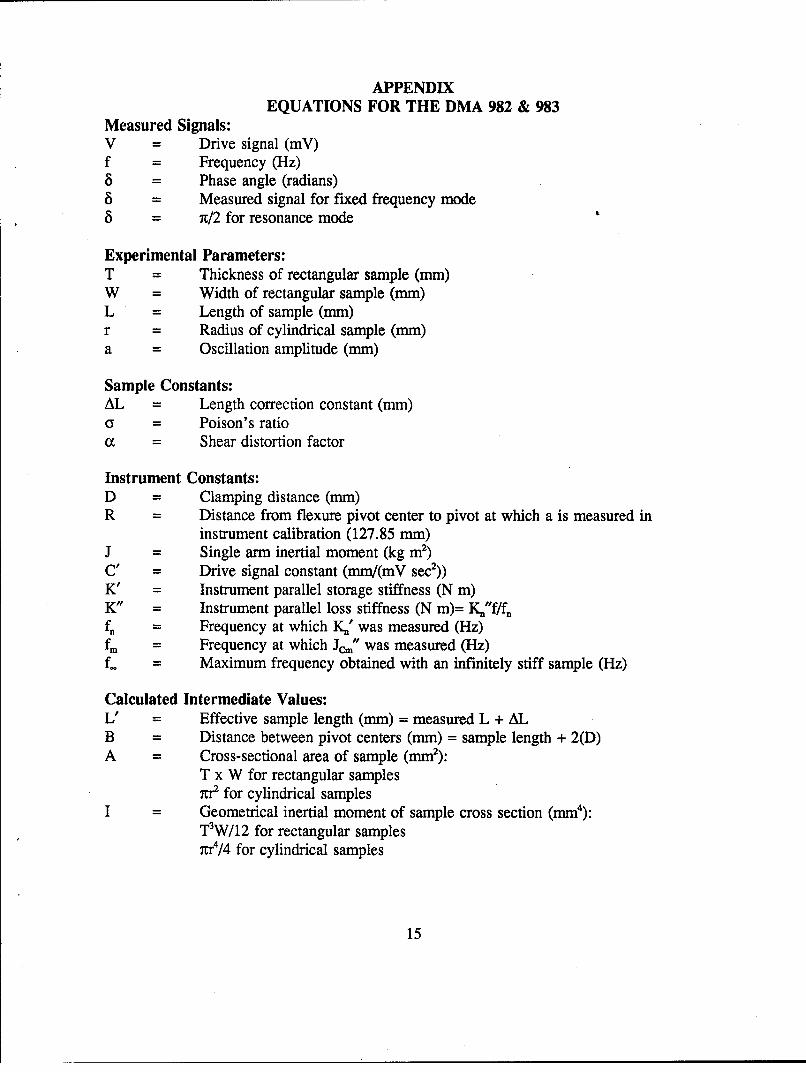
APPENDIXEQUATIONS FOR THE DMA 982 & 983
Measured Signals:V = Drive signal (mV)f = Frequency (Hz)8 = Phase angle (radians)8 = Measured signal for fixed frequency mode8 = t/2 for resonance mode
Experimental Parameters:T = Thickness of rectangular sample (mm)W = Width of rectangular sample (mm)L = Length of sample (mm)r = Radius of cylindrical sample (mm)a = Oscillation amplitude (mm)
Sample Constants:AL = Length correction constant (mm)Y = Poison's ratio
a = Shear distortion factor
Instrument Constants:D = Clamping distance (mm)R = Distance from flexure pivot center to pivot at which a is measured in
instrument calibration (127.85 mm)J = Single arm inertial moment (kg min)C' = Drive signal constant (mm/(mV sec2))K' = Instrument parallel storage stiffness (N m)K" = Instrument parallel loss stiffness (N m)= K."f/fnfn = Frequency at which K.' was measured (Hz)fi = Frequency at which J•" was measured (Hz)f- = Maximum frequency obtained with an infinitely stiff sample (Hz)
Calculated Intermediate Values:L' = Effective sample length (mm) = measured L + ALB = Distance between pivot centers (mm) = sample length + 2(D)A = Cross-sectional area of sample (mm2):
T x W for rectangular samples7c2 for cylindrical samples
I = Geometrical inertial moment of sample cross section (mam 4):T3W/12 for rectangular samplestr4/4 for cylindrical samples
15
MO= (2J)r2C/V
eo =a
+ L12A,4 + +(Jc G+ JcHIG")24(1 + a)! + L /C
y = (AIL)(Jc/ G" - Jc/1G')
K2 + (02
2J00
(wd)- MO2J00
Primary Equations:
Shear Storage Modulus:
G0 = (2Jkz2 - 2K')p2 + y2 L' '_.G11P B2A
Shear Loss Modulus:
G1= [2J(wd) - 2K] p2 + y2 L' y GIB2A 1
16
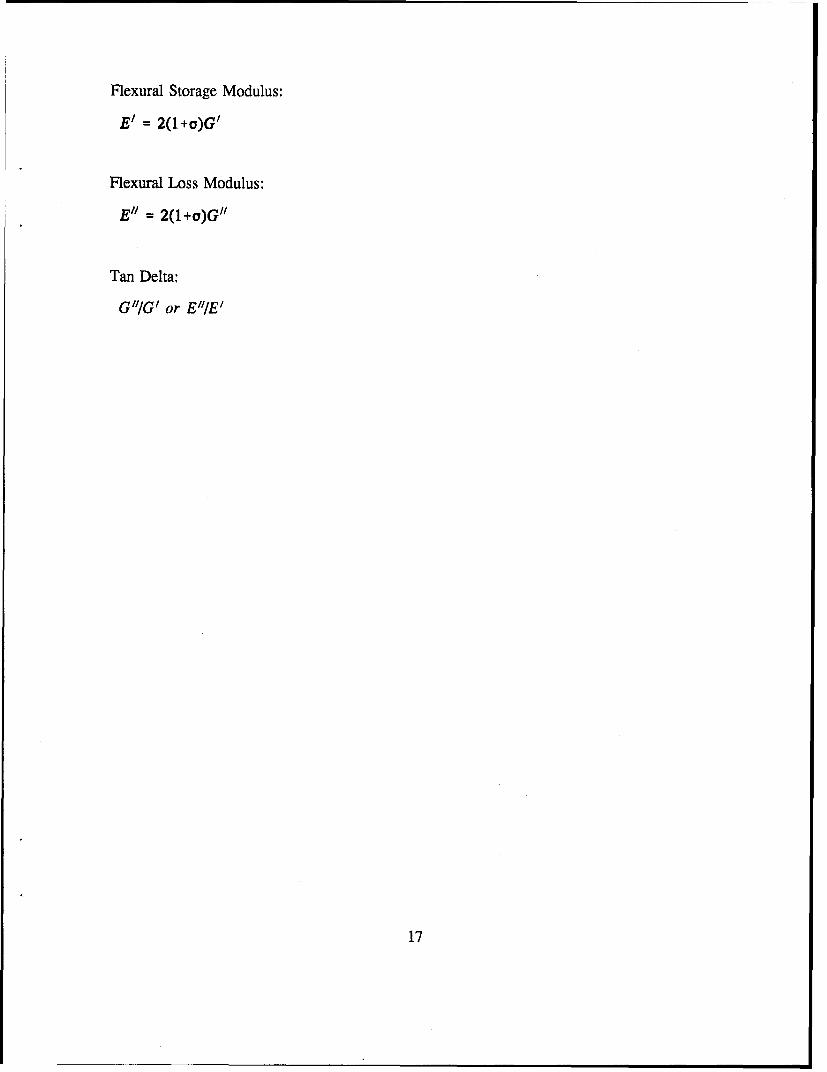
Flexural Storage Modulus:
E' = 2(I+o)G/
Flexural Loss Modulus:
E" = 2(1+o)G"
Tan Delta:
G"I'/ or E"IE'
17
TECHNICAL REPORT INTERNAL DISTRIBUTION LIST
NO. OFCOPIES
CHIEF, DEVELOPMENT ENGINEERING DIVISIONATTN: AMSTA-AR-CCB-DA 1
-DB 1-DC 1-DD 1-DE 1
CHIEF, ENGINEERING DIVISIONATTN: AMSTA-AR-CCB-E 1
-EA 1-EB 1-EC
CHIEF, TECHNOLOGY DIVISIONATTN: AMSTA-AR-CCB-T 2
-TA 1-TB 1-TC 1
TECHNICAL LIBRARYATTN: AMSTA-AR-CCB-O 5
TECHNICAL PUBLICATIONS & EDITING SECTIONATTN: AMSTA-AR-CCB-O 3
OPERATIONS DIRECTORATEATTN: SMCWV-ODP-P 1
DIRECTOR, PROCUREMENT & CONTRACTING DIRECTORATEATTN: SMCWV-PP 1
DIRECTOR, PRODUCT ASSURANCE & TEST DIRECTORATEATTN: SMCWV-QA 1
NOTE: PLEASE NOTIFY DIRECTOR, BENtT LABORATORIES, ATTN: AMSTA-AR-CCB-O OF ADDRESS CHANGES.

TECHNICAL REPORT EXTERNAL DISTRIBUTION LIST
NO. OF NO. OFCOPIES COPIES
ASST SEC OF THE ARMY COMMANDERRESEARCH AND DEVELOPMENT ROCK ISLAND ARSENALATTN: DEPT FOR SCI AND TECH 1 ATTN: SMCRI-ENMTHE PENTAGON ROCK ISLAND, IL 61299-5000WASHINGTON, D.C. 20310-0103
MIAC/CINDASADMINISTRATOR PURDUE UNIVERSITYDEFENSE TECHNICAL INFO CENTER 2 P.O. BOX 2634ATTN: DTIC-OCP (ACQUISITION GROUP) WEST LAFAYETTE, IN 47906BLDG. 5, CAMERON STATIONALEXANDRIA, VA 22304-6145 COMMANDER
U.S. ARMY TANK-AUTMV R&D COMMANDCOMMANDER ATTN: AMSTA-DDL (TECH LIBRARY)U.S. ARMY ARDEC WARREN, MI 48397-5000ATTN: SMCAR-AEE 1
SMCAR-AES, BLDG. 321 1 COMMANDERSMCAR-AET-O, BLDG. 351N 1 U.S. MILITARY ACADEMYSMCAR-FSA 1 ATTN: DEPARTMENT OF MECHANICSSMCAR-FSM-E 1 WEST POINT, NY 10966-1792SMCAR-FSS-D, BLDG. 94 1SMCAR-IMI-I, (STINFO) BLDG. 59 2 U.S. ARMY MISSILE COMMAND
PICATINNY ARSENAL, NJ 07806-5000 REDSTONE SCIENTIFIC INFO CENTER 2ATIN: DOCUMENTS SECTION, BLDG. 4484
DIRECTOR REDSTONE ARSENAL, AL 35898-5241U.S. ARMY RESEARCH LABORATORYATTN: AMSRL-DD-T, BLDG. 305 1 COMMANDERABERDEEN PROVING GROUND, MD U.S. ARMY FOREIGN SCI & TECH CENTER
21005-5066 ATTN: DRXST-SD220 7TH STREET, N.E.
DIRECTOR CHARLOTTESVILLE, VA 22901U.S. ARMY RESEARCH LABORATORYATTN: AMSRL-WT-PD (DR. B. BURNS) 1 COMMANDERABERDEEN PROVING GROUND, MD U.S. ARMY LABCOM
21005-5066 MATERIALS TECHNOLOGY LABORATORYATTN: SLCMT-IML (TECH LIBRARY) 2
DIRECTOR WATERTOWN, MA 02172-0001U.S. MATERIEL SYSTEMS ANALYSIS ACTVATTN: AMXSY-MP 1 COMMANDERABERDEEN PROVING GROUND, MD U.S. ARMY LABCOM, ISA
21005-5071 ATTN: SLCIS-IM-TL2800 POWER MILL ROADADELPHI, MD 20783-1145
NOTE: PLEASE NOTIFY COMMANDER, ARMAMENT RESEARCH, DEVELOPMENT, AND ENGINEERING CENTER,BENtT LABORATORIES, CCAC, U.S. ARMY TANK-AUTOMOTIVE AND ARMAMENTS COMMAND,
AMSTA-AR-CCB-O, WATERVLIET, NY 12189-4050 OF ADDRESS CHANGES.
TECHNICAL REPORT EXTERNAL DISTRIBUTION LIST (CONT'D)
NO. OF NO. OFCOPIES COPIES
COMMANDER WRIGHT LABORATORYU.S. ARMY RESEARCH OFFICE ARMAMENT DIRECTORATEATTN: CHIEF, IPO 1 ATTN: WL/MNMP.O. BOX 12211 EGLIN AFB, FL 32542-6810RESEARCH TRIANGLE PARK, NC 27709-2211
WRIGHT LABORATORYDIRECTOR ARMAMENT DIRECTORATEU.S. NAVAL RESEARCH LABORATORY ATTN: WL/MNMFATTN: MATERIALS SCI & TECH DIV 1 EGLIN AFB, FL 32542-6810
CODE 26-27 (DOC LIBRARY) 1WASHINGTON, D.C. 20375
NOTE: PLEASE NOTIFY COMMANDER, ARMAMENT RESEARCH, DEVELOPMENT, AND ENGINEERING CENTER,BENAT LABORATORIES, CCAC, U.S. ARMY TANK-AUTOMOTIVE AND ARMAMENTS COMMAND,
AMSTA-AR-CCB-O, WATERVLIET, NY 12189-4050 OF ADDRESS CHANGES.