Embed Size (px)
Citation preview
Saija-Riitta Pasanen
Internal Supply Chain: Process and Performance Measurement Development
Helsinki Metropolia University of Applied Sciences
Master of Business Administration
Business Informatics
Thesis
2015
Abstract
Author Title Number of Pages Date
Saija-Riitta Pasanen Internal Supply Chain: Process and Performance Measurement Development 77 pages + 1 appendix
Degree Master of Business Administration
Degree Programme Master’s Degree Programme in Business Informatics
Specialisation option
Instructor(s) Antti Hovi, Senior Lecturer
This thesis describes the development project of the case company’s internal supply chain. The case company is a Finnish family-owned company manufacturing and importing consumer and professional goods as well as functioning as an agency for large international companies, small and middle sized industrial companies and wholesalers. The purpose of the project was to develop specifically the internal supply chain of the own manufactured products and the performance measurement for it. The project goals were divided into two subprojects and main objectives: creating the internal production and supply chain process description and measurement tools for the process; and developing the production planning system by transferring the internal sales forecasts straight to the system without manual processing in between systems. The literature review and theoretical framework consist of wide material around the main themes of supply chain management, supply chain management processes and supply chain performance measurement. Both qualitative and quantitative data was collected and used on the decision making process. The project data was collected from the company’s quality system, individual departments’ documents, internal discussions and the SAP reporting system. The project produced the process description for own production and supply chain in the company’s quality system. The following key performance indicators were chosen to quide, develop, ensure quality and measure performance in the main process: forecasting accuracy, internal delivery accuracy, stock reach follow up, stock value follow up and customer delivery accuracy. The project laid the foundation for further development. Ensuring a continuous target- oriented measurement follow up, improving the internal co-operation on all cross-functional levels as well as creating more efficient and transparent use of information systems remain to be central challenges within the internal supply chain.
Keywords Supply chain management, Supply chain management pro-cesses, Supply chain performance measurement
Contents
1 Introduction 1
1.1 Background – the Case Company Project 1
1.2 Goals, Objectives and Scope 2
1.3 Project Goals and Current State Analysis 3
1.4 Thesis Structure and Research Methods 6
1.4.1 Thesis Structure 6
1.4.2 Project Management Tools and Data Collection 7
2 Literature Review 11
2.1 Supply Chain Management 11
2.1.1 Supply Chain 11
2.1.2 Internal Supply Chain 13
2.1.3 Supply Chain Management 14
2.1.4 Supply Chain Integration 17
2.1.5 Benefits of Supply Chain Management 18
2.1.6 Challenges of Supply Chain Management 20
2.1.7 Supply Chain Management Skills 21
2.2 Supply Chain Management Processes 22
2.2.1 Customer Relationship Management 26
2.2.2 Customer Service Management 27
2.2.3 Demand Management 28
2.2.4 Order Fullfilment 30
2.2.5 Manufacturing Flow Management 31
2.2.6 Supplier Relationship Management 33
2.2.7 Product Development and Commercialization 34
2.2.8 Returns Management 36
2.2.9 Successful Supply Chain Development 37
2.3 Supply Chain Performance Measurement 38
2.3.1 SCOR – The Supply Chain Operations Reference 44
2.3.2 BSC - The Balanced Scorecard 52
2.3.3 Benchmarking 55
2.3.4 ABC Analysis 57
2.3.5 Designing Performance Measurement 57
2.4 Conclusions of the Literature Review 59
3 Project Progress 60
3.1 Developing the Process and Process Performance Measurement Tools 60
3.1.1 Product in an Internal Supply Chain 61
3.1.2 Existing Processes and Measurement Tools 64
3.1.3 New Measurement Tools for the Main Process 66
3.1.4 Final Process Description 71
3.2 Developing the Production Planning System 72
4 Analysis and Conclusions 73
4.1 Project Results 73
4.2 Practical Impacts of the Project 76
4.3 Conclusions and Further Development 76
References 78
Books 78
Articles 78
Webdocuments 81
Webpages 81
Appendices
Appendix 1. Main Process Description for Own Production Product- and Supply Chain
1
1 Introduction
1.1 Background – the Case Company Project
This thesis will focus on internal supply chain development. The development work was
executed as a project and this thesis will bring together the results of the project as well
as offer theoretical framework for the supply chain management, supply chain man-
agement processes and supply chain performance measurement.
The case company is a Finnish family owned company manufacturing and importing
consumer and professional goods as well as functioning as an agency for large interna-
tional companies, small and middle sized industrial companies and wholesalers. The
company was established in 1883, has ca 500 employees and 275M€ turnover in 2014.
The company’s main office and product development centre are located in Helsinki,
while its three production plants are located in Heinävesi. The company has subsidiar-
ies in Sweden and the Baltic Countries.
This thesis concentrates on the internal supply chain of the own manufactured brands.
The company has over 600 items in production and close to 20 brands. The three pro-
duction plants are divided in production; first produces mainly water based hygiene and
cosmetics products, second produces ethanol based hospital products, desinfectants
and car care products and third produces vinegar and vinegar-based products. The
three production plants have ca 50 employees.
The production plants work in cooperation with the sales divisions, product develop-
ment, logistics and procurement department including MDM-team (Master Data Man-
agement). There have been three significant changes in the company during last 2-3
years; the establishment of the centralized procurement department along with a new
product portfolio management and sales forecasting, the establishment of the central-
ized Master Data Management and the establishment of two new production plants. In
hindsight; these large projects did leave some grey areas in processes ultimately re-
sulting in out-of-stock situations and unclear responsibilities.
The out-of-stock situations experienced in spring 2014 resulted in meeting among the
top management including heads of divisions and managing director, factory manager
and HR manager. They decided to set up an internal supply chain development project
and work as a steering group. The project group was named and strict timetable given.
2
1.2 Goals, Objectives and Scope
The steering group’s goals for the project group were:
a) Securing stock availability and customer satisfaction with optimal stock levels
b) Improving the quality and efficiency of the internal supply chain
c) Transferring the Sales Forecasts straight to the production planning system (SAP –
separate module)
d) Developing the supply chain measurement tools and practices for own production
e) Cost savings
f) Minimizing the overlapping work tasks
g) Ensuring the good internal co-operation
The deadline given to the development suggestions was 4,5 months.
The project group’s goals were to fullfill the steering group’s goals in given timeframe.
The project was divided into two subprojects and main objectives:
1. Creating the internal production and supply chain process description and meas-
urement tools for the process
2. Developing the production planning system by transferring the internal sales fore-
casts straight to the system without manual processing in between systems
The development project was limited in describing and developing the existing internal
supply chain’s main process between functions. The other department level processes
were not included and the goal was not to change well-functioning existing processes.
The subcontracting processes regarding own brands were also limited out of the pro-
ject’s scope.
Project’s goal was also to identify different experts within own production chain and if
necessary, to organize further process training. Individual job descriptions unrelated to
the own production processes were also limited out.
The main responsibility of developing the production planning tool was given to the
main users of the system itself, with access to the system and daily use of it in their
work. The project group was to help when needed.
In developing the internal supply chain measurement tools and practices the project
group’s goal was to utilize the existing tools and systems as far as possible. The steer-
ing group’s more precise goal for measuring was to get regular and visible follow up.
3
Very soon after the project group had started the three main focus areas arose:
out-of-stock situations, unclear responsibilities within the internal production and supply
chain and the measurement tools needed.
1.3 Project Goals and Current State Analysis
The steering group’s seven goals were naturally arosen from everyday needs and even
problem situations.
First goal was to secure stock availability and customer satisfaction with optimal stock
levels. There had been out-of-stock situations in spring 2014 in spite of the relatively
high average days of stock and stock value. The customer satisfaction was in danger
and also in some cases there was a threat of penalty fees for late deliveries.
The second goal was improving the quality and efficiency of the internal supply chain.
The company has a quality system in use and the company’s quality certificate ISO
9001:2008 include product development, production functions in own manufacturing
plants as well as selling the finished products, customer service and logistic functions.
Correspondingly the environmental certificate ISO 14001:2004 include product devel-
opment, production functions in own manufacturing plants and logistic functions.
The departmental processes and measurement tools were in most part already de-
scribed in the quality system but the main process that crosses the departmental func-
tions had not been yet described and the internal supply chain was not measured as an
entity of functions.
The third goal of transferring the internal sales forecasts straight to the production
planning system was one very concrete goal. The internal rolling 12-18 month sales
forecasts are monthly updated in SAP reporting system that is a totally separate mod-
ule from production plants SAP system where the production planning is done. The
production planning system also does not have the latest stock data available as the
other module does. For this reason the extra manual updating work with excel needed
to be done before transferring the forecasts and stock data to the production planning
system. In addition to the inefficiency of this practice there is a danger of human error
in manual combining of the sales forecasts, stock data and minimum production batch-
es every month.
4
The fourth goal was developing the supply chain measurement tools and practices for
the own production. As mentioned a few lines before, the company had already several
measurement tools and practices in use along the internal supply chain due to legal
reasons only but also for production profitability view. However, the measurement tools
and practices for measuring the whole internal supply chain’s performance were miss-
ing. The measurement tools for the internal supply chain were also expected to ensure
the smooth flow between departmental functions and to guarantee the right-time avail-
ability for the customers.
The fifth goal of cost savings is normally a reason behind all development projects. In
the internal supply chain context the most visible and easiest measured savings could
come from tied-up capital and warehousing cost development. The savings brought by
more efficient process for example minimising the overlapping work tasks and clearing
the responsibilities is not that easily measured.
The sixth goal was minimising the overlapping work tasks. As mentined before, the
manual excel work between the sales forecasting and production planning system is
clearly inefficient and also somewhat overlapping work task repeated on monthly basis.
Another overlapping tasks were occuring in unclear responsibilities regarding the stock
level follow up, especially in low stock or out-of-stock situations. The sales divisions
thought that it was procurement’s responsibility to function as an informant between
sales and production and procurement had been told that in case of own production
items and not outside supplier situations, the product manager and production plant
should be in straight contact regarding the reasons for delay and expected availability.
At worst, five persons from sales were sending urgent e-mails and calling to factory
manager, factory foreman and procurement planner. One major problem was in this
case also the production system being separate from company’s reporting system and
daily sales and logistics system. There was no direct visibility to production situation
and product availability for others than the production plant personnel.
The seventh goal was ensuring the good internal co-operation. After the major projects
involving the two new factories, establishing the centralized procurement department
and master data management, some gray areas were left in responsibilities and pro-
cesses. The production meeting practices were somehow forgotten along the way and
no department or company level regular meetings took place anymore. Also, the
straight daily communication between relevant parties was diminishing. It is clear that
5
each person working along the process should know with whom to communicate and
how to proceed in certain situations. This is however not easy if there are no given
clear structures, agreed practices and common goals.
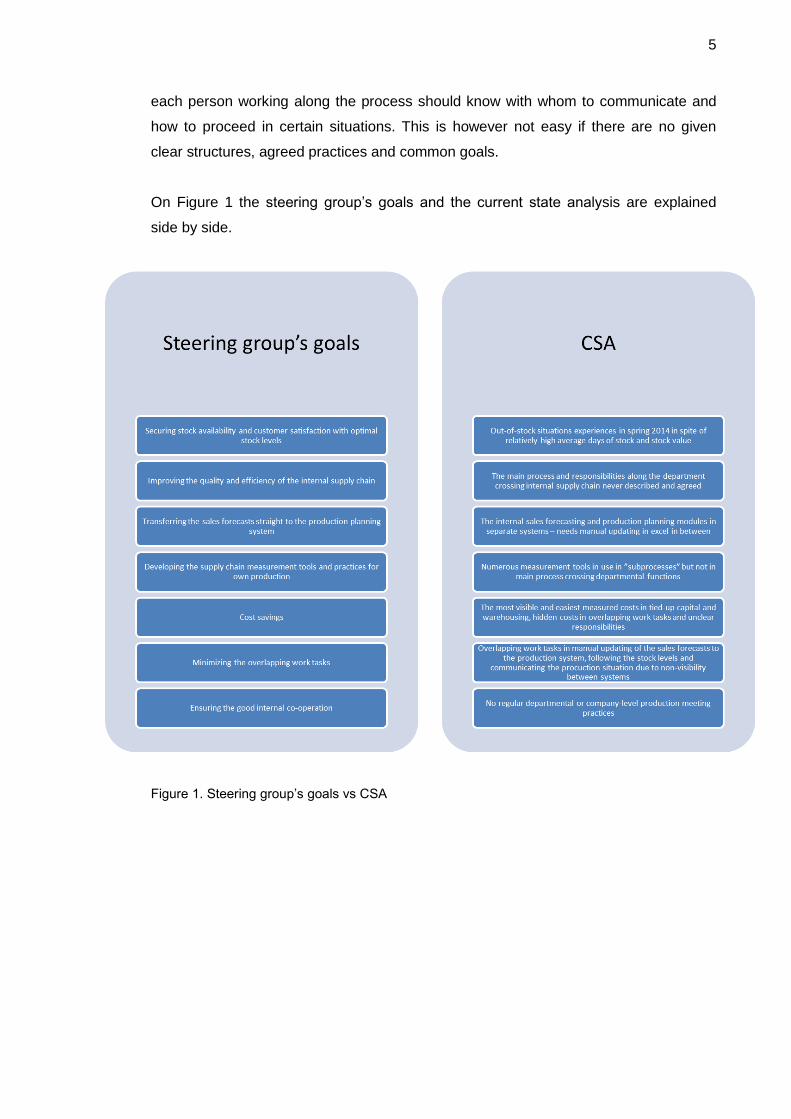
On Figure 1 the steering group’s goals and the current state analysis are explained
side by side.
Figure 1. Steering group’s goals vs CSA
6
1.4 Thesis Structure and Research Methods
1.4.1 Thesis Structure
This thesis starts with introduction to the project background and explains the goals
and objectives based on the steering group’s list of goals and project group’s main ob-
jectives. The current state analysis (CSA) is explained in comparison to steering
group’s goals. The research methods from the project management perspective will
also be discussed in the first chapter.
The second chapter of literature review will provide theoretical framework for the cen-
tral topics of the project under main headings of Supply Chain Management, Supply
Chain Management Processes and Supply Chain Performance Measurement. At the
end of the chapter the literature review will be summarized in the project’s context.
The third chapter will summarize how the project progressed and what were the most
central development needs identified. The development suggestions in form of new
main process description and measurement tools will be explained.
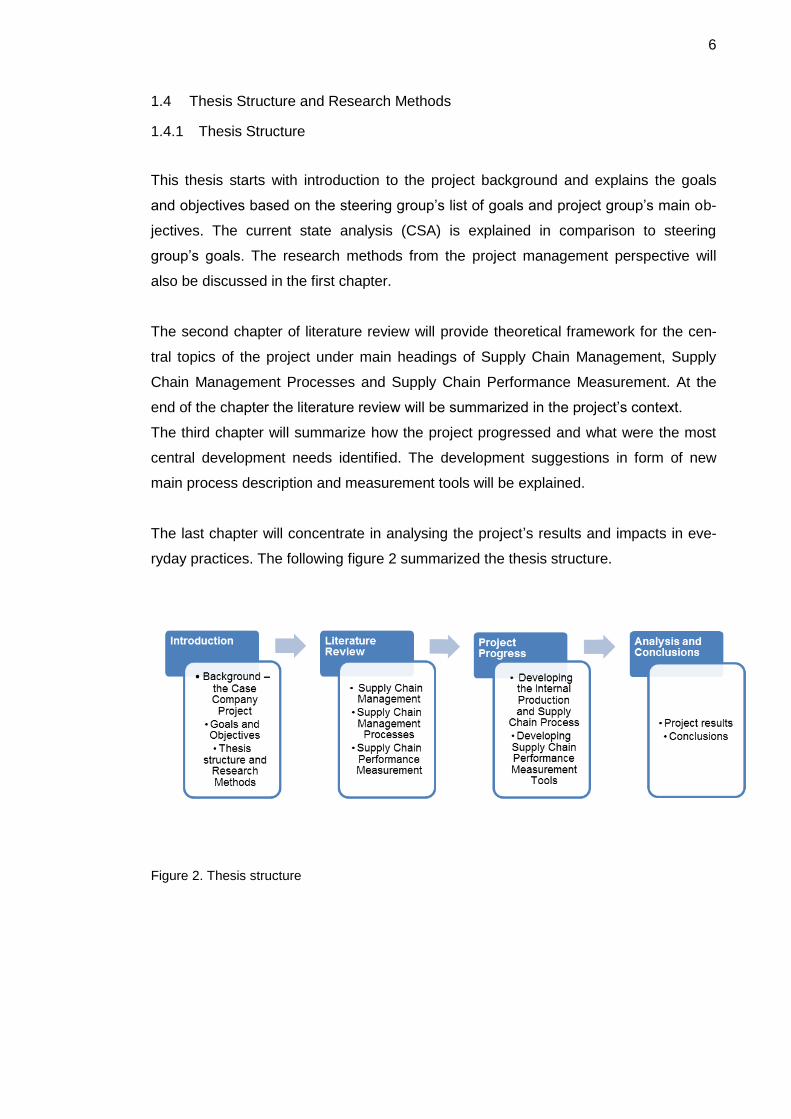
The last chapter will concentrate in analysing the project’s results and impacts in eve-
ryday practices. The following figure 2 summarized the thesis structure.
Figure 2. Thesis structure
7
1.4.2 Project Management Tools and Data Collection
Lester (2007, 5) defines the project management as “the planning, monitoring and con-
trol of all aspects of a project and the motivation of all those involved in it, in order to
achieve the project objectives within agreed criteria of time, cost and performance”.
While the project management can also be seen as management of change, one defi-
nition for a project itself is the following:
A unique set of co-ordinated activities, with definite starting and finishing
points, undertaken by an individual or organization to meet specific objec-
tives within defined schedule, cost and performance parameters.
(Lester, 2007, 1)
A project has a definite starting and finishing point and must meet certain specific ob-
jectives (Lester, 2007, 2). The project objectives must meet three fundamental criteria:
1. The project must be completed in time;
2. The project must be accomplished within the budgeted cost;
3. The project must meet the prescribed quality requirements.
(Lester, 2007, 3)
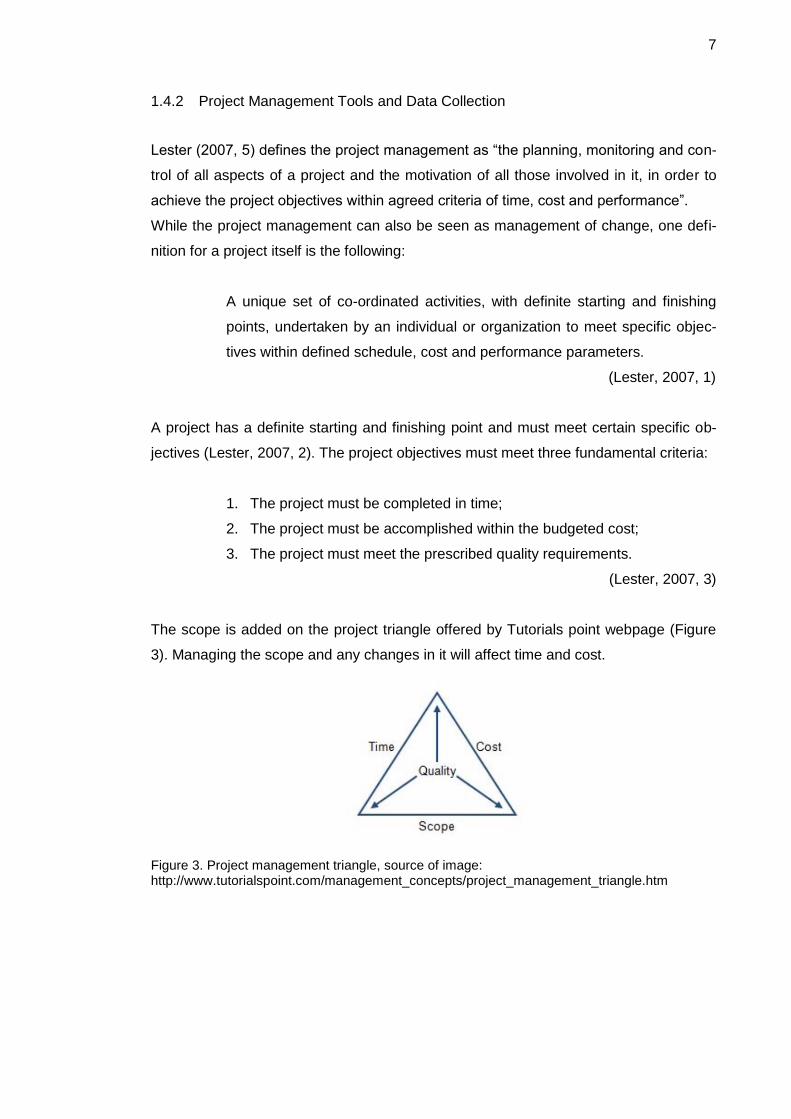
The scope is added on the project triangle offered by Tutorials point webpage (Figure
3). Managing the scope and any changes in it will affect time and cost.
Figure 3. Project management triangle, source of image: http://www.tutorialspoint.com/management_concepts/project_management_triangle.htm
8
Project planning and alignment from the beginning is important. According to Villachica
et al. (2004, 9) “the alignment phase lays the foundation for successful development
and implementation efforts, as well as ensuring that any resulting performance im-
provement interventions positively affect the organization’s bottom line by providing a
positive return on expectations”. Major part of the project alignment is the project plan
specifying the project’s scope of work, estimated costs and schedule (Villachica et
al.,2004, 10). Many of the causes of success or failure lie in the way we develop and
define the project (Morris, 2010, 140). According to Thomsett (2010, 2) “ a project has
to be planned out, defined, and organized before you can know what you are up
against in terms of actual management”.
According to Lester (2007, 61) the project management plan or simply project plan is
one of the key documents required by the project manager and his/her team and the
contents and volume of it depends on the type of the project. The project plan in the
case project was presented for the steering group as a basic Powerpoint presentation.
The plan included the goals of the project (steering group’s and project group’s), the
scope and limitations of the project, the project stages and duration on a timeline, the
roles of individuals listed, the documentation and communications plan, the first version
of the model for the product in the case company’s internal manufacturing and supply
chain, some examples for project success measurement in the light of the steering
group’s goals, the already noticed challenges in the internal co-operation and some
questions for the steering group for decision making and moving on with the project. As
the project was done alongside of each member’s daily work, no actual financial budget
was prepared.
The actual support tools used in the project were the project timeline template, project
meeting template and project communications template. All these as well as all addi-
tional data and meeting materials were saved at company level drive with access for
the steering group and project group from different departments.
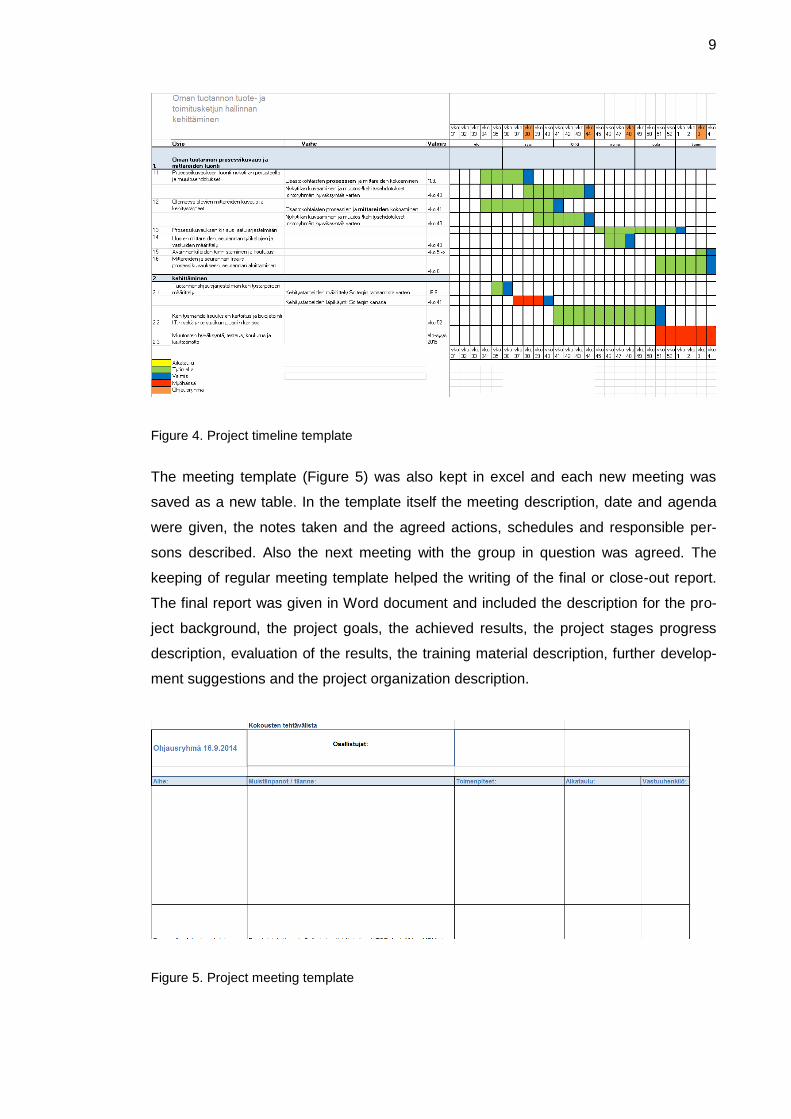
The project timeline template (Figure 4) was kept as simple excel form and the pro-
gress was followed on weekly basis. The partly goals were split so that for each steer-
ing group meeting some results and/or suggestions for decision making would be of-
fered.
9
Figure 4. Project timeline template
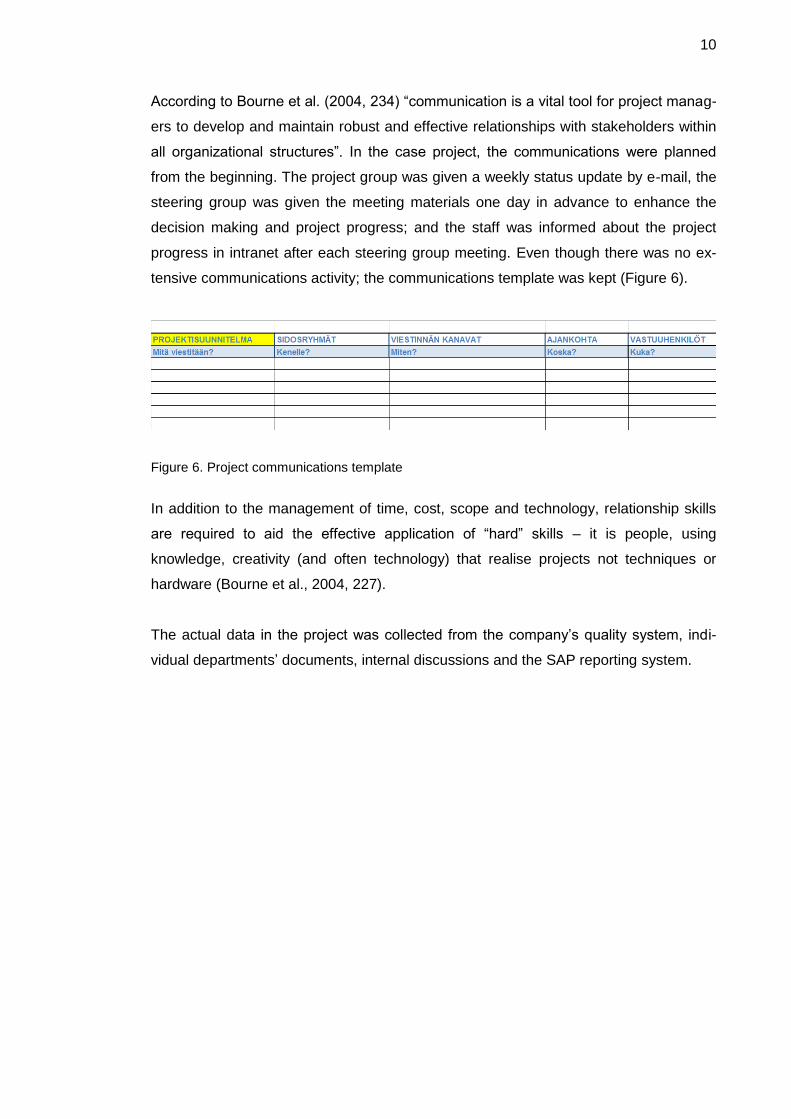
The meeting template (Figure 5) was also kept in excel and each new meeting was
saved as a new table. In the template itself the meeting description, date and agenda
were given, the notes taken and the agreed actions, schedules and responsible per-
sons described. Also the next meeting with the group in question was agreed. The
keeping of regular meeting template helped the writing of the final or close-out report.
The final report was given in Word document and included the description for the pro-
ject background, the project goals, the achieved results, the project stages progress
description, evaluation of the results, the training material description, further develop-
ment suggestions and the project organization description.
Figure 5. Project meeting template
10
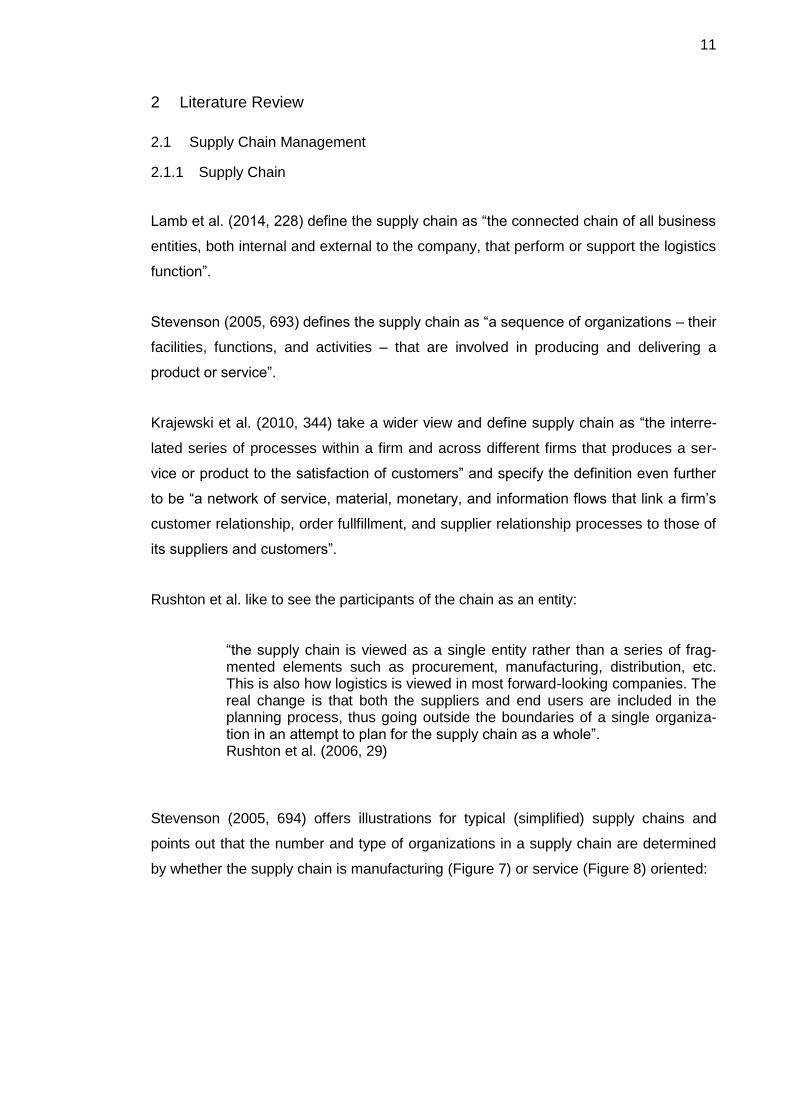
According to Bourne et al. (2004, 234) “communication is a vital tool for project manag-
ers to develop and maintain robust and effective relationships with stakeholders within
all organizational structures”. In the case project, the communications were planned
from the beginning. The project group was given a weekly status update by e-mail, the
steering group was given the meeting materials one day in advance to enhance the
decision making and project progress; and the staff was informed about the project
progress in intranet after each steering group meeting. Even though there was no ex-
tensive communications activity; the communications template was kept (Figure 6).
Figure 6. Project communications template
In addition to the management of time, cost, scope and technology, relationship skills
are required to aid the effective application of “hard” skills – it is people, using
knowledge, creativity (and often technology) that realise projects not techniques or
hardware (Bourne et al., 2004, 227).
The actual data in the project was collected from the company’s quality system, indi-
vidual departments’ documents, internal discussions and the SAP reporting system.
11
2 Literature Review
2.1 Supply Chain Management
2.1.1 Supply Chain
Lamb et al. (2014, 228) define the supply chain as “the connected chain of all business
entities, both internal and external to the company, that perform or support the logistics
function”.
Stevenson (2005, 693) defines the supply chain as “a sequence of organizations – their
facilities, functions, and activities – that are involved in producing and delivering a
product or service”.
Krajewski et al. (2010, 344) take a wider view and define supply chain as “the interre-
lated series of processes within a firm and across different firms that produces a ser-
vice or product to the satisfaction of customers” and specify the definition even further
to be “a network of service, material, monetary, and information flows that link a firm’s
customer relationship, order fullfillment, and supplier relationship processes to those of
its suppliers and customers”.
Rushton et al. like to see the participants of the chain as an entity:
“the supply chain is viewed as a single entity rather than a series of frag-mented elements such as procurement, manufacturing, distribution, etc. This is also how logistics is viewed in most forward-looking companies. The real change is that both the suppliers and end users are included in the planning process, thus going outside the boundaries of a single organiza-tion in an attempt to plan for the supply chain as a whole”. Rushton et al. (2006, 29)
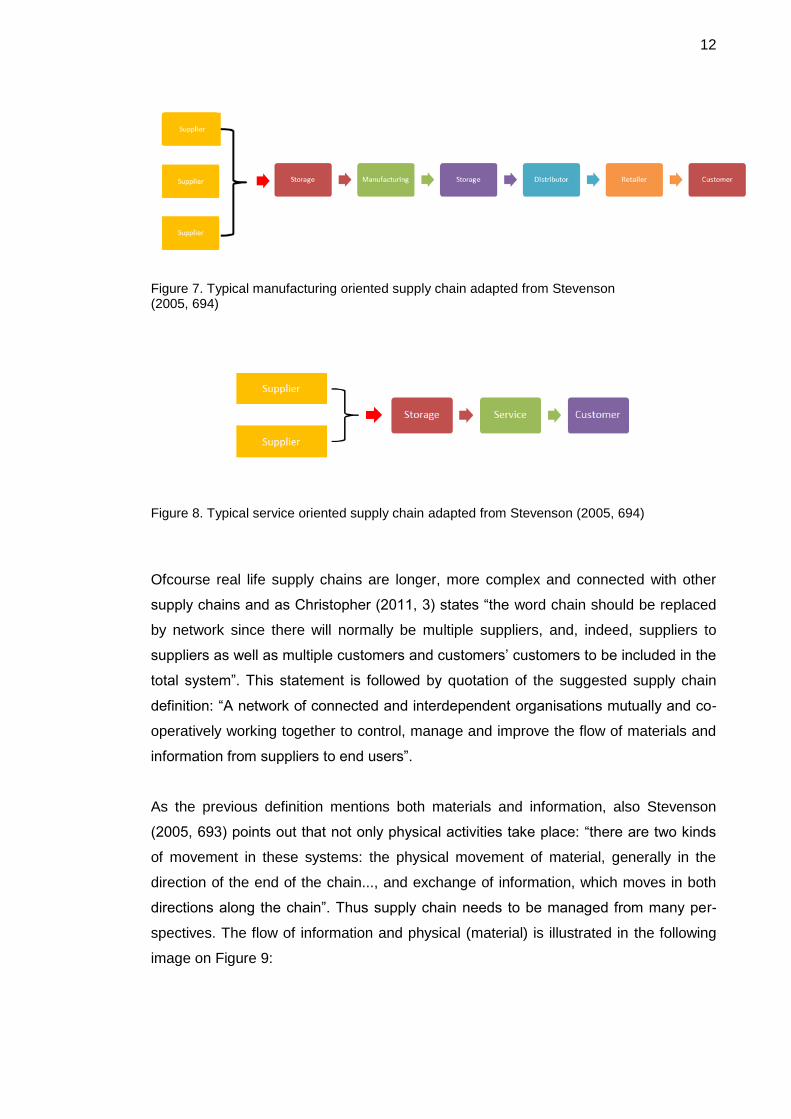
Stevenson (2005, 694) offers illustrations for typical (simplified) supply chains and
points out that the number and type of organizations in a supply chain are determined
by whether the supply chain is manufacturing (Figure 7) or service (Figure 8) oriented:
12
Figure 7. Typical manufacturing oriented supply chain adapted from Stevenson (2005, 694)
Figure 8. Typical service oriented supply chain adapted from Stevenson (2005, 694)
Ofcourse real life supply chains are longer, more complex and connected with other
supply chains and as Christopher (2011, 3) states “the word chain should be replaced
by network since there will normally be multiple suppliers, and, indeed, suppliers to
suppliers as well as multiple customers and customers’ customers to be included in the
total system”. This statement is followed by quotation of the suggested supply chain
definition: “A network of connected and interdependent organisations mutually and co-
operatively working together to control, manage and improve the flow of materials and
information from suppliers to end users”.
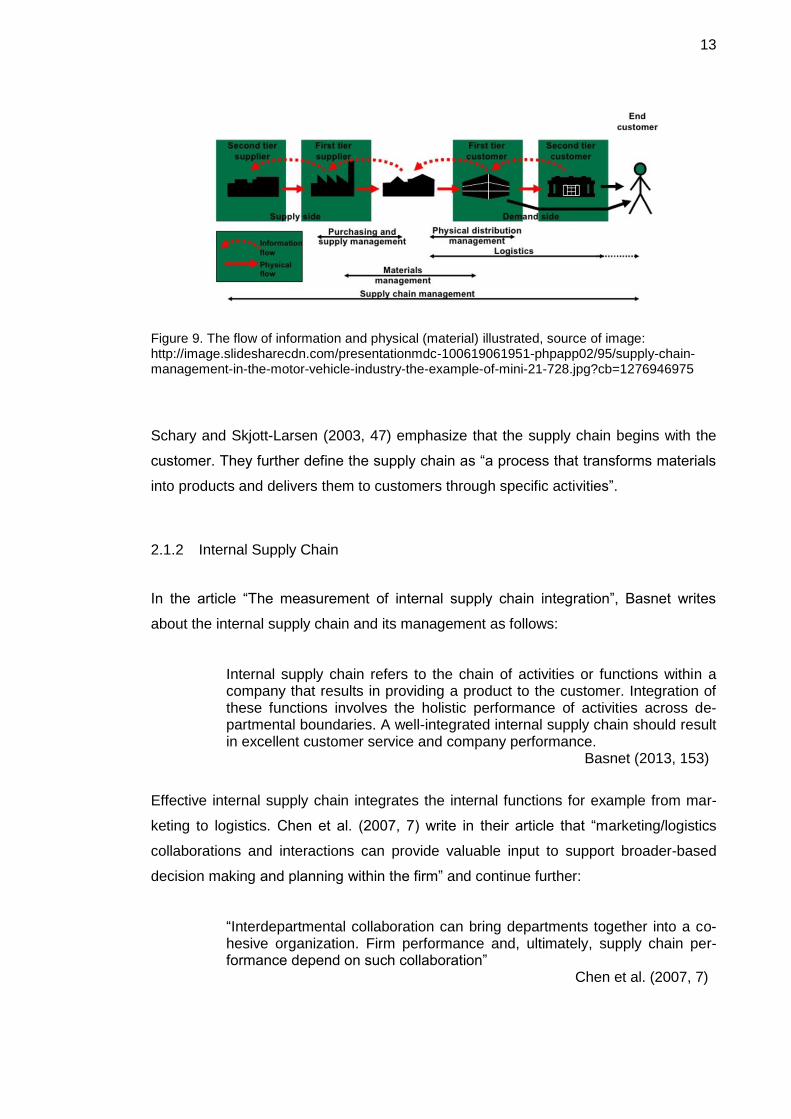
As the previous definition mentions both materials and information, also Stevenson
(2005, 693) points out that not only physical activities take place: “there are two kinds
of movement in these systems: the physical movement of material, generally in the
direction of the end of the chain..., and exchange of information, which moves in both
directions along the chain”. Thus supply chain needs to be managed from many per-
spectives. The flow of information and physical (material) is illustrated in the following
image on Figure 9:
13
Figure 9. The flow of information and physical (material) illustrated, source of image: http://image.slidesharecdn.com/presentationmdc-100619061951-phpapp02/95/supply-chain-management-in-the-motor-vehicle-industry-the-example-of-mini-21-728.jpg?cb=1276946975
Schary and Skjott-Larsen (2003, 47) emphasize that the supply chain begins with the
customer. They further define the supply chain as “a process that transforms materials
into products and delivers them to customers through specific activities”.
2.1.2 Internal Supply Chain
In the article “The measurement of internal supply chain integration”, Basnet writes
about the internal supply chain and its management as follows:
Internal supply chain refers to the chain of activities or functions within a company that results in providing a product to the customer. Integration of these functions involves the holistic performance of activities across de-partmental boundaries. A well-integrated internal supply chain should result in excellent customer service and company performance. Basnet (2013, 153)
Effective internal supply chain integrates the internal functions for example from mar-
keting to logistics. Chen et al. (2007, 7) write in their article that “marketing/logistics
collaborations and interactions can provide valuable input to support broader-based
decision making and planning within the firm” and continue further:
“Interdepartmental collaboration can bring departments together into a co-hesive organization. Firm performance and, ultimately, supply chain per-formance depend on such collaboration” Chen et al. (2007, 7)
14
Companies should achieve internal integration before implementing supply chain man-
agement that will eventually include other supply chain partners. According to Gimenez
et al. (2005, 32) “internal integration has a positive effect on external integration be-
cause coordination among internal functions facilitates coordination among different
companies”. Gimenez et al. (2005, 33) however remind that “SCM is not easy to set-
up: there can be internal barriers to change processes, and there can also be difficul-
ties to shifting from traditional arms-length or even adversarial attitudes to a partnership
perspective”. Burt et al. (2010, 529) write about the internal integration as follows: “the
first priority of a business enterprise is to integrate and optimize its own operations
before making any attempt to extend supply chain rationalization to external organiza-
tions” and “the internal customers need to acknowledge the presence of the supply
management organization when they are implementing the product development and
planning process”.
Ellinger et al. (2000, 14) found in their study that collaborative behaviour positively im-
pacts effective interdepartmental relations. However, “unless participants in the pro-
cess see value in the information that is exchanged and are somehow motivated to use
it, increasing the amount of information may be somewhat worthless” (Ellinger et al,
2000, 15).
Schary et al. (2003, 101) write that the strenght of the supply chain is in interorganiza-
tional relationships and that “the ability to assess and establish these relationships will
govern the future actions of the corporation”.
2.1.3 Supply Chain Management
Rushton et al.(2006, 29) define the supply chain management as “very much a strate-
gic planning process, with a particular emphasis on strategic decision making rather
than on the operational systems”.
Schary et al. (2003, 262) state that “supply chain management establishes strategic
direction, designs the activity and organizational structures and processes to integrate
operations, selects and negotiates with potential partners and monitors operations”.
15
According to Stevenson (2005, 696) “supply chain management involves coordinating
activities across the supply chain. Central to this is taking customer demand and trans-
lating it into corresponding activities at each level of the supply chain”.
Krajewski et al. (2010, 344) define the supply chain management quite clearly as “the
synchronization of the firm’s processes with those of its suppliers and customers to
match the flow of materials, services and information with demand”.
Ellinger et al. (2014, 118) define supply chain management in their article introduction
as “the proactive management of supply chain activities and processes to maximize
customer value and achieve sustainable competitive advantage through the cumulative
effort of multiple entities”.
Lamb et al. (2014, 228) describe that “the goal of supply chain management is to coor-
dinate and integrate all of the activities performed by supply chain members into a
seamless process, from the source to the point of consumption, ultimately giving the
supply managers total visibility of the supply chain both inside and outside the firm”.
This description is followed by more philosophical point of supply chain management:
“by visualizing the entire supply chain, supply chain managers can maximize strengths
and efficiences at each level to balance the supply and demand needs of each member
in the supply chain”.
The definition for the supply chain management by Christopher (2011, 3) takes a very
holistic view in terms of relationships management, customer value and cost-savings
as follows: supply chain management is “the management of upstream and down-
stream relationships with suppliers and customers in order to deliver superior customer
value at less cost to the supply chain as a whole”. It is also argued further by Christo-
pher that “the phrase supply chain management...should really be termed demand
chain management to reflect the fact that the chain should be driven by the market, not
by suppliers”.
Also many other sources underline the fact that the push manufacturing has strongly
changed to pull manufacturing in recent years and even decades, one example as fol-
lows:
16
“in the mass-production era, manufacturers produced standardized prod-ucts that were pushed down through marketing channels to consumers, who were convinced by salespeople to buy whatever was produced. In to-day’s marketplace, however, customers who expect to receive product con-figurations and services matched to their unique needs are driving demand. The focus of businesses has shifted to determining how products and ser-vices are being pulled into the marketplace and partnering with members of the supply chain to enhance the customer value”. Lamb et al. (2014, 228)
According to Krajewski et al. (2010, 344) fundamental to supply chain management is
developing a strategy to mobilize and provide for all the resources in the supply chain
to meet customer demand. The supply chain design is seen as an essential aspect of a
supply chain strategy. Krajewski et al.(2010, 346) describe the fundamental purpose of
the supply chain design for manufacturers to control inventory by managing the flow of
materials.
Schary and Skjott-Larsen (2003, 47) state that there is a fundamental issue in the con-
flict between the process of supply chain and organizational boundaries. The organiza-
tions manage and supply resources, but activities must have both coordinated opera-
tions and physical links to make the supply chain operate. Thus; according to Schary
and Skjott-Larsen, “supply chain management must organize and manage a potentially
worldwide supply and distribution network that delivers a variety of products and ser-
vices that respond directly to customers in global markets”.
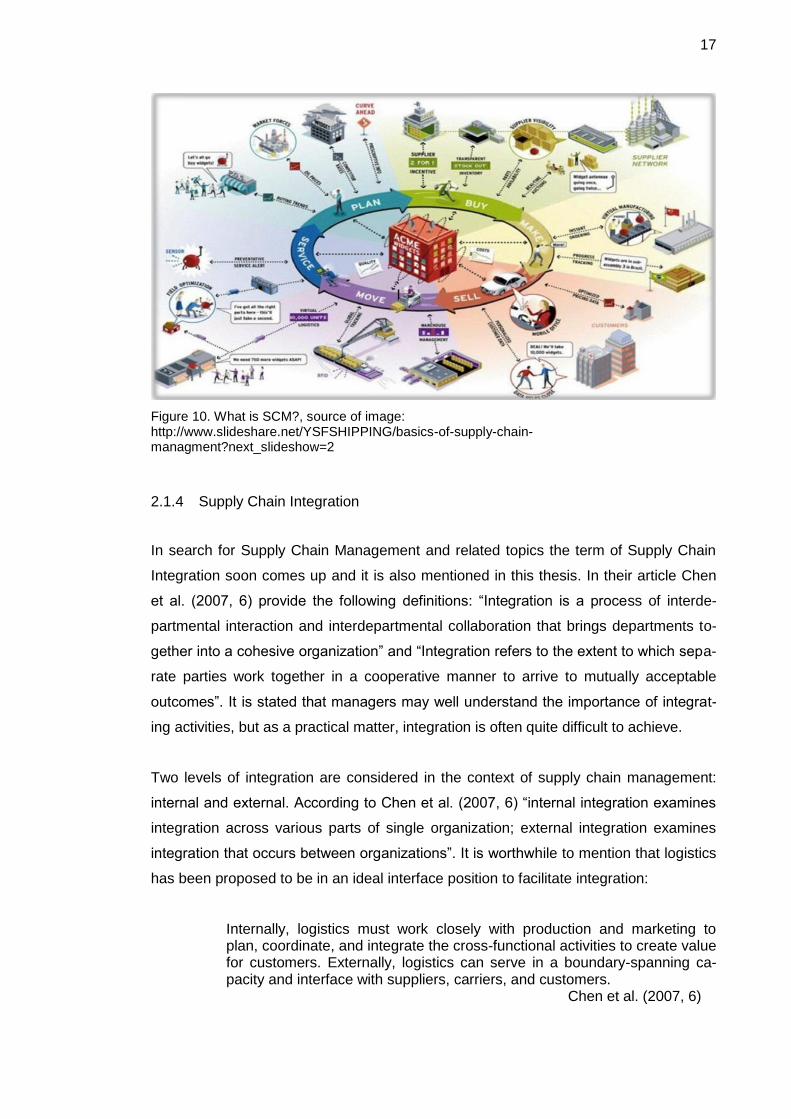
The following image (Figure 10) of SCM focuses on five areas of the supply chain also
known from the supply chain operations reference model (SCOR) which will be dis-
cussed later on the thesis: plan, source (buy), make, deliver (sell/move), and return
(service):
17
Figure 10. What is SCM?, source of image: http://www.slideshare.net/YSFSHIPPING/basics-of-supply-chain-managment?next_slideshow=2
2.1.4 Supply Chain Integration
In search for Supply Chain Management and related topics the term of Supply Chain
Integration soon comes up and it is also mentioned in this thesis. In their article Chen
et al. (2007, 6) provide the following definitions: “Integration is a process of interde-
partmental interaction and interdepartmental collaboration that brings departments to-
gether into a cohesive organization” and “Integration refers to the extent to which sepa-
rate parties work together in a cooperative manner to arrive to mutually acceptable
outcomes”. It is stated that managers may well understand the importance of integrat-
ing activities, but as a practical matter, integration is often quite difficult to achieve.
Two levels of integration are considered in the context of supply chain management:
internal and external. According to Chen et al. (2007, 6) “internal integration examines
integration across various parts of single organization; external integration examines
integration that occurs between organizations”. It is worthwhile to mention that logistics
has been proposed to be in an ideal interface position to facilitate integration:
Internally, logistics must work closely with production and marketing to plan, coordinate, and integrate the cross-functional activities to create value for customers. Externally, logistics can serve in a boundary-spanning ca-pacity and interface with suppliers, carriers, and customers. Chen et al. (2007, 6)
18
Chen et al. (2007, 6), also mention that “it is generally believed that firms achieve a
relatively high degree of internal integration before they attempt to develop a higher
degree of external integration”.
For encouraging a firm-wide cross-fucntional integrated approach, it is important to
create a team-oriented corporate culture as well as long-term commitment. According
to Chen et al. (2007, 15), “the prevalence of a “functional silo” orientation often makes it
difficult to develop cooperative cross-functional teams”. Also, “the compensation sys-
tem and the particular mix of pay components used can send powerful signals to em-
ployees as to the organization’s goals – if different signals are sent to the various func-
tions, coordination will suffer” (Chen et al., 2007, 15).
2.1.5 Benefits of Supply Chain Management
The importance and influence of supply chain management can be seen clearly in the
light of the fact that firms expend up to 75 percent of their revenue on supply chain ac-
tivities (Ellinger et al., 2014, 118).
Stevenson (2005, 696) lists the benefits of effective supply chain management to be
lower inventories, lower costs, higher productivity, greater agility, shorter lead times,
higher profits, and greater customer loyalty.
AlSagheer et al. (2011, 80) have listed the benefits of supply chain integration in their
article “Impact of Supply Chain Integration On Business Performance and Its Challeng-
es”. It is stated that “supply chain integration enhances the process of information shar-
ing within the organization and outside the organization (suppliers, channel partners,
customers and other stakeholders)”. The supply chain integration also “enabled the
organization to do effective business renovation and business process modeling that
increased the efficiency and profitability of a business”. Further “supply chain integra-
tion enabled the organization to gain a sustainable competitive advantage in the mar-
ketplace and it enhances organizational performance by enabling it to reach its goals
and objectives effectively and efficiently”. Supply chain integration “enables the organi-
zation to satisfy the needs and wants of target customers “superiorly” relative to com-
petition and thus customer satisfaction/loyalty increases” providing a sustainable com-
petitive advantage to the organisation. Supply chain integration also enhanced the fi-
19
nancial performance of an organization as well as improved the financial ratios. In the
end, “sales were increased because the firm was in a position to satisfy the needs and
wants of customers superiorly and increased customer loyalty boosted sales reve-
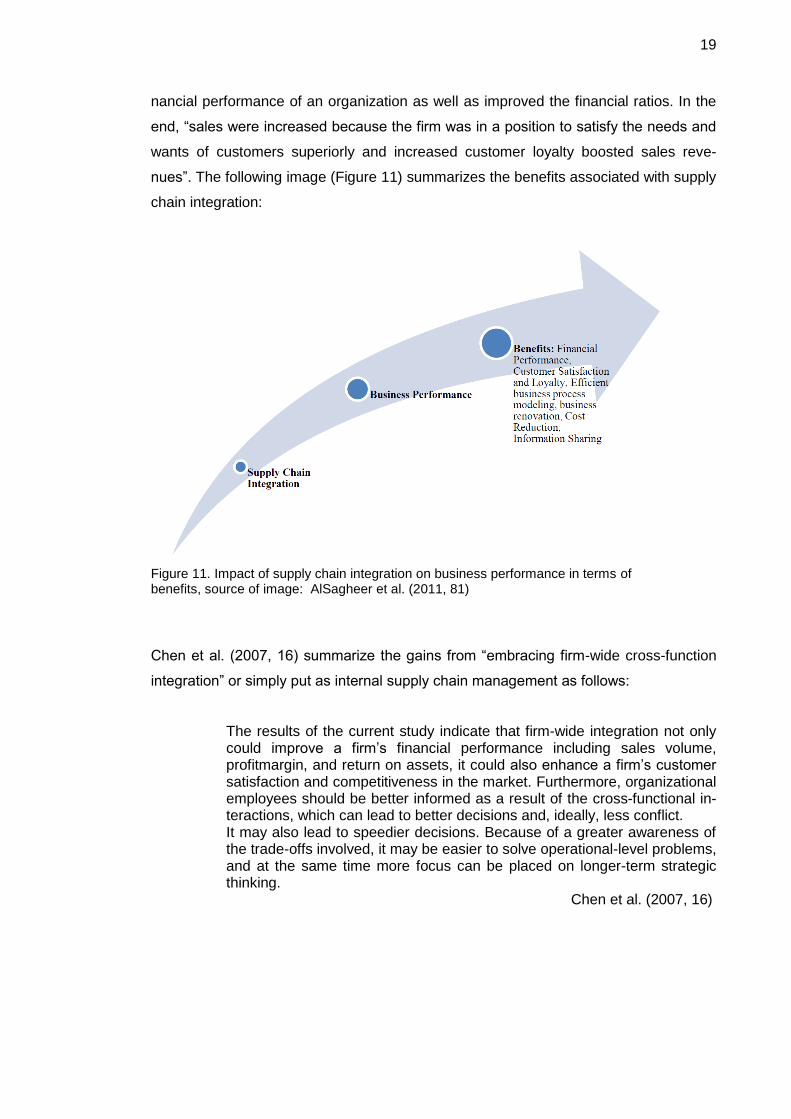
nues”. The following image (Figure 11) summarizes the benefits associated with supply
chain integration:
Figure 11. Impact of supply chain integration on business performance in terms of benefits, source of image: AlSagheer et al. (2011, 81)
Chen et al. (2007, 16) summarize the gains from “embracing firm-wide cross-function
integration” or simply put as internal supply chain management as follows:
The results of the current study indicate that firm-wide integration not only could improve a firm’s financial performance including sales volume, profitmargin, and return on assets, it could also enhance a firm’s customer satisfaction and competitiveness in the market. Furthermore, organizational employees should be better informed as a result of the cross-functional in-teractions, which can lead to better decisions and, ideally, less conflict. It may also lead to speedier decisions. Because of a greater awareness of the trade-offs involved, it may be easier to solve operational-level problems, and at the same time more focus can be placed on longer-term strategic thinking.
Chen et al. (2007, 16)
20
According to Kazemkhanlou et al. (2014, 274), the “effective supply chain management
(SCM) has been associated with a variety of advantages including increased customer
value, increased profitability, reduced cycle times and average inventory levels and
even better product design”.
2.1.6 Challenges of Supply Chain Management
Storey et al. (2006, 766-767) have identified three core enablers and inhibitators for
supply chain management in their study: transparency of information and knowledge;
supply chain behaviour; and performance measurement. For example, they found that
even with existing collaborative planning, forecasting and replenishment practices there
was vulnerability to erosion, revision and withdrawal from the argeed arrangements.
Also, the traditional inter- and intra-organizational boundaries tended to remain intact,
the intra-organizational complexity in responsibilities was usual and promotional activi-
ties were frequently not pre-announced. The use of KPIs was guided by top level busi-
ness objectives or metrics pursued at functional level could at worst jeopardise the per-
formance of the supply chain as a totality and the end customers needs were forgotten.
The further future challenges facing the supply chain management are the trend to-
wards outsourcing, the trend towards fragmentation and variety in product and service
offerings and globalization (Storey et al., 2006, 769-771).
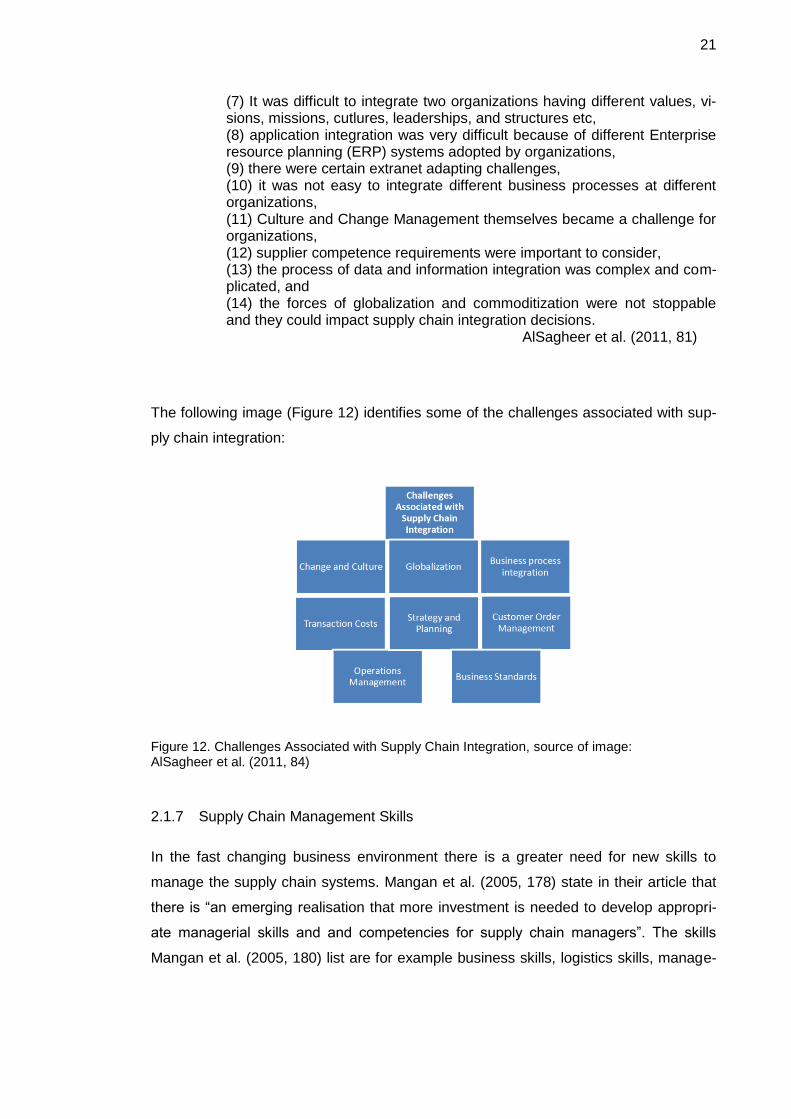
AlSagheer et al. (2011, 81) have listed several concrete examples of challenges in
supply chain integration in their article as follows:
(1) it was essential for an organization to consider supply chain integration strategy as an essential component of business only if it could relate it to its strategy theory and concepts, (2) customer order management was a tough challenge because different value chain partners integrated their supply chains to satisfy the needs and wants of their customers “differently” from competitors for gaining a sus-tainable competitive advantage, (3) Logistics management could cause several challenges for firm integrat-ing their supply chain because different value chain partners had different supply chain or value chain structures with different organizational cultures, (4) Operations flexibility also became a challenge due to organizational dif-ferences when firms wanted to integrate and collaborate, (5) it was difficult to maintain standards in case of organizational differ-ences while integrating supply chains such as size, culture, structure and people etc., (6) procurement management became difficult,
21
(7) It was difficult to integrate two organizations having different values, vi-sions, missions, cutlures, leaderships, and structures etc, (8) application integration was very difficult because of different Enterprise resource planning (ERP) systems adopted by organizations, (9) there were certain extranet adapting challenges, (10) it was not easy to integrate different business processes at different organizations, (11) Culture and Change Management themselves became a challenge for organizations, (12) supplier competence requirements were important to consider, (13) the process of data and information integration was complex and com-plicated, and (14) the forces of globalization and commoditization were not stoppable and they could impact supply chain integration decisions.
AlSagheer et al. (2011, 81)
The following image (Figure 12) identifies some of the challenges associated with sup-
ply chain integration:
Figure 12. Challenges Associated with Supply Chain Integration, source of image: AlSagheer et al. (2011, 84)
2.1.7 Supply Chain Management Skills
In the fast changing business environment there is a greater need for new skills to
manage the supply chain systems. Mangan et al. (2005, 178) state in their article that
there is “an emerging realisation that more investment is needed to develop appropri-
ate managerial skills and and competencies for supply chain managers”. The skills
Mangan et al. (2005, 180) list are for example business skills, logistics skills, manage-
22
ment skills, interpersonal/managerial basic skills, quantitative/technological skills, “SCM
core skills” but summarize it all in form of “significant cross-functional skills”.
Rahman et al. (2014, 276) list in their research findings that the areas the supply chain
managers should devote their attention to are warehousing management, distribution
planning, demand forecasting, negotiation skill, cross-functional coordination skill, and
knowledge of environmental issues in supply chains. Art et al.(2013, 19) discuss the
“new basics of supply chain management” in their article and comment on what are
most important of “the new basics” in rather philosophical way: “the scope and scale of
supply chain management may not be infinite, but like galaxies in our celestial uni-
verse, they will continue to expand”. However, they summon most important factors or
“new basics” under subheadings “The Role of Leadership”, “The New Diversity”,”Green
as a Way of Life”, “We Are All Numbers People”, “Mastering Relationships” and “Strat-
egy and Planning”.
Lorentz et al. (2013, 358) conclude in their research of the current supply chain man-
agement skill development priorities in manufacturing firms (154 manufacturing com-
panies operating in Finland) that top five skills for development are: demand forecast-
ing and supply planning; sourcing and supplier management; customer and distribution
channel management; production planning and control; and information systems for
logistics and production planning. Their research results also show an apparent need
to focus on the development of inter-organisational skills; it seems that the supply chain
management skills with an inter-organisational focus tend to have a higher develop-
ment priority.
It seems that the skills needed to effectively manage the supply chain really are close
to infinite but they definitely are related to the supply chain processes that need to be
managed.
2.2 Supply Chain Management Processes
Process can be defined as “converting inputs into outputs and a way in which all the
resources of an organization are used in a reliable, repeatable and consistent manner
to achieve its goals” (Psomas et al., 2011, 440).
According to Krajewski et al. (2010, 25) all processes have inputs and outputs and in-
clude both external and internal customers as well as external and internal suppliers.
23
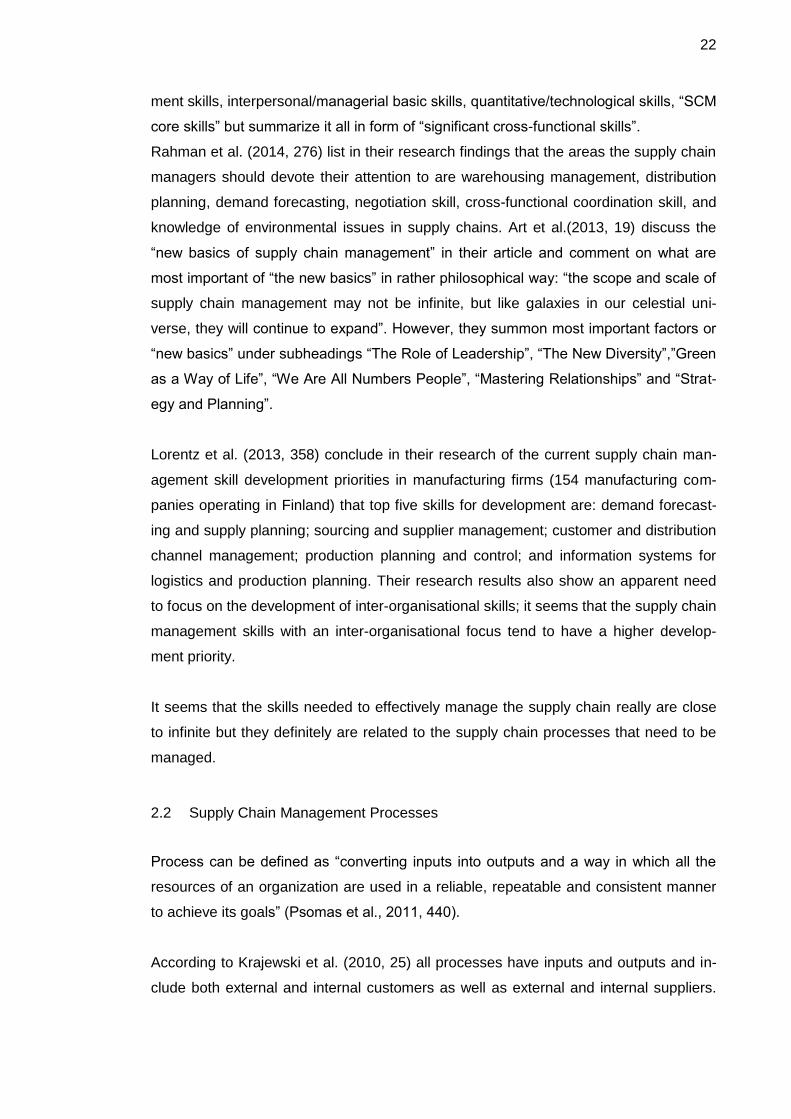
The inputs, such as combination of human resources in form of workers and managers,
capital in form of equipment and facilities, purchased materials and so on go through
processes and operations and become outputs such as goods and services (Figure
13):
Figure 13. Processes and Operations (Krajewski et al., 2010, 25)
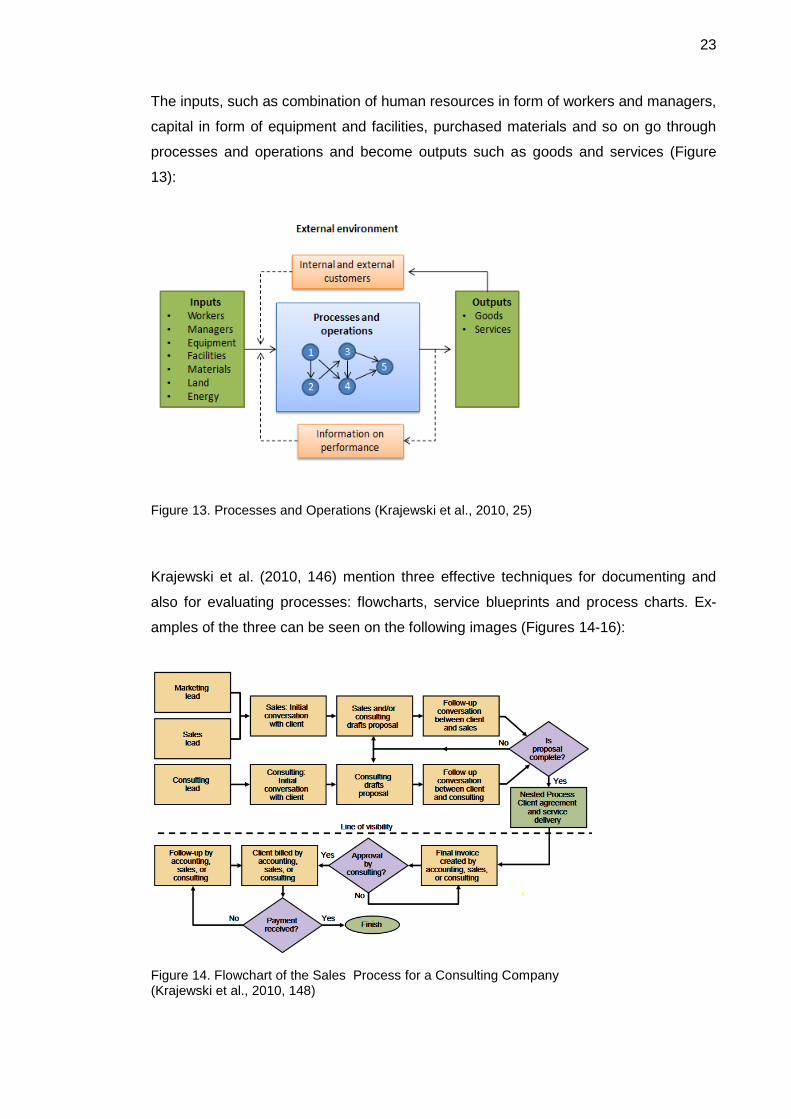
Krajewski et al. (2010, 146) mention three effective techniques for documenting and
also for evaluating processes: flowcharts, service blueprints and process charts. Ex-
amples of the three can be seen on the following images (Figures 14-16):
Figure 14. Flowchart of the Sales Process for a Consulting Company (Krajewski et al., 2010, 148)
24
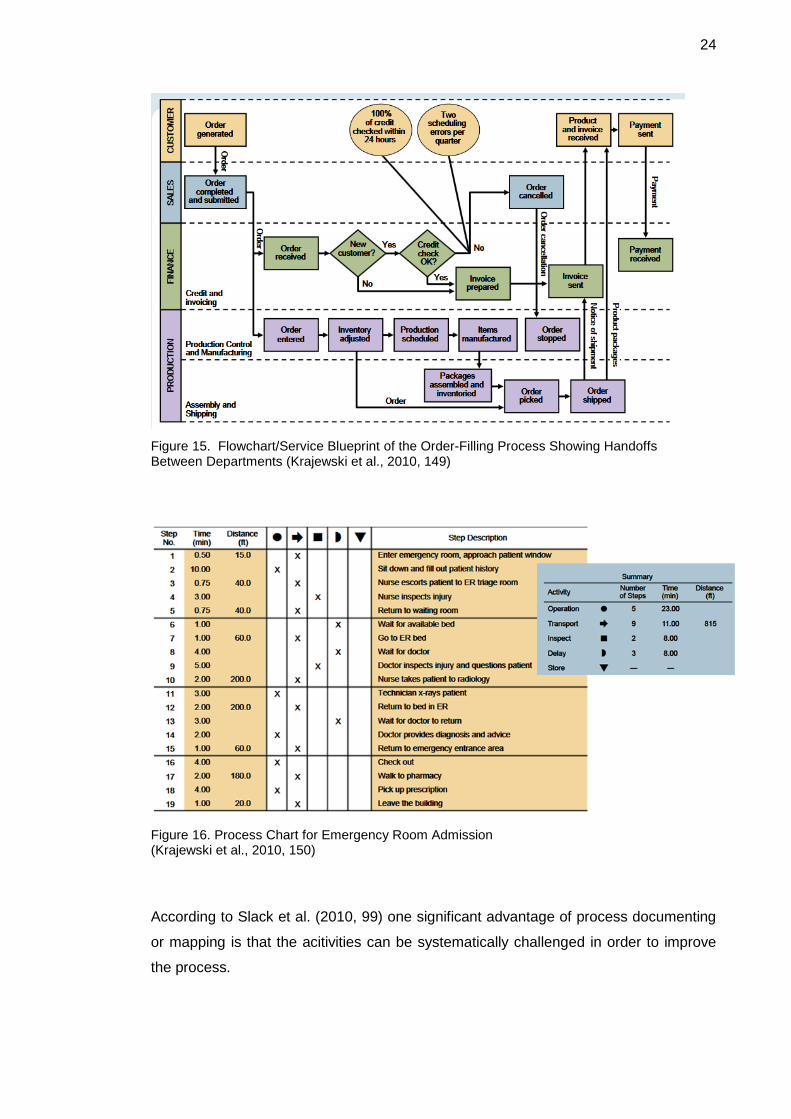
Figure 15. Flowchart/Service Blueprint of the Order-Filling Process Showing Handoffs Between Departments (Krajewski et al., 2010, 149)
Figure 16. Process Chart for Emergency Room Admission (Krajewski et al., 2010, 150)
According to Slack et al. (2010, 99) one significant advantage of process documenting
or mapping is that the acitivities can be systematically challenged in order to improve
the process.
25
One definition for process management is “a structured approach to analyze and con-
tinually improve fundamental activities such as manufacturing, marketing, communica-
tions and other major elements of a company’s operation” (Psomas et al., 2011, 440).
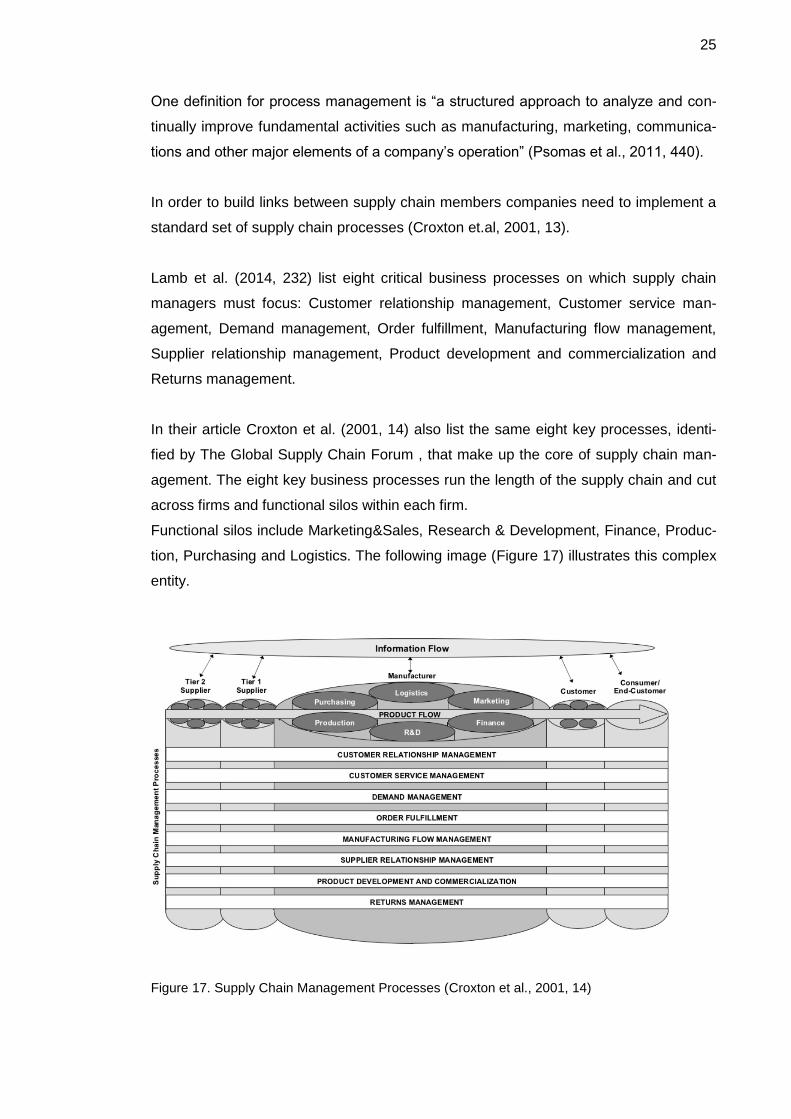
In order to build links between supply chain members companies need to implement a
standard set of supply chain processes (Croxton et.al, 2001, 13).
Lamb et al. (2014, 232) list eight critical business processes on which supply chain
managers must focus: Customer relationship management, Customer service man-
agement, Demand management, Order fulfillment, Manufacturing flow management,
Supplier relationship management, Product development and commercialization and
Returns management.
In their article Croxton et al. (2001, 14) also list the same eight key processes, identi-
fied by The Global Supply Chain Forum , that make up the core of supply chain man-
agement. The eight key business processes run the length of the supply chain and cut
across firms and functional silos within each firm.
Functional silos include Marketing&Sales, Research & Development, Finance, Produc-
tion, Purchasing and Logistics. The following image (Figure 17) illustrates this complex
entity.
Figure 17. Supply Chain Management Processes (Croxton et al., 2001, 14)

26
The eight key business processes will be further explained in the following text. Each
process includes strategic and operational sub-processes and interactions between
processes, functions, and key members of the supply chain.
2.2.1 Customer Relationship Management
The customer relationship management process provides the structure for developing
and maintaining the customer relationships (Croxton et al., 2001, 15). According to
Krajewski et al. (2010, 392) “the purpose of the customer relationship process, which
supports customer relationship management (CRM) programs, is to identify, attract,
and build relationships with customers and to facilitate the transmission and tracking of
orders”.
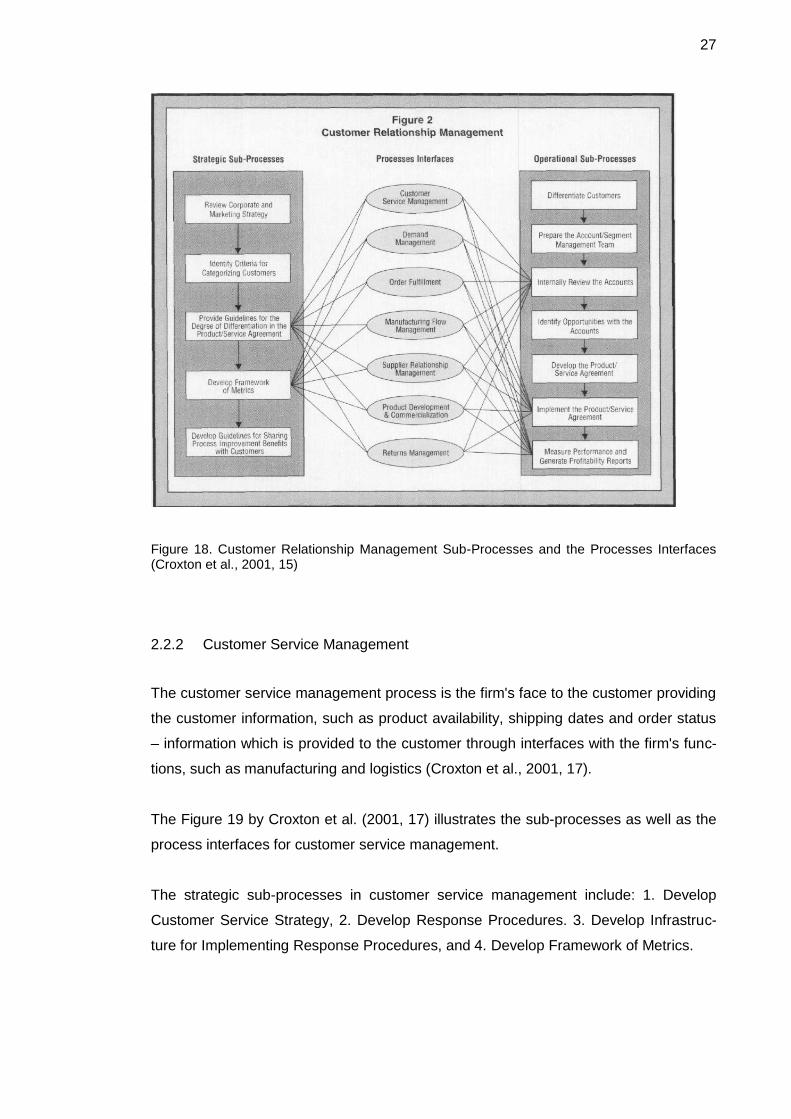
Croxton et al. (2001, 15) introduce the sub-processes as well as the process interfaces
for the customer relationship management in their article (Figure 18).
The strategic sub-processes for customer relationship management include: 1. Review
Corporate and Marketing Strategy, 2. Identify Criteria for Categorising the Customers,
3. Provide Guidelines for the Degree of Differentiation in the Product/Service Agree-
ment, 4. Develop Framework of Metrics, and 5. Develop Guidelines for Sharing Pro-
cess Improvement Benefits with Customers.
The operational sub-processes include: 1. Differentiate Customers, 2. Prepare the Ac-
count/Segment Management Team, 3. Internally Review the Accounts, 4. Identify Op-
portunities with the Accounts, 5. Develop the Product/Service Agreement, 6. Implement
the Product/Service Agreement and 7. Measure Performance and Generate Profitabil-
ity Reports.
27
Figure 18. Customer Relationship Management Sub-Processes and the Processes Interfaces (Croxton et al., 2001, 15)
2.2.2 Customer Service Management
The customer service management process is the firm's face to the customer providing
the customer information, such as product availability, shipping dates and order status
– information which is provided to the customer through interfaces with the firm's func-
tions, such as manufacturing and logistics (Croxton et al., 2001, 17).
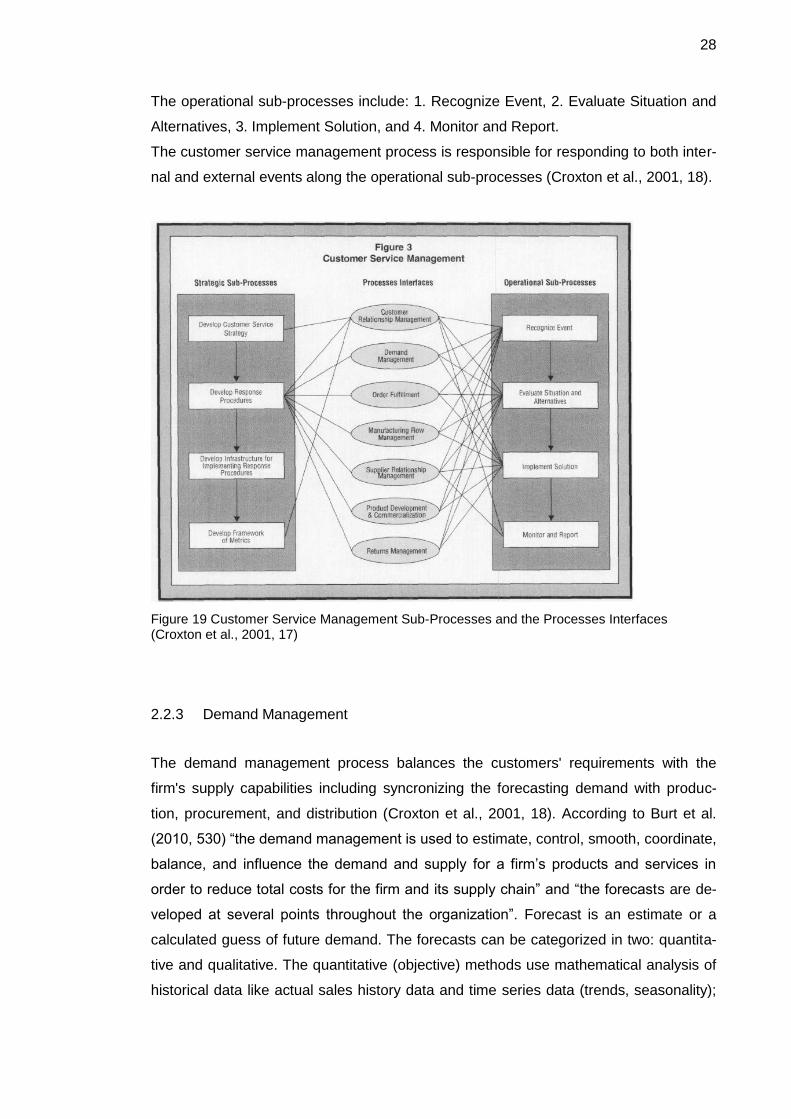
The Figure 19 by Croxton et al. (2001, 17) illustrates the sub-processes as well as the
process interfaces for customer service management.
The strategic sub-processes in customer service management include: 1. Develop
Customer Service Strategy, 2. Develop Response Procedures. 3. Develop Infrastruc-
ture for Implementing Response Procedures, and 4. Develop Framework of Metrics.
28
The operational sub-processes include: 1. Recognize Event, 2. Evaluate Situation and
Alternatives, 3. Implement Solution, and 4. Monitor and Report.
The customer service management process is responsible for responding to both inter-
nal and external events along the operational sub-processes (Croxton et al., 2001, 18).
Figure 19 Customer Service Management Sub-Processes and the Processes Interfaces (Croxton et al., 2001, 17)
2.2.3 Demand Management
The demand management process balances the customers' requirements with the
firm's supply capabilities including syncronizing the forecasting demand with produc-
tion, procurement, and distribution (Croxton et al., 2001, 18). According to Burt et al.
(2010, 530) “the demand management is used to estimate, control, smooth, coordinate,
balance, and influence the demand and supply for a firm’s products and services in
order to reduce total costs for the firm and its supply chain” and “the forecasts are de-
veloped at several points throughout the organization”. Forecast is an estimate or a
calculated guess of future demand. The forecasts can be categorized in two: quantita-
tive and qualitative. The quantitative (objective) methods use mathematical analysis of
historical data like actual sales history data and time series data (trends, seasonality);
29
and the qualitative (subjective) methods use estimates from sources like market sur-
veys, sales force estimations and expert opininons (Burt et al, 2010, 534 and Nahmias,
2001, 57-58).
Nahmias (2001, 57) has listed some characteristics of forecast as follows: 1. They are
usually wrong – the planning system should be sufficiently robust to be able to react to
unanticipated forecast errors, 2. A good forecast is more than a single number – a
good forecast also includes some measure of the anticipated forecast error, 3. Aggre-
gate forecasts are more accurate – the error made in forecasting sales for an entire
product line is generally less than the error made in forecasting sales for an individual
item, 4. The longer the forecast horizon, the less accurate the forecast will be, and 5.
Forecasts should not be used to the exclusion of known information – there may be
information available concerning the future demand that is not presented in the past
history.
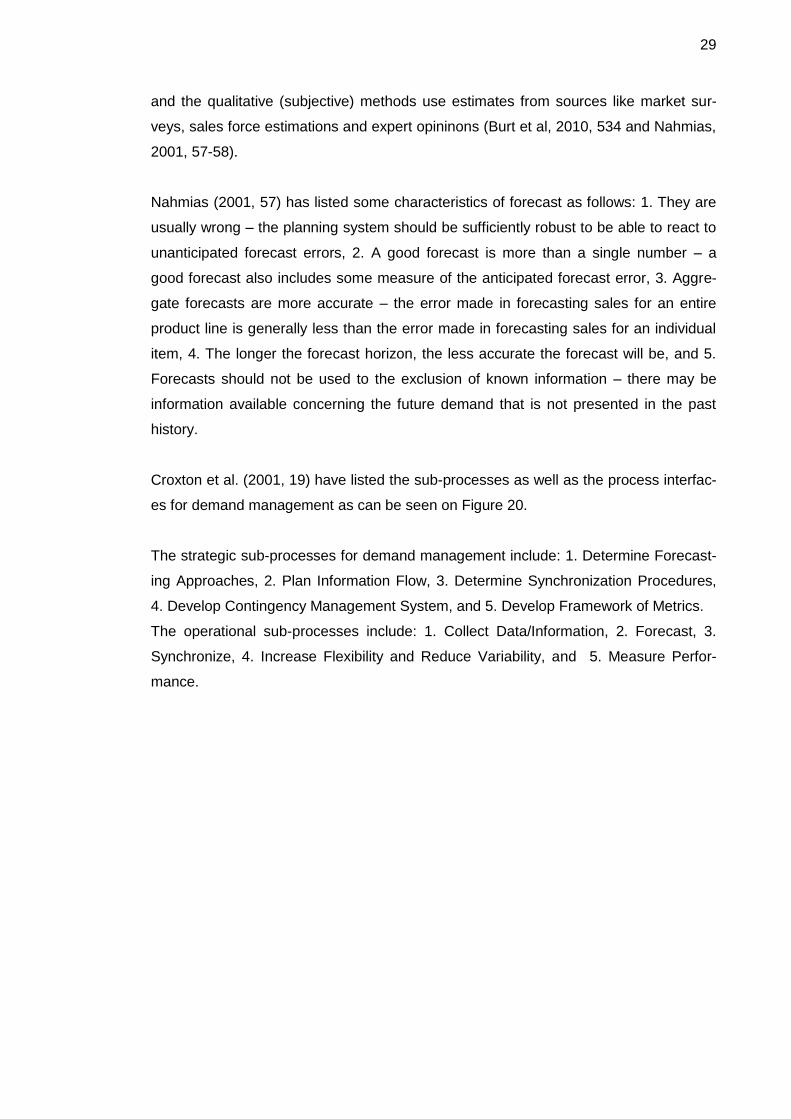
Croxton et al. (2001, 19) have listed the sub-processes as well as the process interfac-
es for demand management as can be seen on Figure 20.
The strategic sub-processes for demand management include: 1. Determine Forecast-
ing Approaches, 2. Plan Information Flow, 3. Determine Synchronization Procedures,
4. Develop Contingency Management System, and 5. Develop Framework of Metrics.
The operational sub-processes include: 1. Collect Data/Information, 2. Forecast, 3.
Synchronize, 4. Increase Flexibility and Reduce Variability, and 5. Measure Perfor-
mance.
30
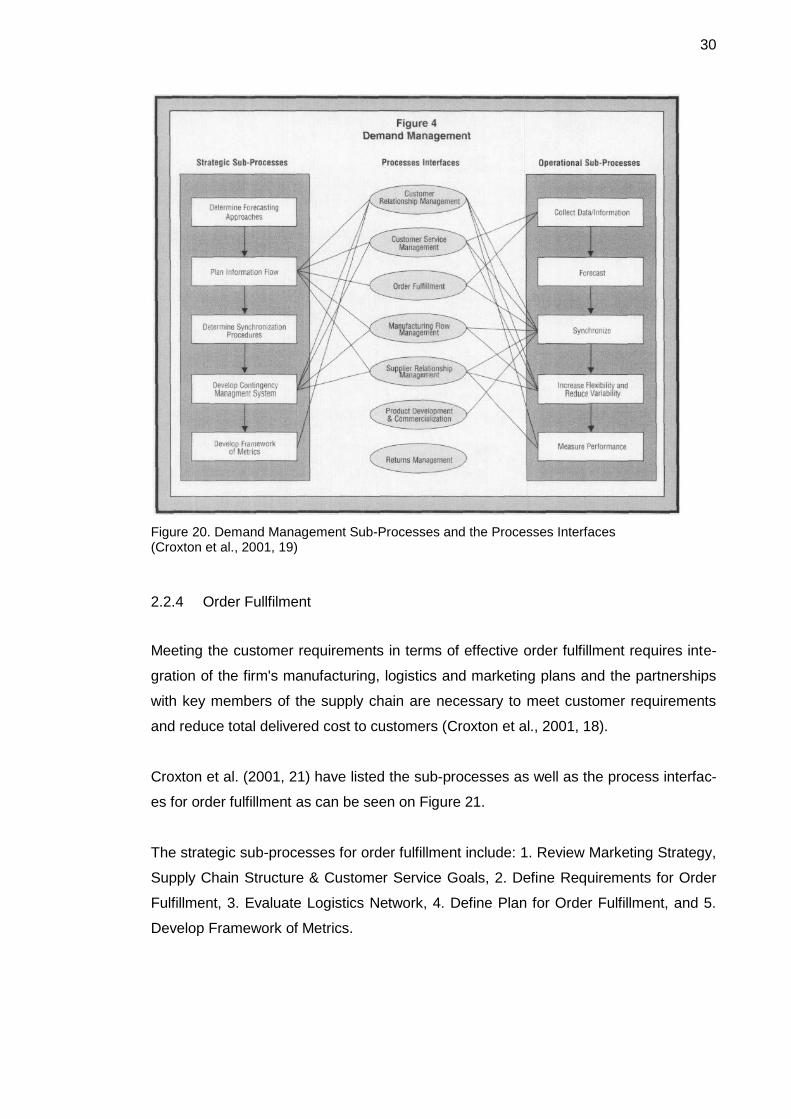
Figure 20. Demand Management Sub-Processes and the Processes Interfaces (Croxton et al., 2001, 19)
2.2.4 Order Fullfilment
Meeting the customer requirements in terms of effective order fulfillment requires inte-
gration of the firm's manufacturing, logistics and marketing plans and the partnerships
with key members of the supply chain are necessary to meet customer requirements
and reduce total delivered cost to customers (Croxton et al., 2001, 18).
Croxton et al. (2001, 21) have listed the sub-processes as well as the process interfac-
es for order fulfillment as can be seen on Figure 21.
The strategic sub-processes for order fulfillment include: 1. Review Marketing Strategy,
Supply Chain Structure & Customer Service Goals, 2. Define Requirements for Order
Fulfillment, 3. Evaluate Logistics Network, 4. Define Plan for Order Fulfillment, and 5.
Develop Framework of Metrics.
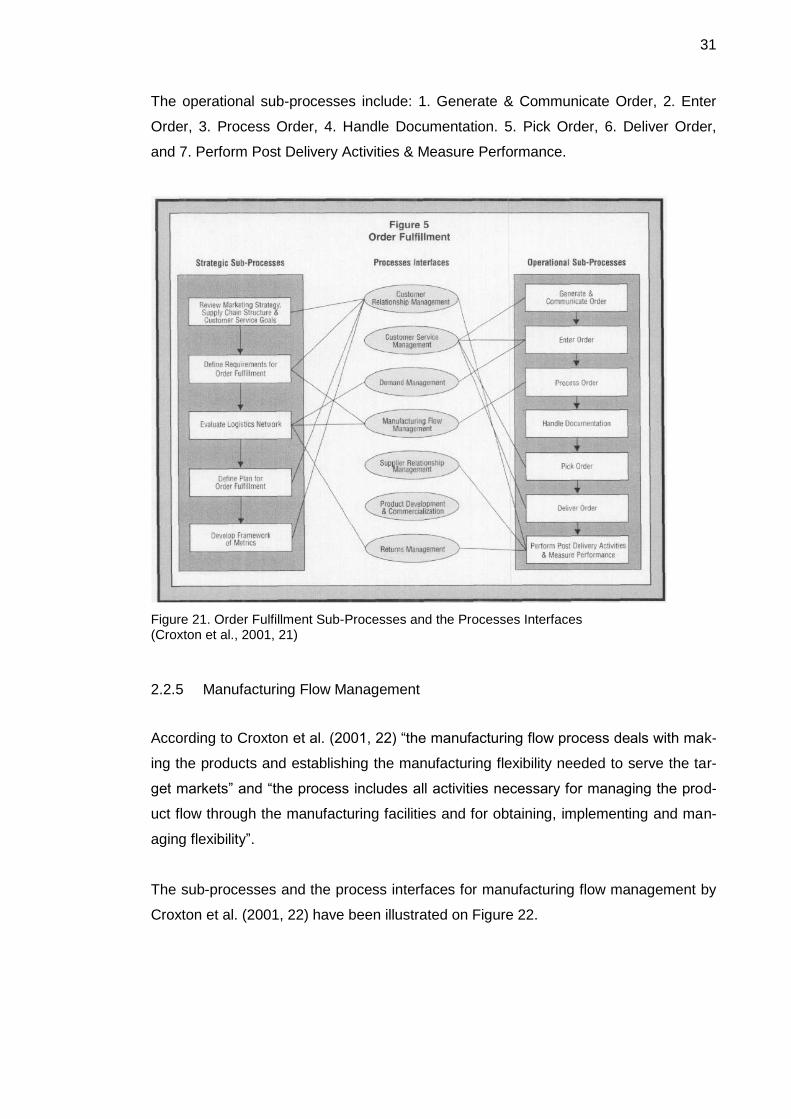
31
The operational sub-processes include: 1. Generate & Communicate Order, 2. Enter
Order, 3. Process Order, 4. Handle Documentation. 5. Pick Order, 6. Deliver Order,
and 7. Perform Post Delivery Activities & Measure Performance.
Figure 21. Order Fulfillment Sub-Processes and the Processes Interfaces (Croxton et al., 2001, 21)
2.2.5 Manufacturing Flow Management
According to Croxton et al. (2001, 22) “the manufacturing flow process deals with mak-
ing the products and establishing the manufacturing flexibility needed to serve the tar-
get markets” and “the process includes all activities necessary for managing the prod-
uct flow through the manufacturing facilities and for obtaining, implementing and man-
aging flexibility”.
The sub-processes and the process interfaces for manufacturing flow management by
Croxton et al. (2001, 22) have been illustrated on Figure 22.
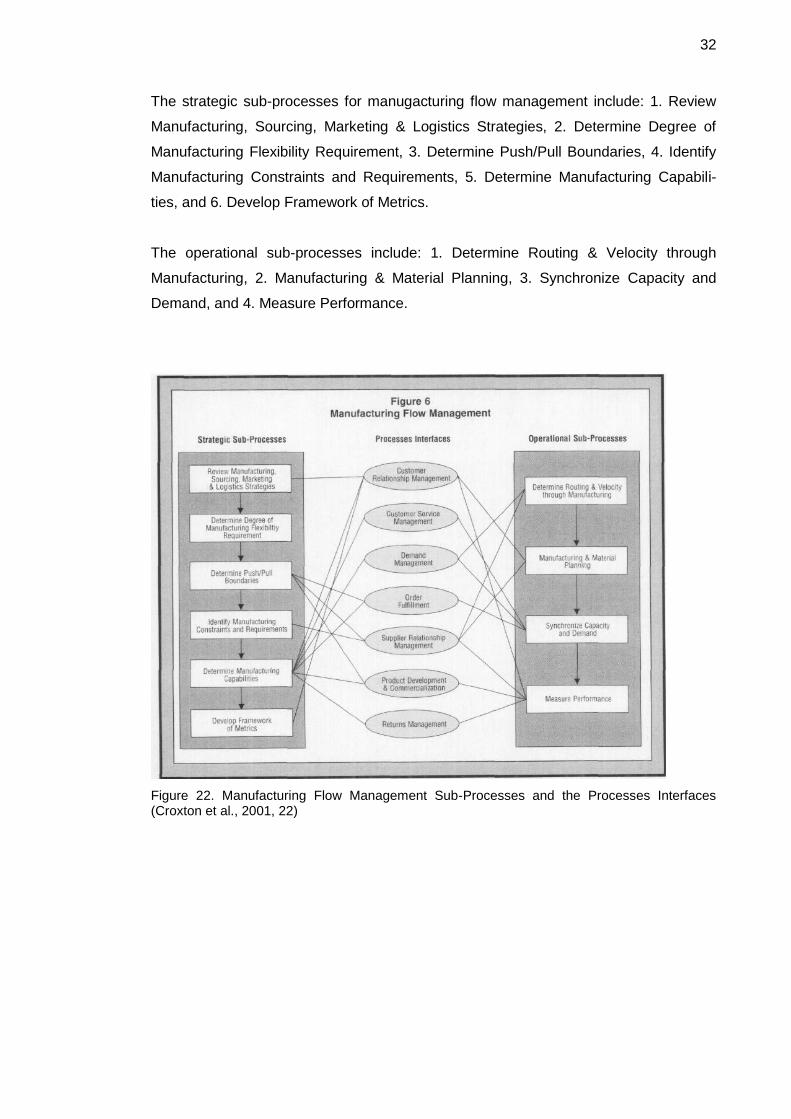
32
The strategic sub-processes for manugacturing flow management include: 1. Review
Manufacturing, Sourcing, Marketing & Logistics Strategies, 2. Determine Degree of
Manufacturing Flexibility Requirement, 3. Determine Push/Pull Boundaries, 4. Identify
Manufacturing Constraints and Requirements, 5. Determine Manufacturing Capabili-
ties, and 6. Develop Framework of Metrics.
The operational sub-processes include: 1. Determine Routing & Velocity through
Manufacturing, 2. Manufacturing & Material Planning, 3. Synchronize Capacity and
Demand, and 4. Measure Performance.
Figure 22. Manufacturing Flow Management Sub-Processes and the Processes Interfaces (Croxton et al., 2001, 22)
33
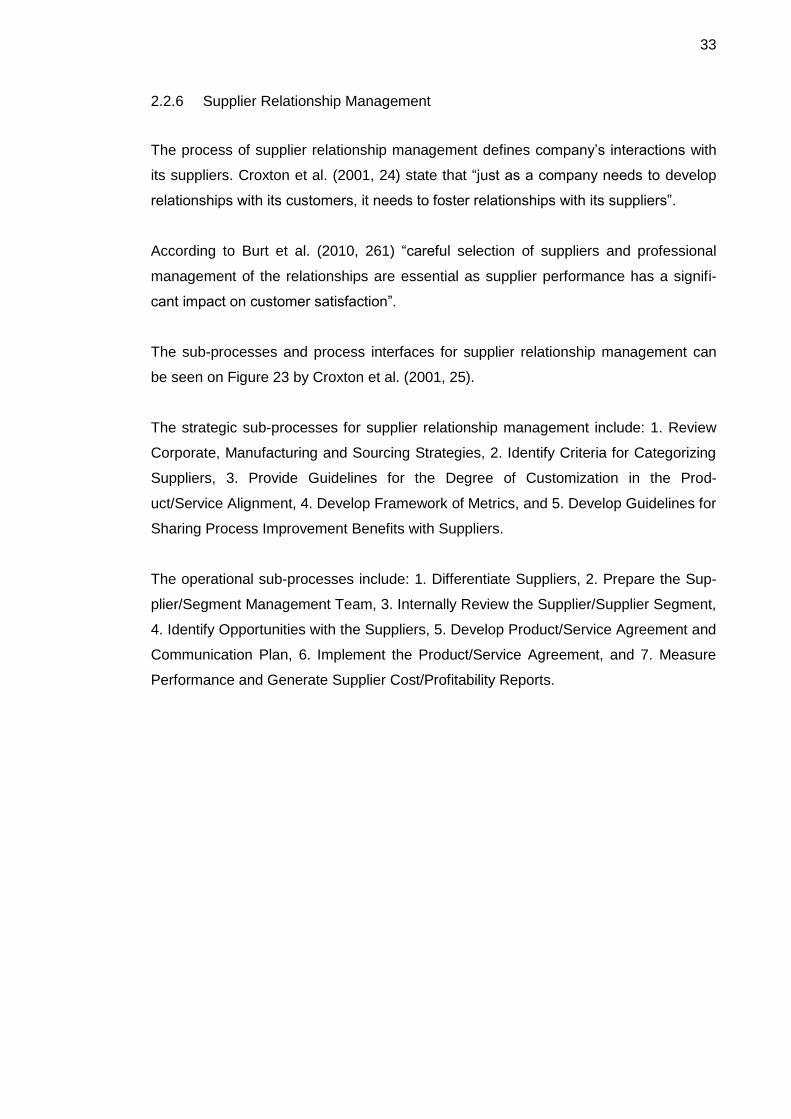
2.2.6 Supplier Relationship Management
The process of supplier relationship management defines company’s interactions with
its suppliers. Croxton et al. (2001, 24) state that “just as a company needs to develop
relationships with its customers, it needs to foster relationships with its suppliers”.
According to Burt et al. (2010, 261) “careful selection of suppliers and professional
management of the relationships are essential as supplier performance has a signifi-
cant impact on customer satisfaction”.
The sub-processes and process interfaces for supplier relationship management can
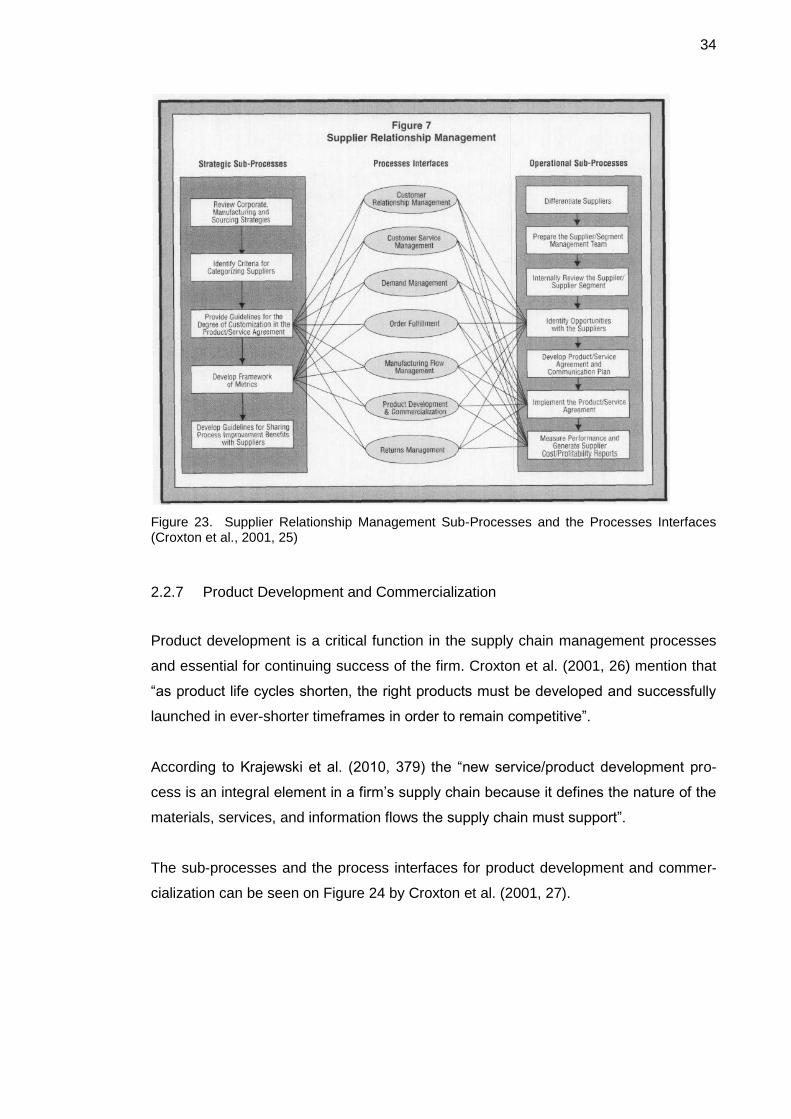
be seen on Figure 23 by Croxton et al. (2001, 25).
The strategic sub-processes for supplier relationship management include: 1. Review
Corporate, Manufacturing and Sourcing Strategies, 2. Identify Criteria for Categorizing
Suppliers, 3. Provide Guidelines for the Degree of Customization in the Prod-
uct/Service Alignment, 4. Develop Framework of Metrics, and 5. Develop Guidelines for
Sharing Process Improvement Benefits with Suppliers.
The operational sub-processes include: 1. Differentiate Suppliers, 2. Prepare the Sup-
plier/Segment Management Team, 3. Internally Review the Supplier/Supplier Segment,
4. Identify Opportunities with the Suppliers, 5. Develop Product/Service Agreement and
Communication Plan, 6. Implement the Product/Service Agreement, and 7. Measure
Performance and Generate Supplier Cost/Profitability Reports.
34
Figure 23. Supplier Relationship Management Sub-Processes and the Processes Interfaces (Croxton et al., 2001, 25)
2.2.7 Product Development and Commercialization
Product development is a critical function in the supply chain management processes
and essential for continuing success of the firm. Croxton et al. (2001, 26) mention that
“as product life cycles shorten, the right products must be developed and successfully
launched in ever-shorter timeframes in order to remain competitive”.
According to Krajewski et al. (2010, 379) the “new service/product development pro-
cess is an integral element in a firm’s supply chain because it defines the nature of the
materials, services, and information flows the supply chain must support”.
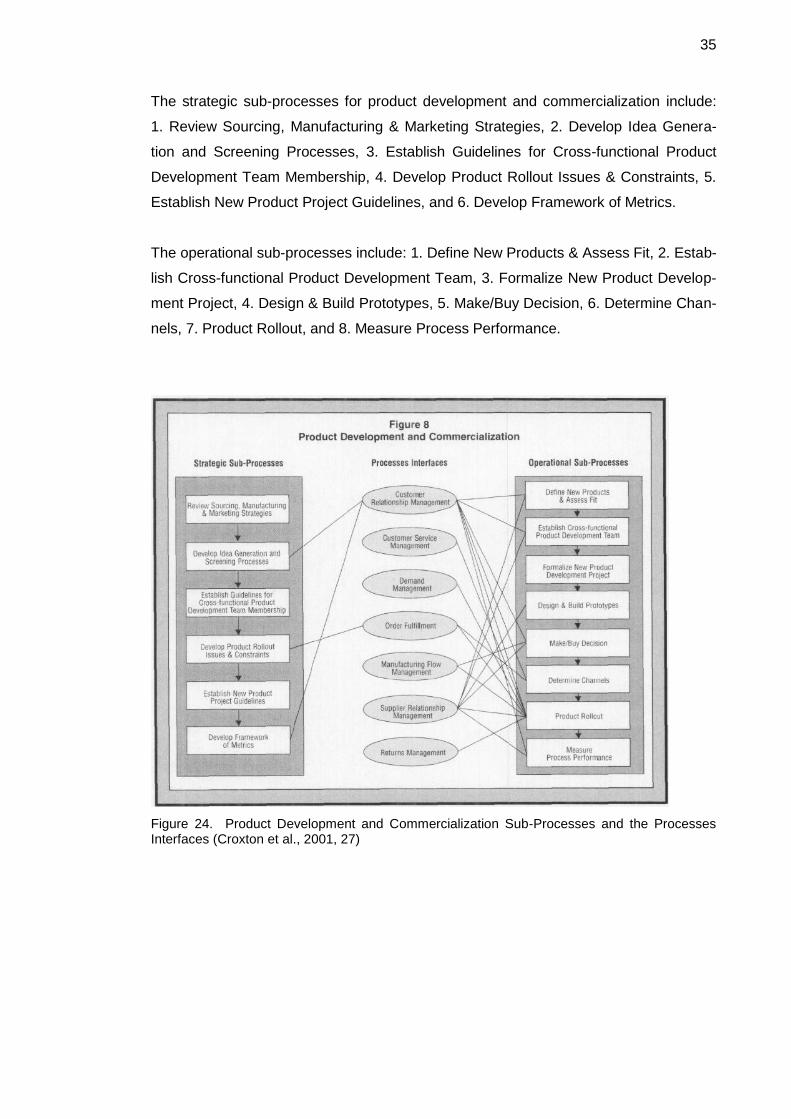
The sub-processes and the process interfaces for product development and commer-
cialization can be seen on Figure 24 by Croxton et al. (2001, 27).
35
The strategic sub-processes for product development and commercialization include:
1. Review Sourcing, Manufacturing & Marketing Strategies, 2. Develop Idea Genera-
tion and Screening Processes, 3. Establish Guidelines for Cross-functional Product
Development Team Membership, 4. Develop Product Rollout Issues & Constraints, 5.
Establish New Product Project Guidelines, and 6. Develop Framework of Metrics.
The operational sub-processes include: 1. Define New Products & Assess Fit, 2. Estab-
lish Cross-functional Product Development Team, 3. Formalize New Product Develop-
ment Project, 4. Design & Build Prototypes, 5. Make/Buy Decision, 6. Determine Chan-
nels, 7. Product Rollout, and 8. Measure Process Performance.
Figure 24. Product Development and Commercialization Sub-Processes and the Processes Interfaces (Croxton et al., 2001, 27)
36
2.2.8 Returns Management
Many firms neglect the critical process of returns management but according to Crox-
ton et al. (2001, 28) this process can assist the firm in achieving a sustainable com-
petitive advantage by stating: “effective management of the returns process enables
the firm to identify productivity improvement opportunities and breakthrough projects”.
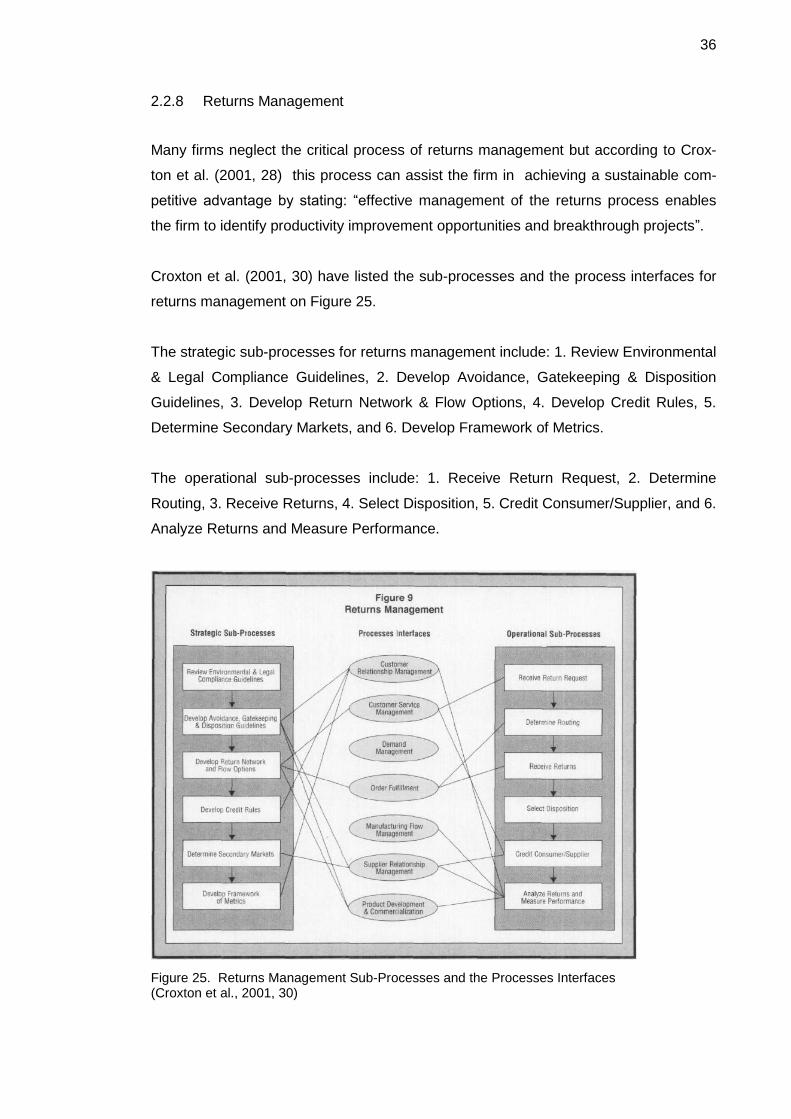
Croxton et al. (2001, 30) have listed the sub-processes and the process interfaces for
returns management on Figure 25.
The strategic sub-processes for returns management include: 1. Review Environmental
& Legal Compliance Guidelines, 2. Develop Avoidance, Gatekeeping & Disposition
Guidelines, 3. Develop Return Network & Flow Options, 4. Develop Credit Rules, 5.
Determine Secondary Markets, and 6. Develop Framework of Metrics.
The operational sub-processes include: 1. Receive Return Request, 2. Determine
Routing, 3. Receive Returns, 4. Select Disposition, 5. Credit Consumer/Supplier, and 6.
Analyze Returns and Measure Performance.
Figure 25. Returns Management Sub-Processes and the Processes Interfaces (Croxton et al., 2001, 30)
37
2.2.9 Successful Supply Chain Development
As Christopher (2011, 199) writes in his book, improving or developing the supply chain
is all about simplification, improving process reliability, reducing process variability and
reducing complexity. The business has also been traditionally organized around func-
tions; in today’s turbulent business environment it is now suggested that the emphasis
in organisations should be upon the key business processes that create value to cus-
tomers.
Schary and Skjott-Larsen (2003, 56-57) write that specialized activities that define a
system of a product flow should only be included within the supply chain if they add
value to the final product and that their specific function should not be duplicated within
the supply chain.
According to Stevenson (2005; 704) creating an effective supply chain requires linking
the market, distribution channels, processing and suppliers and it should enable the
participants to (1) share forecasts, (2) determine the status of orders in real time, and
(3) access inventory data of partners.
Also according to Stevenson (2005, 705), the successful supply chain management
requires trust among trading partners, effective communication, supply chain visibility,
event management capability in terms of ability to detect and respond to unplanned
events and performance metrics.
Psomas et al. list in their article proposed steps to successfully apply process man-
agement following the ISO 9001 requirements:
1) identify macro-processes, their mutual relations, inputs, outputs, constraints and necessary resources;
2) specify, progressively, the single macro-processes to the activity level; 3) build complete flow charts for priority activities and successively for all ac-
tivities; 4) define the gaps between the activities, the fixed targets and the norm and,
if necessary, re-think (re-engineer) the activity; 5) check the effectiveness of the activities and of the process that subsumes
them; 6) draft a document that describes the activity (instruction) or the process
(procedure); and
38
7) document the quality management system globally, from process map to policies, to choices and activities (manual, procedures, instructions, indica-tors, plans, etc.).
(Psomas et al., 2011, 442)
2.3 Supply Chain Performance Measurement
Performance measurement is defined as “a metric to quantify the efficiency and effec-
tiveness of operations” and most organizations tend to measure based on “hard” rather
on “soft” data, ignoring non-financial measures such as quality, market share, customer
satisfaction, human resources, innovation and learning (Suni et al. 2007, 53).
Supply Chain Performance Measures (SCPM) serve as an indicator of how well the SC
system is functioning (Kazemkhanlou et al., 2014, 273). Kazemkhanlou et al. (2014,
282) also conclude in their article that “performance measurement is a power tool that
assists firms or organizations to evaluate resource utilization so that they can strategi-
cally manage and continuously control to achieve their objectives and goals”.
According to Elrod et al. (2013, 40) “supply chain measurements are one key aspect of
continuous improvement that has the potential to identify opportunities to cut costs,
lean processes, and improve overall business functions”.
Performance Measurement System (PMS) can be defined as “a balanced and dynamic
system that enables support of decision-making processes by gathering, elaborating
and analyzing information” and the SCPMS is also defined as “the reporting process
that gives feedback to employees on the outcome of actions” as well as “a set of met-
rics used to quantify the efficiency and effectiveness of action” (Kazemkhanlou et al.,
2014, 274).
By selecting the right measurements the organization can:
check its position, that it knows where it is and where it is going;
communicate its position according to two perspectives, internal, i.e. or-ganisation internally communicates in order to thank or spur individuals and teams, and external, organisation externally communicates in order to cope with legal requirements or market’s needs;
confirm priorities, since by measuring it can identify how far it is from its goal; and
39
compel progress, that means it can use measurement as means of moti-vation and communicating priorities, and as a basis for reward. (Carlucci 2010, 67)
Desirable characteristics of SCPMS include the following:
Inclusiveness (measurement of all pertinent aspects)
Universality (allow for comparison under various operating conditions)
Measurability (data required are measurable) and
Consistency (measures consistent with organization goals) (Kazemkhanlou et al., 2014, 274)
A longer list is provided in the article mentioning that a firm’s performance measures
should:
Be simple and easy to use.
Have a clear purpose.
Provide fast feedback.
Relate to performance improvement, not just monitoring.
Reinforce the firm's strategy.
Relate to both long-term and short-term objectives of the organization.
Match the firm's organization culture.
Not conflict with one another.
Be integrated both horizontally and vertically in the corporate structure.
Be consistent with the firm's existing recognition and reward system.
Focus on what is important to customers.
Focus on what the competition is doing.
Lead to identification and elimination of waste.
Help accelerate organizational learning.
Evaluate groups not individuals for performance to schedule.
Establish specific numeric standards for most goals.
It must reflect relevant non-financial information based on key success factors of each business.
It must make a link to reward systems
The financial and non-financial measures must be aligned and fit within a strategic framework.
Minimum deviations should exist between the organizational goals and measurement goals (Kazemkhanlou et al., 2014, 274)
Performance measurement has roots in early accounting systems and it has evolved in
two phases; the first phase was in the late 1880s and the second phase in the late
1980s (Kurien et al., 2011, 21). The growth of global business activities in the late
1980s changed the measurement from traditionally financially based, internally fo-
cused, backward looking and locally focused to a broader view of performance meas-
40
urement with the alignment of financial and non-financial measures (Kurien et al., 2011,
21). The structural evolution of business organizations along with globalization, auto-
mation processes and e-commerce also affected the development of better integrated
performance measurement systems.
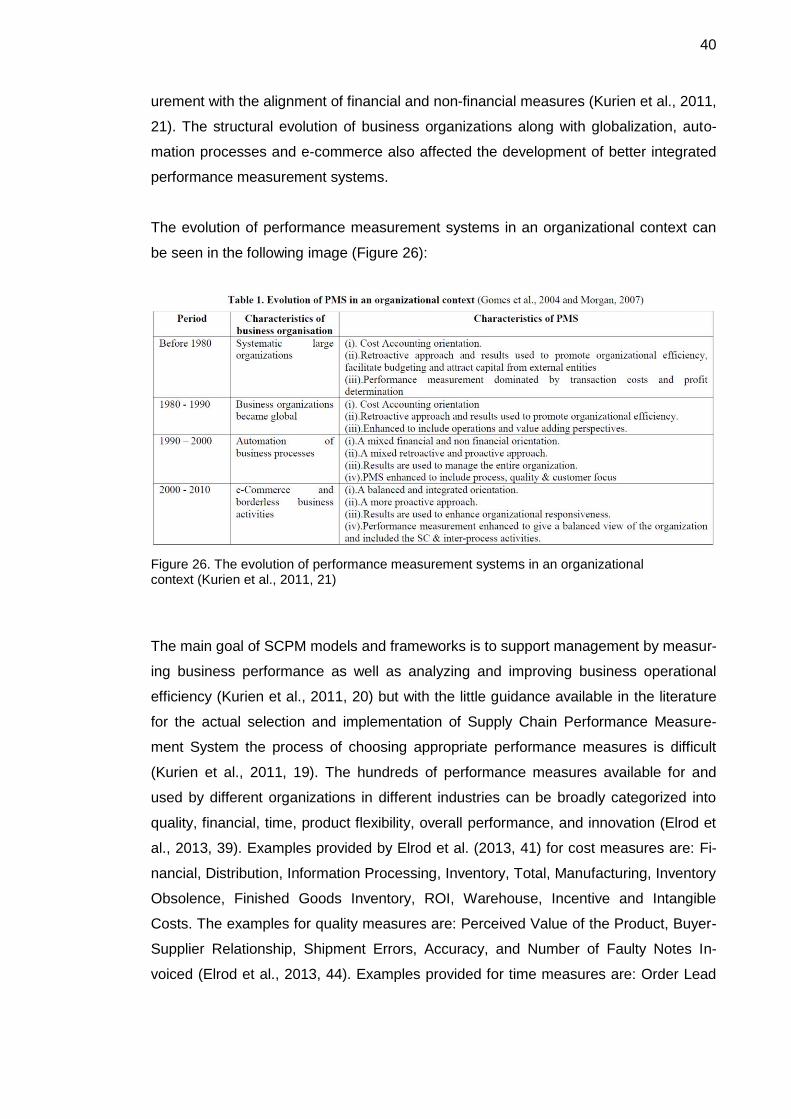
The evolution of performance measurement systems in an organizational context can
be seen in the following image (Figure 26):
Figure 26. The evolution of performance measurement systems in an organizational context (Kurien et al., 2011, 21)
The main goal of SCPM models and frameworks is to support management by measur-
ing business performance as well as analyzing and improving business operational
efficiency (Kurien et al., 2011, 20) but with the little guidance available in the literature
for the actual selection and implementation of Supply Chain Performance Measure-
ment System the process of choosing appropriate performance measures is difficult
(Kurien et al., 2011, 19). The hundreds of performance measures available for and
used by different organizations in different industries can be broadly categorized into
quality, financial, time, product flexibility, overall performance, and innovation (Elrod et
al., 2013, 39). Examples provided by Elrod et al. (2013, 41) for cost measures are: Fi-
nancial, Distribution, Information Processing, Inventory, Total, Manufacturing, Inventory
Obsolence, Finished Goods Inventory, ROI, Warehouse, Incentive and Intangible
Costs. The examples for quality measures are: Perceived Value of the Product, Buyer-
Supplier Relationship, Shipment Errors, Accuracy, and Number of Faulty Notes In-
voiced (Elrod et al., 2013, 44). Examples provided for time measures are: Order Lead
41
Time, Customer Order Path, Effectiveness of Scheduling the Techniques, Product De-
velopment Cycle Time, Product Lateness Time, Average Lateness Time, Average Ear-
liness Time, and Manufacturing Lead Time (Elrod et al., 2013, 45). Flexibility measures
listed by Elrod et al. (2013, 46) include: Range of Products and Services, Capazity Uti-
lization, Volume Flexibility, Plant Volume Flexibility, Delivery Flexibility, Labor Flexibil-
ity, Modification Flexibility, and Expansion Flexibility.
Kazemkhanlou et al. (2014, 278-281) present 16 well-known supply chain performance
measurement models and their particularities:
1 ABC: Activity-Based Costing It has been created in the1980s. It aims to analyze costs and margin, but goes beyond the simple calculation of return costs. It necessitates a deep knowledge of the company. It groups activities by their process logic and interweaves accounting data into this concept. 2 FLR: Framework for Logistics Research It has been developed in the 1990s. It describes dependency between the level of performance achieved, logistics organization and competitive strat-egy. It can be applied at organizational and strategic level. It structures lo-gistics function into several dimensions (centralization, formalization, inte-gration and areas of control). 3 BSC: Balanced Score Card It has been developed in the 1990s. It seeks balanced measures to but-tress company strategy. This principle proposes four analytical axes: cus-tomers, finance, internal processes and innovation-growth and it incorpo-rates a human dimension for the performance measurement. It is specifical-ly geared towards general management and can be applied from the stra-tegic through the organizational level. It aims to establish causalities be-tween the performance of each analytical axis. 4 SCOR: Supply Chain Operation Reference model It has been developed in 1996 by the Supply Chain Council (SCC).It aims to analyse four dimensions: reliability of commercial performance, flexibility/ responsiveness, cost of supply chain and turnover of committed capital. It can be applied to all industrial and service sector companies, at tactical and operational level for an implementation of decisions relating to the compa-ny’s strategic planning. Its indicators’ definitions are explained using calcu-lation modes and giving association of indicators for each process. 5 GSCF framework It has been created by Ohio State University in 1994. It describes three lev-els (strategic, tactical and operational) and highlights links between supply chain process and structure. It focuses on seven processes: customer relationship management, customer service management, demand man-agement, order fulfillment, manufacturing flow management, supplier rela-tionship management, product development and commercialization, and re-turns management 6 ASLOG audit It has been created in1997 by ASLOG, based on models used in the auto-mobile sector. It assesses logistics procedures by analyzing strengths and weaknesses. It is a transversal tool, which aims to implement good practice
42
dedicated to companies with low or medium levels of maturity. It analyses the following areas: management, strategy and planning, design and pro-jects, sourcing, production, transportation, stocks, sales, returns and after sales, piloting and permanent progress indicator. 7 SASC: Strategic Audit Supply Chain It has been developed in 1999. It analyzes supply chain in terms of pro-cesses, information technologies and organization at an organizational lev-el. Its principle is to break logistics chain down into six competencies: cus-tomer orientation, distribution, sales planning, lean production, supplier partnerships and integrated management of chain and to link competencies to information technology and organization of chain. 8 Global EVALOG (Global MMOG/LE) It has been created in 1999 with Odette International Limited and Automo-bile Industry Action Group. It assesses partner site processes and perfor-mance, pursues continuous improvement approach. Although it has been developed for an automobile industry, it can be used for associated sectors (metal works, chemicals). It is structured in to six areas: strategy and im-provement, work organization, production planning, customer interface, process control and supplier interface. 9 WCL: World Class Logistics model It has been developed by Michigan State University in the 1990s. It evalu-ates the company’s performance in terms of its ability to account for inter organizational relationships through a model comprised of 68 questions. It can be applied at strategic and organizational level. It revolves around four areas of competency: positioning, integration, agility and performance measurement. 10 AFNOR FDX50-605 It has been developed in 2008.It offers general framework for strategic re-flection and defines different logistics processes. It identifies performance levers associated with each process. Its model features six area: identifica-tion of needs and setting of objectives, logistics system design and devel-opment, production, sales and distribution, logistics support and control over global logistics process. 11 SCM/SME It has been developed in 2007 within an SME context. It is composed by a questionnaire featuring 25 modules: corporate strategy, organization and logistic competencies development, performance processes and measure-ments, information system. Its targets are mainly industrial SMEs in fast moving consumer goods sector. It is structured around demand manage-ment, distribution, import/export flows, stocks, production, sourcing, returns, after sales support and traceability. 12 APICS: Association for Operations Management It has been developed by professional association APICS in 2000. It ana-lyzes innovation and customer service management, efficiency drivers, agil-ity, risk control and sustainability. It mainly applies to industrial firms. Its processes are structured via model that is mainly geared towards produc-tion planning. 13 ECR: Efficient Customer Response It has been created in 1994 by an ECR Association of manufacturers and retailers. It evaluates good interorganizational practices and uses maturity based evaluation tool: global mapping. It focuses on collaboration between industrialists and distributors in fast moving consumer goods sector. It es-tablishes common language based on joint evaluation of performance by act or sin the chain. It is based on 45 criteria structured into four areas:
43
consumer demand management, supply chain management, technological platforms and integration. 14 EFQM: Excellence model It has been in traduced in 1992. It starts by a questionnaire with 50 ques-tions; respondents positioned along the scale of excellence. It covers areas relating to process efficiency, continuous improvement in products and services, personnel management and progression. It is suitable for all types of companies. It is based on eight principles: customer focus, leadership, definition of objectives, process-based management, staff involvement, continuous innovation process, development of partnerships and civic re-sponsibility. 15 SCALE: Supply Chain Advisor Level Evaluation It has been created in the early 2000s by the Institute for Supply Chain Ex-cellence (ISLI) for all sectors of activity. It revolves around questionnaire that assesses strategic and tactical dimensions, elements of value creation. It is based on 58 processes classified into seven categories of ac-tivities: definition of strategic objectives, establishment of procedures, needs planning, coordination of phases, performance evaluation and monitoring and supply chain optimization. 16 SPM: Strategic Profit Model It has been created in 2002, derived from the DuPont model. It displays ex-isting interactions between strategic and operational levels by means of fi-nancial ratios. It proposes strategic and financial implementation based on cost drivers using returns on asset or returns on net value measurements.
The well known models SCOR and Balanced Scorecard as well as benchmarking will
be discussed in the following text.
44
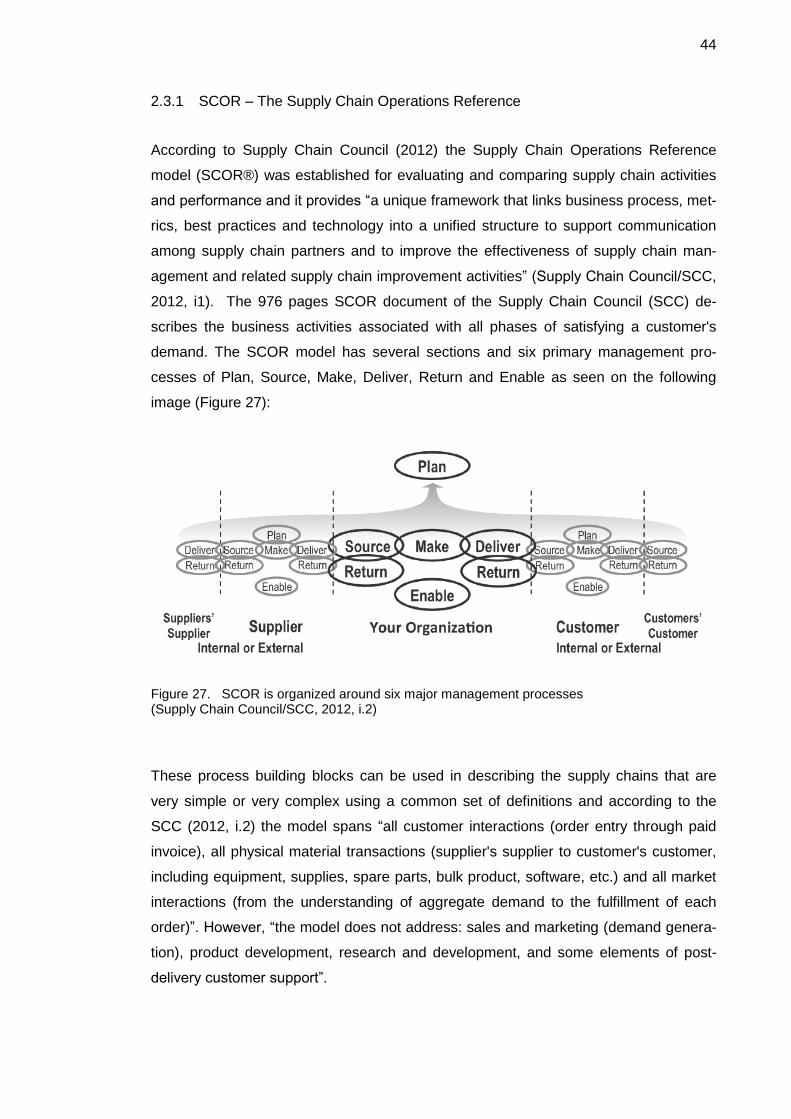
2.3.1 SCOR – The Supply Chain Operations Reference
According to Supply Chain Council (2012) the Supply Chain Operations Reference
model (SCOR®) was established for evaluating and comparing supply chain activities
and performance and it provides “a unique framework that links business process, met-
rics, best practices and technology into a unified structure to support communication
among supply chain partners and to improve the effectiveness of supply chain man-
agement and related supply chain improvement activities” (Supply Chain Council/SCC,
2012, i1). The 976 pages SCOR document of the Supply Chain Council (SCC) de-
scribes the business activities associated with all phases of satisfying a customer's
demand. The SCOR model has several sections and six primary management pro-
cesses of Plan, Source, Make, Deliver, Return and Enable as seen on the following
image (Figure 27):
Figure 27. SCOR is organized around six major management processes (Supply Chain Council/SCC, 2012, i.2)
These process building blocks can be used in describing the supply chains that are
very simple or very complex using a common set of definitions and according to the
SCC (2012, i.2) the model spans “all customer interactions (order entry through paid
invoice), all physical material transactions (supplier's supplier to customer's customer,
including equipment, supplies, spare parts, bulk product, software, etc.) and all market
interactions (from the understanding of aggregate demand to the fulfillment of each
order)”. However, “the model does not address: sales and marketing (demand genera-
tion), product development, research and development, and some elements of post-
delivery customer support”.
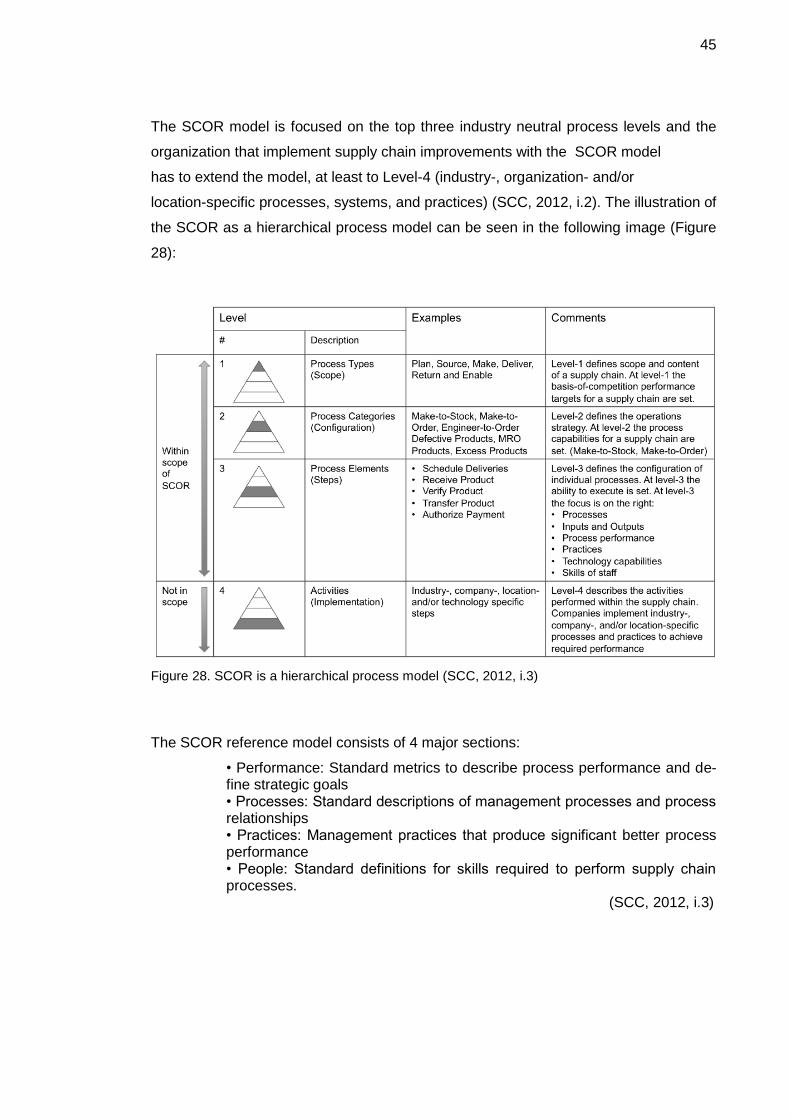
45
The SCOR model is focused on the top three industry neutral process levels and the
organization that implement supply chain improvements with the SCOR model
has to extend the model, at least to Level-4 (industry-, organization- and/or
location-specific processes, systems, and practices) (SCC, 2012, i.2). The illustration of
the SCOR as a hierarchical process model can be seen in the following image (Figure
28):
Figure 28. SCOR is a hierarchical process model (SCC, 2012, i.3)
The SCOR reference model consists of 4 major sections:
• Performance: Standard metrics to describe process performance and de-fine strategic goals • Processes: Standard descriptions of management processes and process relationships • Practices: Management practices that produce significant better process performance • People: Standard definitions for skills required to perform supply chain processes.
(SCC, 2012, i.3)
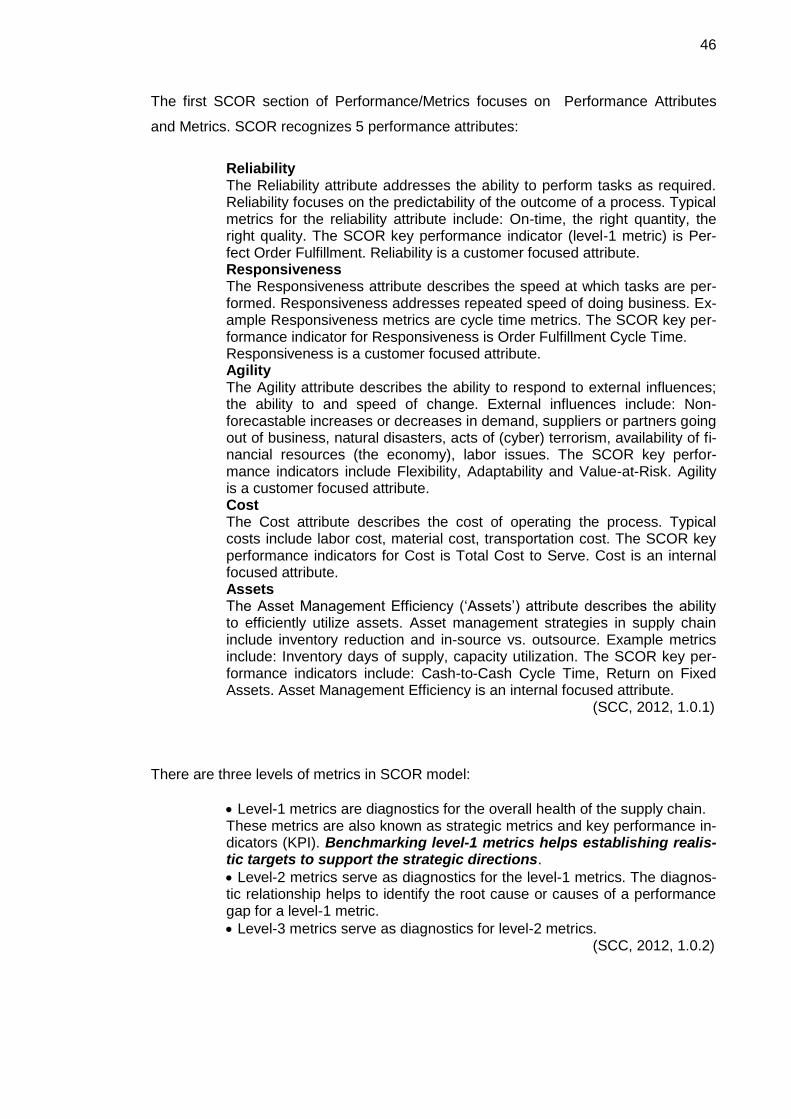
46
The first SCOR section of Performance/Metrics focuses on Performance Attributes
and Metrics. SCOR recognizes 5 performance attributes:
Reliability The Reliability attribute addresses the ability to perform tasks as required. Reliability focuses on the predictability of the outcome of a process. Typical metrics for the reliability attribute include: On-time, the right quantity, the right quality. The SCOR key performance indicator (level-1 metric) is Per-fect Order Fulfillment. Reliability is a customer focused attribute. Responsiveness The Responsiveness attribute describes the speed at which tasks are per-formed. Responsiveness addresses repeated speed of doing business. Ex-ample Responsiveness metrics are cycle time metrics. The SCOR key per-formance indicator for Responsiveness is Order Fulfillment Cycle Time. Responsiveness is a customer focused attribute. Agility The Agility attribute describes the ability to respond to external influences; the ability to and speed of change. External influences include: Non-forecastable increases or decreases in demand, suppliers or partners going out of business, natural disasters, acts of (cyber) terrorism, availability of fi-nancial resources (the economy), labor issues. The SCOR key perfor-mance indicators include Flexibility, Adaptability and Value-at-Risk. Agility is a customer focused attribute. Cost The Cost attribute describes the cost of operating the process. Typical costs include labor cost, material cost, transportation cost. The SCOR key performance indicators for Cost is Total Cost to Serve. Cost is an internal focused attribute. Assets The Asset Management Efficiency (‘Assets’) attribute describes the ability to efficiently utilize assets. Asset management strategies in supply chain include inventory reduction and in-source vs. outsource. Example metrics include: Inventory days of supply, capacity utilization. The SCOR key per-formance indicators include: Cash-to-Cash Cycle Time, Return on Fixed Assets. Asset Management Efficiency is an internal focused attribute.
(SCC, 2012, 1.0.1)
There are three levels of metrics in SCOR model:
Level-1 metrics are diagnostics for the overall health of the supply chain. These metrics are also known as strategic metrics and key performance in-dicators (KPI). Benchmarking level-1 metrics helps establishing realis-tic targets to support the strategic directions.
Level-2 metrics serve as diagnostics for the level-1 metrics. The diagnos-tic relationship helps to identify the root cause or causes of a performance gap for a level-1 metric.
Level-3 metrics serve as diagnostics for level-2 metrics. (SCC, 2012, 1.0.2)
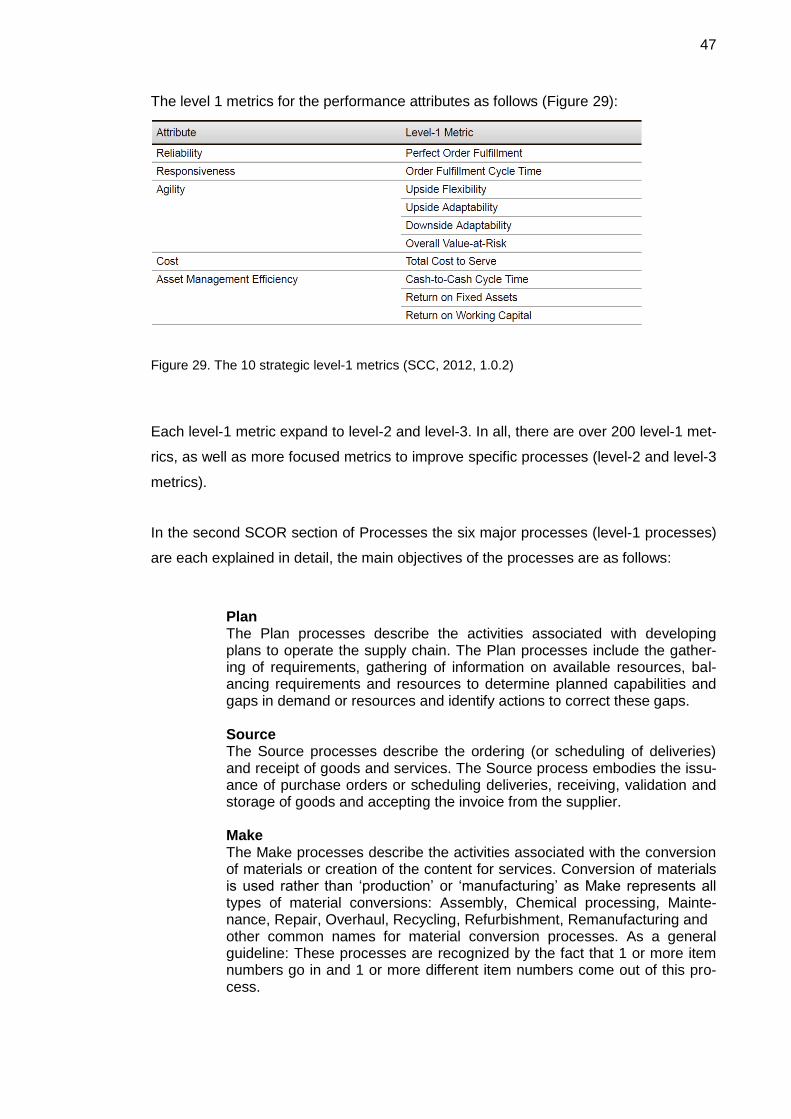
47
The level 1 metrics for the performance attributes as follows (Figure 29):
Figure 29. The 10 strategic level-1 metrics (SCC, 2012, 1.0.2)
Each level-1 metric expand to level-2 and level-3. In all, there are over 200 level-1 met-
rics, as well as more focused metrics to improve specific processes (level-2 and level-3
metrics).
In the second SCOR section of Processes the six major processes (level-1 processes)
are each explained in detail, the main objectives of the processes are as follows:
Plan The Plan processes describe the activities associated with developing plans to operate the supply chain. The Plan processes include the gather-ing of requirements, gathering of information on available resources, bal-ancing requirements and resources to determine planned capabilities and gaps in demand or resources and identify actions to correct these gaps. Source The Source processes describe the ordering (or scheduling of deliveries) and receipt of goods and services. The Source process embodies the issu-ance of purchase orders or scheduling deliveries, receiving, validation and storage of goods and accepting the invoice from the supplier. Make The Make processes describe the activities associated with the conversion of materials or creation of the content for services. Conversion of materials is used rather than ‘production’ or ‘manufacturing’ as Make represents all types of material conversions: Assembly, Chemical processing, Mainte-nance, Repair, Overhaul, Recycling, Refurbishment, Remanufacturing and other common names for material conversion processes. As a general guideline: These processes are recognized by the fact that 1 or more item numbers go in and 1 or more different item numbers come out of this pro-cess.
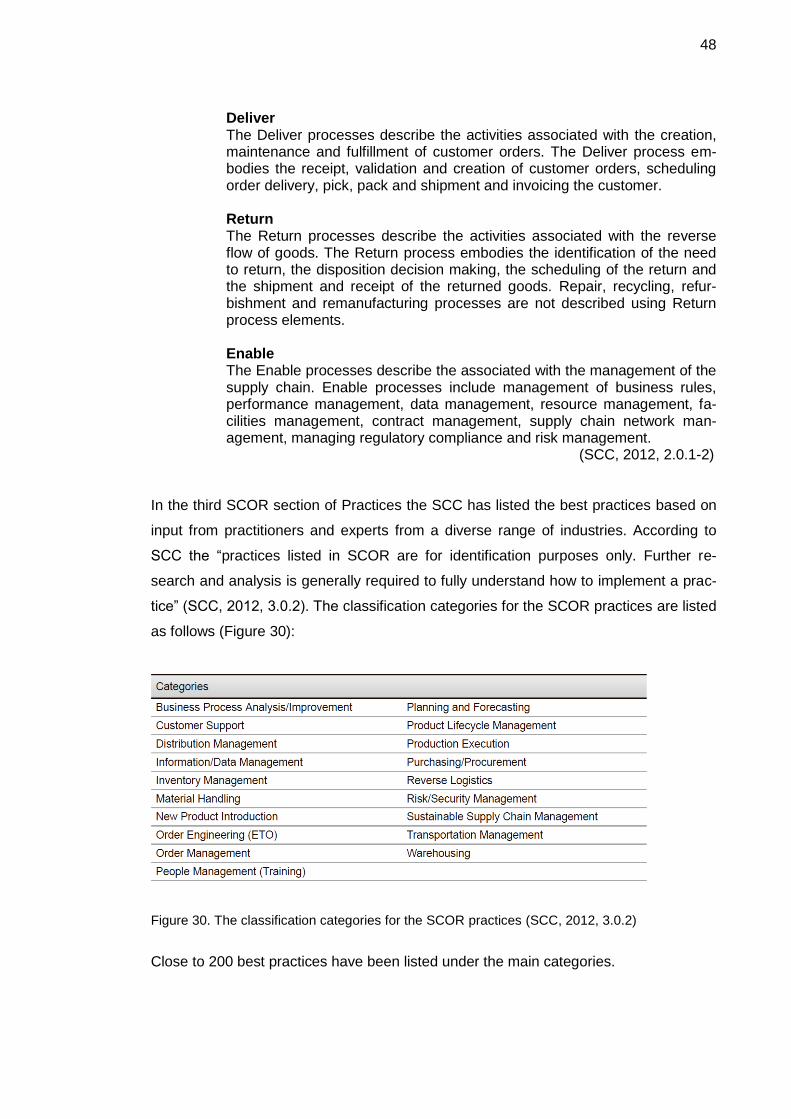
48
Deliver The Deliver processes describe the activities associated with the creation, maintenance and fulfillment of customer orders. The Deliver process em-bodies the receipt, validation and creation of customer orders, scheduling order delivery, pick, pack and shipment and invoicing the customer. Return The Return processes describe the activities associated with the reverse flow of goods. The Return process embodies the identification of the need to return, the disposition decision making, the scheduling of the return and the shipment and receipt of the returned goods. Repair, recycling, refur-bishment and remanufacturing processes are not described using Return process elements. Enable The Enable processes describe the associated with the management of the supply chain. Enable processes include management of business rules, performance management, data management, resource management, fa-cilities management, contract management, supply chain network man-agement, managing regulatory compliance and risk management.
(SCC, 2012, 2.0.1-2)
In the third SCOR section of Practices the SCC has listed the best practices based on
input from practitioners and experts from a diverse range of industries. According to
SCC the “practices listed in SCOR are for identification purposes only. Further re-
search and analysis is generally required to fully understand how to implement a prac-
tice” (SCC, 2012, 3.0.2). The classification categories for the SCOR practices are listed
as follows (Figure 30):
Figure 30. The classification categories for the SCOR practices (SCC, 2012, 3.0.2)
Close to 200 best practices have been listed under the main categories.
49
In the fourth SCOR section of People the standards for managing talent in the supply
chain are introduced. The key elements of the People section are Skills, Experiences,
Aptitudes and Trainings:
Skill Skill is the capacity to deliver pre-determined results with minimal input of time and energy. Skills are further defined by Experiences, Aptitudes, Trainings and Competency levels. Examples of supply chain skills include: Master Scheduling, Import/Export Regulations, Production Planning, and Risk Mitigation. Experience Experience is the knowledge or ability acquired by observation or active participation. Experience is obtained by doing the work in a real life envi-ronment and undergoing different situations that require different actions. Example experiences include: Cycle Counting, Cross Docking, and Haz-ardous Materials Handling. Aptitude Aptitude is a natural, acquired, learned or developed ability to perform a certain kind of work at a certain level. Example aptitudes include: Accuracy, Analytical, and Natural leadership. Training Training develops a skill or type of behavior through instruction. Examples of training includes formal trainings such as SCOR-S certification, but also includes courses and on-the-job training. (SCC, 2012, 4.0.1)
The total of 161 skills have been listed along with the Processes, Experiences, Apti-
tudes, Trainings and Practices for each of them.
An example of the standards for Customer Order Management as follows (Figure 31):
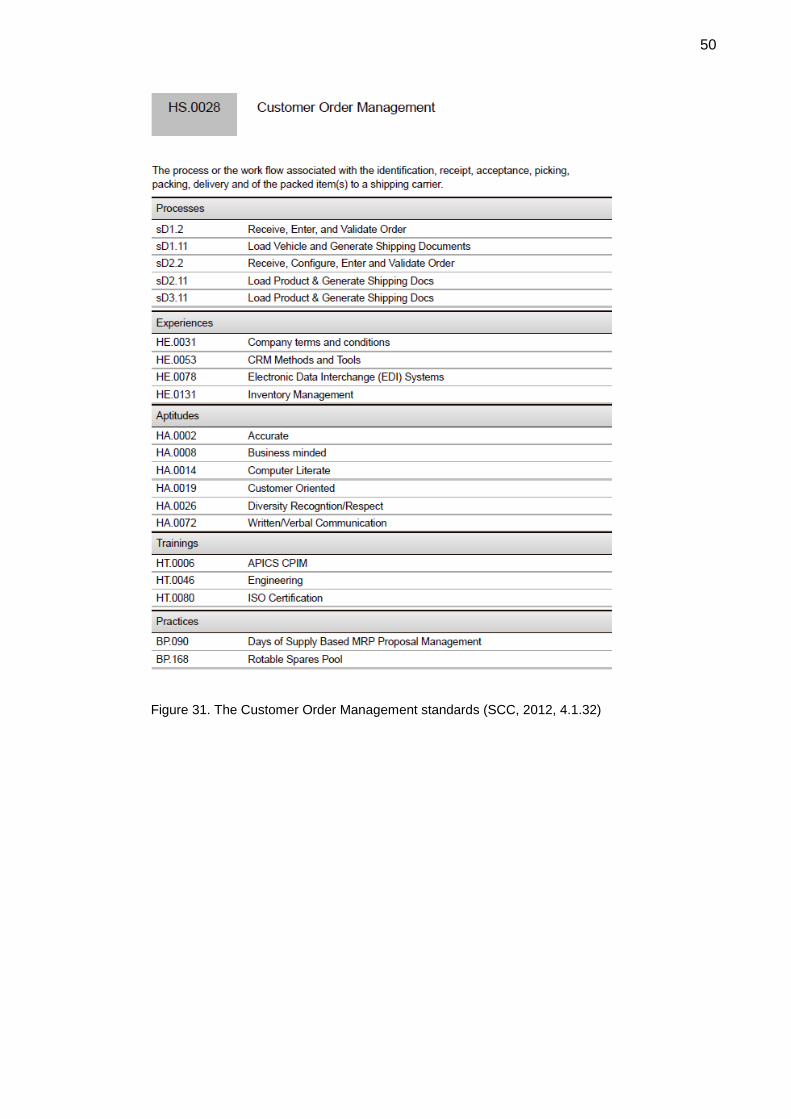
50
Figure 31. The Customer Order Management standards (SCC, 2012, 4.1.32)
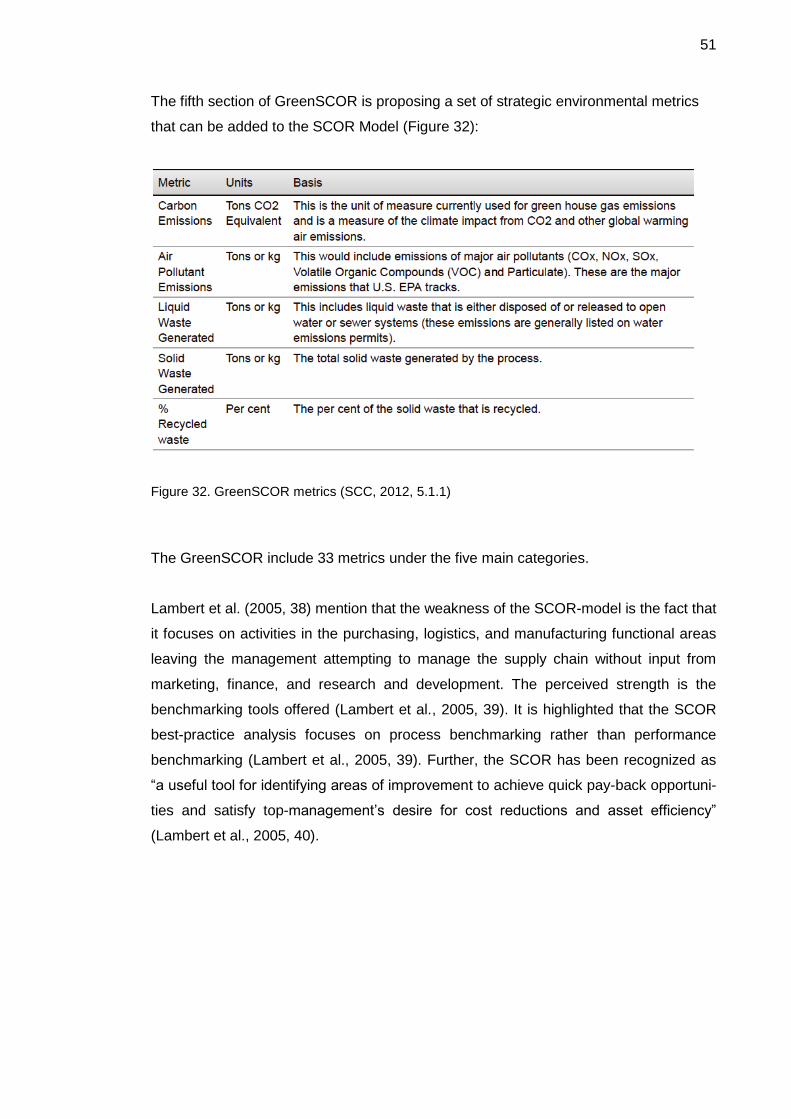
51
The fifth section of GreenSCOR is proposing a set of strategic environmental metrics
that can be added to the SCOR Model (Figure 32):
Figure 32. GreenSCOR metrics (SCC, 2012, 5.1.1)
The GreenSCOR include 33 metrics under the five main categories.
Lambert et al. (2005, 38) mention that the weakness of the SCOR-model is the fact that
it focuses on activities in the purchasing, logistics, and manufacturing functional areas
leaving the management attempting to manage the supply chain without input from
marketing, finance, and research and development. The perceived strength is the
benchmarking tools offered (Lambert et al., 2005, 39). It is highlighted that the SCOR
best-practice analysis focuses on process benchmarking rather than performance
benchmarking (Lambert et al., 2005, 39). Further, the SCOR has been recognized as
“a useful tool for identifying areas of improvement to achieve quick pay-back opportuni-
ties and satisfy top-management’s desire for cost reductions and asset efficiency”
(Lambert et al., 2005, 40).
52
2.3.2 BSC - The Balanced Scorecard
The BSC was first created by Robert S. Kaplan and David P. Norton in 1992 and they
describe the measures as follows:
The balanced scorecard includes financial measures that tell the results of actions already taken. And it complements the financial measures with op-erational measures on customer satisfaction, internal processes, and the organization's innovation and improvement activities -- operational measures that are the drivers of future financial performance.
(Kaplan et al., 1992, 71)
According to Kurien et al. (2011, 24) “BSC proposes that a company should use a bal-
anced set of measures that allows top managers to take a quick but comprehensive
view of the business from four important perspectives” The four perspectives answer
the following questions:
(i). How do we look to our shareholders (financial perspective)? (ii). What must we excel at (internal business perspective)? (iii). How do our customers see us (the customer perspective)? (iv). How can we continue to improve and create value (innovation and learning per-spective)? Kurien et al., 2011, 25
Elrod et al. (2013, 40) state that the measures – financial, internal process, customers
and innovation – are used to define the implementation of the company’s strategy.
Kaplan et al. (1992, 72-73) claim that the BSC minimizes the information overload by
limiting the number of measures used and that “the balanced scorecard forces manag-
ers to focus on the handful of measures that are most crucial”. Kurien et al. (2011, 25)
however list the following critics to the BSC framework: it is “primarily designed to pro-
vide senior managers with an overall view of performance” and “not intended for the
factory operations level”, it is “constructed as a monitoring and controlling tool rather
than improvement tool”, it “provides little guidance on how the appropriate measures
can be identified, introduced and ultimately used to manage business”, it “does not
consider the competitor perspective at all” making it “difficult to make comparisons
within and across firms using BSC”, and it “is more like a strategic managment tool,
rather than a true complete PMS”. Perkins et al. (2014, 151) state in their article that “It
is surprising that considering the large body of literature regarding the BSC, there is
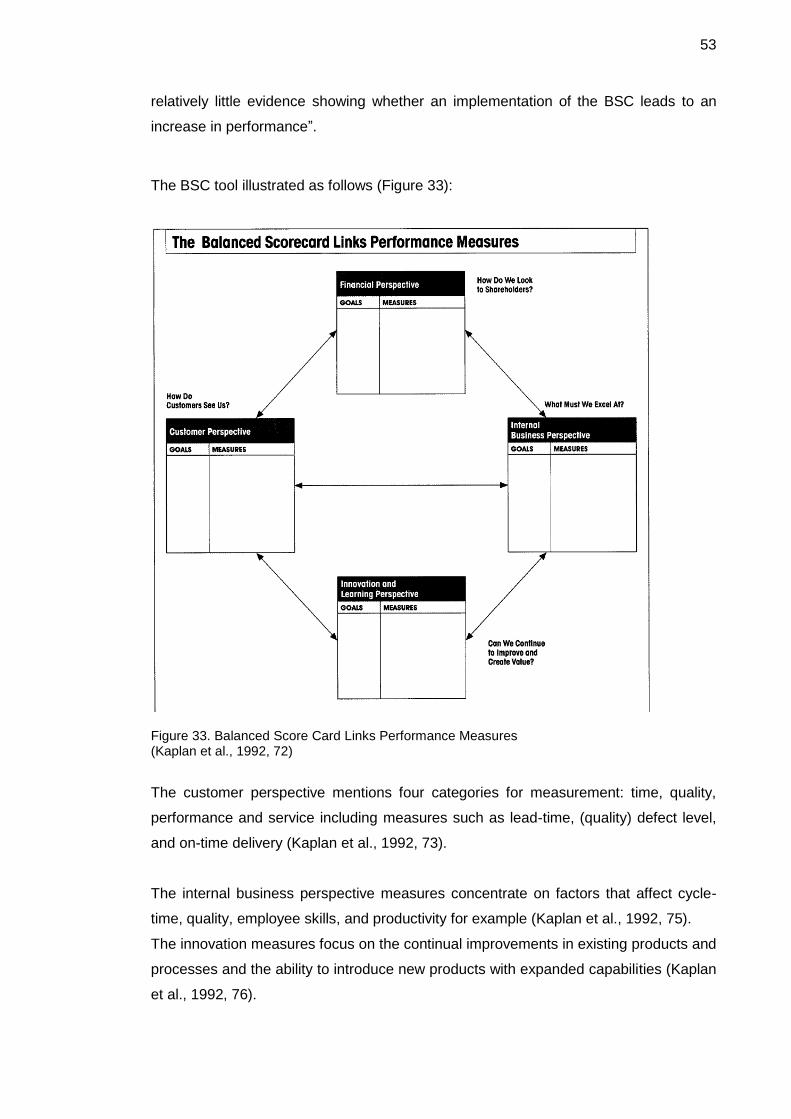
53
relatively little evidence showing whether an implementation of the BSC leads to an
increase in performance”.
The BSC tool illustrated as follows (Figure 33):
Figure 33. Balanced Score Card Links Performance Measures (Kaplan et al., 1992, 72)
The customer perspective mentions four categories for measurement: time, quality,
performance and service including measures such as lead-time, (quality) defect level,
and on-time delivery (Kaplan et al., 1992, 73).
The internal business perspective measures concentrate on factors that affect cycle-
time, quality, employee skills, and productivity for example (Kaplan et al., 1992, 75).
The innovation measures focus on the continual improvements in existing products and
processes and the ability to introduce new products with expanded capabilities (Kaplan
et al., 1992, 76).
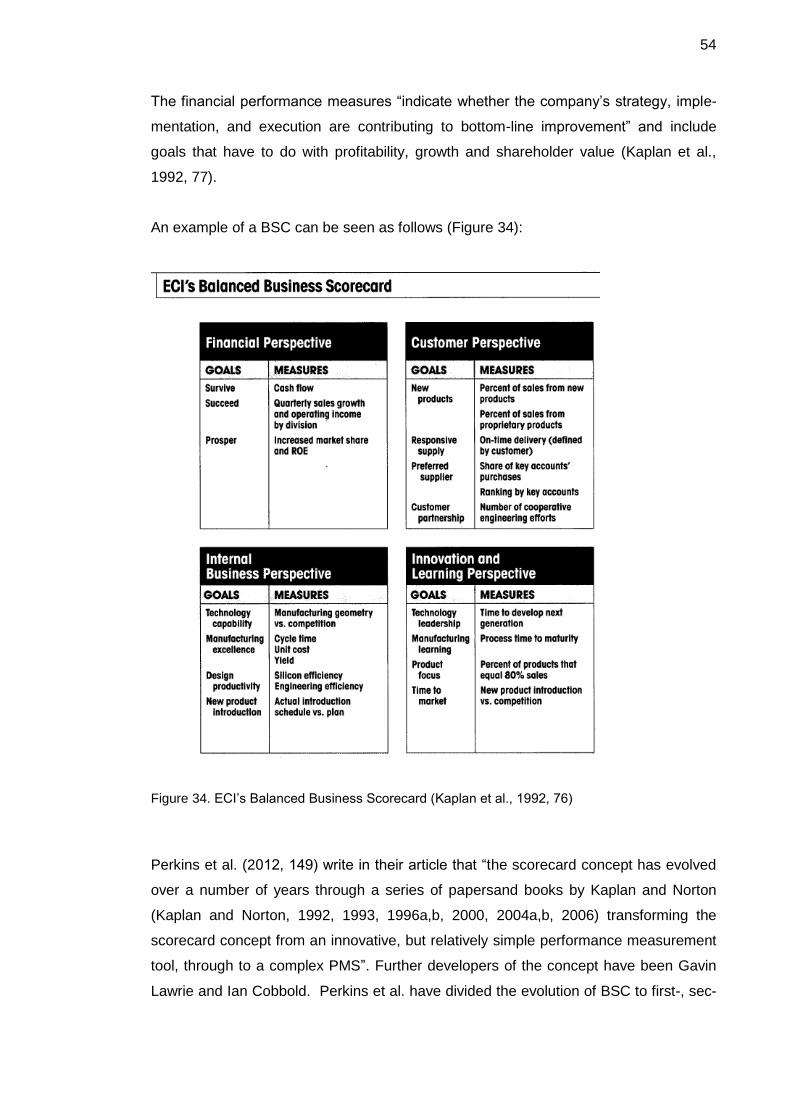
54
The financial performance measures “indicate whether the company’s strategy, imple-
mentation, and execution are contributing to bottom-line improvement” and include
goals that have to do with profitability, growth and shareholder value (Kaplan et al.,
1992, 77).
An example of a BSC can be seen as follows (Figure 34):
Figure 34. ECI’s Balanced Business Scorecard (Kaplan et al., 1992, 76)
Perkins et al. (2012, 149) write in their article that “the scorecard concept has evolved
over a number of years through a series of papersand books by Kaplan and Norton
(Kaplan and Norton, 1992, 1993, 1996a,b, 2000, 2004a,b, 2006) transforming the
scorecard concept from an innovative, but relatively simple performance measurement
tool, through to a complex PMS”. Further developers of the concept have been Gavin
Lawrie and Ian Cobbold. Perkins et al. have divided the evolution of BSC to first-, sec-
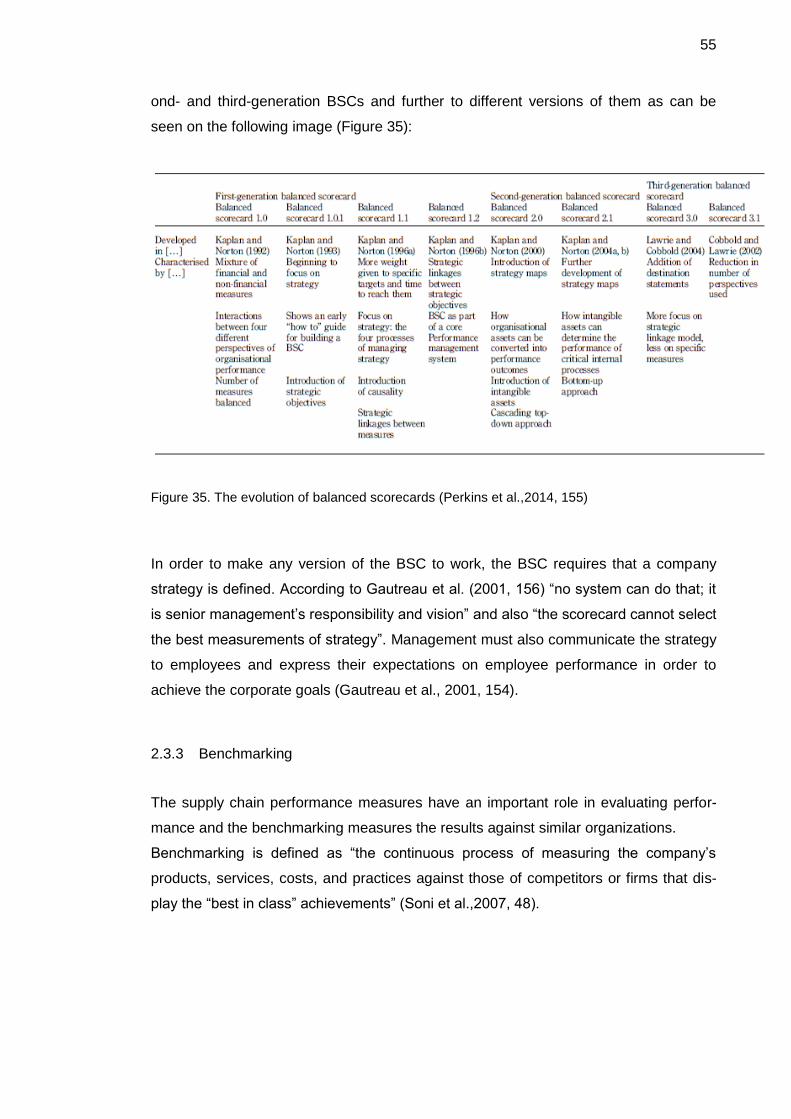
55
ond- and third-generation BSCs and further to different versions of them as can be
seen on the following image (Figure 35):
Figure 35. The evolution of balanced scorecards (Perkins et al.,2014, 155)
In order to make any version of the BSC to work, the BSC requires that a company
strategy is defined. According to Gautreau et al. (2001, 156) “no system can do that; it
is senior management’s responsibility and vision” and also “the scorecard cannot select
the best measurements of strategy”. Management must also communicate the strategy
to employees and express their expectations on employee performance in order to
achieve the corporate goals (Gautreau et al., 2001, 154).
2.3.3 Benchmarking
The supply chain performance measures have an important role in evaluating perfor-
mance and the benchmarking measures the results against similar organizations.
Benchmarking is defined as “the continuous process of measuring the company’s
products, services, costs, and practices against those of competitors or firms that dis-
play the “best in class” achievements” (Soni et al.,2007, 48).
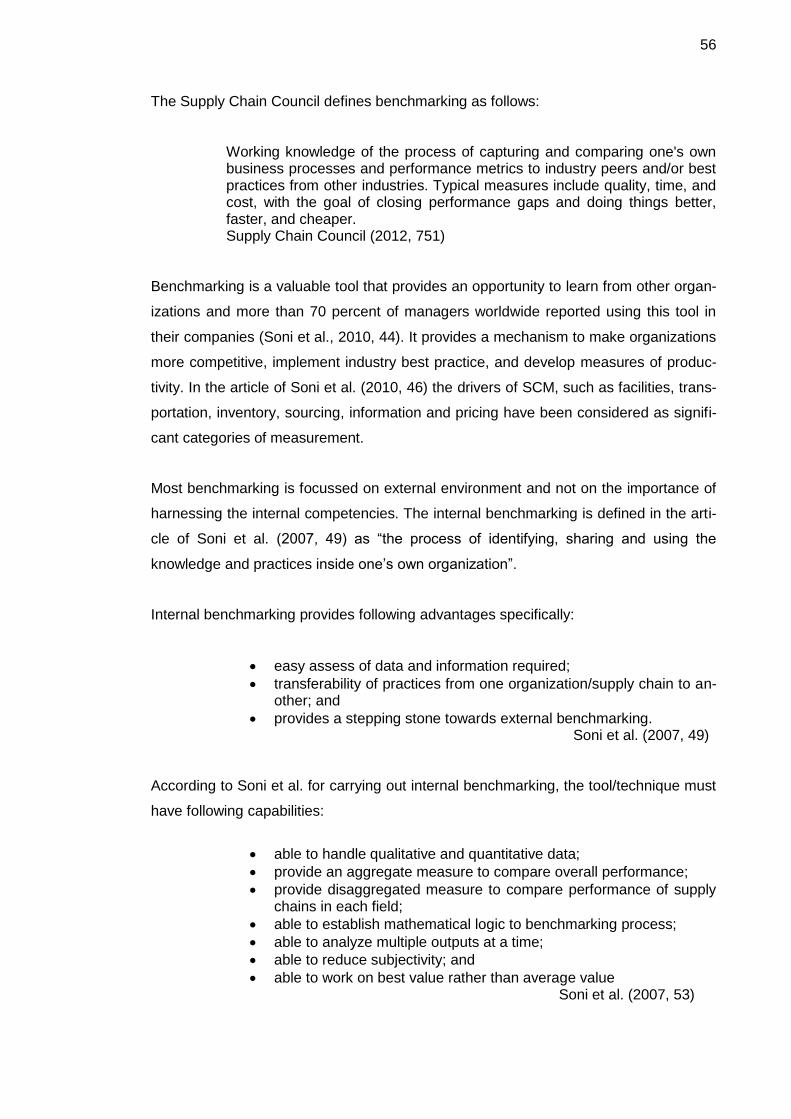
56
The Supply Chain Council defines benchmarking as follows:
Working knowledge of the process of capturing and comparing one's own business processes and performance metrics to industry peers and/or best practices from other industries. Typical measures include quality, time, and cost, with the goal of closing performance gaps and doing things better, faster, and cheaper. Supply Chain Council (2012, 751)
Benchmarking is a valuable tool that provides an opportunity to learn from other organ-
izations and more than 70 percent of managers worldwide reported using this tool in
their companies (Soni et al., 2010, 44). It provides a mechanism to make organizations
more competitive, implement industry best practice, and develop measures of produc-
tivity. In the article of Soni et al. (2010, 46) the drivers of SCM, such as facilities, trans-
portation, inventory, sourcing, information and pricing have been considered as signifi-
cant categories of measurement.
Most benchmarking is focussed on external environment and not on the importance of
harnessing the internal competencies. The internal benchmarking is defined in the arti-
cle of Soni et al. (2007, 49) as “the process of identifying, sharing and using the
knowledge and practices inside one’s own organization”.
Internal benchmarking provides following advantages specifically:
easy assess of data and information required;
transferability of practices from one organization/supply chain to an-other; and
provides a stepping stone towards external benchmarking. Soni et al. (2007, 49)
According to Soni et al. for carrying out internal benchmarking, the tool/technique must
have following capabilities:
able to handle qualitative and quantitative data;
provide an aggregate measure to compare overall performance;
provide disaggregated measure to compare performance of supply chains in each field;
able to establish mathematical logic to benchmarking process;
able to analyze multiple outputs at a time;
able to reduce subjectivity; and
able to work on best value rather than average value Soni et al. (2007, 53)
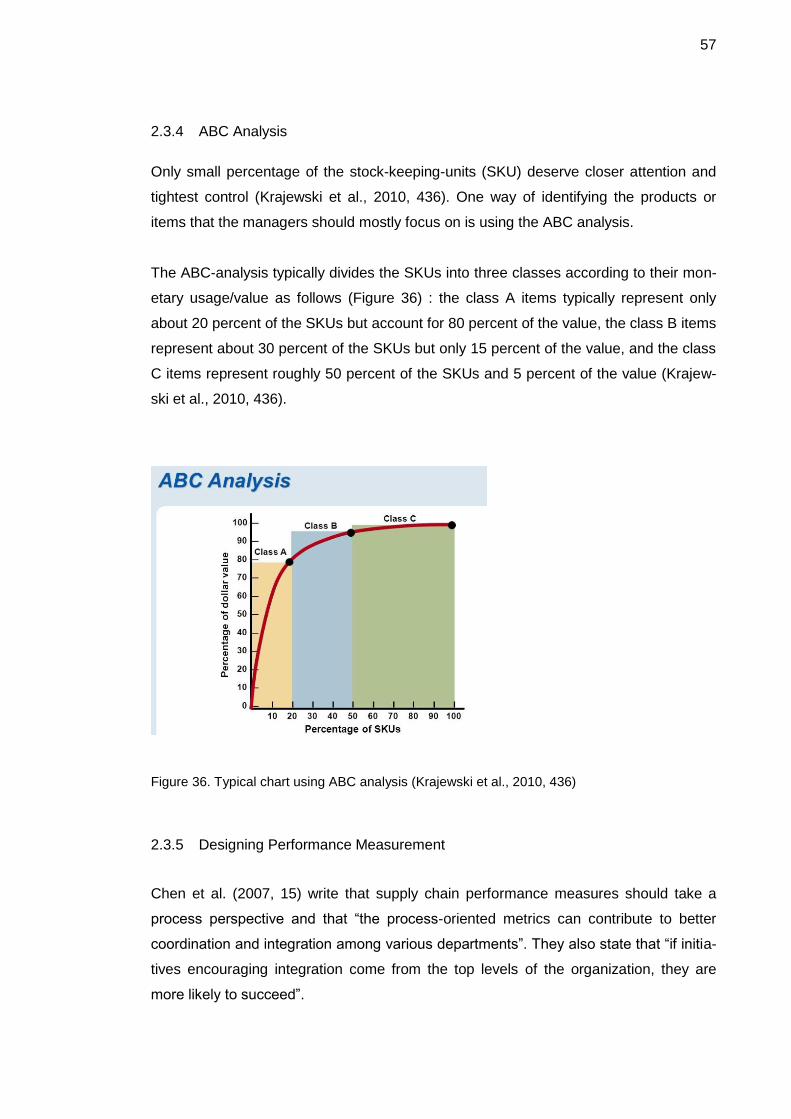
57
2.3.4 ABC Analysis
Only small percentage of the stock-keeping-units (SKU) deserve closer attention and
tightest control (Krajewski et al., 2010, 436). One way of identifying the products or
items that the managers should mostly focus on is using the ABC analysis.
The ABC-analysis typically divides the SKUs into three classes according to their mon-
etary usage/value as follows (Figure 36) : the class A items typically represent only
about 20 percent of the SKUs but account for 80 percent of the value, the class B items
represent about 30 percent of the SKUs but only 15 percent of the value, and the class
C items represent roughly 50 percent of the SKUs and 5 percent of the value (Krajew-
ski et al., 2010, 436).
Figure 36. Typical chart using ABC analysis (Krajewski et al., 2010, 436)
2.3.5 Designing Performance Measurement
Chen et al. (2007, 15) write that supply chain performance measures should take a
process perspective and that “the process-oriented metrics can contribute to better
coordination and integration among various departments”. They also state that “if initia-
tives encouraging integration come from the top levels of the organization, they are
more likely to succeed”.
58
According to Kurien et al. (2011, 23) there is a challenge in choosing the right “Meas-
urement system design” and “identifying what you need to measure so as to concen-
trate on what is absolutely vital”. Further, according to Kurien et al. (2011, 28) “a PMS
should be derived from the company’s objectives” and “a PMS should be appropriately
focused on short- and long-term results, different types of performances (e.g. cost,
quality, delivery, flexibility and dependability), various perspectives (e.g. the customer,
the shareholder, the competitor, the internal and the innovativeness perspective), and
various organisational levels (e.g. global and local performance)”.
Gautreau et al. (2001, 156) have a list for managers to consider when implementing
PMS: “1. Focus on a few key measures. Too many measures may blur the strate-
gy/goal. 2. Use measures that employees can control. If they cannot control the
measures, employees will feel alienated and disgruntled. 3. Keep the lines of commu-
nication open and revise the programme often with changes in corporate structure and
strategy”.
According to Elrod et al. (2013, 48) “the supply chain should be measured to evaluate
performance” and that the “measures most important to the performance of the organi-
zation should be selected”.
According to Carlucci (2010, 67) in order to prevent information overload “it is reasona-
ble that any effective PMS has to include a limited number of indicators, i.e. key per-
formance indicators (KPIs)”.
Bai et al. (2014) write in their article that with the large set of potential sustainable sup-
ply chain performance measures, “identifying key performance indicators (KPI) is thus
the best practice policy for operations and supply chain management”.
Slack et al. (2010, 607) stress that there should be “a clear link between the operation’s
overall strategy, the most important (or ‘key’) performance indicators (KPIs) that re-
flect strategic objectives, and the bundle of detailed measures that are used to ‘flesh
out’ each key performance indicator”.
59
2.4 Conclusions of the Literature Review
In research for the theoretical framework it soon became clear that the supply chain
management is both a very popular and a wide topic and data written and researched
keeps adding up all the time. The benefits of the effective supply chain management
are however clear: lower inventories, lower costs, higher productivity, higher profits and
greater customer loyalty to name a few.
In the wide concept of supply chain management a good question is: who has the re-
sponsibility of the supply chain’s effectivity? Today’s supply chains that often span to
supply networks also on global level require co-operation, defined processes and re-
sponsibilities as well as measurements to follow and improve the implementation. The
chain or network can not be operated by one person and thus it is essential to learn co-
operative, cross-functional and team-oriented approach for managing the operations
with the customer satisfaction in the main focus. The effective cross-functional teams
approach on intra-organisational level enables effective inter-organisational co-
operation. In the management point of view a wide set of cross-functional skills are
required; for example demand forecasting and supply planning, sourcing and supplier
management, customer and distribution channel management along with the inter-
organisational skills that are needed for cross-functional co-operation.
In addition to effective communication, an effective supply chain needs shared fore-
casts and visibility to order status in real time as well as access to inventory data of all
partners. As the structure of supply chain or network by nature is complicated, the de-
velopment should focus on simplification, process reliability improvement, process var-
iability reduction and complexity reduction. Process documenting enables the monitor-
ing and improving the process functions as well as helps standardizing the processes
between supply chain member companies. Supply chain’s eight business processes
should all be equally focused on strategic level since measuring the actual process
performance should have strategic basis.
There are overwhelming pool of actual performance measures to choose from but in
the supply chain performance measurement a process perspective should be chosen
and focus should be on few key measures or KPIs that have clear link to strategic
goals such as case company’s customer satisfaction, inventory goals and forecasting
accuracy.
60
3 Project Progress
As stated in the introduction, the project was divided into two subprojects and main
objectives:
1. Creating the internal production and supply chain process description and meas-
urement tools for the process
2. Developing the production planning system by transferring the internal sales fore-
casts straight to the system without manual processing in between systems
The project group worked mainly with the process description and measurement tools
and the development of the production planning system was done by a smaller group
led by the production management.
3.1 Developing the Process and Process Performance Measurement Tools
In the case company, the ISO 9001 quality management system was already in use.
The documentation was more or less up to date on departmental level (“subprocess-
es), but no macro-level or so called “main process” for the internal supply chain was
documented. The goal of the project group was to create a process description includ-
ing the process performance measurement tools description.
The main process description creation within the project was divided into three parts:
1. The collecting of the existing process descriptions and measurement systems
following with development suggestions
2. Documenting the process description and measurement systems/meters to the
quality system and defining the responsibilities
3. Identifying the key persons in the process and organizing the process introduc-
tion/training and starting of the measuring/reporting
To start with the work, the project group proposed an initial main process model based
on the own manufactured product’s life cycle or its flow in the internal supply chain and
it was further modified with the steering group as follows.
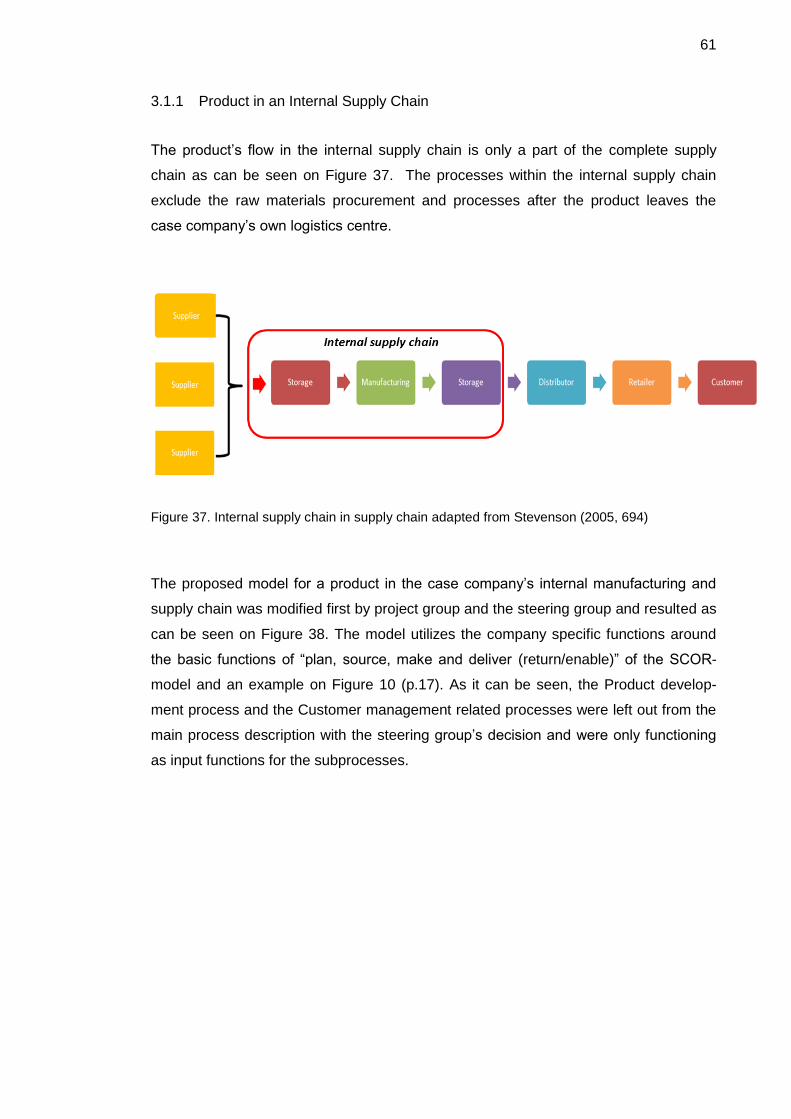
61
3.1.1 Product in an Internal Supply Chain
The product’s flow in the internal supply chain is only a part of the complete supply
chain as can be seen on Figure 37. The processes within the internal supply chain
exclude the raw materials procurement and processes after the product leaves the
case company’s own logistics centre.
Figure 37. Internal supply chain in supply chain adapted from Stevenson (2005, 694)
The proposed model for a product in the case company’s internal manufacturing and
supply chain was modified first by project group and the steering group and resulted as
can be seen on Figure 38. The model utilizes the company specific functions around
the basic functions of “plan, source, make and deliver (return/enable)” of the SCOR-
model and an example on Figure 10 (p.17). As it can be seen, the Product develop-
ment process and the Customer management related processes were left out from the
main process description with the steering group’s decision and were only functioning
as input functions for the subprocesses.
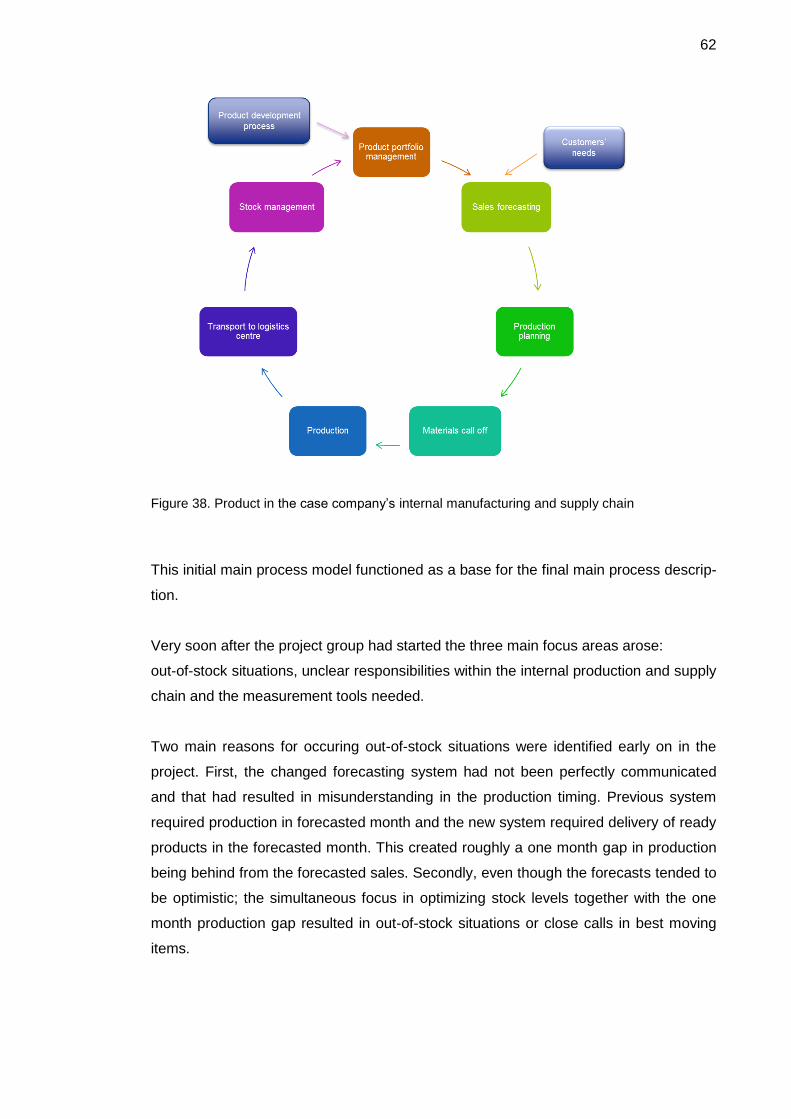
62
Figure 38. Product in the case company’s internal manufacturing and supply chain
This initial main process model functioned as a base for the final main process descrip-
tion.
Very soon after the project group had started the three main focus areas arose:
out-of-stock situations, unclear responsibilities within the internal production and supply
chain and the measurement tools needed.
Two main reasons for occuring out-of-stock situations were identified early on in the
project. First, the changed forecasting system had not been perfectly communicated
and that had resulted in misunderstanding in the production timing. Previous system
required production in forecasted month and the new system required delivery of ready
products in the forecasted month. This created roughly a one month gap in production
being behind from the forecasted sales. Secondly, even though the forecasts tended to
be optimistic; the simultaneous focus in optimizing stock levels together with the one
month production gap resulted in out-of-stock situations or close calls in best moving
items.
63
Even though the one month gap was eventually closed the question of follow-up re-
sponsibilities rose up. Who is responsible for making sure the out-of-stock situations
will not occur? The answer to this question should be in the process description.
Unclear responsibilities is a wide term and should be examined on many levels in the
process. First of all, the ownership of the main process was discussed with the steering
group and it was decided that the owner of the internal supply chain process of own
manufactured goods is the manufacturing department which is responsible for right-
time producing and delivering the goods based on internal forecasts. This ownership
also means that the manufacturing department has the right to expect other depart-
ments or sales divisions to fulfill their responsibilities in the process in order to enable
efficient and smooth production planning.
Clearing up the main responsibility of the functionality of the main process as a whole,
the unclear and overlapping tasks had to be agreed upon. The basic input and output
functions along the progressing process were good place to identify the essential and
relevant fucntions that had to be completed by someone in order for the process to go
on smoothly. The responsibilities along the internal supply chain should be described in
the process description and they should be communicatied to the relevant persons
working within the chain.
One of the seven main goals of the steering group was “Developing the supply chain
measurement tools and practices for own production”. The measurement system was
not created only for the measurement’s sake but to guide the process and for setting
targets for the performance.
64
3.1.2 Existing Processes and Measurement Tools
The following existing processes and process descriptions were identified as the sub-
processes for the main processes:
Portfolio management related processes: Description of the Product Portfo-
lio Management: Input fucntions from Innovation-/Product Development pro-
cess, New Product Opening to the Production Plants , MDM Update Process
New Product Opening, Product Ending Process
Sales forecasting related processes: Description of the Sales Forecasting:
The customers’ needs function as input/guidance in the process
Production planning related processes: Own production’s production plan-
ning and Own Production Forecasting Description and Instructions
Materials (raw materials & packaking & labelling) procurement and call off
related processes: Materials Procurement, Materials Receiving and Quality
Control , Printed Materials and Labels Control
Production related processes: Defining Standard Pricing, Production Pro-
cess/ Main Process, Product Production, Vinegar Production and White Vinegar
Production
Finished products handling/transporting related process: Stockremoval In-
structions
Stock management related processes: Arrivals Process and Departing
Goods Process, Procurement Planning Description–document’s Monthly Dis-
cussions about Sales Forecasts and Meters
The following topics were brought to special attention in the main process:
The role of the production management is emphasized as the process owner
and the timely executor of the sales forecasts (“minimum reaches follow up”)
The product portfolio management and the sales forecasting have to support
the own production’s efficient operation
The new items and changes communication among R&D/sales divi-
sions/production/MDM/logistics should be more efficient – one suggestion was
to move the product cards from word/excel to the MDM system and its auto-
mated workflow
65
The visibility to the production was to be increased with the weekly availability
reporting and monthly updated production plan for the sales/customer service
use
The overall visibility to the production plants were to be added by adding intra-
net activity (“news”)
The following existing meters and reports were identified in the sub-processes:
Delivery accuracy to the customer (from the logistics centre)
Forecasting accuracy
Non-marketable items measurement (production materials)
Standardpricing development, New items launch follow-up
Production successrate%(lead time/efficiency)
Production line utilization rate, Production loss reporting (max 1,5% / product)
Factory defect notices, Batch exceptions / Utilization decisions (quality)
Environmental meters, Waste statistics (The waste quantity compared to the
production quantity does not exceed 0,5 %)
Quality-, environment- and safety exeptions
Logistics operations: volyms, efficiency, profitability, accuracy, lead time
Stock reaches and values follow-up (Procurement department’s KPI-reporting &
monthly meetings with Product managers)
No actual performance measurement model seemed to be followed but individual pro-
cesses are measured for example by the SCOR performance categories of reliability,
responsiveness, agility, cost and assets management (p.46).
The control points which ensure the process execution and flow but do not in practice
measure the development were identified and added along the project as follows:
Product Portfolio Management – monthly follow up by procurement department
Sales Forecasting – monthly follow up by procurement department
Monthly Discussions about Portfolios, Forecasts, Production Plans and Meters
- monthly follow up by procurement department
Updating of the Own Production Availability Report (New/added during the pro-
ject) - monthly follow up by procurement department
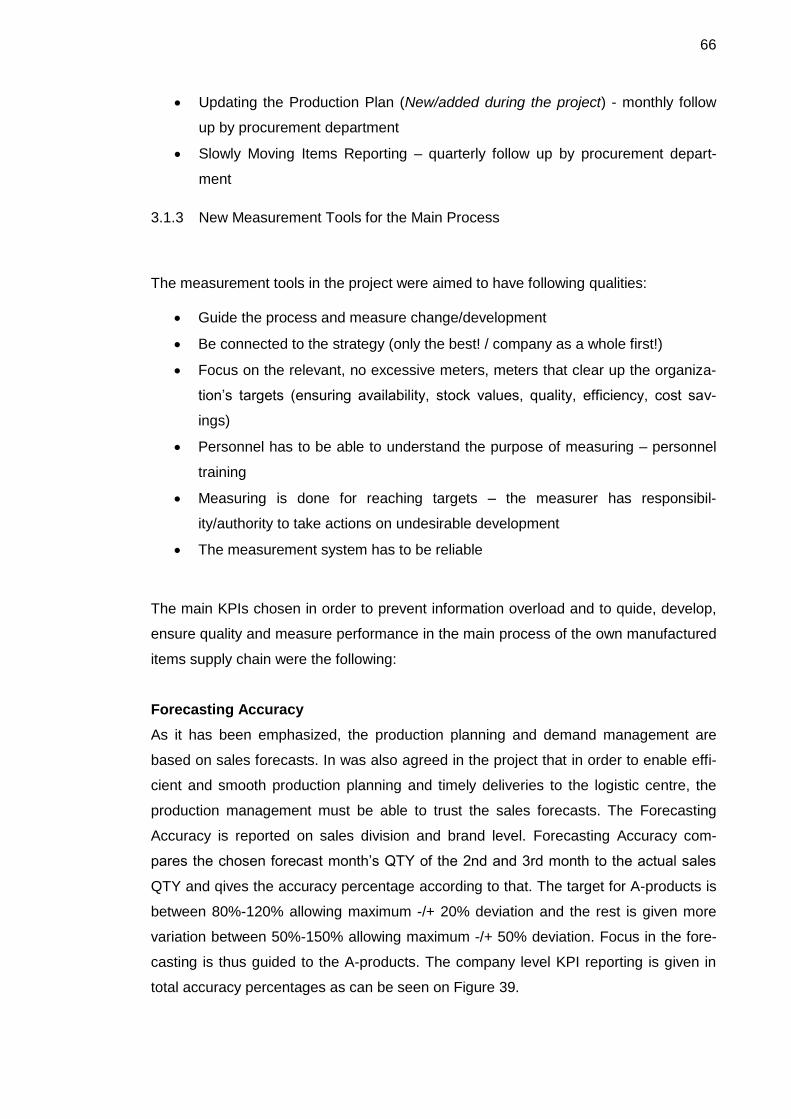
66
Updating the Production Plan (New/added during the project) - monthly follow
up by procurement department
Slowly Moving Items Reporting – quarterly follow up by procurement depart-
ment
3.1.3 New Measurement Tools for the Main Process
The measurement tools in the project were aimed to have following qualities:
Guide the process and measure change/development
Be connected to the strategy (only the best! / company as a whole first!)
Focus on the relevant, no excessive meters, meters that clear up the organiza-
tion’s targets (ensuring availability, stock values, quality, efficiency, cost sav-
ings)
Personnel has to be able to understand the purpose of measuring – personnel
training
Measuring is done for reaching targets – the measurer has responsibil-
ity/authority to take actions on undesirable development
The measurement system has to be reliable
The main KPIs chosen in order to prevent information overload and to quide, develop,
ensure quality and measure performance in the main process of the own manufactured
items supply chain were the following:
Forecasting Accuracy
As it has been emphasized, the production planning and demand management are
based on sales forecasts. In was also agreed in the project that in order to enable effi-
cient and smooth production planning and timely deliveries to the logistic centre, the
production management must be able to trust the sales forecasts. The Forecasting
Accuracy is reported on sales division and brand level. Forecasting Accuracy com-
pares the chosen forecast month’s QTY of the 2nd and 3rd month to the actual sales
QTY and qives the accuracy percentage according to that. The target for A-products is
between 80%-120% allowing maximum -/+ 20% deviation and the rest is given more
variation between 50%-150% allowing maximum -/+ 50% deviation. Focus in the fore-
casting is thus guided to the A-products. The company level KPI reporting is given in
total accuracy percentages as can be seen on Figure 39.
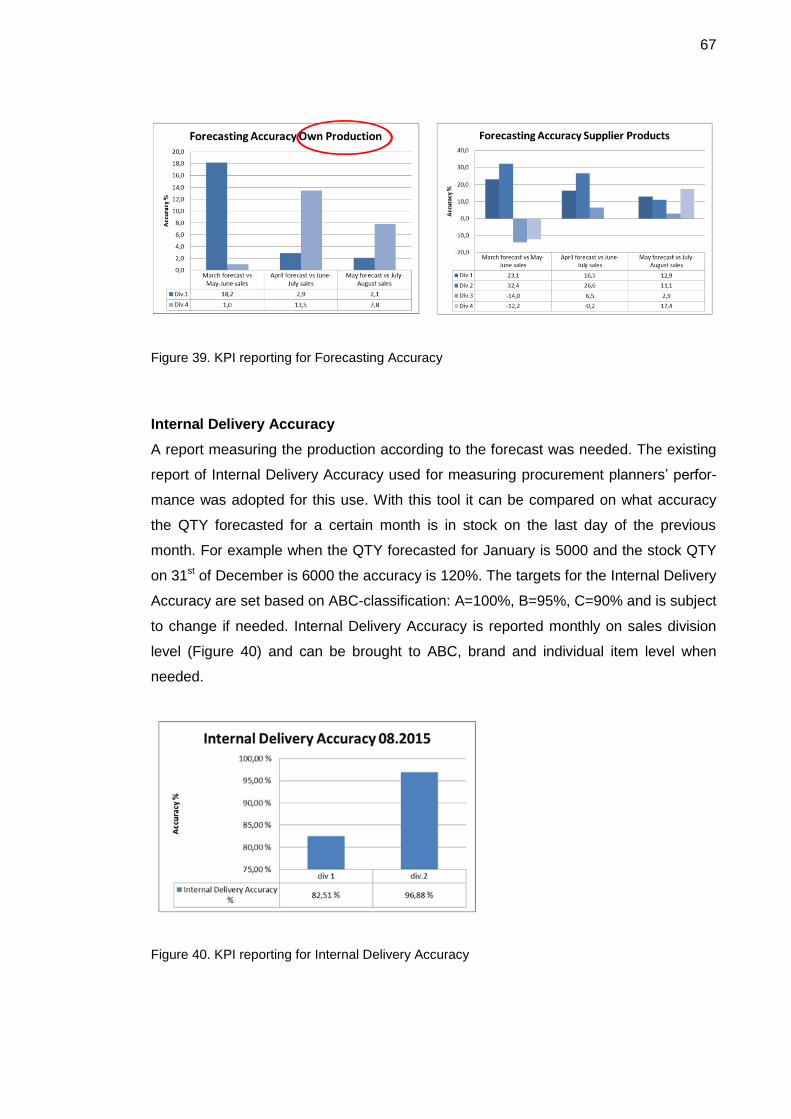
67
Figure 39. KPI reporting for Forecasting Accuracy
Internal Delivery Accuracy
A report measuring the production according to the forecast was needed. The existing
report of Internal Delivery Accuracy used for measuring procurement planners’ perfor-
mance was adopted for this use. With this tool it can be compared on what accuracy
the QTY forecasted for a certain month is in stock on the last day of the previous
month. For example when the QTY forecasted for January is 5000 and the stock QTY
on 31st of December is 6000 the accuracy is 120%. The targets for the Internal Delivery
Accuracy are set based on ABC-classification: A=100%, B=95%, C=90% and is subject
to change if needed. Internal Delivery Accuracy is reported monthly on sales division
level (Figure 40) and can be brought to ABC, brand and individual item level when
needed.
Figure 40. KPI reporting for Internal Delivery Accuracy
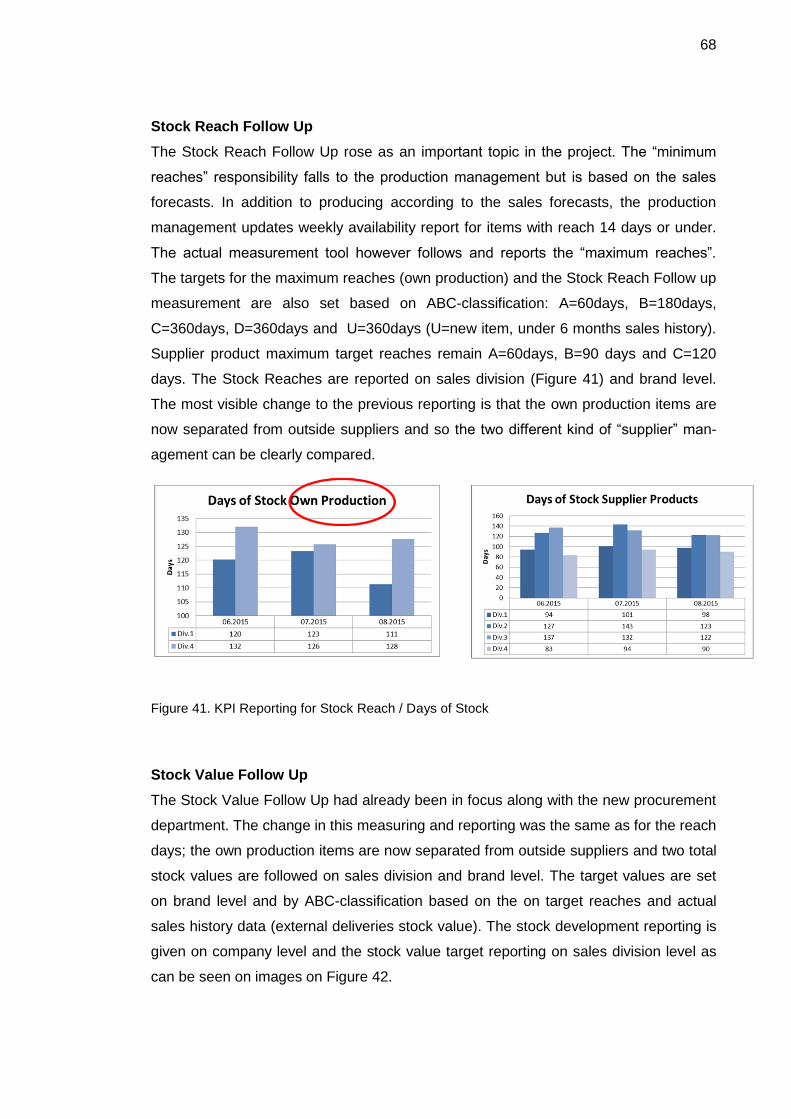
68
Stock Reach Follow Up
The Stock Reach Follow Up rose as an important topic in the project. The “minimum
reaches” responsibility falls to the production management but is based on the sales
forecasts. In addition to producing according to the sales forecasts, the production
management updates weekly availability report for items with reach 14 days or under.
The actual measurement tool however follows and reports the “maximum reaches”.
The targets for the maximum reaches (own production) and the Stock Reach Follow up
measurement are also set based on ABC-classification: A=60days, B=180days,
C=360days, D=360days and U=360days (U=new item, under 6 months sales history).
Supplier product maximum target reaches remain A=60days, B=90 days and C=120
days. The Stock Reaches are reported on sales division (Figure 41) and brand level.
The most visible change to the previous reporting is that the own production items are
now separated from outside suppliers and so the two different kind of “supplier” man-
agement can be clearly compared.
Figure 41. KPI Reporting for Stock Reach / Days of Stock
Stock Value Follow Up
The Stock Value Follow Up had already been in focus along with the new procurement
department. The change in this measuring and reporting was the same as for the reach
days; the own production items are now separated from outside suppliers and two total
stock values are followed on sales division and brand level. The target values are set
on brand level and by ABC-classification based on the on target reaches and actual
sales history data (external deliveries stock value). The stock development reporting is
given on company level and the stock value target reporting on sales division level as
can be seen on images on Figure 42.
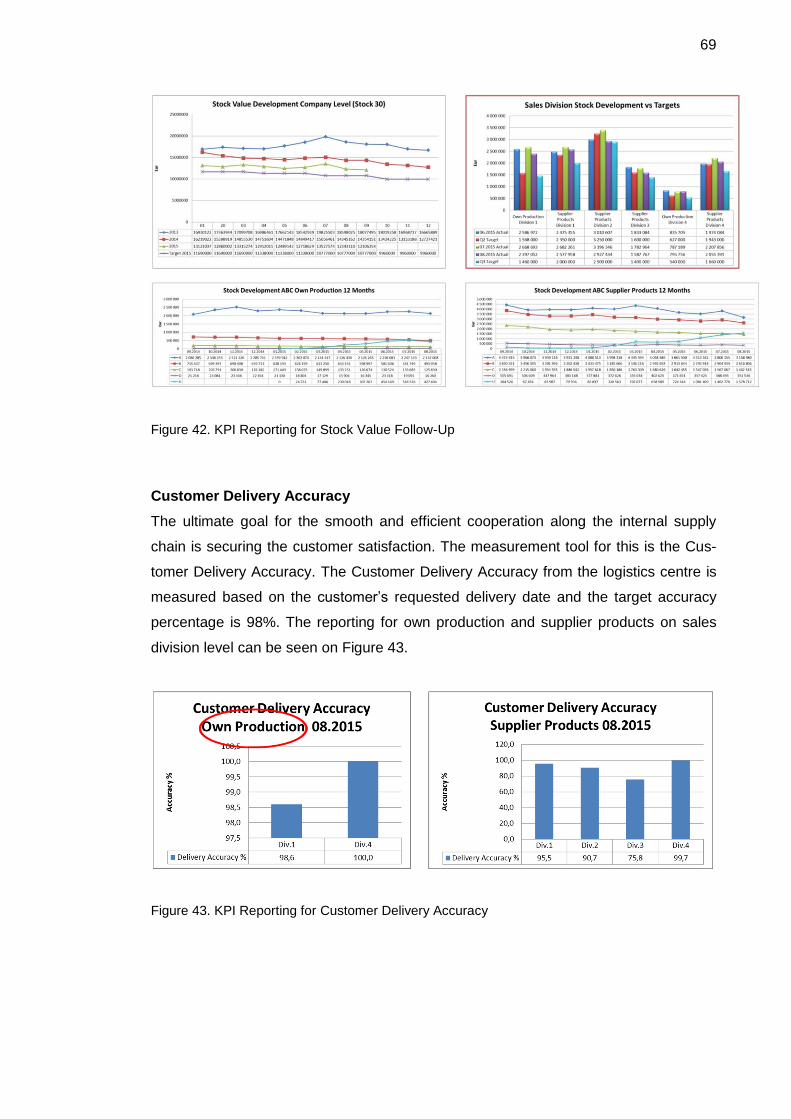
69
Figure 42. KPI Reporting for Stock Value Follow-Up
Customer Delivery Accuracy
The ultimate goal for the smooth and efficient cooperation along the internal supply
chain is securing the customer satisfaction. The measurement tool for this is the Cus-
tomer Delivery Accuracy. The Customer Delivery Accuracy from the logistics centre is
measured based on the customer’s requested delivery date and the target accuracy
percentage is 98%. The reporting for own production and supplier products on sales
division level can be seen on Figure 43.
Figure 43. KPI Reporting for Customer Delivery Accuracy
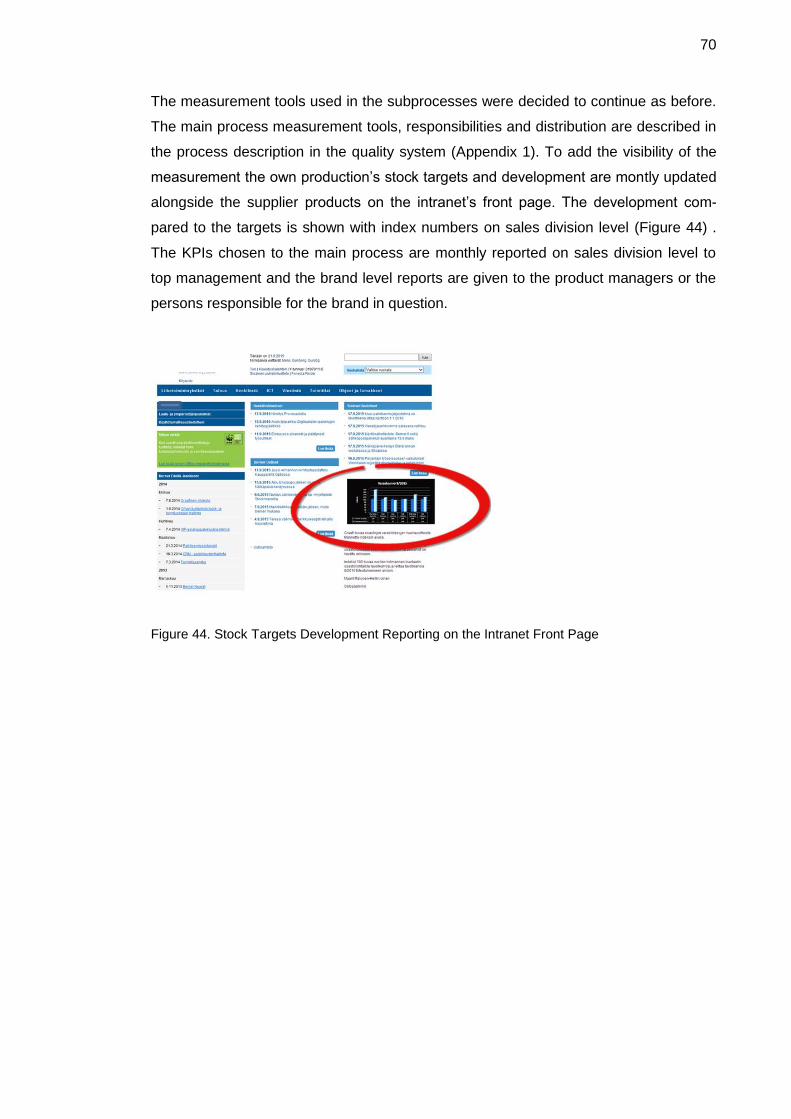
70
The measurement tools used in the subprocesses were decided to continue as before.
The main process measurement tools, responsibilities and distribution are described in
the process description in the quality system (Appendix 1). To add the visibility of the
measurement the own production’s stock targets and development are montly updated
alongside the supplier products on the intranet’s front page. The development com-
pared to the targets is shown with index numbers on sales division level (Figure 44) .
The KPIs chosen to the main process are monthly reported on sales division level to
top management and the brand level reports are given to the product managers or the
persons responsible for the brand in question.
Figure 44. Stock Targets Development Reporting on the Intranet Front Page
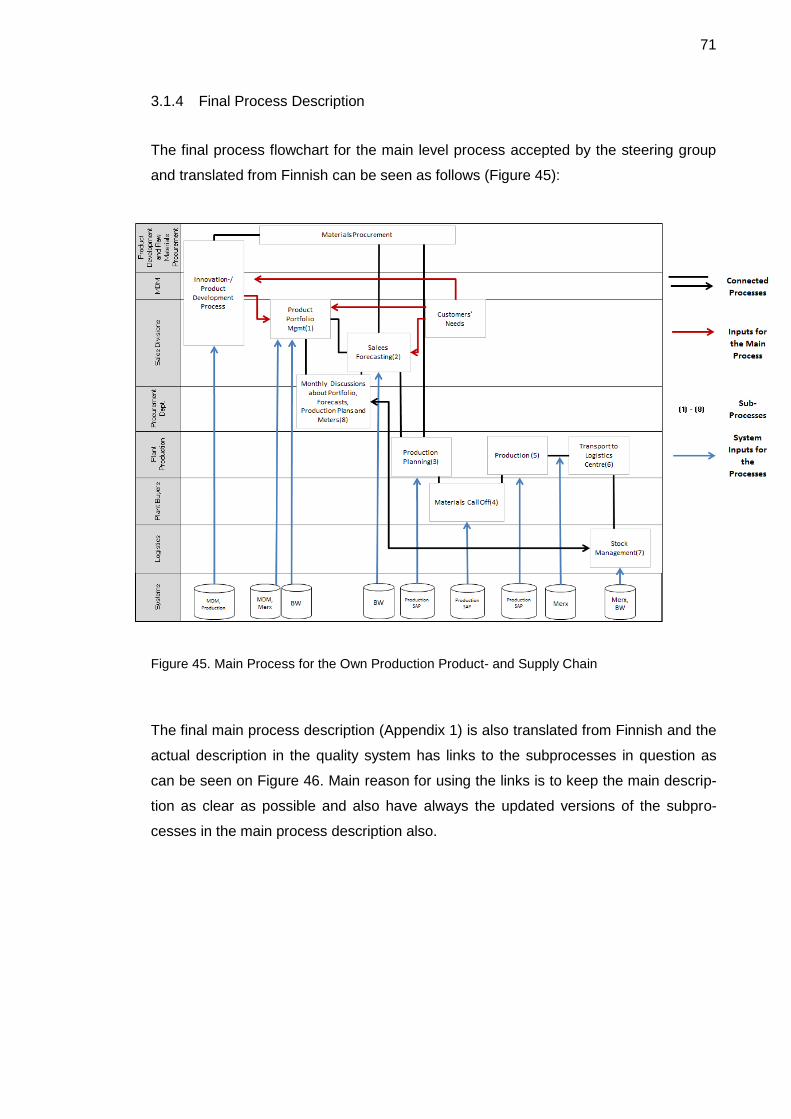
71
3.1.4 Final Process Description
The final process flowchart for the main level process accepted by the steering group
and translated from Finnish can be seen as follows (Figure 45):
Figure 45. Main Process for the Own Production Product- and Supply Chain
The final main process description (Appendix 1) is also translated from Finnish and the
actual description in the quality system has links to the subprocesses in question as
can be seen on Figure 46. Main reason for using the links is to keep the main descrip-
tion as clear as possible and also have always the updated versions of the subpro-
cesses in the main process description also.
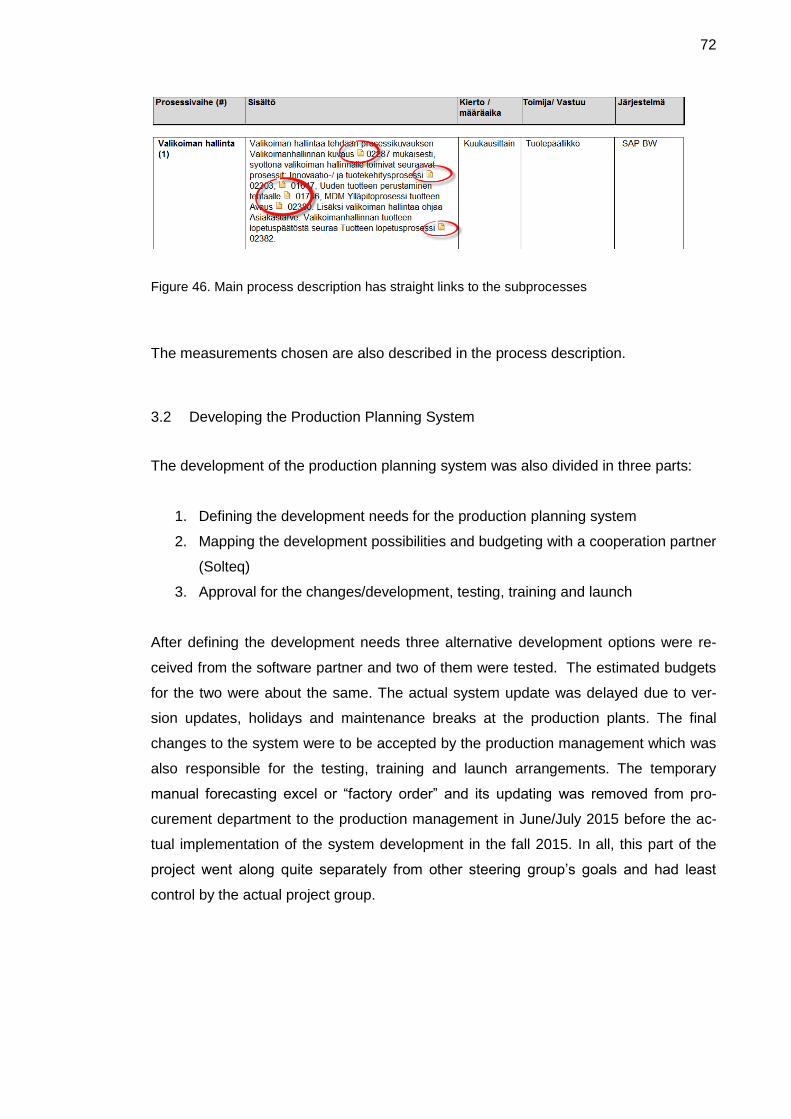
72
Figure 46. Main process description has straight links to the subprocesses
The measurements chosen are also described in the process description.
3.2 Developing the Production Planning System
The development of the production planning system was also divided in three parts:
1. Defining the development needs for the production planning system
2. Mapping the development possibilities and budgeting with a cooperation partner
(Solteq)
3. Approval for the changes/development, testing, training and launch
After defining the development needs three alternative development options were re-
ceived from the software partner and two of them were tested. The estimated budgets
for the two were about the same. The actual system update was delayed due to ver-
sion updates, holidays and maintenance breaks at the production plants. The final
changes to the system were to be accepted by the production management which was
also responsible for the testing, training and launch arrangements. The temporary
manual forecasting excel or “factory order” and its updating was removed from pro-
curement department to the production management in June/July 2015 before the ac-
tual implementation of the system development in the fall 2015. In all, this part of the
project went along quite separately from other steering group’s goals and had least
control by the actual project group.
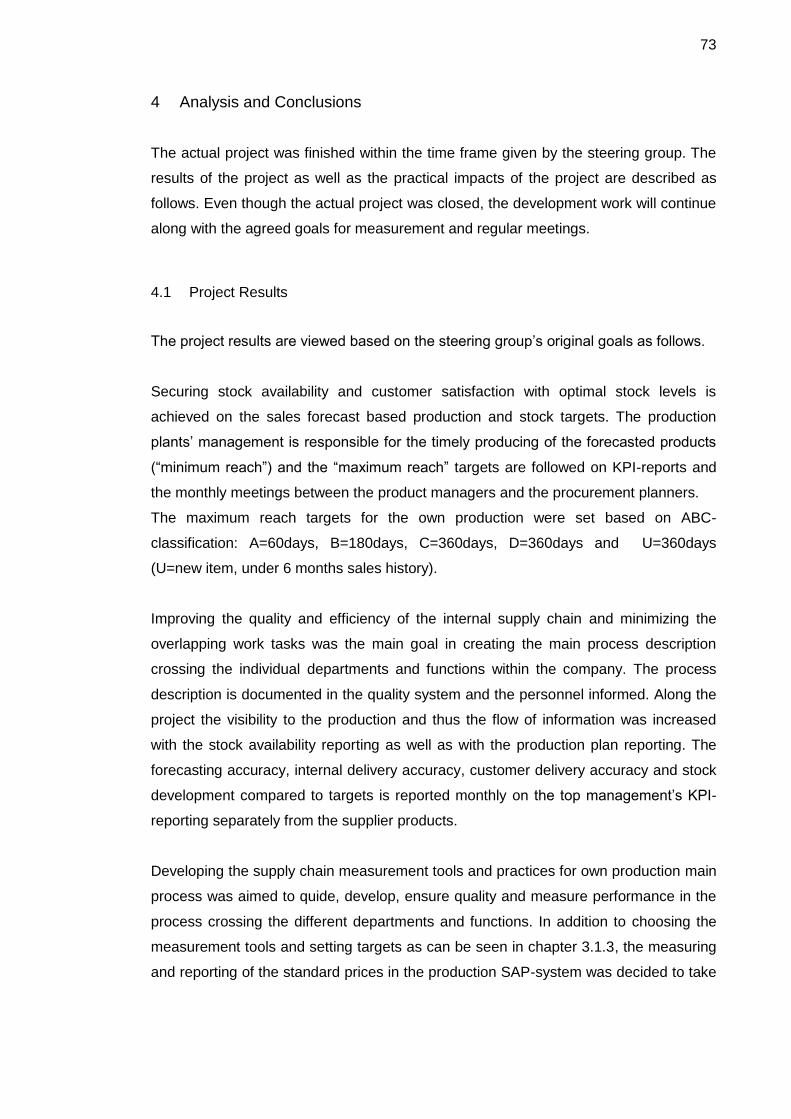
73
4 Analysis and Conclusions
The actual project was finished within the time frame given by the steering group. The
results of the project as well as the practical impacts of the project are described as
follows. Even though the actual project was closed, the development work will continue
along with the agreed goals for measurement and regular meetings.
4.1 Project Results
The project results are viewed based on the steering group’s original goals as follows.
Securing stock availability and customer satisfaction with optimal stock levels is
achieved on the sales forecast based production and stock targets. The production
plants’ management is responsible for the timely producing of the forecasted products
(“minimum reach”) and the “maximum reach” targets are followed on KPI-reports and
the monthly meetings between the product managers and the procurement planners.
The maximum reach targets for the own production were set based on ABC-
classification: A=60days, B=180days, C=360days, D=360days and U=360days
(U=new item, under 6 months sales history).
Improving the quality and efficiency of the internal supply chain and minimizing the
overlapping work tasks was the main goal in creating the main process description
crossing the individual departments and functions within the company. The process
description is documented in the quality system and the personnel informed. Along the
project the visibility to the production and thus the flow of information was increased
with the stock availability reporting as well as with the production plan reporting. The
forecasting accuracy, internal delivery accuracy, customer delivery accuracy and stock
development compared to targets is reported monthly on the top management’s KPI-
reporting separately from the supplier products.
Developing the supply chain measurement tools and practices for own production main
process was aimed to quide, develop, ensure quality and measure performance in the
process crossing the different departments and functions. In addition to choosing the
measurement tools and setting targets as can be seen in chapter 3.1.3, the measuring
and reporting of the standard prices in the production SAP-system was decided to take
74
under further development during the year 2015. More detailed data was wanted with
less manual work.
Transferring the Sales Forecasts straight to the production planning system (SAP –
separate module) did not progress as fast as the rest of the project. There were delays
caused by version updates, holidays and maintenance breaks at the production plants.
However, the final plan was to take the updated module in use around September
2015. The production is planned purely based on the sales forecast, stock data and
minimum batch quantities. The forecast numbers will not be further interpreted by the
production management.
Cost savings achieved by the project can be measured most concretely with the devel-
opment of the stock values. It was counted that if the stock value targets based on the
reach targets and sales history data would be accomplished during 2015, the savings
created by the released stock equity and warehouse costs would be around 1,3M€.
The long-sighted production planning based on quality sales forecasting enables more
efficient use of resources and hopefully is seen as positive development in the produc-
tion measurement tools such as standard prices, production and materials loss and
production line utilization rate. With minimizing the overlapping worktasks for example
in the communication of the out-of-stock situations the working is more time efficient.
For ensuring the good internal co-operation it was recommended that the sales division
level regular production meetings would be organized with the production management
at least 1-2 times a year, possibly quarterly. There were also discussions about the
company level own production related meetings once in 1-2 years but nothing was de-
cided. Good internal communications are essential in product development and up-
dates. The suggestion to move the product cards from word/excel to the MDM system
and it’s automated workflow was to be considered after SYNKKA-updates in the spring
2015 but the development question remains open. In all, the ensuring of the good in-
ternal co-operation is the responsibility of the all actors in the process and can not be
forced by creating a process description and instructions alone.
The actual measurement on project’s results and impact on all KPI-measures can be
seen with some delay by the end of the year 2015. The stock development from the
beginning of the year has not been on target as hoped for several reasons. Although
the total stock value and reach had started to go down by the beginning of April by 4%,

75
the development started to turn to the opposite direction during the spring and summer.
One reason for this was the new regulation on classification, labelling and packaging
("CLP Regulation") that can be seen in the rise of new products (ABC-classification
letter U). All the existing products that are kept in the portfolios have stock with new
and old packaking for a while. Another reason affecting all brands was the one month
summer break at the production plant 1 during ventilation renovation and holidays. Due
to these two reasons only, the production was made ahead of schedule according to
sales forecasting in order to avoid the out-of-stock situations after summer holidays. At
the same time the consumer behaviour is not very constant and predictable due to the
tough economic times and overstock can grow fast. Towards the end of the year (Oct –
Dec), more target oriented development should be seen or careful analysis will be
needed for the product portfolios, sales forecasts and markets. The stock development
on ABC-level for all own production items during 01.2015 – 09.2015 can be seen on
Figure 47.
Figure 47. The Stock Development for Own Production 01.2015 – 09.2015
76
4.2 Practical Impacts of the Project
A few post-project practical impacts of the project are worth mentioning.
First, the production plant’s availability reporting that was started already during the first
full month of the project has become a time saving tool for the sales and customer ser-
vice. Although in the future the systems should be developed to provide the visibility,
the reporting has brought more efficiency to the process as it is today.
The process description updated to the quality system received positive feedback on
DNV auditing the main process description in February 2015.
The separation of own production KPI measurement from outside suppliers has been
an “eye-opener”. While the outside supplier KPIs have developed to the target direc-
tion, own production has stayed quite stable. This means that the own production has
not evolved and there is still room for development and optimization.
In the literature review it became clear that the strength of the supply chain is in inter-
organizational relationships. The regular production meetings have been started with
one sales division and will be started with another as soon as the organizational
changes have been completed. The production minimum quantities have been dis-
cussed on each SKU-level and have also been already optimized anew in all possible
items.
In all, the existing process description is a good tool to teach new employees and re-
turn to whenever there is a need.
4.3 Conclusions and Further Development
The project was successful considering the time-frame given and results achieved. The
development will not stop after the official project but rather was given a base to grow
on. The success of the future depends on the actors in the process, continuous meas-
urement follow up and the co-operation on all cross-functional levels. The focus on
quality product portfolio management and sales forecasting will lead to efficient produc-
tion planning and ultimate customer satisfaction.
77
The actual development suggestions by the project group were the following two: the
unification or centralizing the procurement of the packaking materials and development
of or process descriptions for the subcontracting processes of the own brand items
possibly along with the supplier management development project.
After the project and outside of the final report the following suggestions could also be
added: the supply chain process functions and its measurement could be benchmarked
on internal and external level for the continuous improvement and the KPIs and some
individual subprocess measures could be displayed on some kind of visual dashboard
for management’s use instead of monthly powerpoint reporting.
78
References
Books
Burt, David; Petcavage, Sheila; and Pinkerton, Richard, 2010,Supply Management 8th edition
Christopher, Martin, 2011, Logistics & Supply Chain Management 4th edition
Krajewski, Lee J.; Ritzman, Larry P.; and Malhotra, Manoj K., 2010, Operations Management:
Processes and Supply Chains 9th edition
Lamb, Charles W.; Hair Jr., Joseph F.; and McDaniel, Carl, 2014, MKTG8
Lester, Albert, 2007, Project Management Planning and Control 5th edition
Nahmias, Steven, 2001, Production and Operations Analysis 4th edition
Rushton, Alan; Croucher, Phil; and Baker, Peter, 2006, The Handbook of Logistics and Distribu-
tion Management 3rd
edition
Schary, Philip B. and Skjott-Larsen, Tage, 2003, Managing the Global Supply Chain 2nd
edition
Slack, Nigel; Chambers, Stuart; and Johnston, Robert, 2010, Operations management 6th edi-
tion
Stevenson, William J., 2005, Operations Management 8th edition
Thomsett, Michael C., 2010, The Little Black Book of Project Management 3rd
edition
Articles
AlSagheer, Abdullah; and Ahli, Maryam, 2011, Impact Of Supply Chain Integration On Business
Performance And Its Challenges, The International Business & Economics Research Journal
(Online)10.12 (2011): 79-92.
Art, v.B. & Kenneth, B.A. 2013, "The NEW BASICS of Supply Chain Management", Supply
Chain Management Review, vol. 17, no. 3, pp. 18-20,22-25.
79
Bai, Chunguang and Sarkis, Joseph, 2014: Determining and applying sustainable supplier
key performance indicators, Supply Chain Management: An International Journal
19/3 (2014), pp. 275–291
Basnet, Chuda, The measurement of internal supply chain integration, Management Research
Review36.2 (2013): 153-172.
Bourne, Lynda; Walker, Derek H T.: Advancing project management in learning organizations,
The Learning Organization11.2/3 (2004): 226-243.
Carlucci, Daniela, 2010: Evaluating and selecting key performance indicators: an ANP-based
model, Measuring Business Excellence, vol.14, no. 2, pp. 66-76
Chen, Haozhe; Mattioda, Daniel D; Daugherty, Patricia J.: Firm-wide integration and firm per-
formance, International Journal of Logistics Management18.1 (2007): 5-21.
Croxton, Keely L.; García‐Dastugue, Sebastián J.; Lambert, Douglas M; Rogers, Dale S., The
Supply Chain Management Processes, The International Journal of Logistics Management,
2001, Vol. 12 Iss: 2, pp.13 – 36.
Ellinger, A.E. & Ellinger, A.D., 2014, Leveraging human resource development expertise to im-
prove supply chain managers' skills and competencies, European Journal of Training and De-
velopment, vol. 38, no. 1, pp.118-135.
Ellinger, Alexander E; Daugherty, Patricia J; Keller, Scott B., The relationship between market-
ing/logistics interdepartmental integration and performance in U.S. manufacturing firms: An
empirical study, Journal of Business Logistics21.1 (2000): 1-22.
Elrod, Cassandra; Susan Murray, PE.; Bande, Sundeep, A Review of Performance Metrics for
Supply Chain Management, Engineering Management Journal; Sep2013, Vol. 25 Issue 3, p39
Gautreau, Andrew; Kleiner, Brian H., Recent Trends in Performance Measurement Systems –
The Balanced Scorecard Approach, Management Research news, 2001, Vol.24, 3/4, pp.153-
156
Gimenez, Cristina; Ventura, Eva, Logistics-production, logistics-marketing and external integra-
tion: Their impact on performance, International Journal of Operations & Production Manage-
ment25.1 (2005): 20-38.
80
Kaplan, Robert S.; Norton, David P., The Balanced Scorecard – Measures That Drive Perfor-
mance, Harvard Business Review. Jan/Feb1992, Vol. 70 Issue 1, p71-79. 9p.
Kazemkhanlou, Hamid; Ahadi, Hamid Reza: Study of Performance Measurement Practices in
Supply Chain Management, Proceedings of the 2014 International Conference on Industrial
Engineering and Operations Management Bali, Indonesia, January 7 – 9, 2014: 273-285.
Kurien, G.P., Qureshi, M.N., 2011, Study of performance measurement practices in supply
chain management, International Journal of Business, Management and Social Sciences
Vol. 2, No. 4, 2011, pp. 19-34
Lambert, Douglas M. ; García‐Dastugue, Sebastián J.; Croxton, Keely L., 2005, An Evaluation
of Process-Oriented Supply Chain Management Frameworks, Journal of Business Logistics,
Vol.26, No. 1, pp.25-51
Lorentz, H., Juuso Töyli, Solakivi, T. & Ojala, L. 2013, Priorities and determinants for supply
chain management skills development in manufacturing firms, Supply Chain Management, vol.
18, no. 4, pp. 358-375.
Mangan, J. & Christopher, M. 2005, Management development and the supply chain manager
of the future,International Journal of Logistics Management, vol. 16, no. 2, pp. 178-191
Morris, Peter W G. : Research and the future of project management,International Journal of
Managing Projects in Business3.1 (2010): 139-146.
Perkins, Mike ; Grey, Anna; and Remmers, Helge; What do we really mean by “Balanced
Scorecard”?, 2014, International Journal of Productivity and Performance Management Vol. 63
No. 2, pp.148-169
Psomas, Evangelos L; Fotopoulos, Christos V; Kafetzopoulos, Dimitrios P. : Core process man-
agement practices, quality tools and quality improvement in ISO 9001 certified manufacturing
companies, Business Process Management Journal17.3 (2011): 437-460.
Rahman, S. and Qing, N. 2014, Graduate students' perceptions of supply chain skills for supply
chain managers, Benchmarking, vol. 21, no. 2, pp. 276-299.
Soni, Gunjan and Kodali, Rambabu; Internal benchmarking for assessment of supply chain
performance, Benchmarking: An International Journal, 2010, Vol. 17 Iss: 1, pp.44 – 76.
81
Storey, John; Emberson, Caroline; Godsell, Janet; Harrison, Alan: Supply chain management:
theory, practice and future challenges, International Journal of Operations & Production Man-
agement, suppl. Supply chain management theory and practice26.7 (2006): 754.
Villachica, Steven W; Stone, Deborah L; Endicott, John.: PROJECT ALIGNMENT: Ensuring
Successful Development and Implementation From Day One, Performance Improvement43.10
(Nov/Dec 2004): 9-15.
Webdocuments
Supply Chain Council (2012), SCOR (Supply Chain Operations Reference Model) Revision
11.0, http://docs.huihoo.com/scm/supply-chain-operations-reference-model-r11.0.pdf
Webpages
http://image.slidesharecdn.com/presentationmdc-100619061951-phpapp02/95/supply-chain-management-in-the-motor-vehicle-industry-the-example-of-mini-21-728.jpg?cb=1276946975
http://www.slideshare.net/YSFSHIPPING/basics-of-supply-chain-managment?next_slideshow=2
http://www.tutorialspoint.com/management_concepts/project_management_triangle.htm

Appendix 1
1 (8)
Main Process Description for Own Production Product- and Supply Chain
Purpose of the Process
The purpose of the Main Process Description for Own Production Product- and Supply Chain is to ensure that the forecasted sales can be fulfilled ensuring good availability and stock turnover. The process defines the communication between the production, sales divisons and other internal stakeholders, and based on that communication the forecasted items are pro-duced at the production plants. With the quality product portfolio management and sales forecasting the efficient produc-tion planning is possible and thus the accurate delivery of the forecasted items.
Innovation-/ Product Development Process and Customers’ Needs function as input for the main process.
Process Scope
Figure 1 Process in the company’s operating model document no 01646
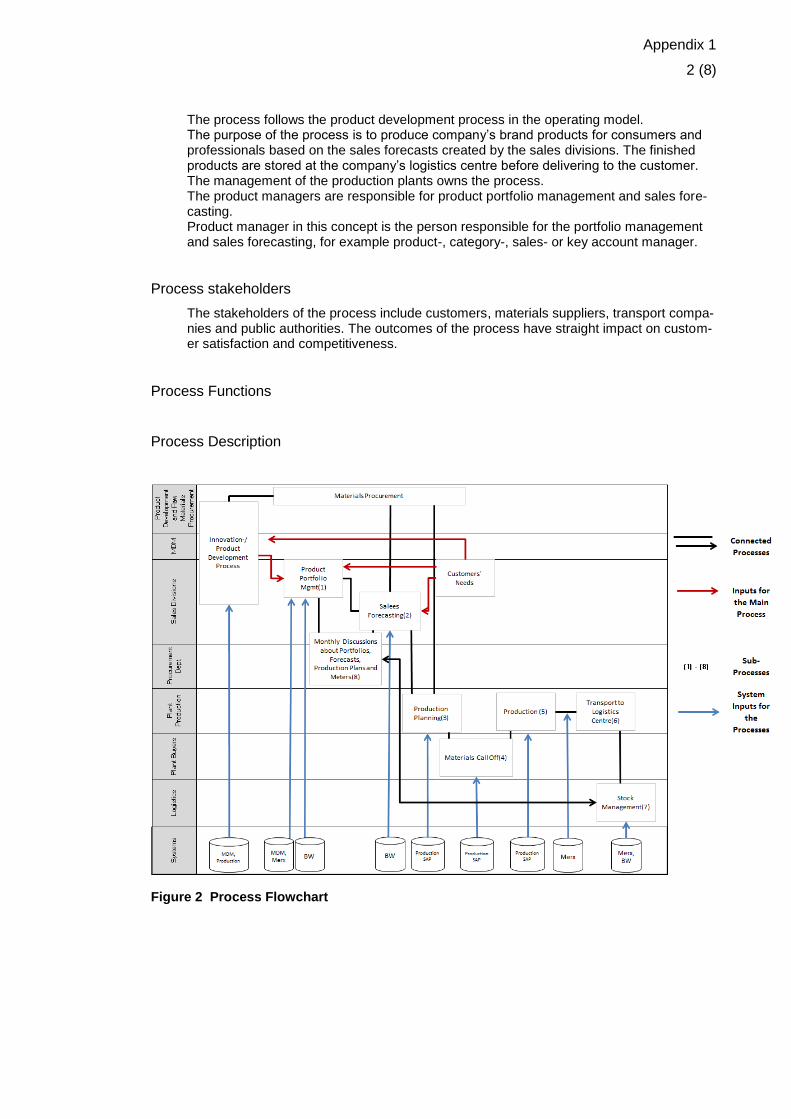
Appendix 1
2 (8)
The process follows the product development process in the operating model. The purpose of the process is to produce company’s brand products for consumers and professionals based on the sales forecasts created by the sales divisions. The finished products are stored at the company’s logistics centre before delivering to the customer. The management of the production plants owns the process. The product managers are responsible for product portfolio management and sales fore-casting. Product manager in this concept is the person responsible for the portfolio management and sales forecasting, for example product-, category-, sales- or key account manager.
Process stakeholders
The stakeholders of the process include customers, materials suppliers, transport compa-nies and public authorities. The outcomes of the process have straight impact on custom-er satisfaction and competitiveness.
Process Functions
Process Description
Figure 2 Process Flowchart
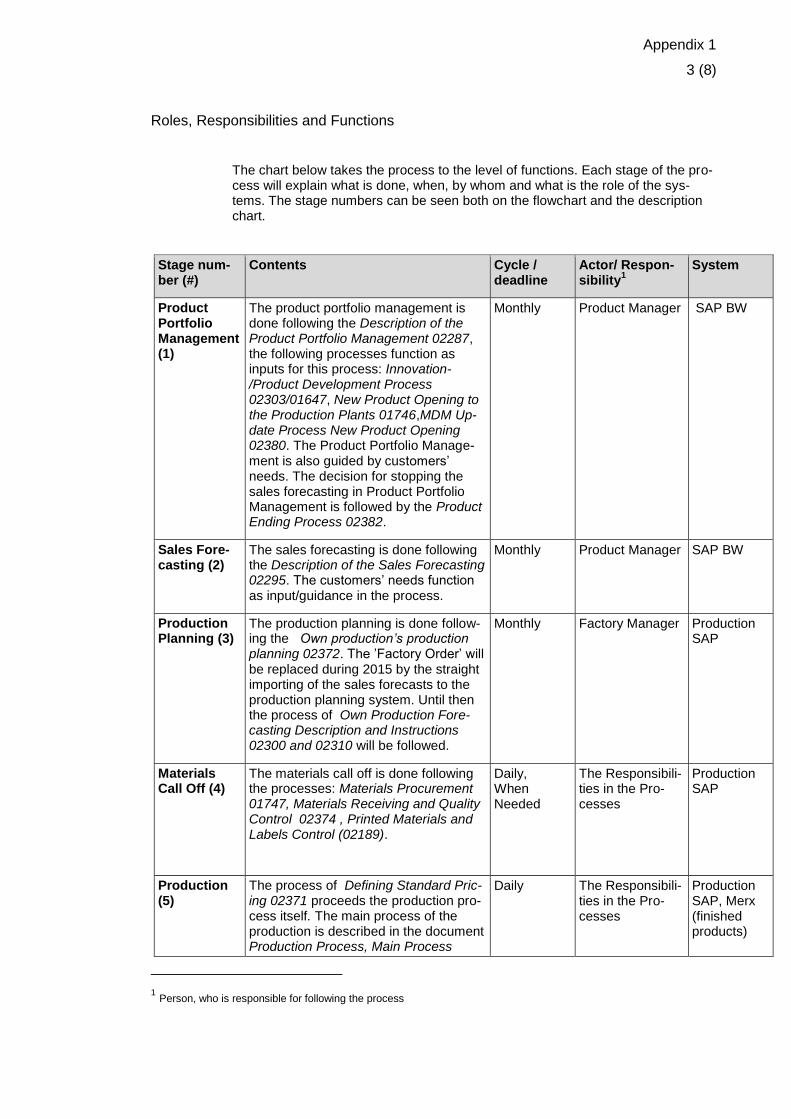
Appendix 1
3 (8)
Roles, Responsibilities and Functions
The chart below takes the process to the level of functions. Each stage of the pro-cess will explain what is done, when, by whom and what is the role of the sys-tems. The stage numbers can be seen both on the flowchart and the description chart.
Stage num-ber (#)
Contents Cycle / deadline
Actor/ Respon-sibility
1
System
Product Portfolio Management (1)
The product portfolio management is done following the Description of the Product Portfolio Management 02287, the following processes function as inputs for this process: Innovation-/Product Development Process 02303/01647, New Product Opening to the Production Plants 01746,MDM Up-date Process New Product Opening 02380. The Product Portfolio Manage-ment is also guided by customers’ needs. The decision for stopping the sales forecasting in Product Portfolio Management is followed by the Product Ending Process 02382.
Monthly Product Manager SAP BW
Sales Fore-casting (2)
The sales forecasting is done following the Description of the Sales Forecasting 02295. The customers’ needs function as input/guidance in the process.
Monthly Product Manager SAP BW
Production Planning (3)
The production planning is done follow-ing the Own production’s production planning 02372. The ’Factory Order’ will be replaced during 2015 by the straight importing of the sales forecasts to the production planning system. Until then the process of Own Production Fore-casting Description and Instructions 02300 and 02310 will be followed.
Monthly Factory Manager Production SAP
Materials Call Off (4)
The materials call off is done following the processes: Materials Procurement 01747, Materials Receiving and Quality Control 02374 , Printed Materials and Labels Control (02189).
Daily, When Needed
The Responsibili-ties in the Pro-cesses
Production SAP
Production (5)
The process of Defining Standard Pric-ing 02371 proceeds the production pro-cess itself. The main process of the production is described in the document Production Process, Main Process
Daily The Responsibili-ties in the Pro-cesses
Production SAP, Merx (finished products)
1 Person, who is responsible for following the process
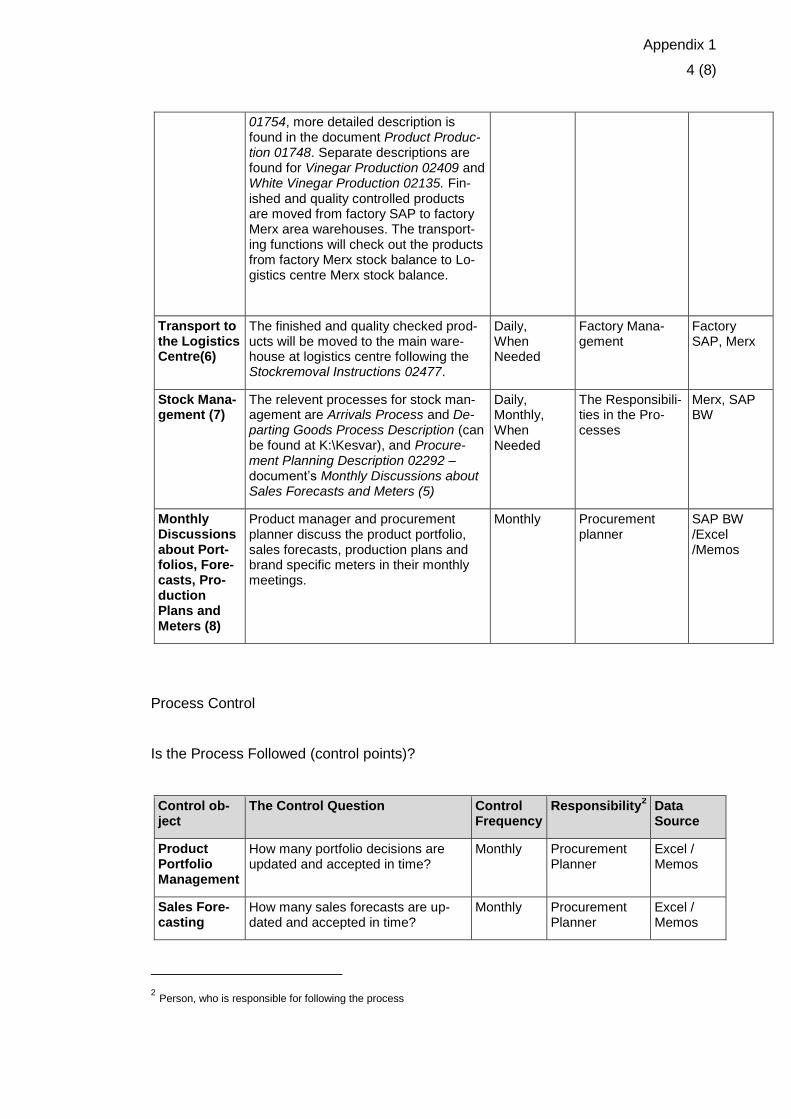
Appendix 1
4 (8)
01754, more detailed description is found in the document Product Produc-tion 01748. Separate descriptions are found for Vinegar Production 02409 and White Vinegar Production 02135. Fin-ished and quality controlled products are moved from factory SAP to factory Merx area warehouses. The transport-ing functions will check out the products from factory Merx stock balance to Lo-gistics centre Merx stock balance.
Transport to the Logistics Centre(6)
The finished and quality checked prod-ucts will be moved to the main ware-house at logistics centre following the Stockremoval Instructions 02477.
Daily, When Needed
Factory Mana-gement
Factory SAP, Merx
Stock Mana-gement (7)
The relevent processes for stock man-agement are Arrivals Process and De-parting Goods Process Description (can be found at K:\Kesvar), and Procure-ment Planning Description 02292 –document’s Monthly Discussions about Sales Forecasts and Meters (5)
Daily, Monthly, When Needed
The Responsibili-ties in the Pro-cesses
Merx, SAP BW
Monthly Discussions about Port-folios, Fore-casts, Pro-duction Plans and Meters (8)
Product manager and procurement planner discuss the product portfolio, sales forecasts, production plans and brand specific meters in their monthly meetings.
Monthly Procurement planner
SAP BW /Excel /Memos
Process Control
Is the Process Followed (control points)?
Control ob-ject
The Control Question Control Frequency
Responsibility2 Data
Source
Product Portfolio Management
How many portfolio decisions are updated and accepted in time?
Monthly Procurement Planner
Excel / Memos
Sales Fore-casting
How many sales forecasts are up-dated and accepted in time?
Monthly Procurement Planner
Excel / Memos
2 Person, who is responsible for following the process

Appendix 1
5 (8)
Monthly Discussions about Port-folios, Fore-casts, Pro-duction Plans and Meters
How many of the monthly meetings and discussions about portfolios, forecasts, production plans and me-ters with the responsible product manager have been completed in time?
Monthly Procurement Planner
Excel / Memos
Updating of the Own Production Availability Report
The managment of the production plants updates the weekly availabil-ity report on own production items that have 14 days or less stock based on actual sales history data.
Weekly Procurement Planner
Production SAP / Ex-cel
Updating the Production Plan
The management of the production plants updates monthly (by 25
th-30
th)
the 3 month production plan to the J-drive of the company.
Monthly Procurement Planner
Production SAP / Ex-cel
Slowly Mov-ing Items Reporting
The slowly moving items report is updated with sales plans and actions by the responsible product manag-ers.
Quarterly Procurement Planner
SAP BW /Excel / Memos
What is the Effect of the Process (meters)?
Meter in Use
Measurement Ob-ject and Definition
Measurement Frequency
Responsibility Data Source
Distribution
Customer Delivery Accuracy
The delivery accura-cy to customer from the logistics centre based on the re-quested delivery date (Ear-ly&intime%, Late,not delivered&deleted%)
Monthly Procurement Manager
SAP BW Supply chain KPI-reports
Top mana-gement KPI-reporting
Forecasting Accuracy
Forecasting Accura-cy compares the chosen forecast month’s QTY of the 2nd and 3rd month to the actual sales QTY and qives the accuracy % accord-ing to that.
Sales division level accuracy is reported to the top manage-ment’s monthly KPI-report. Brand level accuracy is reported
Monthly Procurement Manager, Pro-curement Planner
SAP BW Forecasting Accuracy Analysis
Top man-agement KPI-reporting, Product manager’s and Pro-curement planner’s meetings

Appendix 1
6 (8)
to the product man-agers in monthly meetings.
Stock Reach Fol-low Up
Minimum reach tar-gets of 2,5 months reach from the months beginning sales forecast is followed by Internal Delivery Accuracy –meter (SAP BW; Internal delivery accuracy).
The meter is report-ed by ABC-classes on the top manage-ment’s monthly KPI-report.
Maximum reach targets are followed by SAP BW stock reports and are re-ported by ABC-classes on sales division level on the top management’s monthly KPI-report and on brand level to the product man-agers in monthly meetings.
In addition the slow-ly moving items are commented quarter-ly by brand respon-sible product man-agers on the files sent by accounting manager. The com-ments are sent to division managers, procurement planner and procurement manager.
Exceptions: The production man-agement is respon-sible for producing the minimum reach targets and updates weekly availability report on own pro-duction items that have 14 days or less stock based on ac-
Weekly, Monthly, Quarterly
Procurement manager, Pro-curement Planner, Ac-counting Man-ager, Product Manager
SAP BW, Excel / Memos
Top man-agement KPI-reporting, Product manager’s and Pro-curement planner’s meetings
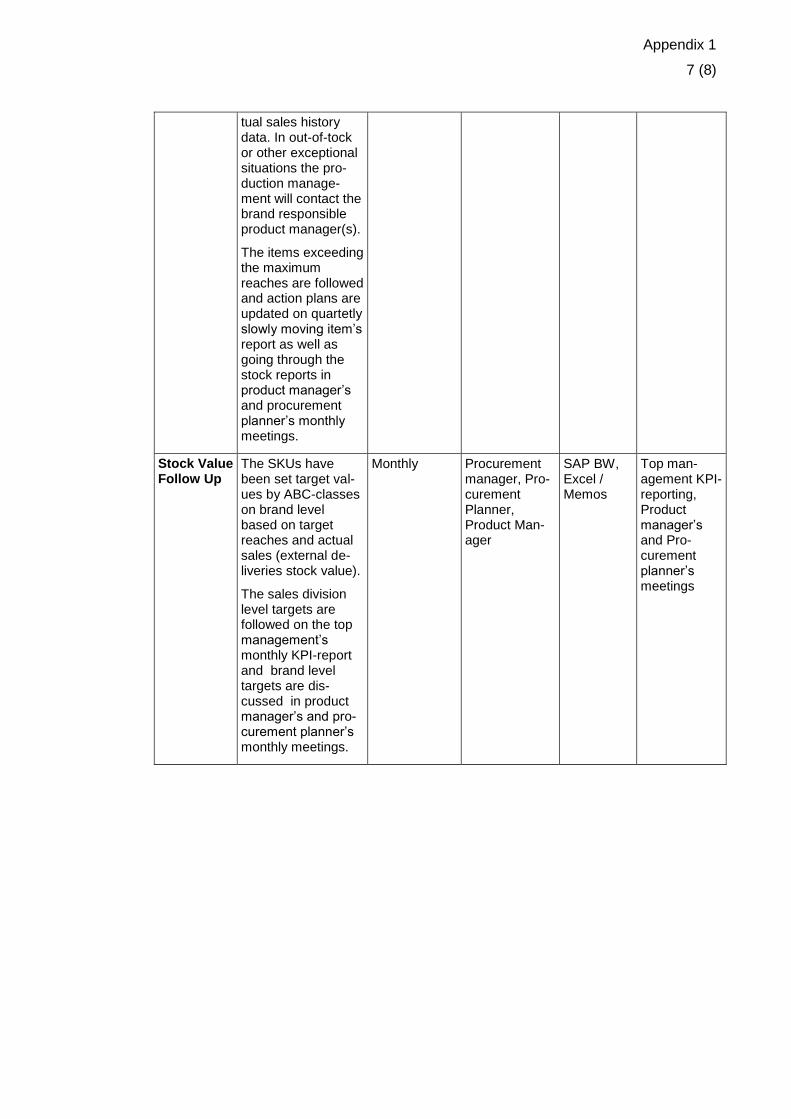
Appendix 1
7 (8)
tual sales history data. In out-of-tock or other exceptional situations the pro-duction manage-ment will contact the brand responsible product manager(s).
The items exceeding the maximum reaches are followed and action plans are updated on quartetly slowly moving item’s report as well as going through the stock reports in product manager’s and procurement planner’s monthly meetings.
Stock Value Follow Up
The SKUs have been set target val-ues by ABC-classes on brand level based on target reaches and actual sales (external de-liveries stock value).
The sales division level targets are followed on the top management’s monthly KPI-report and brand level targets are dis-cussed in product manager’s and pro-curement planner’s monthly meetings.
Monthly Procurement manager, Pro-curement Planner, Product Man-ager
SAP BW, Excel / Memos
Top man-agement KPI-reporting, Product manager’s and Pro-curement planner’s meetings
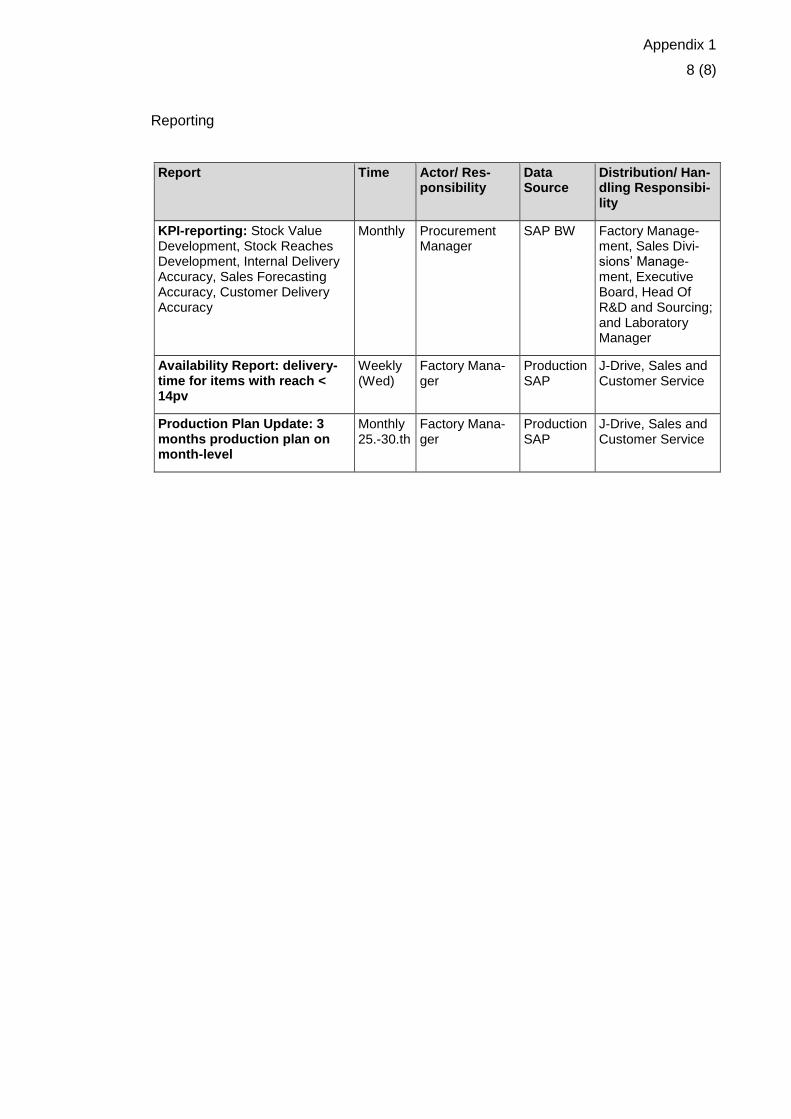
Appendix 1
8 (8)
Reporting
Report Time Actor/ Res-ponsibility
Data Source
Distribution/ Han-dling Responsibi-lity
KPI-reporting: Stock Value Development, Stock Reaches Development, Internal Delivery Accuracy, Sales Forecasting Accuracy, Customer Delivery Accuracy
Monthly Procurement Manager
SAP BW Factory Manage-ment, Sales Divi-sions’ Manage-ment, Executive Board, Head Of R&D and Sourcing; and Laboratory Manager
Availability Report: delivery-time for items with reach < 14pv
Weekly (Wed)
Factory Mana-ger
Production SAP
J-Drive, Sales and Customer Service
Production Plan Update: 3 months production plan on month-level
Monthly 25.-30.th
Factory Mana-ger
Production SAP
J-Drive, Sales and Customer Service