Embed Size (px)
Citation preview
D E D
F C P
L-M-U M
I P
E R P
S S C L
K G B
A, N
2008

Erklärung
Diese Dissertation wurde im Sinne von § 13 Abs. 3 der Promotionsordnung vom 29. Januar1998 von Herrn Prof. Dr. Christoph Bräuchle betreut.
Ehrenwörtliche Versicherung
Diese Dissertation wurde selbständig, ohne unerlaubte Hilfe erarbeitet.
München, den 2008
Dissertation eingereicht am1. Gutachter: Prof. Dr. Christoph Bräuchle2. Gutachter: Prof. Dr. Ernst WagnerMündliche Prüfung am 3. Juli 2008


Bobby McFerrin

Summary
In order to develop more efficient gene vectors a detailed understanding of the intracellularbehavior of these vectors is essential. Single particle tracking is a method that has proveduseful to elucidate biological processes on a single cell level. In this thesis single particletracking was used to study the internalization, intracellular trafficking, and endosomal releaseof nonviral gene vectors consisting of plasmid DNA condensed with cationic polymers, so-called polyplexes. A dual-color setup allowed separate detection of either polyplex and GFP-labeled cellular structures or polymer and DNA.
In the first part of this work the internalization of different polyplexes into the cell was stud-ied. The internalization process of epidermal growth factor (EGF) receptor-targeted particleswas investigated and compared with untargeted (PEG as well as LPEI) particles. Differencesin internalization between targeted and untargeted particles were revealed by trajectory anal-ysis. Trajectories were generated by means of single particle tracking and represented themovement of the particles during internalization. In these trajectories three different phaseswere distinguished differing in morphology and instantaneous velocities. Analysis by meansof quenching experiments and mean square displacement as a function of time enabled abiological interpretation of the three phases.
The first phase started directly after attachment of the particle to the cell membrane andwas characterized by a directed and a diffusional component. The directed component witha value of vI = 0.015 ± 0.003 µm/s resulted from the retrograde movement of the corticalactin cytoskeleton to which the particles are connected through transmembrane proteins. Thediffusional component of DI = 4 · 10−4 ± 4 · 10−4 µm2/s represented lateral diffusion of themembrane-bound particles on the cell membrane. During phase I particles were internalizedinto the cell. The second phase represented normal and confined motion in the cytoplasm.The confinements varied between 0.3 and 2.0 µm in diameter. During the third phase activetransport along microtubules was visible, indicated by directed motion with a velocity ofvIII = 0.7 ± 0.4 µm/s.
Differences between targeted and untargeted particles were found in the duration of phaseI. Whereas EGFR-targeted particles showed phase I movement for some minutes, phase Imovement could last more than one hour for untargeted particles. This was reflected in thepercentage of internalized particles: 90% of the EGFR-targeted particles were internalizedwithin 10 minutes. Untargeted particles showed an extremely large spread but rarely morethan 80% internalization even after 80 minutes.
For the first time, these results give a detailed view on the different phases during internal-ization and subsequent intracellular trafficking of polyplexes. Moreover these results showthat targeting by means of a ligand leads to faster and more efficient internalization.
S
In the second part of this study the endosomal release of polyplexes was studied. Endosomalrelease was induced by means of photosensitizer excitation generating singlet oxygen andsubsequently membrane damage.
The visualization of endosomal release was first proved with a dextran fluid phase marker.Upon photosensitizer activation the endosomal content was released within 100 ms.
In order to image the endosomal release of polyplexes, plasmid DNA and polymer werelabeled with different colors. Three different polymers were used to condense the DNA: LPEI,PLL and PDL. These differ in endosomal buffering capacity, biodegradability and DNA bindingaffinity.
Differences in release behavior were observed between the particles themselves as well asbetween polymer and DNA. LPEI particles showed distinguishable behavior for polymer andDNA suggesting dissociation of the complex before endosomal release. LPEI quickly diffusedaway from the endosome due to its small size. DNA was not degraded but remained intactand immobile in the cytoplasm. For PLL particles polymer and DNA showed similar behavior.PLL quickly diffused away from the endosome. DNA was degraded and also diffused into thecytoplasm. In contrast, PDL particles remained intact in the endosome. In this case, bothPDL and DNA did not diffuse out of the endosome but remained colocalized in the endosomalregion, indicating intact particles.
These observations suggest differences in the final destination of the complexes. LPEIparticles remained in endosomes, PLL and PDL particles were transported towards lysosomes.
Apart from increasing endosomal release, photosensitizer activation is known to have sideeffects on cells. In this study the effect on microtubules, actin, Rab5 and Rab9 proteins andendosomal motion was examined.
In tubulin-GFP expressing cells reduced microtubule dynamics was observed in combi-nation with an intact microtubule skeleton. This may be explained by inhibition of poly-merization and depolymerization of microtubules due to photosensitizer binding to tubulinheterodimers. In contrast to microtubules, no effect of the photosensitizer on actin was ob-served.
A change in location of Rab5 and Rab9 proteins was observed upon photosensitizer acti-vation. Rab5 and Rab9 GFP-marked single endosomes, representing early and late endosomesrespectively, disappeared upon singlet oxygen production concomitant with photosensitizeractivation. Most probably the Rab proteins changed from their membrane-bound to their cy-tosolic conformation due to singlet oxygen damage of the connection between protein andmembrane.
A last side effect concerned the motion of the endosomes. Upon photosensitizer activationan immediate stop of endosomal motion was observed. This may be related to the change inconformation of the Rab proteins, since Rab proteins play a role in the connection betweenendosome and microtubules. By transformation of the Rab proteins into their cytosolic formthe connection between endosome and microtubule is lost and endosomal motion is stopped.
Combining the data in this thesis new insights into the mechanism of internalization andintracellular trafficking are obtained. Single particle tracking has proved to be an excellenttool in order to study the behavior of single gene vectors in detail. The new insights can beused to develop more effective gene carriers to enhance the efficacy of nonviral vectors.
Contents
Summary vii
1 Introduction 1
2 Principles of gene transfer 32.1 Therapeutic gene transfer . . . . . . . . . . . . . . . . . . . . . . . . . . . . 32.2 Overview of different gene vectors . . . . . . . . . . . . . . . . . . . . . . . 4
2.2.1 Viral vectors . . . . . . . . . . . . . . . . . . . . . . . . . . . . . . 42.2.2 Nonviral vectors . . . . . . . . . . . . . . . . . . . . . . . . . . . . 5
2.3 Internalization pathways . . . . . . . . . . . . . . . . . . . . . . . . . . . . 72.3.1 Phagocytosis . . . . . . . . . . . . . . . . . . . . . . . . . . . . . . 72.3.2 Macropinocytosis . . . . . . . . . . . . . . . . . . . . . . . . . . . . 72.3.3 Clathrin-dependent endocytosis . . . . . . . . . . . . . . . . . . . . 82.3.4 Lipid raft-dependent endocytosis . . . . . . . . . . . . . . . . . . . . 9
2.4 Endosomal transport . . . . . . . . . . . . . . . . . . . . . . . . . . . . . . 92.4.1 Early endosomes . . . . . . . . . . . . . . . . . . . . . . . . . . . . 92.4.2 Late endosomes . . . . . . . . . . . . . . . . . . . . . . . . . . . . . 102.4.3 Lysosomes . . . . . . . . . . . . . . . . . . . . . . . . . . . . . . . 10
2.5 Endosomal release . . . . . . . . . . . . . . . . . . . . . . . . . . . . . . . 112.5.1 Proton sponge hypothesis . . . . . . . . . . . . . . . . . . . . . . . 112.5.2 Photoinduced release . . . . . . . . . . . . . . . . . . . . . . . . . 11
2.6 Nuclear import . . . . . . . . . . . . . . . . . . . . . . . . . . . . . . . . . 122.7 Gene expression . . . . . . . . . . . . . . . . . . . . . . . . . . . . . . . . . 13
3 Experimental methods 153.1 Synthesis of polyplexes . . . . . . . . . . . . . . . . . . . . . . . . . . . . 15
3.1.1 DNA labeling . . . . . . . . . . . . . . . . . . . . . . . . . . . . . . 153.1.2 Polymer labeling . . . . . . . . . . . . . . . . . . . . . . . . . . . . 163.1.3 PEI particles . . . . . . . . . . . . . . . . . . . . . . . . . . . . . . . 163.1.4 PEG-PEI particles . . . . . . . . . . . . . . . . . . . . . . . . . . . . 173.1.5 EGF-PEG-PEI particles . . . . . . . . . . . . . . . . . . . . . . . . . . 173.1.6 PLL and PDL particles . . . . . . . . . . . . . . . . . . . . . . . . . . 173.1.7 Polyplex purification . . . . . . . . . . . . . . . . . . . . . . . . . . 17
3.2 Cell culture . . . . . . . . . . . . . . . . . . . . . . . . . . . . . . . . . . . 183.3 Widefield fluorescence microscopy . . . . . . . . . . . . . . . . . . . . . . 18
3.3.1 Widefield microscope . . . . . . . . . . . . . . . . . . . . . . . . . 183.3.2 Fluorescence . . . . . . . . . . . . . . . . . . . . . . . . . . . . . . 19
C
3.4 Experimental setup . . . . . . . . . . . . . . . . . . . . . . . . . . . . . . . 203.4.1 Excitation pathway . . . . . . . . . . . . . . . . . . . . . . . . . . . 203.4.2 Emission pathway . . . . . . . . . . . . . . . . . . . . . . . . . . . 21
3.5 Single particle tracking . . . . . . . . . . . . . . . . . . . . . . . . . . . . . 223.5.1 Analysis of single particle trajectories . . . . . . . . . . . . . . . . . 23
3.6 Quenching . . . . . . . . . . . . . . . . . . . . . . . . . . . . . . . . . . . 24
4 Internalization dynamics of polyplexes 274.1 Internalization of polyplexes . . . . . . . . . . . . . . . . . . . . . . . . . . 284.2 Tracking of polyplexes . . . . . . . . . . . . . . . . . . . . . . . . . . . . . 30
4.2.1 Trajectories . . . . . . . . . . . . . . . . . . . . . . . . . . . . . . . 304.2.2 Instantaneous velocity plots . . . . . . . . . . . . . . . . . . . . . . 32
4.3 Time point of internalization . . . . . . . . . . . . . . . . . . . . . . . . . . 344.4 Internalization percentages . . . . . . . . . . . . . . . . . . . . . . . . . . . 364.5 Analysis of the three different phases . . . . . . . . . . . . . . . . . . . . . . 38
4.5.1 Phase I . . . . . . . . . . . . . . . . . . . . . . . . . . . . . . . . . 394.5.2 Phase II . . . . . . . . . . . . . . . . . . . . . . . . . . . . . . . . . 434.5.3 Phase III . . . . . . . . . . . . . . . . . . . . . . . . . . . . . . . . 45
4.6 Summary . . . . . . . . . . . . . . . . . . . . . . . . . . . . . . . . . . . . 47
5 Photoinduced endosomal release of polyplexes 495.1 Characterization of TPPS2a . . . . . . . . . . . . . . . . . . . . . . . . . . . 505.2 Endosomal release of AFD . . . . . . . . . . . . . . . . . . . . . . . . . . . 525.3 Endosomal release of polyplexes . . . . . . . . . . . . . . . . . . . . . . . . 59
5.3.1 LPEI . . . . . . . . . . . . . . . . . . . . . . . . . . . . . . . . . . . 605.3.2 PLL . . . . . . . . . . . . . . . . . . . . . . . . . . . . . . . . . . . 635.3.3 PDL . . . . . . . . . . . . . . . . . . . . . . . . . . . . . . . . . . . 66
5.4 Summary . . . . . . . . . . . . . . . . . . . . . . . . . . . . . . . . . . . . 68
6 Cellular effects of photoinduced endosomal release 716.1 Microtubules and actin . . . . . . . . . . . . . . . . . . . . . . . . . . . . . 716.2 Rab5 and Rab9 . . . . . . . . . . . . . . . . . . . . . . . . . . . . . . . . . 756.3 Stop of endosomal motion . . . . . . . . . . . . . . . . . . . . . . . . . . . 796.4 Summary . . . . . . . . . . . . . . . . . . . . . . . . . . . . . . . . . . . . 81
Bibliography 83
Acknowledgments 95
List of publications 97
Curriculum Vitae 99
1. Introduction
"Viren, die das Auge retten" (Viruses that rescue the eye) was the title of an article on thefront page of the Süddeutsche Zeitung on the 28th of April 2008 [1]. Stephen Howarth, an18-year-old British boy has suffered from Leber’s congenital amaurosis since birth. Thisillness is an inherited disorder causing severe vision loss, especially in the dark [2]. Visiongenerally deteriorates over time and patients become blind when they are 30–40 years old.Stephen Howarth and five other patients were treated in a gene therapeutic clinical trial andshowed improved visual function after treatment [3, 4].
This is the most recent success in the 20-year-old history of gene therapy trials, startingwith a trial on advanced melanoma in 1989 [5]. Gene therapy is based on the introduction ofa new, healthy gene into cells lacking expression of this gene. The new gene is introducedinto the cell nucleus and can either interfere with a malfunctioning gene’s function, restore alost function or initiate a new function [6]. In this way normal gene expression by the targetcells is induced.
There are two different ways to introduce a gene into the cell nucleus: with the helpof viruses (viral vectors) or by means of nonviral vectors. In case of Stephen Howarth, anadeno-associated virus was used to carry the gene into the nucleus [3, 4]. In general, viralvectors induce a high expression of the target gene. Nevertheless, their disadvantage is theimmunogenic response of the body upon administration. For this reason, a lot of researchhas been done on alternative vectors, so-called nonviral vectors.
Nonviral vectors consist of plasmid DNA condensed by either a cationic lipid, forminga lipoplex, or a cationic polymer in which case the complex is called polyplex. This studyconcentrates on the behavior of polyplexes. Until now, no clinical trials have been done usingpolyplexes. The main reason for this is the low transfection efficiency of these vectors. Inorder to induce gene expression, the DNA has to enter the cell nucleus. On its way to thecell nucleus there are several barriers to overcome. First the vector has to enter the cell. Forpolyplexes this mostly occurs via endocytosis [7]. Second, the complex has to escape theendosome. Third, the DNA has to be transported to the nucleus and fourth it has to enter thenucleus. Viruses have evolved specialized mechanisms to overcome these barriers. Nonviralvectors in contrast have to be modified chemically. In order to make nonviral vectors moreefficient the different barriers have to be characterized in detail.
The first cellular barrier a gene vector encounters is the plasma membrane. Polyplexesconsisting of DNA condensed with polyethyleneimine PEI are most probably internalized viaHSPGs (heparan sulfate proteoglycans) present in the cell membrane [8–11]. Polyplexesequipped with a ligand targeting a specific receptor in the cell membrane showed a muchhigher transfection efficiency [12–14] and are expected to be internalized via a more efficientmechanism [15, 16]. Conventional biological techniques to unravel the difference in inter-
1
I
nalization between targeted and untargeted particles provide average or ensemble values. Inthis study the internalization process of both untargeted and targeted particles is studied on asingle cell level. By means of single particle tracking the internalization of individual genevectors is followed and differences between untargeted and targeted particles are observed inreal time.
Another barrier on the way towards the nucleus constitutes the escape from the endosome.Polyplexes are known to be internalized into the cell via endocytosis. Thus, an internalizedparticle is entrapped in an endosome. In order to deliver the DNA into the cell nucleus the par-ticle has to escape from the endosome. There are different mechanisms to induce escape fromthe endosome, e.g. using peptides or polymers that react with the membrane and create poresin it [7, 14]. In this study endosomal release is induced by excitation of a membrane-boundphotosensitizer and subsequent singlet oxygen production. By means of this photochemi-cal treatment the endosomal membrane is damaged and thus the polyplex is released. Thistreatment showed an increase in transfection efficiency [17–19]. However, the detailed mech-anism has not yet been unraveled. By means of single particle tracking the mechanism ofendosomal release of different polyplexes is studied in real time.
The last part of this study concentrates on the side effects of the photochemical treatment.Excitation of the photosensitizer induces singlet oxygen production which is toxic to severalcellular components [20]. Here, the influence of the photosensitizer on microtubules, actin,Rab5 and Rab9 proteins and on endosomal motion is studied.
This thesis is structured as follows: the theory chapter following the introduction gives anoverview of the basic biological background of this thesis. In chapter 3 the different experi-mental methods are described. Chapter 4 describes the first set of experiments concerning theinternalization process of receptor-targeted and untargeted particles. The results described inthis chapter are published in Molecular Therapy [21]. The process of endosomal release,induced by internalization and excitation of a photosensitizer, was imaged for three differentgene vectors and is described in chapter 5. Finally, side effects on the cell of the use of pho-tosensitizer are described in chapter 6. These two chapters are submitted for publication inthe Journal of Controlled Release.
2
2. Principles of gene transfer
In this chapter an overview is presented of the biological background of this thesis. It startswith an introduction into gene therapy and different gene vectors. Then the cellular struc-tures and possible barriers are described that a gene vector may encounter on its way fromattachment to the cell membrane towards the cell nucleus. This includes a description ofthe different pathways by which a vector may be internalized into the cell, the endosomes inwhich the vector is transported inside the cell, release from the endosome, transport into thenucleus and finally expression of the target gene.
2.1 Therapeutic gene transfer
The discovery of DNA by Watson and Crick in 1953 [22] enables us to change the characteris-tics of a cell on a basic level: by modifying the genome of the cell we can alter its phenotype.Gene therapy makes use of this principle by correction of genetic disorders through inter-action with a malfunctioning gene. DNA sequences (the "healthy" gene) are introduced intothe cell nucleus of those cells that are supposed to regulate normal expression of the (mal-functioning) gene. The newly introduced gene can either interfere with a gene’s function,restore a lost function or initiate a new function [6] to induce normal gene expression by thetarget cells. The advantage of gene therapy is the potential elimination of the disease stateinstead of alleviating the symptoms of the disease, as conventional medicines do. Obviously,diseases suitable for gene therapy are diseases caused by a genetic disorder [23].
The first experiments on cloning of mammalian genes in the late 1970s and early 1980sare commonly seen as the precursors of gene therapy [24] resulting in the first human genetherapy trial in 1989 [5]. Although since then more than 1300 gene therapy clinical trials havebeen performed, in Europe as well as in the USA no gene therapeutic medicine is availableyet [25]. A major setback for gene therapy was the death of Jesse Gelsinger in 1999 during aclinical trial with an adenovirus-based gene vector [26]. Another unfortunate case occurred in2002 when two children, treated for X-linked severe combined immunodeficiency (SCID-X1),developed leukemia [27]. Nonetheless, the treatment was successful in seven other patients.In the last years, positive results were obtained in different trials for the treatment of chronicgranulomatous disease (an inherited primary immunodeficiency that affects phagocytes) [28],metastatic melanoma [29], and Parkinson’s disease [25]. Most recently, a clinical trial onretinal dystrophy was performed and improved visual function was observed [3, 4].
Two different techniques of gene delivery exist: ex vivo and in vivo delivery [6, 30]. Ex vivogene delivery involves isolation of cells from a patient, establishment of the cells in tissueculture, gene delivery to these cells and placement of the cells back into the patient. For in
3
P
vivo gene delivery genes or gene vectors are directly delivered to cells in the patient by localor intravenous injection. Both delivery mechanisms put requirements on the gene vectorsthat will be discussed in the next sections.
2.2 Overview of different gene vectors
In order to deliver genes into target cells, different possible vectors exist. The most well-known and in most clinical trials used is a viral vector. A viral vector is based on a replication-defective virus where part of the genome is replaced by therapeutic genes. The most com-monly used viruses are adenoviruses and retroviruses [25]. A second class of vectors consti-tutes the nonviral vectors. They consist of a cationic compound condensing the anionic DNA.This cationic compound can be a polymer, in which case the gene vector is called a polyplexor it can be a lipid, and is then named lipoplex. When both lipid and polymer are used, thecomplex is termed lipopolyplex. The third class of vectors is naked DNA. Naked DNA can beinjected directly into certain tissues, e.g., muscle tissue. Recently, gene therapy trials havestarted to use siRNA to (down)regulate expression of target genes [25]. The advantage of theuse of siRNA is that the vector does not need to enter the cell nucleus [31]. When in the cy-tosol, siRNA degrades the complementary mRNA molecules that are released from the nucleusfollowing transcription.
2.2.1 Viral vectors
Viral vectors are replication-defective viruses where part of the genome is replaced by thera-peutic genes. The size of the gene that can be delivered is limited to the size of the originalgenome of the virus. The large advantage of viral vectors is their high transduction efficiency.Viral vectors can transduce cells in vitro with 100–10000 viral genomes per cell, whereas fornonviral vectors 100 times more gene copies per cell are needed [32]. In addition, viral vec-tors are able to transfect a large fraction of a defined cell population [33]. For these reasons,most gene therapy trials up to 2007 have used viral vectors (67%) [25].
A big problem in the use of viral vectors is the immunogenic response of the body uponadministration of the vector. An immune reaction can either be innate and follow immedi-ately after administration, or it can be adapted. In the latter case, the immune reaction ismost prominent after the second or third administration of the vector. The immune responseis strongly dependent on the viral vector used. Adenoviral vectors induce very strong im-mune responses, lentiviral and retroviral vectors in contrast almost none [34]. The vehementimmune reaction upon administration of adenovirus-based vectors was the cause of death ofJesse Gelsinger in 1999 [26].
A second disadvantage of viral vectors is their affinity for a particular tissue and cell type,called tropism. Specific proteins, present on the coat of viruses, bind to defined receptorsexpressed on the cell membrane of the target cells. Depending on the virus, these surfaceproteins and thus their tropism differs. For use in gene therapy a change in tropism may benecessary, since the gene need not necessarily be delivered to the cell type specified by thesurface proteins on the virus coat [35]. The efficient transduction of viruses is often causedby their specific tropism together with an infection process which is optimized for the targettissue. Therefore, changing the tropism of a virus may influence the transduction efficiencyas well [36].
4
O
The third disadvantage of viral vectors is the preferential integration of the genome intoan existing gene in the host genome [37]. In this way, the genome of the host cell is alteredin an uncontrolled fashion. Treatment of SCID-X1 in the aforementioned gene therapy trialby means of a retrovirus resulted in integration of a therapeutic gene near an oncolytic genecausing leukemia [27]. On the other hand, the integration into the host genome has theadvantage of often leading to stable expression of the gene [38].
2.2.2 Nonviral vectors
A general characteristic of nonviral vectors is that they do not use a virus to deliver the DNAinto the target cell. The occurrence of serious side effects of viral vectors has motivatedan increase in the research on nonviral vectors. The big advantage of nonviral vectors istheir biosafety. Whereas viral vectors easily provoke an immune response and can alter thegenome of the host cell, nonviral vectors do not incite such a strong immune reaction andwill very rarely insert into the host genome. Further advantages of nonviral over viral vectorsare the easy chemical modification, the low cost and the large size of genetic material thatcan be delivered to the target cell. Unfortunately, nonviral vectors are still less efficient thanviral vectors in delivery of DNA to the cytoplasm and subsequently to the nucleus.
Different classes of nonviral vectors can be distinguished. The first category comprises nakedDNA. Via microinjection naked DNA can be delivered into, e.g, muscle cells. Although nakedDNA can easily be degraded in the cytoplasm by DNases, clinical trials with naked DNA havebeen performed [25].
The second class consists of DNA condensed with cationic lipids to protect DNA fromdegradation, these vectors are called lipoplexes. A cationic lipid is a positively charged am-phiphile containing a hydrophilic head and hydrophobic tail. In aqueous solution, abovea critical vesicle concentration cationic lipids spontaneously form micelles (consisting of amonolayer of the lipid) or bilayer vesicles. A multilamellar vesicle is formed when differentbilayers surround each other. Bilayers and multilamellar vesicles are known as liposomes.The overall charge of the liposome is positive and via electrostatic interactions it is bound tothe negatively charged DNA [39].
The third class of nonviral vectors is called polyplexes and contains DNA and a condensingpolymer for DNA protection. Many different possible polymers are under current investiga-tion. They can be separated into biodegradable and nonbiodegradable polymers. Biodegrad-able polymers include chitosan (a linear aminopolysaccharide, based on the naturally occur-ring chitin), polyesters and poly-L-lysine (PLL). Nonbiodegradable polymers are for examplepolyethyleneimine PEI, poly-D-lysine (PDL) and dendrimers. This study concentrates espe-cially on PEI, PLL and PDL. All three condense DNA by interaction of their protonated aminegroups with the phosphate groups of DNA.
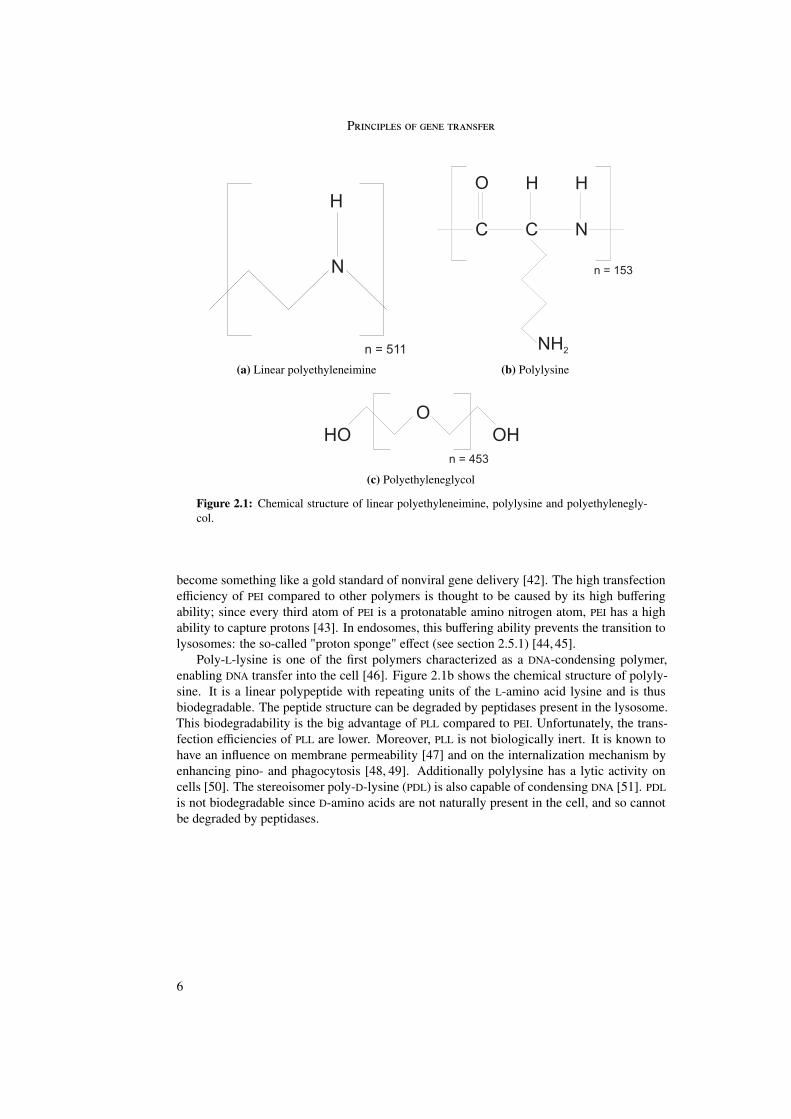
The chemical structure of PEI is presented in figure 2.1a. It is available in two differentforms: linear PEI (LPEI) and branched PEI (BPEI). Condensation of DNA with PEI (both LPEIand BPEI) results in particles with a positive net charge, because of the excess of PEI. PEIparticles have been shown to give one of the highest transfection efficiencies compared tocondensation with other cationic polymers [40] whereby the linear form of PEI has beenshown to give even higher transfection efficiencies than its branched counterpart [41]. Forthis reason a lot of research has been done on PEI (both linear and branched) and it has
5
P
(a) Linear polyethyleneimine (b) Polylysine
(c) Polyethyleneglycol
Figure 2.1: Chemical structure of linear polyethyleneimine, polylysine and polyethylenegly-col.
become something like a gold standard of nonviral gene delivery [42]. The high transfectionefficiency of PEI compared to other polymers is thought to be caused by its high bufferingability; since every third atom of PEI is a protonatable amino nitrogen atom, PEI has a highability to capture protons [43]. In endosomes, this buffering ability prevents the transition tolysosomes: the so-called "proton sponge" effect (see section 2.5.1) [44, 45].
Poly-L-lysine is one of the first polymers characterized as a DNA-condensing polymer,enabling DNA transfer into the cell [46]. Figure 2.1b shows the chemical structure of polyly-sine. It is a linear polypeptide with repeating units of the L-amino acid lysine and is thusbiodegradable. The peptide structure can be degraded by peptidases present in the lysosome.This biodegradability is the big advantage of PLL compared to PEI. Unfortunately, the trans-fection efficiencies of PLL are lower. Moreover, PLL is not biologically inert. It is known tohave an influence on membrane permeability [47] and on the internalization mechanism byenhancing pino- and phagocytosis [48, 49]. Additionally polylysine has a lytic activity oncells [50]. The stereoisomer poly-D-lysine (PDL) is also capable of condensing DNA [51]. PDLis not biodegradable since D-amino acids are not naturally present in the cell, and so cannotbe degraded by peptidases.
6
I
All cationic polyplexes have the disadvantage of inducing an immune reaction in vivo byactivation of the complement system [52]. Upon intravenous administration, PEI interactswith albumin and red blood cells, and forms aggregates that end up in the lung, causing anembolism [53]. PLL polyplexes also react with red blood cells, but upon binding to plasmaproteins, PLL is rapidly cleared from the blood stream [54]. To avoid these unwanted side ef-fects, positively charged polyplexes can be shielded with polyethylene glycol (PEG, chemicalstructure presented in figure 2.1c) [53]. The electrically neutral PEG shield reduces interac-tions with blood components.
Intravenously delivered PEI particles lead to high gene expression in the lung and lower ex-pression in other organs like spleen, heart, liver and kidneys [55]. Since these organs may notbe the target tissue, enhanced delivery towards a defined tissue is needed. This is achieved bycoupling a ligand to the gene vector. The ligand binds specifically to a well-defined receptorthat is expressed on the cell surface of the target tissue. In this way, unspecific binding toother tissues is avoided and the gene vector is delivered efficiently to the desired tissue. Anexample of a ligand is the epidermal growth factor (EGF) which binds to the epidermal growthfactor receptor (EGFR) which is overexpressed on tumors. The effect of EGF receptor targetinghas indeed already been demonstrated in vivo [56].
2.3 Internalization pathways
In general, polyplexes enter the cell by means of endocytosis. For most eukaryotic cells itis the common process to internalize extracellular molecules and larger substances. Endo-cytic processes can be divided into two different classes: phagocytosis ("cell eating") andpinocytosis ("cell drinking"). Pinocytosis may occur by means of three different mecha-nisms: macropinocytosis, clathrin-dependent, and lipid raft-dependent endocytosis (wherebylipid raft-dependent endocytosis can be separated into caveolin-dependent and caveolin-in-dependent mechanisms). In the next sections phagocytosis and the different subclasses ofpinocytosis will be discussed. A diagram illustrating the different pathways is presented infigure 2.2.
2.3.1 Phagocytosis
Particles larger than ∼500 nm in diameter are often internalized by phagocytosis [58]. Uponbinding of the particle to the plasma membrane, specialized surface receptors are activatedand trigger local actin polymerization. Driven by this polymerization the plasma membranezippers up closely around the particle so that the particle is engulfed by the plasma membrane.The membrane closes up and the phagosome is sealed off from the membrane and is trans-ported towards the cytosol. Phagocytosis is restricted to so-called phagocytes, in mammalsthese are, e.g., macrophages and neutrophils [59, p.788].
2.3.2 Macropinocytosis
Macropinocytosis occurs by cell membrane ruffling induced by growth factors or other sig-nals. As with phagocytosis, actin plays a major role in this process [57]. The cell membraneis pushed upwards by local actin polymerization in protrusions perpendicular to the cell mem-
7
P
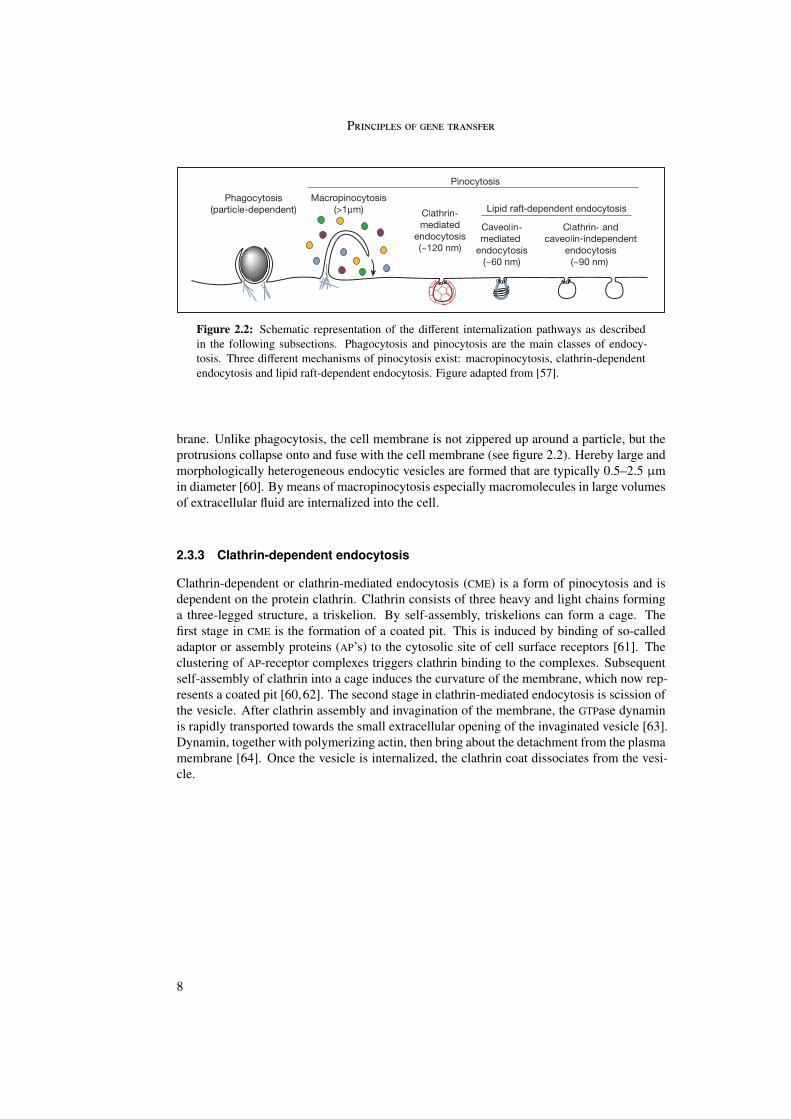
Figure 2.2: Schematic representation of the different internalization pathways as describedin the following subsections. Phagocytosis and pinocytosis are the main classes of endocy-tosis. Three different mechanisms of pinocytosis exist: macropinocytosis, clathrin-dependentendocytosis and lipid raft-dependent endocytosis. Figure adapted from [57].
brane. Unlike phagocytosis, the cell membrane is not zippered up around a particle, but theprotrusions collapse onto and fuse with the cell membrane (see figure 2.2). Hereby large andmorphologically heterogeneous endocytic vesicles are formed that are typically 0.5–2.5 µmin diameter [60]. By means of macropinocytosis especially macromolecules in large volumesof extracellular fluid are internalized into the cell.
2.3.3 Clathrin-dependent endocytosis
Clathrin-dependent or clathrin-mediated endocytosis (CME) is a form of pinocytosis and isdependent on the protein clathrin. Clathrin consists of three heavy and light chains forminga three-legged structure, a triskelion. By self-assembly, triskelions can form a cage. Thefirst stage in CME is the formation of a coated pit. This is induced by binding of so-calledadaptor or assembly proteins (AP’s) to the cytosolic site of cell surface receptors [61]. Theclustering of AP-receptor complexes triggers clathrin binding to the complexes. Subsequentself-assembly of clathrin into a cage induces the curvature of the membrane, which now rep-resents a coated pit [60,62]. The second stage in clathrin-mediated endocytosis is scission ofthe vesicle. After clathrin assembly and invagination of the membrane, the GTPase dynaminis rapidly transported towards the small extracellular opening of the invaginated vesicle [63].Dynamin, together with polymerizing actin, then bring about the detachment from the plasmamembrane [64]. Once the vesicle is internalized, the clathrin coat dissociates from the vesi-cle.
8
E
For the Low Density Lipoprotein receptor and the transferrin receptor it was shown thatligands bind to a preexisting coated pit [65] that is present as a stationary structure on the cellsurface [66]. However, not all receptors are present in coated pits on the cell surface. Theepidermal growth factor (EGF) receptor clusters only upon ligand binding [67–69], followedby clathrin redistribution to the cell periphery [70]. A comparable behavior is observed forthe endocytosis of influenza viruses [71].
2.3.4 Lipid raft-dependent endocytosis
In addition to the clathrin-mediated pathway, the existence of several clathrin-independent,but lipid raft-dependent endocytic pathways has been demonstrated (for a review on thissubject, see Nichols et al. [72] or Sandvig et al. [73]). These pathways are distinctly less wellunderstood than clathrin-dependent endocytosis and contrary views exist on the importanceand abundance of several pathways [73–75].
For all clathrin-independent pathways the presence of lipid rafts1 was confirmed, as faras biochemical assays have been carried out [72]. The best characterized of these pathwaysis caveolin-mediated endocytosis. Although the extent of uptake via this pathway is con-troversial [74–76], both SV40 virus and cholera toxin are known to use caveolae for theirinternalization [77, 78]. Caveolae are flask-shaped invaginations in the plasma membranewith a size of 50–80 nm in diameter, that are highly immobile and rich in caveolin, a dimericcholesterol-binding membrane-associated protein. The endocytic mechanism of caveolae re-mains to be elucidated but the entry of the SV40 virus revealed uptake into organelles thatwere distinct from classical endosomes and were called ’caveosomes’ [79]. Evidence alsoexists that the protein dynamin is involved in caveolar endocytosis [80].
Several other clathrin-independent pathways have been demonstrated which can be clas-sified as dynamin-dependent or dynamin-independent. Many involve small GTPases such asRhoA, CDC42 or ARF6 [81]. Some of them show a dependence on the endocytic protein flotillin.The detailed mechanism of these pathways is still unclear and more research has to be doneto elucidate it.
2.4 Endosomal transport
Once internalized into the cell via endocytosis, a gene vector is entrapped in an endosome.The main function of the endosome is sorting out cargo for degradation and cargo for recy-cling. This occurs immediately after internalization, in the early endosome. Cargo designatedfor degradation is transported towards late endosomes and subsequently to lysosomes whereacid hydrolases breakdown macromolecules into smaller subunits. In the following the differ-ent endosomal compartments are described through which a gene vector can be transported.
2.4.1 Early endosomes
Immediately after internalization by endocytosis, particles are entrapped in early endosomes.These are vesicles with a diameter of 0.3–0.4 µm with extending narrow (< 60 nm) tubules[82] and a pH of around 6.4 [83]. The primary function of early endosomes is sorting of
1 dynamic, detergent-resistant regions of the plasma membrane enriched in cholesterol and lipids
9
P
cargo. The slightly acidic pH induces dissociation of several ligands from their receptors(e.g. transferrin) [83]. These receptors are segregated into the tubular extensions which arepinched off from the early endosome and move back to the plasma membrane to recycle thereceptors (these endosomes are called recycling endosomes). Not all receptors are recycledin this way. Some remain, together with other cargo that is to be degraded, in the sphericaldomain of the early endosomes. After pinching off from the tubular domain, the sphericaldomain fuses with other endosomes (homotypic fusion) such that cargo is concentrated infewer and larger endosomes [84]. These endosomes are transported towards the perinucleararea along microtubules.
Early endosomes can easily be distinguished from late endosomes or lysosomes by theprotein early endosome antigen 1, EEA1 [85]. EEA1 is involved in early endosome dockingand fusion [86] and is associated with early endosomes through binding to another proteinespecially present on early endosomes, Rab5. Rab5 is often used as a marker for early en-dosomes. It is a small GTPase which is known to regulate fusion events between differentearly endosomes [87, 88]. It also plays a role in the movement of early endosomes alongmicrotubules [89]. Displacement of Rab5 by the GTPase Rab7 in the perinuclear area inducesthe transition of early endosomes to late endosomes [84].
2.4.2 Late endosomes
In the perinuclear area, after homotypic fusion, early endosomes are transformed to late en-dosomes when Rab5 is displaced by Rab7. The pH of late endosomes (lying between 5 and6 [90]) is lower than in early endosomes. Late endosomes, in contrast to early endosomes, donot exist as a single bilayer vesicle, but consist of several intralumenal vesicles enveloped byan outer membrane. Late endosomes are therefore also called multivesicular bodies (MVB).The intralumenal vesicles are generated by budding of a vesicle from the original membrane,in the same way as endosomes bud from the plasma membrane. The membrane of intralu-menal vesicles contains mannose 6-phosphate receptors which distinguishes late endosomesfrom lysosomes [91]. MVBs sort cargo for degradation and enable fusion with lysosomes [92].Intralumenal vesicles can in rare cases be recycled back to the cytosol [93,94]. In most casesthe content of intralumenal vesicles is delivered to lysosomes. For the transition from lateendosomes to lysosomes the contents of both compartments are fused, which was shownby means of confocal microscopy by Bright et al. [95]. This occurred 10–15 minutes afterincubation of the cell with dextran.
Rab9 is another member of the Rab family of Rab GTPases. Rab9 is located on the surfaceof late endosomes and regulates the transport of mannose 6-phosphate receptors to the trans-Golgi network [96]. Rab9 also influences the size of the late endosome [97]. Therefore, Rab9can be used as a marker for late endosomes.
2.4.3 Lysosomes
Lysosomes are considered as membrane-bound organelles storing a variety of acid hydro-lases [98]. They are ∼0.5 µm in diameter, have a heterogeneous morphology and are con-centrated in the perinuclear area of the cell. Lysosomes are distinguished from late endo-somes by the lack of mannose 6-phosphate receptors. By means of proton-pumping vac-uolar ATPases, the pH of lysosomes is maintained at 4.6–5.0 [90] which activates the acid
10
E
hydrolases. By fusion with late endosomes, a hybrid organelle is formed which is the majorcompartment for degradation of cargo [99]. In lysosomes different enzymes are present thatcan degrade cargo into smaller subunits. Examples are peptidases and glycosidases that canbreak down polypeptides and glycans or DNases that can degrade DNA into nucleotides. Sinceenzymes act isomerically specific, only cargo comprised of L-amino acids can be degraded.The smaller subunits are transported out of the lysosome by diffusion and carrier-mediatedtransport [100].
2.5 Endosomal release
When a gene vector reaches the lysosome, the DNA is degraded by DNases present in thelysosome and active at low pH. To avoid this degradation, the vector has to escape from the(early or late) endosome. Different techniques have been developed to enhance endosomalescape. One example is the use of peptides or polymers that change their conformation upona decrease in pH, associate with the membrane and in this way induce membrane damage[7]. They can be coupled to gene vectors. One example is melittin, a cytolytic peptideextracted from bee venom that induces transmembrane pores in lipid bilayers [14,101]. Twoadditional possibilities to enhance endosomal release are the "proton sponge" effect and theuse of photosensitizers. These are discussed in detail below.
2.5.1 Proton sponge hypothesis
The term "proton sponge" was first introduced in connection with the buffering ability of PEIby Boussif et al. [44]. Since every third atom of PEI is a protonable amino nitrogen atom(see figure 2.1a), PEI is an effective "proton sponge". The overall protonation level of PEIincreases from 20% to 45% as the pH decreases from 7 to 5 [43]. In case PEI particles areinternalized into endosomes, this large buffering capacity leads to reduced acidification ofthe endosomes and therefore to avoidance of trafficking to lysosomes [102]. In endosomes, avacuolar ATPase pump brings H+ atoms inside the endosome and simultaneously Cl− entersthe cell [90]. Due to the buffering capacity of PEI, the influx of protons and concomitantCl− ions is large [45]. Thus the osmotic pressure of the endosome increases and leads toincreased passive diffusion of H2O molecules into the endosome. The endosome increasesin size, so-called osmotic swelling, whereupon lysis of the endosome occurs [45]. In thisway, the gene vector is released from the endosome without being degraded by lysosomalenzymes. This makes PEI an efficient gene carrier.
2.5.2 Photoinduced release
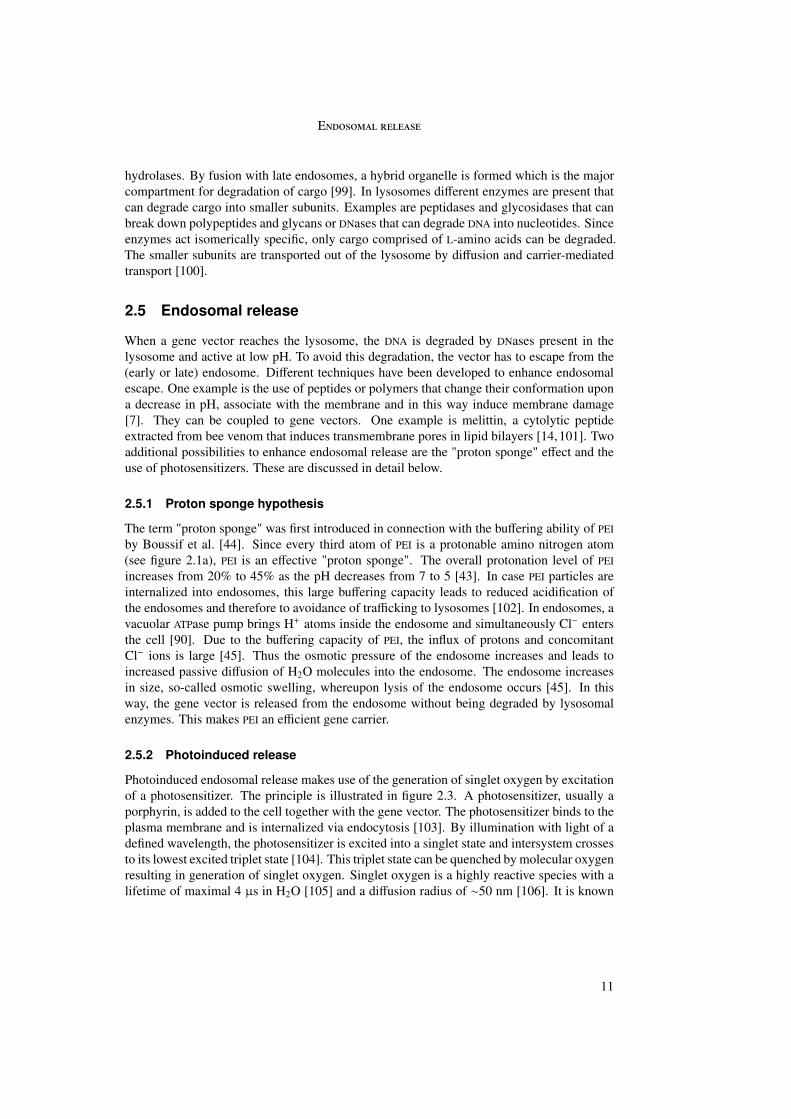
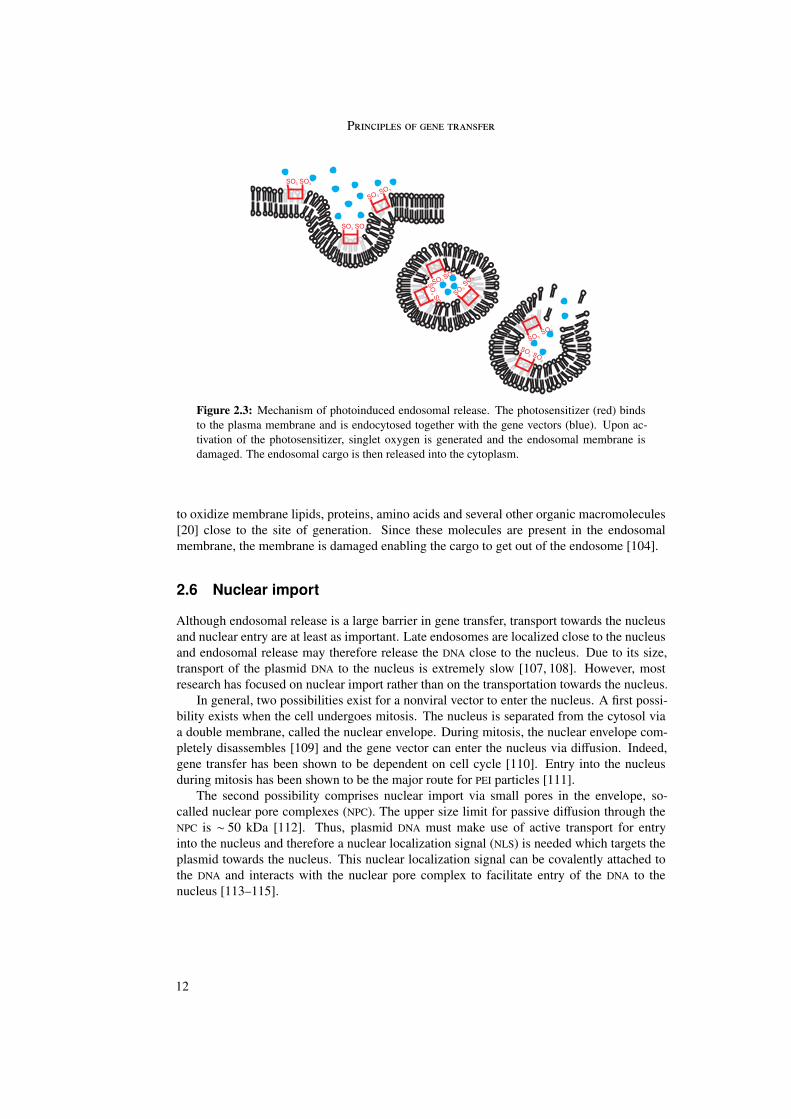
Photoinduced endosomal release makes use of the generation of singlet oxygen by excitationof a photosensitizer. The principle is illustrated in figure 2.3. A photosensitizer, usually aporphyrin, is added to the cell together with the gene vector. The photosensitizer binds to theplasma membrane and is internalized via endocytosis [103]. By illumination with light of adefined wavelength, the photosensitizer is excited into a singlet state and intersystem crossesto its lowest excited triplet state [104]. This triplet state can be quenched by molecular oxygenresulting in generation of singlet oxygen. Singlet oxygen is a highly reactive species with alifetime of maximal 4 µs in H2O [105] and a diffusion radius of ∼50 nm [106]. It is known
11
P
Figure 2.3: Mechanism of photoinduced endosomal release. The photosensitizer (red) bindsto the plasma membrane and is endocytosed together with the gene vectors (blue). Upon ac-tivation of the photosensitizer, singlet oxygen is generated and the endosomal membrane isdamaged. The endosomal cargo is then released into the cytoplasm.
to oxidize membrane lipids, proteins, amino acids and several other organic macromolecules[20] close to the site of generation. Since these molecules are present in the endosomalmembrane, the membrane is damaged enabling the cargo to get out of the endosome [104].
2.6 Nuclear import
Although endosomal release is a large barrier in gene transfer, transport towards the nucleusand nuclear entry are at least as important. Late endosomes are localized close to the nucleusand endosomal release may therefore release the DNA close to the nucleus. Due to its size,transport of the plasmid DNA to the nucleus is extremely slow [107, 108]. However, mostresearch has focused on nuclear import rather than on the transportation towards the nucleus.
In general, two possibilities exist for a nonviral vector to enter the nucleus. A first possi-bility exists when the cell undergoes mitosis. The nucleus is separated from the cytosol viaa double membrane, called the nuclear envelope. During mitosis, the nuclear envelope com-pletely disassembles [109] and the gene vector can enter the nucleus via diffusion. Indeed,gene transfer has been shown to be dependent on cell cycle [110]. Entry into the nucleusduring mitosis has been shown to be the major route for PEI particles [111].
The second possibility comprises nuclear import via small pores in the envelope, so-called nuclear pore complexes (NPC). The upper size limit for passive diffusion through theNPC is ∼ 50 kDa [112]. Thus, plasmid DNA must make use of active transport for entryinto the nucleus and therefore a nuclear localization signal (NLS) is needed which targets theplasmid towards the nucleus. This nuclear localization signal can be covalently attached tothe DNA and interacts with the nuclear pore complex to facilitate entry of the DNA to thenucleus [113–115].
12
G
2.7 Gene expression
A most important aspect in gene therapy is the sustained expression of the therapeutic gene.Expression may either be transient or stable. Transient expression is reduced over time be-cause the newly introduced gene does not replicate into new cells. Often duration of expres-sion is related to the form in which the gene is present in the nucleus. The gene can beintegrated in the chromosome of the host cell or it may be present as a separate molecule.In general, plasmids from nonviral vectors exist as a separate molecule and they may not bereplicated when the cell replicates [38]. Integrating genes into the chromosomes of the cellmay induce sustained expression but a site-specific integration of the genes in the chromo-some is difficult and there is a risk of integration into an existing gene [37]. Some plasmidsare able to replicate extrachromosomally, they are called episomes.
13

3. Experimental methods
In this chapter the experimental techniques used in this thesis are explained. It starts witha description of polyplex synthesis and of cell culture. Then the principles of widefieldfluorescence microscopy are described and the experimental setup is shown. The techniqueused to analyze the obtained video streams is called single particle tracking and is explainedin section 3.5. The last section describes quenching which was used to distinguish intra- andextracellular particles.
3.1 Synthesis of polyplexes
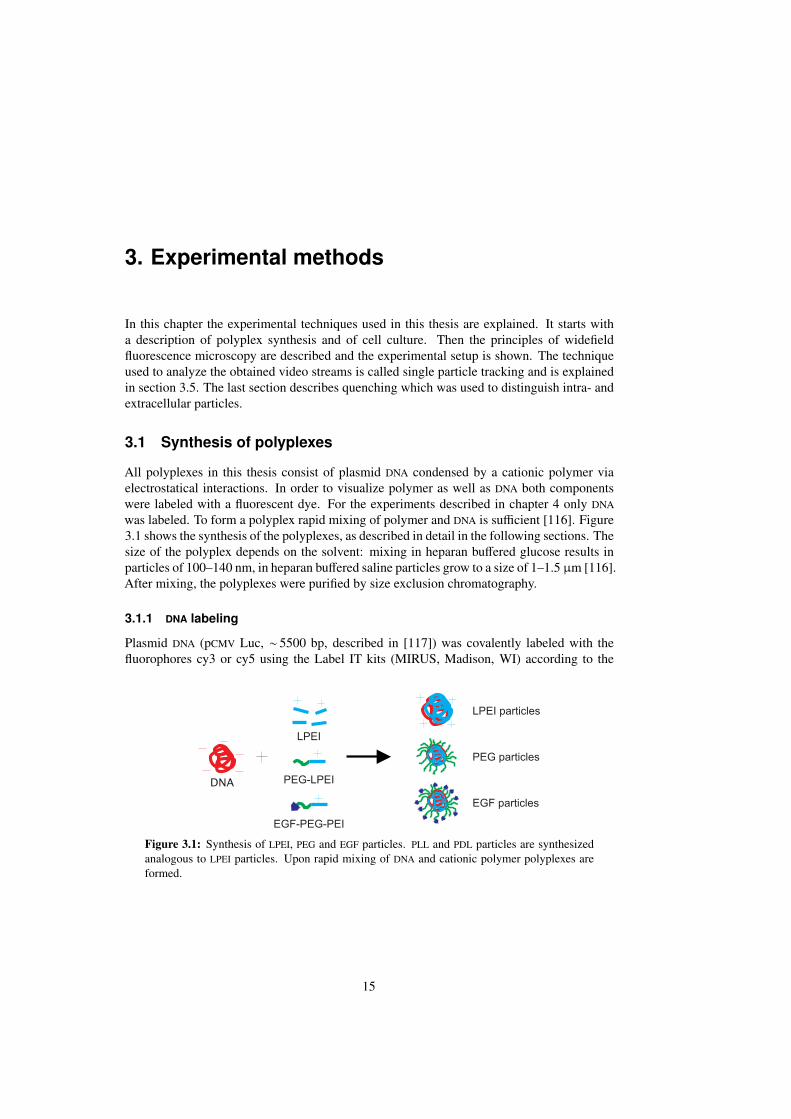
All polyplexes in this thesis consist of plasmid DNA condensed by a cationic polymer viaelectrostatical interactions. In order to visualize polymer as well as DNA both componentswere labeled with a fluorescent dye. For the experiments described in chapter 4 only DNAwas labeled. To form a polyplex rapid mixing of polymer and DNA is sufficient [116]. Figure3.1 shows the synthesis of the polyplexes, as described in detail in the following sections. Thesize of the polyplex depends on the solvent: mixing in heparan buffered glucose results inparticles of 100–140 nm, in heparan buffered saline particles grow to a size of 1–1.5 µm [116].After mixing, the polyplexes were purified by size exclusion chromatography.
3.1.1 DNA labeling
Plasmid DNA (pCMV Luc, ∼ 5500 bp, described in [117]) was covalently labeled with thefluorophores cy3 or cy5 using the Label IT kits (MIRUS, Madison, WI) according to the
Figure 3.1: Synthesis of LPEI, PEG and EGF particles. PLL and PDL particles are synthesizedanalogous to LPEI particles. Upon rapid mixing of DNA and cationic polymer polyplexes areformed.
15
E
manufacturer’s instructions. 20 µg of DNA were diluted with 1X Buffer A to a final volumeof 195 µl. After addition of 5 µl reconstituted Label IT reagent, the reaction mixture wasincubated for 3 hours at 37◦C. To precipitate labeled DNA 550 µl of ice-cold 100% ethanoland 22 µl of 3 M sodium acetate were added. The solution was then mixed and placedat −20◦C overnight. Subsequent centrifugation at 16000 rpm for 1 hour at 4◦C allowedremoval of unreacted label in the supernatant. The pellet was gently washed with ice-cold70% ethanol and centrifuged again. Labeled DNA was allowed to dry for 5 minutes andfinally resuspended in sterile HEPES-buffered glucose (HBG, 20 mM HEPES, glucose massfraction of 5%, pH 7.1). The concentration of cy3 and cy5 was measured by absorptionat 550 nm and 650 nm, respectively. The extinction coefficients of these fluorophores are:εcy3, 550nm = 150000 lmol−1cm−1 and εcy5, 650nm = 250000 lmol−1cm−1. DNA was quantifiedby measuring the absorbance at 260 nm. The ratio of the absorbance at 260 nm:280 nm is anindex for DNA purity. On average, one dye molecule was bound per 50 to 100 DNA basepairs.
3.1.2 Polymer labeling
For the experiments described in chapters 5 and 6 double-labeled particles were used con-sisting of cy5-labeled DNA and polymer labeled with Alexa Fluor 488 carboxylic acid, suc-cinimidyl ester (A488, Invitrogen, Karlsruhe, Germany). The three polymers used to con-dense DNA are linear polyethyleneimine (LPEI, MW 22 kDa, Euromedex, Souffelweyersheim,France), poly-L-lysine (PLL-HBr, MW 32 kDa, Sigma Aldrich, Munich, Germany) and poly-D-lysine (PDL-HBr, MW 35 kDa, Sigma Aldrich, Munich, Germany).
For LPEI labeling, A488 was dissolved in DMSO at a final concentration of 10 mg/ml. 1mg (1.55 µmol) A488 was mixed with 8.54 mg (0.388 µmol) LPEI. The volume was adjustedto 1 ml with HEPES-buffered saline (HBS, 20 mM HEPES, pH 7.4, 150 mM NaCl). The reactionwas incubated light-protected for 1 hour at room temperature on a rotation wheel. In orderto separate labeled LPEI from free A488, size exclusion chromatography was performed witha gel filtration column (Sephadex G-25 superfine; HR10/30 column, Amersham Biosciences,Germany) preequilibrated with HBS. The amount of A488 and of LPEI was determined spec-trophotometrically at 495 nm and via a copper complex assay, respectively. The molar ratioof LPEI:A488 was 1:2.2.
Poly-L-lysine (PLL) and poly-D-lysine (PDL) were labeled according to the labeling pro-tocol for LPEI, with slight modifications. The concentration of A488 dissolved in waterfreeDMSO was 5 mg/ml. 0.5 mg (0.775 µmol) of A488 were added to 625 µl HEPES (20 mM,pH 8.0) containing either 12.5 mg (0.391 µmol) PLL-HBr or 13.5 mg (0.391 µmol) PDL-HBr. The reaction was incubated light-protected for 1 hour at room temperature on a rotationwheel. Size exclusion chromatography was performed with a gel filtration column (SephadexG-25 superfine) preequilibrated with HEPES (20 mM, pH 7.4) containing 0.5 M NaCl. Theamount of A488 was determined spectrophotometrically at 495 nm and the PLL/PDL amountby a TNBS assay. The molar ratio of PLL:A488 was 1:1.26 and of PDL:A488 1:1.15.
3.1.3 PEI particles
Unlabeled LPEI was dissolved in water, neutralized with HCl and gelfiltrated on a SephadexG-25 superfine column using 20 mM HEPES, 0.25 M NaCl, pH 7.4. For complex preparationstock solutions of 1 µg/ml LPEI were prepared and provided by Katharina von Gersdorff and
16
S
Carolin Fella (Prof. Wagner, LMU Munich). LPEI particles were prepared at a final DNAconcentration of 20 µg/ml by mixing plasmid DNA with LPEI, both diluted in HBG, at a molarratio of LPEI nitrogen to DNA phosphate (N/P) of 6.
For the experiments described in chapters 5 and 6 double-labeled LPEI particles wereused. These particles were synthesized as described above using A488-labeled LPEI insteadof unlabeled LPEI.
3.1.4 PEG-PEI particles
For the preparation of PEG (polyethyleneglycol) particles, a PEG-PEI conjugate, consistingof 20 kDa PEG, coupled to 22 kDa LPEI, was synthesized and provided by Katharina vonGersdorff and Carolin Fella (Prof. Wagner, LMU Munich) [116]. The PEG-PEI conjugate wasmixed with free LPEI at a molar PEG:LPEI ratio of 22:100. This solution was mixed with DNA atan N/P ratio of 6 and a final DNA concentration of 200 µg/ml. The complexes were incubatedfor 30 minutes at room temperature, snap-frozen in liquid nitrogen, and subsequently storedat −80◦C until use. Before use, the complexes were allowed to stand for 30 minutes at roomtemperature after thawing.
3.1.5 EGF-PEG-PEI particles
For EGF particles DNA was condensed by a mixture of three different conjugates. The firstconjugate (EGF-PEG-PEI) consisted of murine epidermal growth factor (EGF), 20 kDa poly-ethyleneglycol (PEG) and branched polyethyleneimine. The second conjugate (PEG-PEI) con-sisted of 20 kDa polyethyleneglycol and linear polyethyleneimine. Both conjugates weresynthesized and provided by Katharina von Gersdorff and Carolin Fella (Prof. Wagner, LMUMunich) [116]. These conjugates were mixed with free LPEI at a molar EGF:PEG:PEI ratio of13:22:100. This solution was then mixed with plasmid DNA at an N/P ratio of 6 and a finalDNA concentration of 200 µg/ml. In this way, the amount of PEI in the particles stems for 10%from the EGF-PEG-PEI conjugate, for 12.5% from the PEG-PEI conjugate and for 77.5% fromfree LPEI. The complexes were incubated for 30 minutes at room temperature, snap-frozen inliquid nitrogen, and subsequently stored at −80◦C until use. Before use, the complexes wereallowed to stand for 30 minutes at room temperature after thawing.
3.1.6 PLL and PDL particles
For the preparation of PLL and PDL particles A488-labeled PLL or PDL was mixed with DNA(consisting of 50% cy5-labeled DNA) at an N/P ratio of 2 and a final DNA concentration of20 µg/ml. Complexes were allowed to stand for 30 minutes at room temperature and weresubsequently purified.
3.1.7 Polyplex purification
Polyplex purification was only performed for the experiments described in chapters 5 and 6.The polyplexes were purified by size exclusion chromatography to remove unbound, labeledpolymer or DNA. For this purpose, a custom made free flow column was used. This methodwas established by Boeckle et al. [118]. A standard-sized pasteur pipette was plugged withglass wool and column material (Sephacryl S-200 HR, MW exclusion limit 250 kDa for
17
E
globular proteins; Pharmacia Biotech, Uppsala, Sweden) and was filled into the glass pipetteleading to a final bed volume of 1.5 ml. The column material was equilibrated with HBG ata pH of 7.4. Before loading the polyplexes onto the column, column material was precondi-tioned with approximately 500 µg of the corresponding polymer-Alexa conjugate to reduceposterior, unspecific binding of the polyplexes to the column material. Then the column wasrinsed with HBG and subsequently 600 µl of the polyplex solution were loaded onto the col-umn. The amount of A488 and cy5 was determined by measuring the absorbance at 495nm and 647 nm, respectively, using a Genesys 10-UV scanning spectrophotometer (ThermoSpectronic, Rochester, USA). The final labeling ratio (molar ratio of A488:cy5) for LPEI, PLL,and PDL particles was 5:1, 5.5:1 and 4:1, respectively.
3.2 Cell culture
Cell culture medium (DMEM/F12) and fetal bovine serum (FBS) were purchased from Invitro-gen GmbH (Karlsruhe, Germany). HUH7 WT cells (JCRB 0403; Tokyo, Japan) were culturedin DMEM/F12 (1:1) Glutamax-I medium supplemented with 10% FBS at 37◦C in 5% CO2 hu-midified atmosphere. 48 hours before seeding the medium was changed to DMEM/F12 (1:1)Glutamax-I with 5% B27 (Invitrogen, Karlsruhe, Germany) to reduce autofluorescence of thecells.
HUH7 actin-GFP and tubulin-GFP (green fluorescent protein) expressing cell lines wereproduced and provided by Katharina von Gersdorff (Prof. Wagner, LMU Munich) [116].Rab5-GFP and Rab9-GFP expressing cell lines were produced and provided by Nadia Ruthardt(Prof. Braüchle, LMU Munich).
Cells were seeded in DMEM/F12 (1:1) Glutamax-I medium with 5% B27 24 or 48 hoursbefore measurement in a density of 2.0 · 104 or 1.0 · 104 cells per well (1 cm2), respectively,on collagen A-coated LabTek chambered cover glass (Nunc, Rochester, NY).
3.3 Widefield fluorescence microscopy
3.3.1 Widefield microscope
Widefield microscopy is based on uniform illumination of a micron-sized sample area [119].To achieve uniform illumination, Koehler illumination is used. This principle was developedby Koehler in 1893 [120] and is based on a separate illumination and image-forming pathwaywith different conjugate planes to avoid focusing the light source in the sample [121].
The light source of a modern widefield microscope is mostly a laser or an arc lamp andemits uniform light. This light passes through a collector, focusing it into the back focal planeof the condensor. Most modern fluorescence microscopes are epi-fluorescence microscopesin which the objective serves as a condensor [122]. This has the advantage that excitationlight in the detection channel is reduced, since only reflected excitation light will be detected.From the objective a parallel light beam is transmitted, illuminating the sample. The fluo-rescence from the sample is collected by the objective and is focused on the eye through theeyepiece or onto the camera via a separate side exit of the microscope.
Fluorescent particles are visible on the camera as bright spots on a dark background.Particles that are smaller in size than the excitation wavelength are not presented as points butshow a diffraction pattern called an Airy disk [121,123] consisting of a bright spot surrounded
18
W
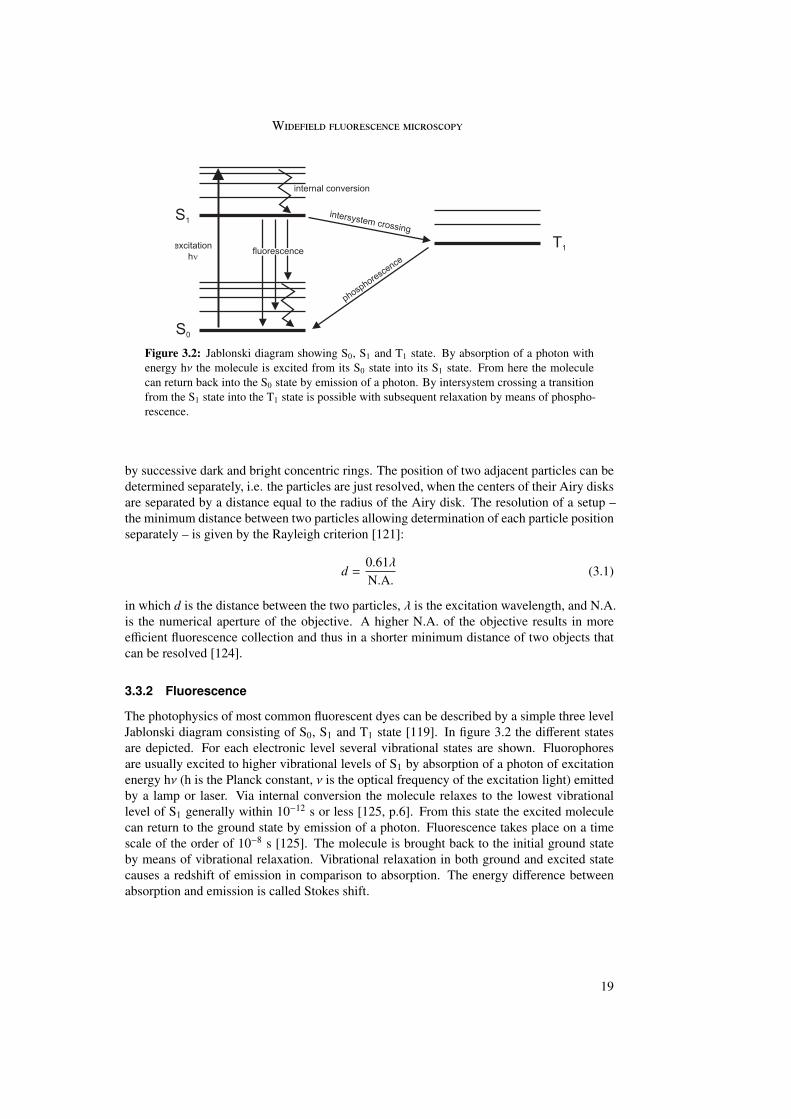
Figure 3.2: Jablonski diagram showing S0, S1 and T1 state. By absorption of a photon withenergy hν the molecule is excited from its S0 state into its S1 state. From here the moleculecan return back into the S0 state by emission of a photon. By intersystem crossing a transitionfrom the S1 state into the T1 state is possible with subsequent relaxation by means of phospho-rescence.
by successive dark and bright concentric rings. The position of two adjacent particles can bedetermined separately, i.e. the particles are just resolved, when the centers of their Airy disksare separated by a distance equal to the radius of the Airy disk. The resolution of a setup –the minimum distance between two particles allowing determination of each particle positionseparately – is given by the Rayleigh criterion [121]:
d =0.61λN.A.
(3.1)
in which d is the distance between the two particles, λ is the excitation wavelength, and N.A.is the numerical aperture of the objective. A higher N.A. of the objective results in moreefficient fluorescence collection and thus in a shorter minimum distance of two objects thatcan be resolved [124].
3.3.2 Fluorescence
The photophysics of most common fluorescent dyes can be described by a simple three levelJablonski diagram consisting of S0, S1 and T1 state [119]. In figure 3.2 the different statesare depicted. For each electronic level several vibrational states are shown. Fluorophoresare usually excited to higher vibrational levels of S1 by absorption of a photon of excitationenergy hν (h is the Planck constant, ν is the optical frequency of the excitation light) emittedby a lamp or laser. Via internal conversion the molecule relaxes to the lowest vibrationallevel of S1 generally within 10−12 s or less [125, p.6]. From this state the excited moleculecan return to the ground state by emission of a photon. Fluorescence takes place on a timescale of the order of 10−8 s [125]. The molecule is brought back to the initial ground stateby means of vibrational relaxation. Vibrational relaxation in both ground and excited statecauses a redshift of emission in comparison to absorption. The energy difference betweenabsorption and emission is called Stokes shift.
19
E
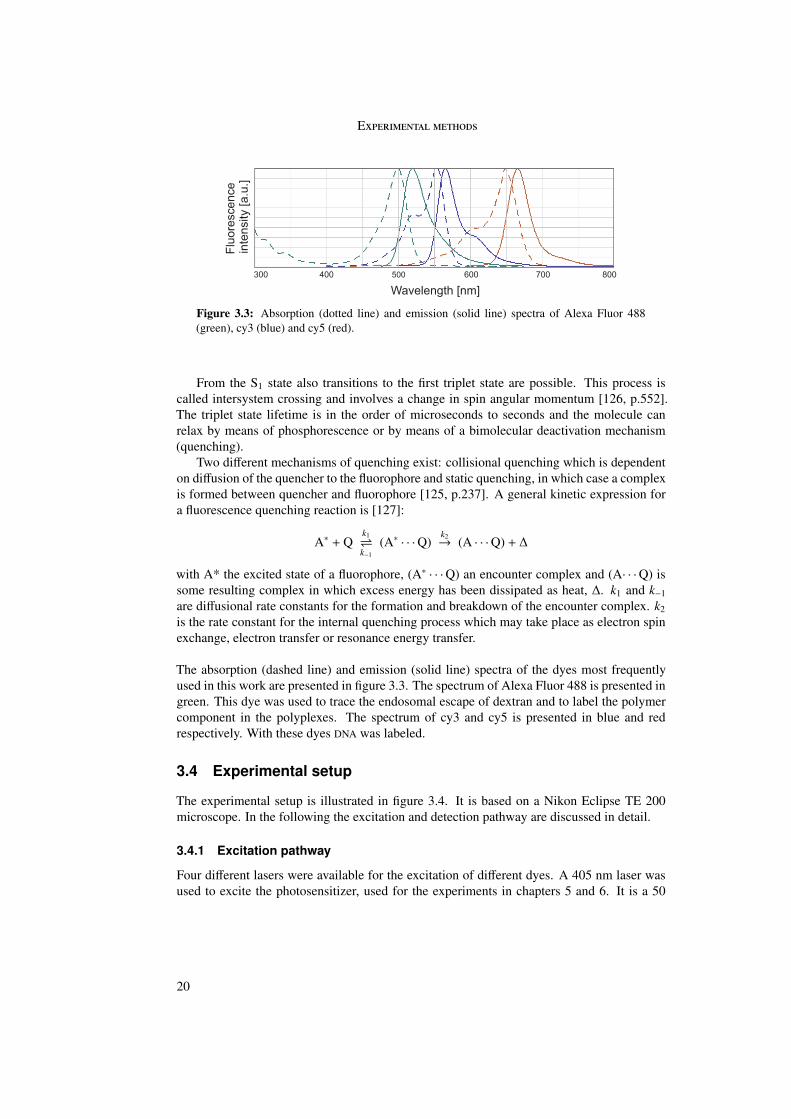
Figure 3.3: Absorption (dotted line) and emission (solid line) spectra of Alexa Fluor 488(green), cy3 (blue) and cy5 (red).
From the S1 state also transitions to the first triplet state are possible. This process iscalled intersystem crossing and involves a change in spin angular momentum [126, p.552].The triplet state lifetime is in the order of microseconds to seconds and the molecule canrelax by means of phosphorescence or by means of a bimolecular deactivation mechanism(quenching).
Two different mechanisms of quenching exist: collisional quenching which is dependenton diffusion of the quencher to the fluorophore and static quenching, in which case a complexis formed between quencher and fluorophore [125, p.237]. A general kinetic expression fora fluorescence quenching reaction is [127]:
A∗ + Qk1k−1
(A∗ · · ·Q)k2→ (A · · ·Q) + ∆
with A* the excited state of a fluorophore, (A∗ · · ·Q) an encounter complex and (A· · ·Q) issome resulting complex in which excess energy has been dissipated as heat, ∆. k1 and k−1are diffusional rate constants for the formation and breakdown of the encounter complex. k2is the rate constant for the internal quenching process which may take place as electron spinexchange, electron transfer or resonance energy transfer.
The absorption (dashed line) and emission (solid line) spectra of the dyes most frequentlyused in this work are presented in figure 3.3. The spectrum of Alexa Fluor 488 is presented ingreen. This dye was used to trace the endosomal escape of dextran and to label the polymercomponent in the polyplexes. The spectrum of cy3 and cy5 is presented in blue and redrespectively. With these dyes DNA was labeled.
3.4 Experimental setup
The experimental setup is illustrated in figure 3.4. It is based on a Nikon Eclipse TE 200microscope. In the following the excitation and detection pathway are discussed in detail.
3.4.1 Excitation pathway
Four different lasers were available for the excitation of different dyes. A 405 nm laser wasused to excite the photosensitizer, used for the experiments in chapters 5 and 6. It is a 50
20
E
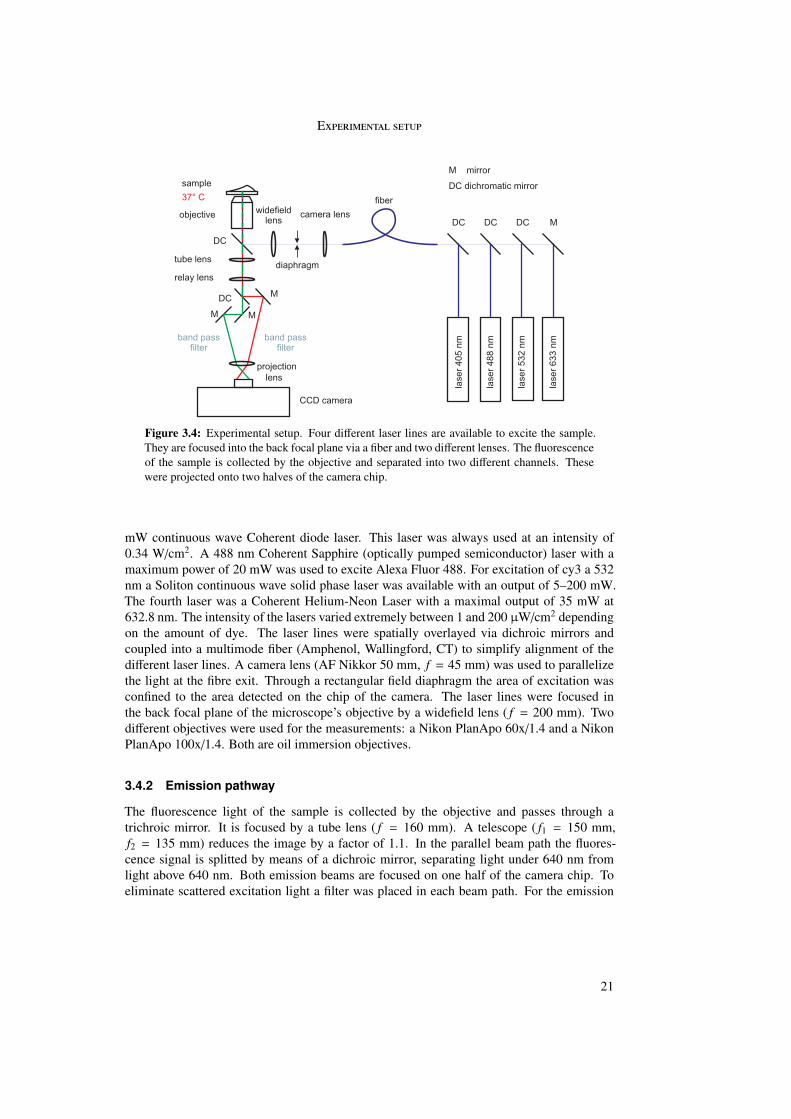
Figure 3.4: Experimental setup. Four different laser lines are available to excite the sample.They are focused into the back focal plane via a fiber and two different lenses. The fluorescenceof the sample is collected by the objective and separated into two different channels. Thesewere projected onto two halves of the camera chip.
mW continuous wave Coherent diode laser. This laser was always used at an intensity of0.34 W/cm2. A 488 nm Coherent Sapphire (optically pumped semiconductor) laser with amaximum power of 20 mW was used to excite Alexa Fluor 488. For excitation of cy3 a 532nm a Soliton continuous wave solid phase laser was available with an output of 5–200 mW.The fourth laser was a Coherent Helium-Neon Laser with a maximal output of 35 mW at632.8 nm. The intensity of the lasers varied extremely between 1 and 200 µW/cm2 dependingon the amount of dye. The laser lines were spatially overlayed via dichroic mirrors andcoupled into a multimode fiber (Amphenol, Wallingford, CT) to simplify alignment of thedifferent laser lines. A camera lens (AF Nikkor 50 mm, f = 45 mm) was used to parallelizethe light at the fibre exit. Through a rectangular field diaphragm the area of excitation wasconfined to the area detected on the chip of the camera. The laser lines were focused inthe back focal plane of the microscope’s objective by a widefield lens ( f = 200 mm). Twodifferent objectives were used for the measurements: a Nikon PlanApo 60x/1.4 and a NikonPlanApo 100x/1.4. Both are oil immersion objectives.
3.4.2 Emission pathway
The fluorescence light of the sample is collected by the objective and passes through atrichroic mirror. It is focused by a tube lens ( f = 160 mm). A telescope ( f1 = 150 mm,f2 = 135 mm) reduces the image by a factor of 1.1. In the parallel beam path the fluores-cence signal is splitted by means of a dichroic mirror, separating light under 640 nm fromlight above 640 nm. Both emission beams are focused on one half of the camera chip. Toeliminate scattered excitation light a filter was placed in each beam path. For the emission
21
E
path under 640 nm a bandpass filter was used (550/100 in case of GFP or Alexa Fluor 488fluorescence and 575/80 in case of cy3). In the emission path above 640 nm another bandpassfilter was used (720/150). The detection unit was an EM-CCD (electron multiplying chargedcoupled device) camera (Cascade 650; Roper Scientific, Tucson, AZ). The camera chip hasa size of 653 x 492 pixel. Since 1 pixel on the chip has a size of 7.4 µm x 7.4 µm, 1 pixelon the chip corresponds to 85 nm in case of the 100x objective and 142 nm in case of the60x objective. The overall magnification of the sample is given by the magnification of theobjective times the magnification in the detection pathway [128]. Thus, with a 100x objectivea magnification of 90x was obtained and a magnification of 54x was obtained when a 60xobjective was used.
3.5 Single particle tracking
The research on imaging of single molecule movement started in 1996 with a publication onvisualization of single phospholipids [129]. This arose much interest in imaging of singlefluorescent structures, especially in biological contexts, leading amongst other things to thedevelopment of a technique called single particle tracking [130, 131]. In contrast to othermethods like fluorescence recovery after photobleaching (FRAP) or fluorescence correlationspectroscopy (FCS), single particle tracking studies the properties of one single fluorescentstructure, be it a molecule, protein, virus or nonviral vector. Single particle tracking hasproved an excellent tool to provide new insights into the characteristics of macromoleculesand its surroundings [132–136]. Apart from a direct visualization of single biological struc-tures, the movement of a particle can be analyzed in detail enabling accurate biological inter-pretation.
To analyze the movement of a single particle, a trajectory has to be generated representingthis movement. To achieve this, the position of the particles for each video frame has to bedetermined. The signal of single fluorescent particles appears on the detector as a spot. Inorder to determine the x and y coordinates of this spot, different approaches can be used.Direct fitting of a 2-dimensional Gaussian to the intensity profile of the spot is among themost widely used methods [129, 137, 138], since the intensity distribution of a single spot iswell approximated by the gaussian equation:
f (x, y, A,w) = A · exp(− (x − x0)2 + (y − y0)2
w2
). (3.2)
x0 and y0 are the x and y coordinates of the center of the curve, A is the amplitude of thesignal and w is the width of the gaussian curve.
After determining the particle coordinates for each frame, the displacement of the particlebetween successive video frames can be determined. This can be calculated by means of thenearest neighbor algorithm [139].
In this thesis fitting of the Gaussian and calculation of the particle displacement wasperformed by means of a custom-build programm, developed by Kevin Braeckmans (GhentUniversity, Belgium) and written in Matlab (The Mathworks, Natick, MA, USA).
22
S
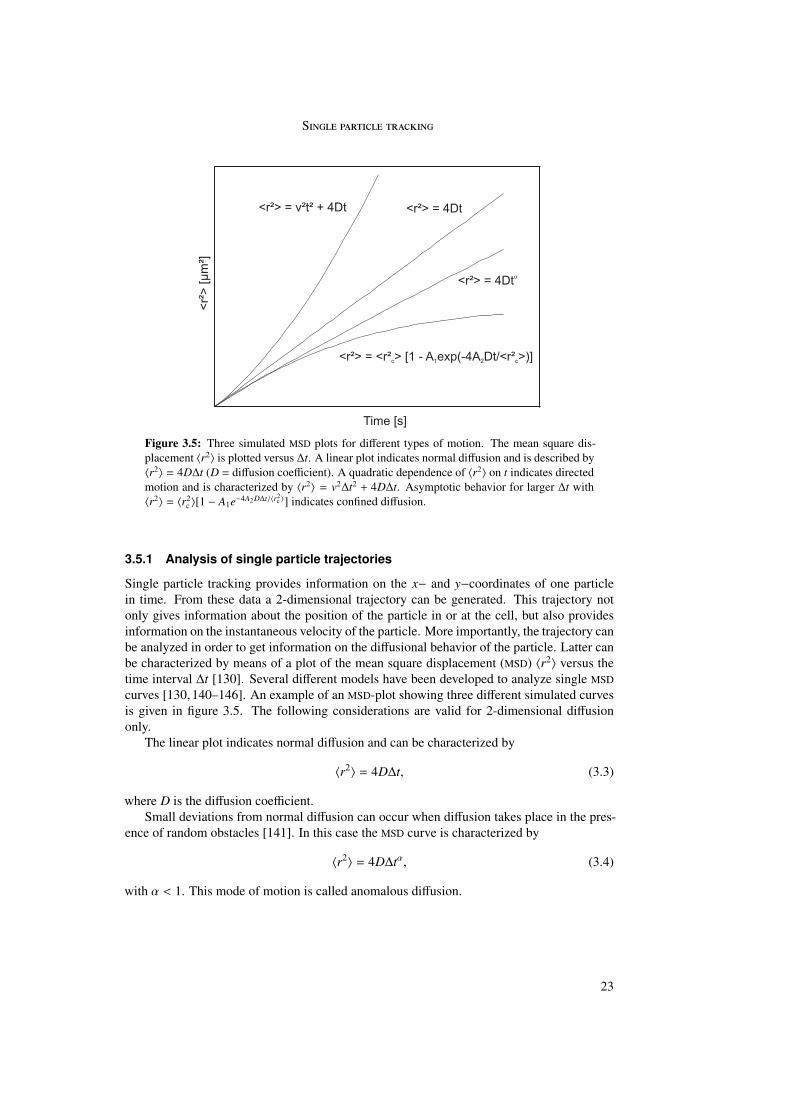
Figure 3.5: Three simulated MSD plots for different types of motion. The mean square dis-placement 〈r2〉 is plotted versus ∆t. A linear plot indicates normal diffusion and is described by〈r2〉 = 4D∆t (D = diffusion coefficient). A quadratic dependence of 〈r2〉 on t indicates directedmotion and is characterized by 〈r2〉 = v2∆t2 + 4D∆t. Asymptotic behavior for larger ∆t with〈r2〉 = 〈r2
c 〉[1 − A1e−4A2D∆t/〈r2c 〉] indicates confined diffusion.
3.5.1 Analysis of single particle trajectories
Single particle tracking provides information on the x− and y−coordinates of one particlein time. From these data a 2-dimensional trajectory can be generated. This trajectory notonly gives information about the position of the particle in or at the cell, but also providesinformation on the instantaneous velocity of the particle. More importantly, the trajectory canbe analyzed in order to get information on the diffusional behavior of the particle. Latter canbe characterized by means of a plot of the mean square displacement (MSD) 〈r2〉 versus thetime interval ∆t [130]. Several different models have been developed to analyze single MSDcurves [130, 140–146]. An example of an MSD-plot showing three different simulated curvesis given in figure 3.5. The following considerations are valid for 2-dimensional diffusiononly.
The linear plot indicates normal diffusion and can be characterized by
〈r2〉 = 4D∆t, (3.3)
where D is the diffusion coefficient.Small deviations from normal diffusion can occur when diffusion takes place in the pres-
ence of random obstacles [141]. In this case the MSD curve is characterized by
〈r2〉 = 4D∆tα, (3.4)
with α < 1. This mode of motion is called anomalous diffusion.
23
E
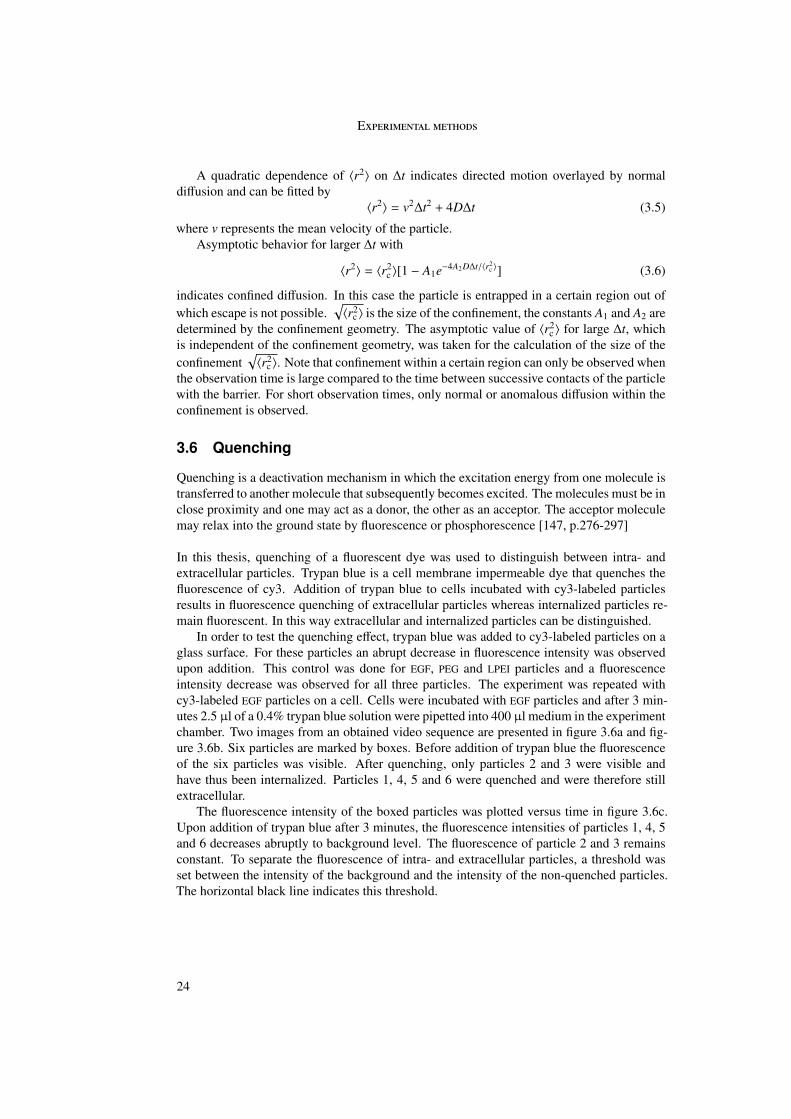
A quadratic dependence of 〈r2〉 on ∆t indicates directed motion overlayed by normaldiffusion and can be fitted by
〈r2〉 = v2∆t2 + 4D∆t (3.5)
where v represents the mean velocity of the particle.Asymptotic behavior for larger ∆t with
〈r2〉 = 〈r2c 〉[1 − A1e−4A2D∆t/〈r2
c 〉] (3.6)
indicates confined diffusion. In this case the particle is entrapped in a certain region out ofwhich escape is not possible.
√〈r2
c 〉 is the size of the confinement, the constants A1 and A2 aredetermined by the confinement geometry. The asymptotic value of 〈r2
c 〉 for large ∆t, whichis independent of the confinement geometry, was taken for the calculation of the size of theconfinement
√〈r2
c 〉. Note that confinement within a certain region can only be observed whenthe observation time is large compared to the time between successive contacts of the particlewith the barrier. For short observation times, only normal or anomalous diffusion within theconfinement is observed.
3.6 Quenching
Quenching is a deactivation mechanism in which the excitation energy from one molecule istransferred to another molecule that subsequently becomes excited. The molecules must be inclose proximity and one may act as a donor, the other as an acceptor. The acceptor moleculemay relax into the ground state by fluorescence or phosphorescence [147, p.276-297]
In this thesis, quenching of a fluorescent dye was used to distinguish between intra- andextracellular particles. Trypan blue is a cell membrane impermeable dye that quenches thefluorescence of cy3. Addition of trypan blue to cells incubated with cy3-labeled particlesresults in fluorescence quenching of extracellular particles whereas internalized particles re-main fluorescent. In this way extracellular and internalized particles can be distinguished.
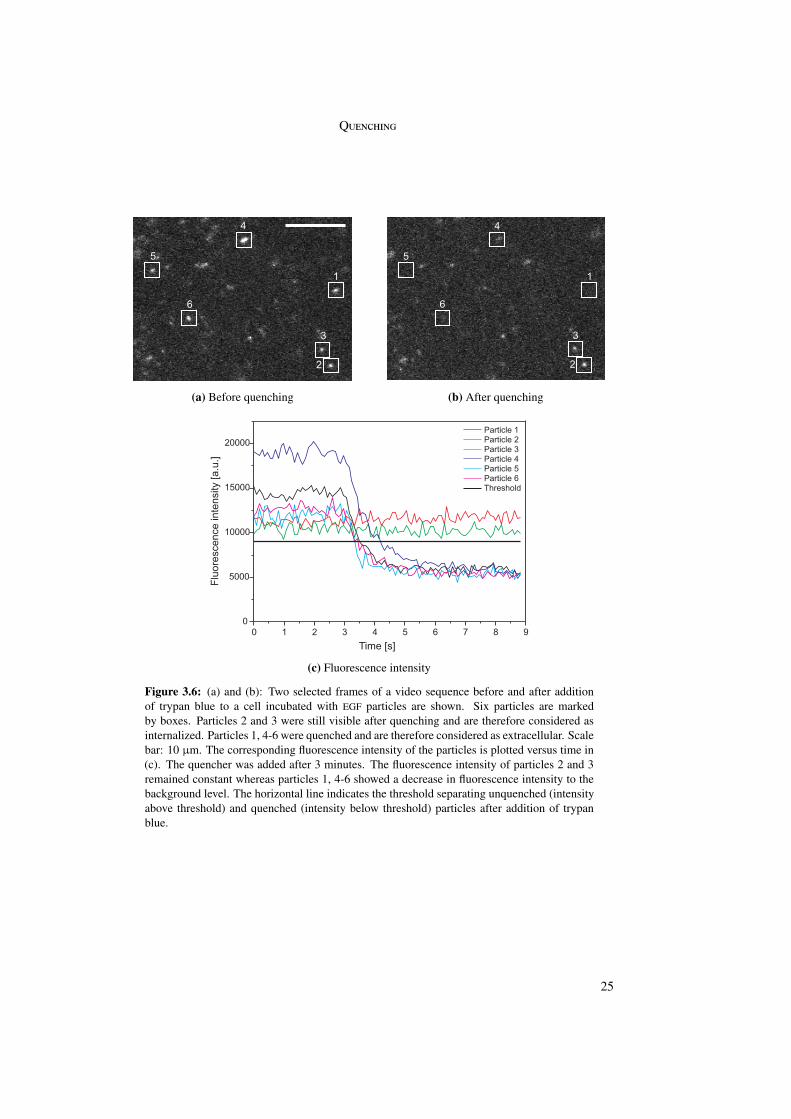
In order to test the quenching effect, trypan blue was added to cy3-labeled particles on aglass surface. For these particles an abrupt decrease in fluorescence intensity was observedupon addition. This control was done for EGF, PEG and LPEI particles and a fluorescenceintensity decrease was observed for all three particles. The experiment was repeated withcy3-labeled EGF particles on a cell. Cells were incubated with EGF particles and after 3 min-utes 2.5 µl of a 0.4% trypan blue solution were pipetted into 400 µl medium in the experimentchamber. Two images from an obtained video sequence are presented in figure 3.6a and fig-ure 3.6b. Six particles are marked by boxes. Before addition of trypan blue the fluorescenceof the six particles was visible. After quenching, only particles 2 and 3 were visible andhave thus been internalized. Particles 1, 4, 5 and 6 were quenched and were therefore stillextracellular.
The fluorescence intensity of the boxed particles was plotted versus time in figure 3.6c.Upon addition of trypan blue after 3 minutes, the fluorescence intensities of particles 1, 4, 5and 6 decreases abruptly to background level. The fluorescence of particle 2 and 3 remainsconstant. To separate the fluorescence of intra- and extracellular particles, a threshold wasset between the intensity of the background and the intensity of the non-quenched particles.The horizontal black line indicates this threshold.
24
Q
(a) Before quenching (b) After quenching
(c) Fluorescence intensity
Figure 3.6: (a) and (b): Two selected frames of a video sequence before and after additionof trypan blue to a cell incubated with EGF particles are shown. Six particles are markedby boxes. Particles 2 and 3 were still visible after quenching and are therefore considered asinternalized. Particles 1, 4-6 were quenched and are therefore considered as extracellular. Scalebar: 10 µm. The corresponding fluorescence intensity of the particles is plotted versus time in(c). The quencher was added after 3 minutes. The fluorescence intensity of particles 2 and 3remained constant whereas particles 1, 4-6 showed a decrease in fluorescence intensity to thebackground level. The horizontal line indicates the threshold separating unquenched (intensityabove threshold) and quenched (intensity below threshold) particles after addition of trypanblue.
25
E
(a) Before quenching (b) After quenching
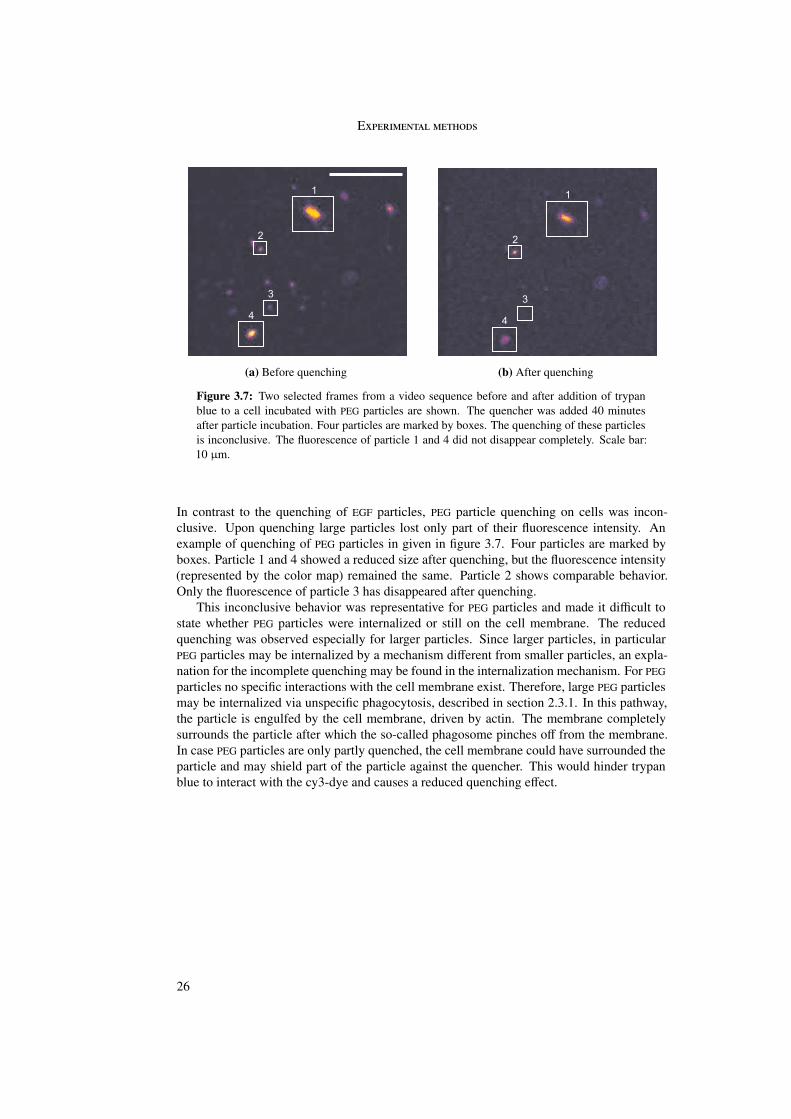
Figure 3.7: Two selected frames from a video sequence before and after addition of trypanblue to a cell incubated with PEG particles are shown. The quencher was added 40 minutesafter particle incubation. Four particles are marked by boxes. The quenching of these particlesis inconclusive. The fluorescence of particle 1 and 4 did not disappear completely. Scale bar:10 µm.
In contrast to the quenching of EGF particles, PEG particle quenching on cells was incon-clusive. Upon quenching large particles lost only part of their fluorescence intensity. Anexample of quenching of PEG particles in given in figure 3.7. Four particles are marked byboxes. Particle 1 and 4 showed a reduced size after quenching, but the fluorescence intensity(represented by the color map) remained the same. Particle 2 shows comparable behavior.Only the fluorescence of particle 3 has disappeared after quenching.
This inconclusive behavior was representative for PEG particles and made it difficult tostate whether PEG particles were internalized or still on the cell membrane. The reducedquenching was observed especially for larger particles. Since larger particles, in particularPEG particles may be internalized by a mechanism different from smaller particles, an expla-nation for the incomplete quenching may be found in the internalization mechanism. For PEGparticles no specific interactions with the cell membrane exist. Therefore, large PEG particlesmay be internalized via unspecific phagocytosis, described in section 2.3.1. In this pathway,the particle is engulfed by the cell membrane, driven by actin. The membrane completelysurrounds the particle after which the so-called phagosome pinches off from the membrane.In case PEG particles are only partly quenched, the cell membrane could have surrounded theparticle and may shield part of the particle against the quencher. This would hinder trypanblue to interact with the cy3-dye and causes a reduced quenching effect.
26
4. Internalization dynamics of polyplexes
The plasma membrane is the first cellular barrier a gene vector encounters on its way to thenucleus. Thus, in order to elucidate gene delivery by polyplexes, understanding the internal-ization process is of great importance. As we have seen in section 2.2.2, PEI particles, uponadministration into the blood stream, especially end up in the lung [55], which may not bethe desired target tissue. To enhance uptake by a specific tissue, a receptor-specific ligandcan be coupled to the vector. In this way, the gene vector is mainly delivered to cells ex-pressing the receptor corresponding to the ligand. In addition to this tissue-selective deliveryligand-receptor binding activates the receptor-mediated endocytic pathway, increasing uptakeefficiency. Several studies have confirmed a positive effect of targeting ligands on gene ex-pression [12] and internalization [13, 14] in vitro. However, the mechanism of enhancementby means of receptor targeting has not yet been investigated in detail. In this context, singleparticle tracking is a promising method to reveal the detailed dynamics and kinetics of theinternalization process of targeted versus untargeted gene vectors.
An example of a ligand is the epidermal growth factor (EGF) which targets the epidermalgrowth factor receptor (EGFR) that is overexpressed on a wide range of tumors. In this chap-ter the internalization dynamics of polyplexes with and without targeting ligand is compared.The examined polyplexes consist of linear polyethyleneimine (LPEI) which provides the pos-itive charge to condense the negatively charged DNA. The resulting positive charge of thepolyplex is shielded by polyethyleneglycol (PEG) reducing unspecific binding of polyplexesto blood components and to cells (section 2.2.2). For targeting purposes EGF was added.Polyplexes consisting of DNA condensed by LPEI and PEG only were used as control particles.Additionally, the internalization dynamics of particles consisting of DNAand LPEI is analyzed.The different particles are hereafter called EGF, PEG and LPEI particles, respectively.
By means of single particle tracking trajectories were generated representing the particles’movement during the internalization process. In the first part of this chapter the morpho-logical distinction of three different phases in the trajectories is discussed and a definitionfor the phases is given. Following this, the time point of internalization and the percentageof internalized particles for the three different polyplexes are determined. Lastly, the threephases are analyzed in detail by mean square displacement and a biological interpretation ofthe three phases is given.
27
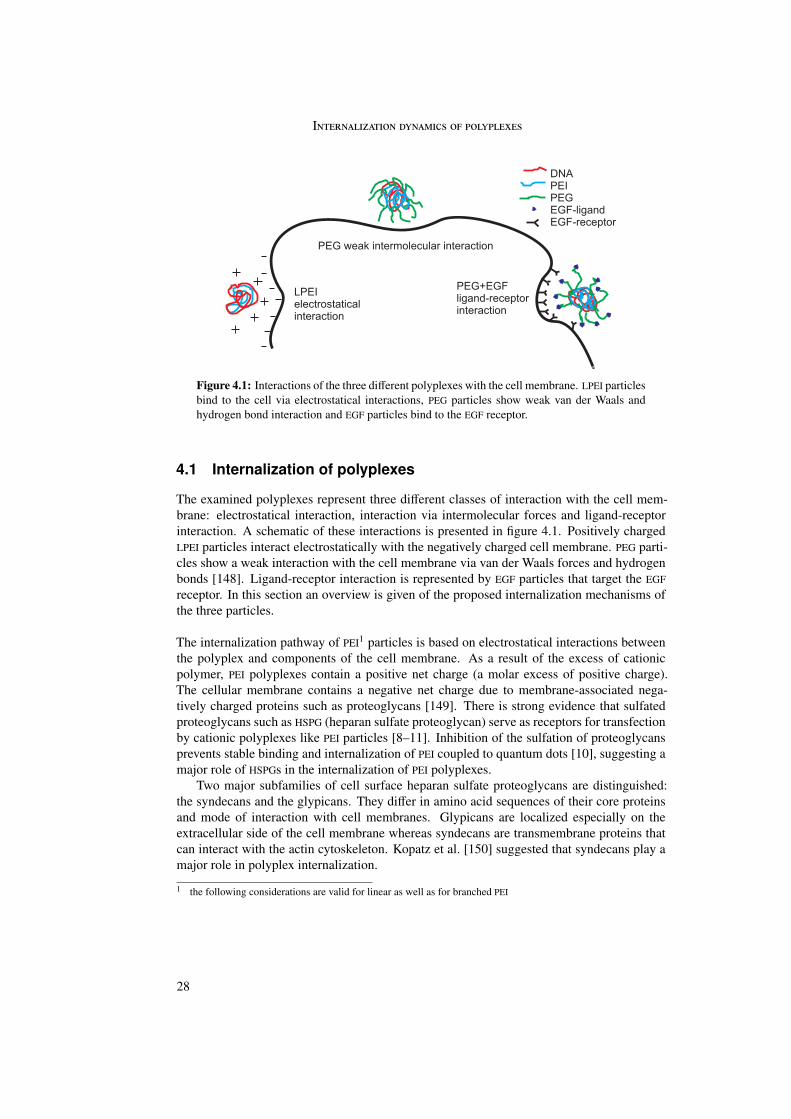
I
Figure 4.1: Interactions of the three different polyplexes with the cell membrane. LPEI particlesbind to the cell via electrostatical interactions, PEG particles show weak van der Waals andhydrogen bond interaction and EGF particles bind to the EGF receptor.
4.1 Internalization of polyplexes
The examined polyplexes represent three different classes of interaction with the cell mem-brane: electrostatical interaction, interaction via intermolecular forces and ligand-receptorinteraction. A schematic of these interactions is presented in figure 4.1. Positively chargedLPEI particles interact electrostatically with the negatively charged cell membrane. PEG parti-cles show a weak interaction with the cell membrane via van der Waals forces and hydrogenbonds [148]. Ligand-receptor interaction is represented by EGF particles that target the EGFreceptor. In this section an overview is given of the proposed internalization mechanisms ofthe three particles.
The internalization pathway of PEI1 particles is based on electrostatical interactions betweenthe polyplex and components of the cell membrane. As a result of the excess of cationicpolymer, PEI polyplexes contain a positive net charge (a molar excess of positive charge).The cellular membrane contains a negative net charge due to membrane-associated nega-tively charged proteins such as proteoglycans [149]. There is strong evidence that sulfatedproteoglycans such as HSPG (heparan sulfate proteoglycan) serve as receptors for transfectionby cationic polyplexes like PEI particles [8–11]. Inhibition of the sulfation of proteoglycansprevents stable binding and internalization of PEI coupled to quantum dots [10], suggesting amajor role of HSPGs in the internalization of PEI polyplexes.
Two major subfamilies of cell surface heparan sulfate proteoglycans are distinguished:the syndecans and the glypicans. They differ in amino acid sequences of their core proteinsand mode of interaction with cell membranes. Glypicans are localized especially on theextracellular side of the cell membrane whereas syndecans are transmembrane proteins thatcan interact with the actin cytoskeleton. Kopatz et al. [150] suggested that syndecans play amajor role in polyplex internalization.
1 the following considerations are valid for linear as well as for branched PEI
28
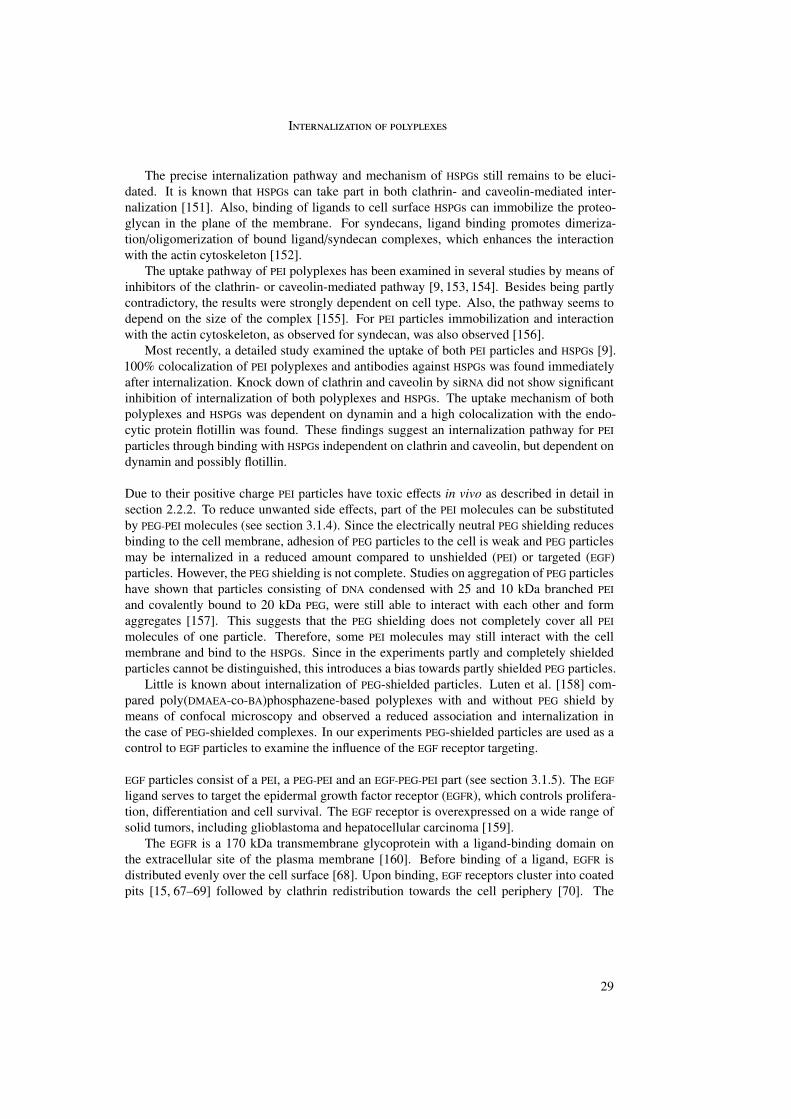
I
The precise internalization pathway and mechanism of HSPGs still remains to be eluci-dated. It is known that HSPGs can take part in both clathrin- and caveolin-mediated inter-nalization [151]. Also, binding of ligands to cell surface HSPGs can immobilize the proteo-glycan in the plane of the membrane. For syndecans, ligand binding promotes dimeriza-tion/oligomerization of bound ligand/syndecan complexes, which enhances the interactionwith the actin cytoskeleton [152].
The uptake pathway of PEI polyplexes has been examined in several studies by means ofinhibitors of the clathrin- or caveolin-mediated pathway [9, 153, 154]. Besides being partlycontradictory, the results were strongly dependent on cell type. Also, the pathway seems todepend on the size of the complex [155]. For PEI particles immobilization and interactionwith the actin cytoskeleton, as observed for syndecan, was also observed [156].
Most recently, a detailed study examined the uptake of both PEI particles and HSPGs [9].100% colocalization of PEI polyplexes and antibodies against HSPGs was found immediatelyafter internalization. Knock down of clathrin and caveolin by siRNA did not show significantinhibition of internalization of both polyplexes and HSPGs. The uptake mechanism of bothpolyplexes and HSPGs was dependent on dynamin and a high colocalization with the endo-cytic protein flotillin was found. These findings suggest an internalization pathway for PEIparticles through binding with HSPGs independent on clathrin and caveolin, but dependent ondynamin and possibly flotillin.
Due to their positive charge PEI particles have toxic effects in vivo as described in detail insection 2.2.2. To reduce unwanted side effects, part of the PEI molecules can be substitutedby PEG-PEI molecules (see section 3.1.4). Since the electrically neutral PEG shielding reducesbinding to the cell membrane, adhesion of PEG particles to the cell is weak and PEG particlesmay be internalized in a reduced amount compared to unshielded (PEI) or targeted (EGF)particles. However, the PEG shielding is not complete. Studies on aggregation of PEG particleshave shown that particles consisting of DNA condensed with 25 and 10 kDa branched PEIand covalently bound to 20 kDa PEG, were still able to interact with each other and formaggregates [157]. This suggests that the PEG shielding does not completely cover all PEImolecules of one particle. Therefore, some PEI molecules may still interact with the cellmembrane and bind to the HSPGs. Since in the experiments partly and completely shieldedparticles cannot be distinguished, this introduces a bias towards partly shielded PEG particles.
Little is known about internalization of PEG-shielded particles. Luten et al. [158] com-pared poly(DMAEA-co-BA)phosphazene-based polyplexes with and without PEG shield bymeans of confocal microscopy and observed a reduced association and internalization inthe case of PEG-shielded complexes. In our experiments PEG-shielded particles are used as acontrol to EGF particles to examine the influence of the EGF receptor targeting.
EGF particles consist of a PEI, a PEG-PEI and an EGF-PEG-PEI part (see section 3.1.5). The EGFligand serves to target the epidermal growth factor receptor (EGFR), which controls prolifera-tion, differentiation and cell survival. The EGF receptor is overexpressed on a wide range ofsolid tumors, including glioblastoma and hepatocellular carcinoma [159].
The EGFR is a 170 kDa transmembrane glycoprotein with a ligand-binding domain onthe extracellular site of the plasma membrane [160]. Before binding of a ligand, EGFR isdistributed evenly over the cell surface [68]. Upon binding, EGF receptors cluster into coatedpits [15, 67–69] followed by clathrin redistribution towards the cell periphery [70]. The
29
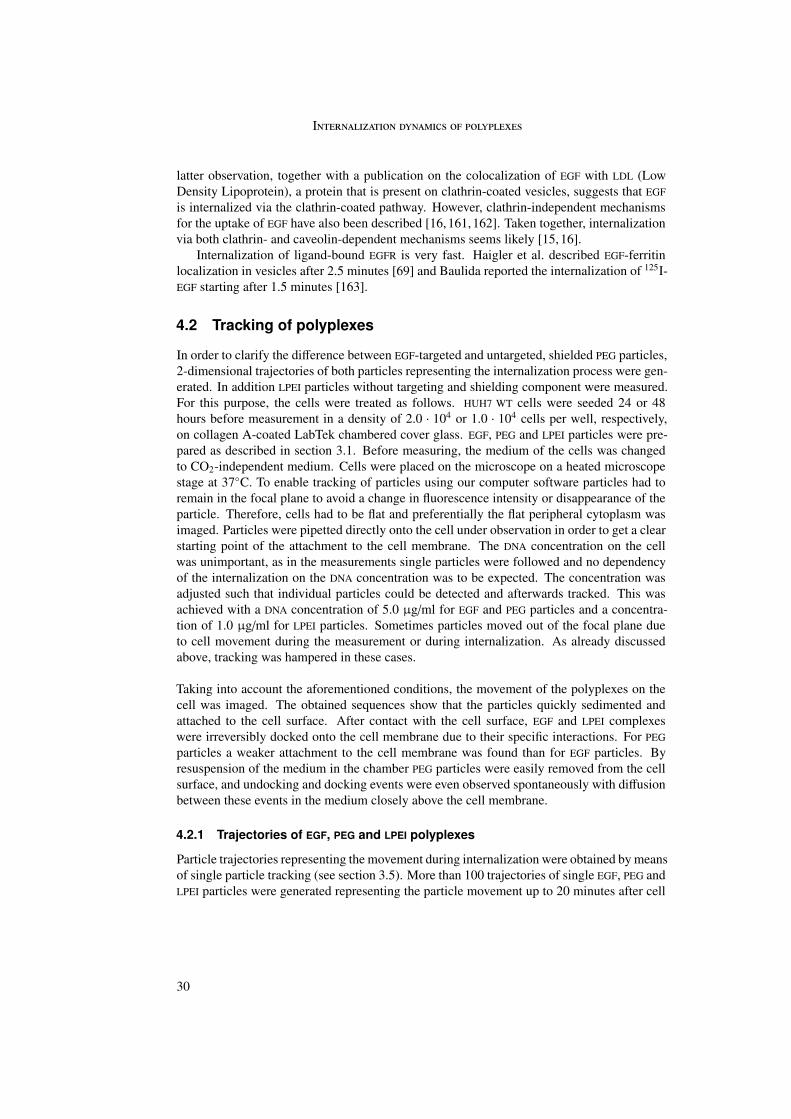
I
latter observation, together with a publication on the colocalization of EGF with LDL (LowDensity Lipoprotein), a protein that is present on clathrin-coated vesicles, suggests that EGFis internalized via the clathrin-coated pathway. However, clathrin-independent mechanismsfor the uptake of EGF have also been described [16,161,162]. Taken together, internalizationvia both clathrin- and caveolin-dependent mechanisms seems likely [15, 16].
Internalization of ligand-bound EGFR is very fast. Haigler et al. described EGF-ferritinlocalization in vesicles after 2.5 minutes [69] and Baulida reported the internalization of 125I-EGF starting after 1.5 minutes [163].
4.2 Tracking of polyplexes
In order to clarify the difference between EGF-targeted and untargeted, shielded PEG particles,2-dimensional trajectories of both particles representing the internalization process were gen-erated. In addition LPEI particles without targeting and shielding component were measured.For this purpose, the cells were treated as follows. HUH7 WT cells were seeded 24 or 48hours before measurement in a density of 2.0 · 104 or 1.0 · 104 cells per well, respectively,on collagen A-coated LabTek chambered cover glass. EGF, PEG and LPEI particles were pre-pared as described in section 3.1. Before measuring, the medium of the cells was changedto CO2-independent medium. Cells were placed on the microscope on a heated microscopestage at 37◦C. To enable tracking of particles using our computer software particles had toremain in the focal plane to avoid a change in fluorescence intensity or disappearance of theparticle. Therefore, cells had to be flat and preferentially the flat peripheral cytoplasm wasimaged. Particles were pipetted directly onto the cell under observation in order to get a clearstarting point of the attachment to the cell membrane. The DNA concentration on the cellwas unimportant, as in the measurements single particles were followed and no dependencyof the internalization on the DNA concentration was to be expected. The concentration wasadjusted such that individual particles could be detected and afterwards tracked. This wasachieved with a DNA concentration of 5.0 µg/ml for EGF and PEG particles and a concentra-tion of 1.0 µg/ml for LPEI particles. Sometimes particles moved out of the focal plane dueto cell movement during the measurement or during internalization. As already discussedabove, tracking was hampered in these cases.
Taking into account the aforementioned conditions, the movement of the polyplexes on thecell was imaged. The obtained sequences show that the particles quickly sedimented andattached to the cell surface. After contact with the cell surface, EGF and LPEI complexeswere irreversibly docked onto the cell membrane due to their specific interactions. For PEGparticles a weaker attachment to the cell membrane was found than for EGF particles. Byresuspension of the medium in the chamber PEG particles were easily removed from the cellsurface, and undocking and docking events were even observed spontaneously with diffusionbetween these events in the medium closely above the cell membrane.
4.2.1 Trajectories of EGF, PEG and LPEI polyplexes
Particle trajectories representing the movement during internalization were obtained by meansof single particle tracking (see section 3.5). More than 100 trajectories of single EGF, PEG andLPEI particles were generated representing the particle movement up to 20 minutes after cell
30
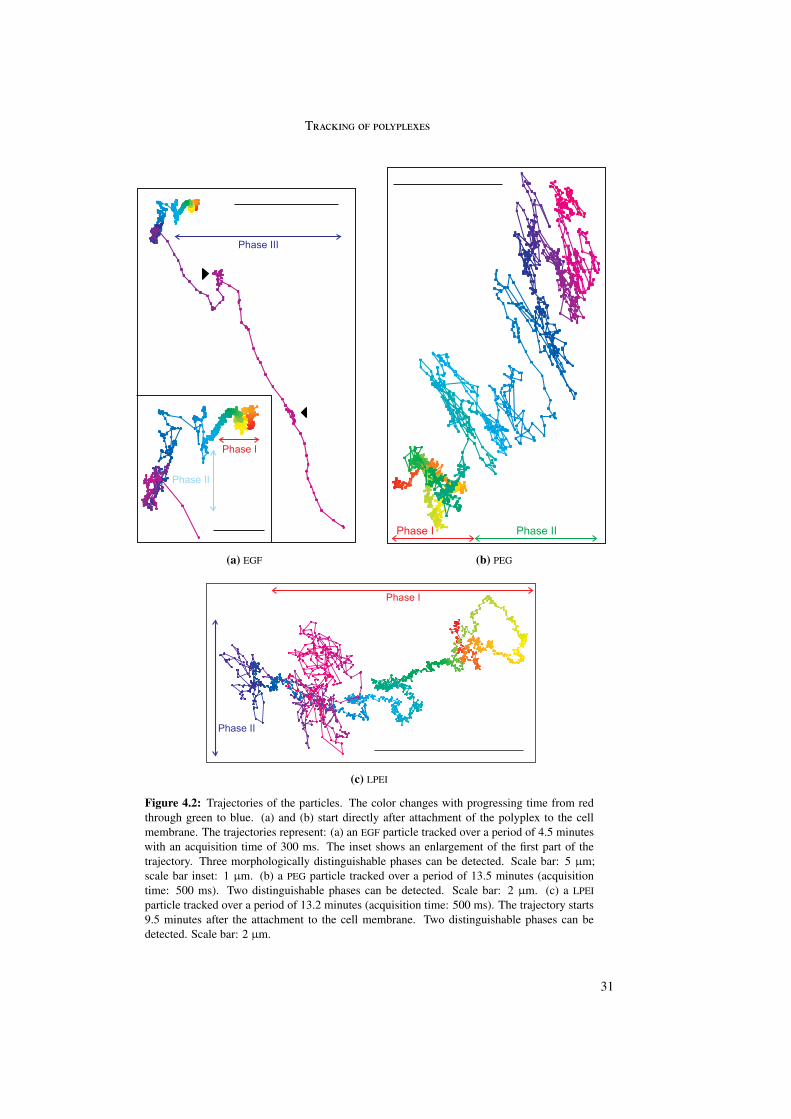
T
(a) EGF (b) PEG
(c) LPEI
Figure 4.2: Trajectories of the particles. The color changes with progressing time from redthrough green to blue. (a) and (b) start directly after attachment of the polyplex to the cellmembrane. The trajectories represent: (a) an EGF particle tracked over a period of 4.5 minuteswith an acquisition time of 300 ms. The inset shows an enlargement of the first part of thetrajectory. Three morphologically distinguishable phases can be detected. Scale bar: 5 µm;scale bar inset: 1 µm. (b) a PEG particle tracked over a period of 13.5 minutes (acquisitiontime: 500 ms). Two distinguishable phases can be detected. Scale bar: 2 µm. (c) a LPEIparticle tracked over a period of 13.2 minutes (acquisition time: 500 ms). The trajectory starts9.5 minutes after the attachment to the cell membrane. Two distinguishable phases can bedetected. Scale bar: 2 µm.
31
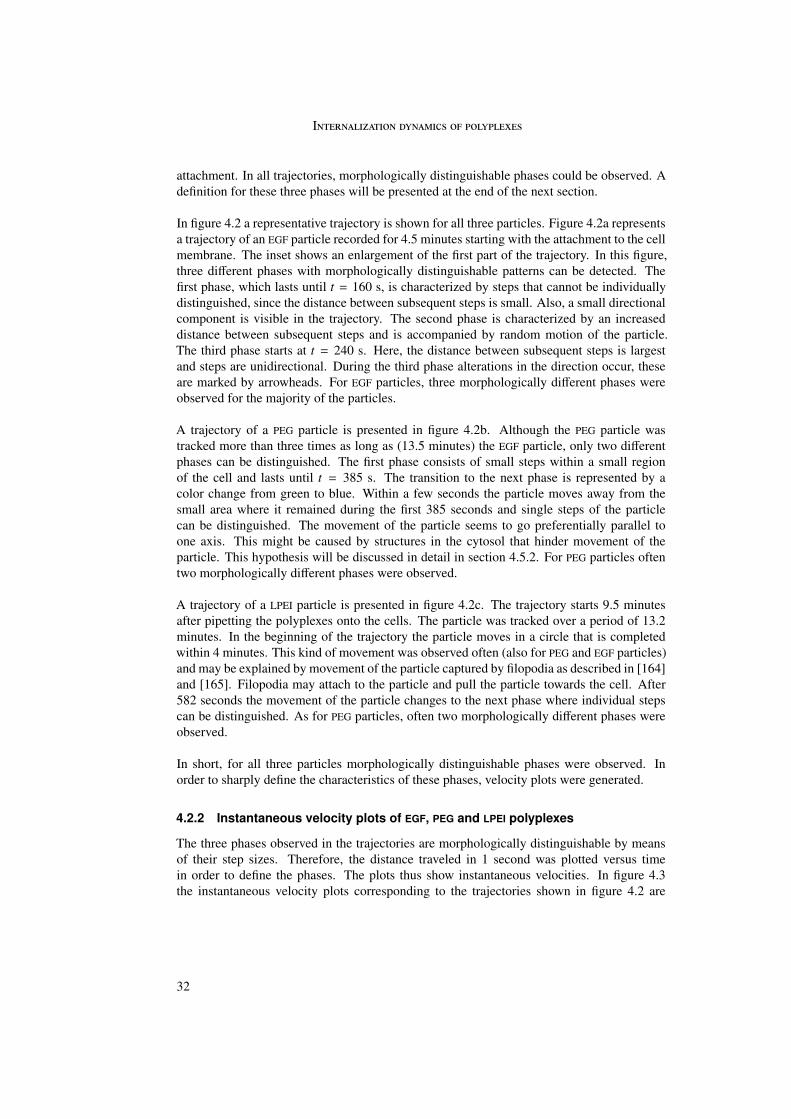
I
attachment. In all trajectories, morphologically distinguishable phases could be observed. Adefinition for these three phases will be presented at the end of the next section.
In figure 4.2 a representative trajectory is shown for all three particles. Figure 4.2a representsa trajectory of an EGF particle recorded for 4.5 minutes starting with the attachment to the cellmembrane. The inset shows an enlargement of the first part of the trajectory. In this figure,three different phases with morphologically distinguishable patterns can be detected. Thefirst phase, which lasts until t = 160 s, is characterized by steps that cannot be individuallydistinguished, since the distance between subsequent steps is small. Also, a small directionalcomponent is visible in the trajectory. The second phase is characterized by an increaseddistance between subsequent steps and is accompanied by random motion of the particle.The third phase starts at t = 240 s. Here, the distance between subsequent steps is largestand steps are unidirectional. During the third phase alterations in the direction occur, theseare marked by arrowheads. For EGF particles, three morphologically different phases wereobserved for the majority of the particles.
A trajectory of a PEG particle is presented in figure 4.2b. Although the PEG particle wastracked more than three times as long as (13.5 minutes) the EGF particle, only two differentphases can be distinguished. The first phase consists of small steps within a small regionof the cell and lasts until t = 385 s. The transition to the next phase is represented by acolor change from green to blue. Within a few seconds the particle moves away from thesmall area where it remained during the first 385 seconds and single steps of the particlecan be distinguished. The movement of the particle seems to go preferentially parallel toone axis. This might be caused by structures in the cytosol that hinder movement of theparticle. This hypothesis will be discussed in detail in section 4.5.2. For PEG particles oftentwo morphologically different phases were observed.
A trajectory of a LPEI particle is presented in figure 4.2c. The trajectory starts 9.5 minutesafter pipetting the polyplexes onto the cells. The particle was tracked over a period of 13.2minutes. In the beginning of the trajectory the particle moves in a circle that is completedwithin 4 minutes. This kind of movement was observed often (also for PEG and EGF particles)and may be explained by movement of the particle captured by filopodia as described in [164]and [165]. Filopodia may attach to the particle and pull the particle towards the cell. After582 seconds the movement of the particle changes to the next phase where individual stepscan be distinguished. As for PEG particles, often two morphologically different phases wereobserved.
In short, for all three particles morphologically distinguishable phases were observed. Inorder to sharply define the characteristics of these phases, velocity plots were generated.
4.2.2 Instantaneous velocity plots of EGF, PEG and LPEI polyplexes
The three phases observed in the trajectories are morphologically distinguishable by meansof their step sizes. Therefore, the distance traveled in 1 second was plotted versus timein order to define the phases. The plots thus show instantaneous velocities. In figure 4.3the instantaneous velocity plots corresponding to the trajectories shown in figure 4.2 are
32
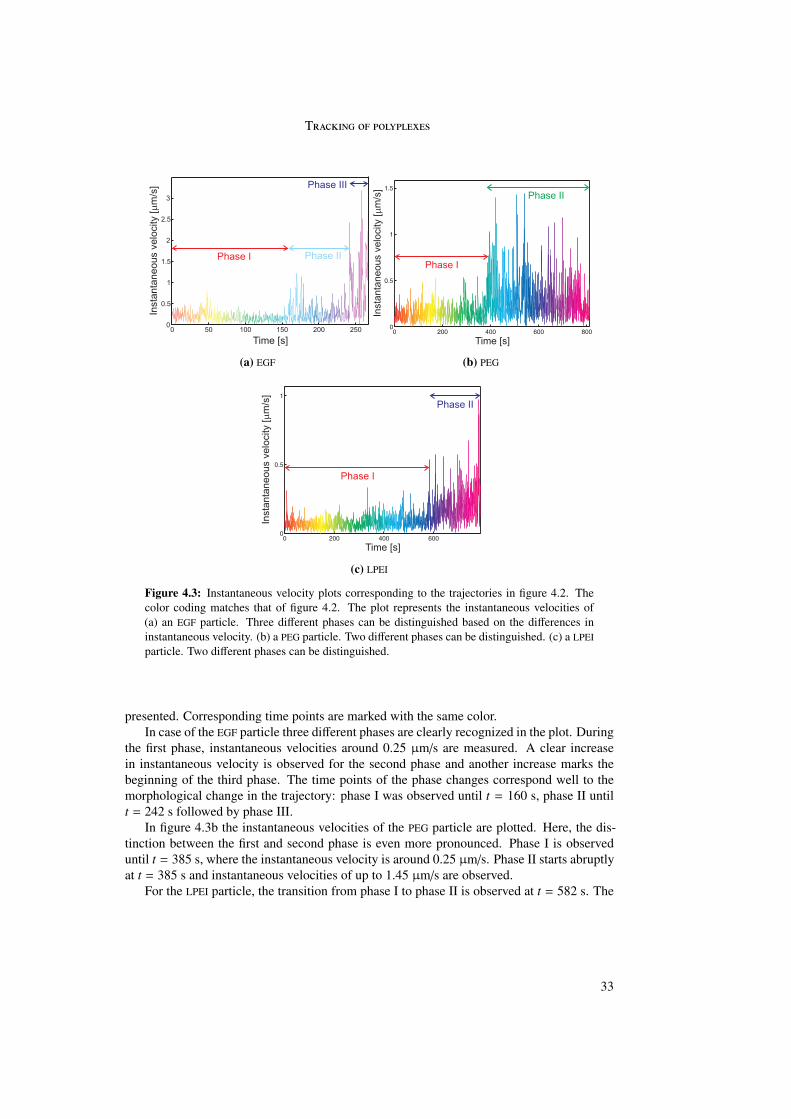
T
(a) EGF (b) PEG
(c) LPEI
Figure 4.3: Instantaneous velocity plots corresponding to the trajectories in figure 4.2. Thecolor coding matches that of figure 4.2. The plot represents the instantaneous velocities of(a) an EGF particle. Three different phases can be distinguished based on the differences ininstantaneous velocity. (b) a PEG particle. Two different phases can be distinguished. (c) a LPEIparticle. Two different phases can be distinguished.
presented. Corresponding time points are marked with the same color.In case of the EGF particle three different phases are clearly recognized in the plot. During
the first phase, instantaneous velocities around 0.25 µm/s are measured. A clear increasein instantaneous velocity is observed for the second phase and another increase marks thebeginning of the third phase. The time points of the phase changes correspond well to themorphological change in the trajectory: phase I was observed until t = 160 s, phase II untilt = 242 s followed by phase III.
In figure 4.3b the instantaneous velocities of the PEG particle are plotted. Here, the dis-tinction between the first and second phase is even more pronounced. Phase I is observeduntil t = 385 s, where the instantaneous velocity is around 0.25 µm/s. Phase II starts abruptlyat t = 385 s and instantaneous velocities of up to 1.45 µm/s are observed.
For the LPEI particle, the transition from phase I to phase II is observed at t = 582 s. The
33
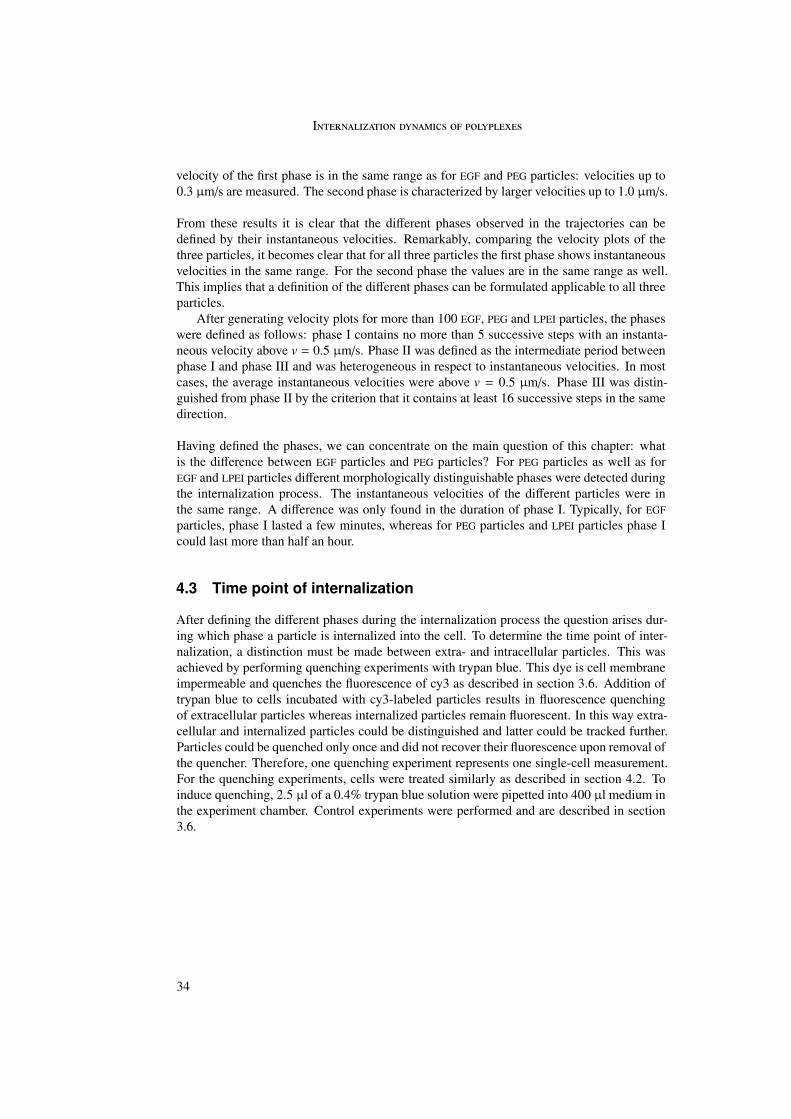
I
velocity of the first phase is in the same range as for EGF and PEG particles: velocities up to0.3 µm/s are measured. The second phase is characterized by larger velocities up to 1.0 µm/s.
From these results it is clear that the different phases observed in the trajectories can bedefined by their instantaneous velocities. Remarkably, comparing the velocity plots of thethree particles, it becomes clear that for all three particles the first phase shows instantaneousvelocities in the same range. For the second phase the values are in the same range as well.This implies that a definition of the different phases can be formulated applicable to all threeparticles.
After generating velocity plots for more than 100 EGF, PEG and LPEI particles, the phaseswere defined as follows: phase I contains no more than 5 successive steps with an instanta-neous velocity above v = 0.5 µm/s. Phase II was defined as the intermediate period betweenphase I and phase III and was heterogeneous in respect to instantaneous velocities. In mostcases, the average instantaneous velocities were above v = 0.5 µm/s. Phase III was distin-guished from phase II by the criterion that it contains at least 16 successive steps in the samedirection.
Having defined the phases, we can concentrate on the main question of this chapter: whatis the difference between EGF particles and PEG particles? For PEG particles as well as forEGF and LPEI particles different morphologically distinguishable phases were detected duringthe internalization process. The instantaneous velocities of the different particles were inthe same range. A difference was only found in the duration of phase I. Typically, for EGFparticles, phase I lasted a few minutes, whereas for PEG particles and LPEI particles phase Icould last more than half an hour.
4.3 Time point of internalization
After defining the different phases during the internalization process the question arises dur-ing which phase a particle is internalized into the cell. To determine the time point of inter-nalization, a distinction must be made between extra- and intracellular particles. This wasachieved by performing quenching experiments with trypan blue. This dye is cell membraneimpermeable and quenches the fluorescence of cy3 as described in section 3.6. Addition oftrypan blue to cells incubated with cy3-labeled particles results in fluorescence quenchingof extracellular particles whereas internalized particles remain fluorescent. In this way extra-cellular and internalized particles could be distinguished and latter could be tracked further.Particles could be quenched only once and did not recover their fluorescence upon removal ofthe quencher. Therefore, one quenching experiment represents one single-cell measurement.For the quenching experiments, cells were treated similarly as described in section 4.2. Toinduce quenching, 2.5 µl of a 0.4% trypan blue solution were pipetted into 400 µl medium inthe experiment chamber. Control experiments were performed and are described in section3.6.
34
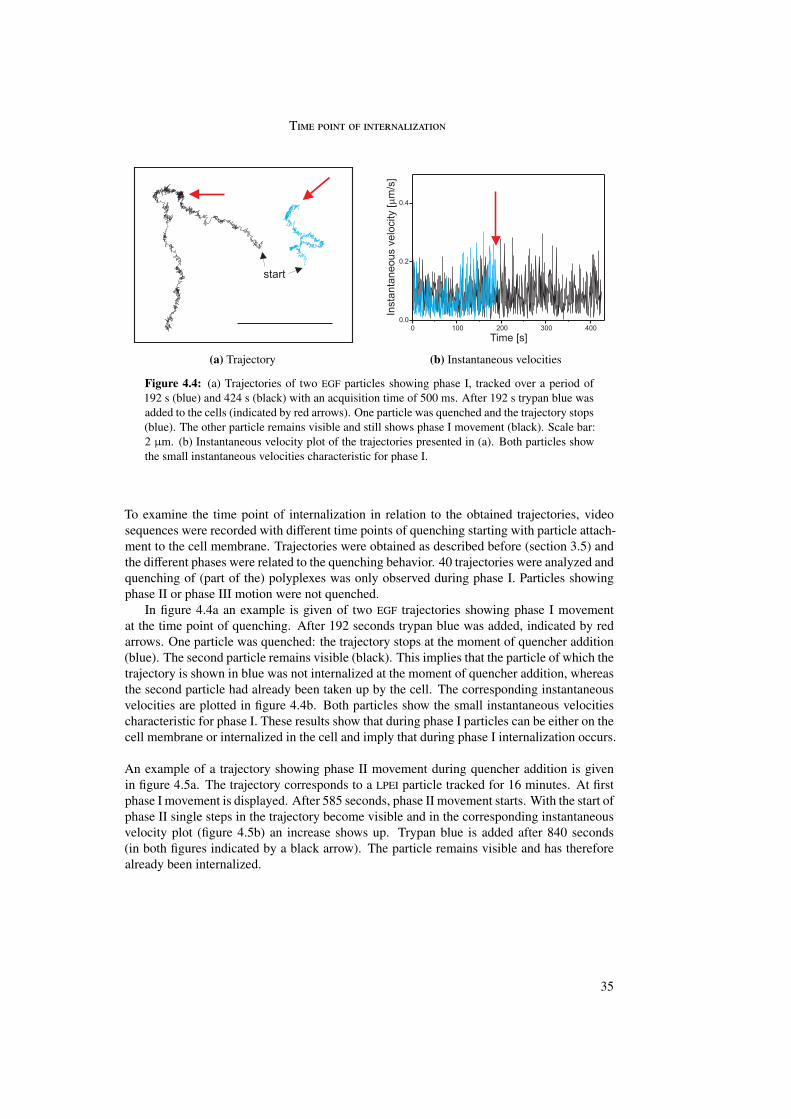
T
(a) Trajectory (b) Instantaneous velocities
Figure 4.4: (a) Trajectories of two EGF particles showing phase I, tracked over a period of192 s (blue) and 424 s (black) with an acquisition time of 500 ms. After 192 s trypan blue wasadded to the cells (indicated by red arrows). One particle was quenched and the trajectory stops(blue). The other particle remains visible and still shows phase I movement (black). Scale bar:2 µm. (b) Instantaneous velocity plot of the trajectories presented in (a). Both particles showthe small instantaneous velocities characteristic for phase I.
To examine the time point of internalization in relation to the obtained trajectories, videosequences were recorded with different time points of quenching starting with particle attach-ment to the cell membrane. Trajectories were obtained as described before (section 3.5) andthe different phases were related to the quenching behavior. 40 trajectories were analyzed andquenching of (part of the) polyplexes was only observed during phase I. Particles showingphase II or phase III motion were not quenched.
In figure 4.4a an example is given of two EGF trajectories showing phase I movementat the time point of quenching. After 192 seconds trypan blue was added, indicated by redarrows. One particle was quenched: the trajectory stops at the moment of quencher addition(blue). The second particle remains visible (black). This implies that the particle of which thetrajectory is shown in blue was not internalized at the moment of quencher addition, whereasthe second particle had already been taken up by the cell. The corresponding instantaneousvelocities are plotted in figure 4.4b. Both particles show the small instantaneous velocitiescharacteristic for phase I. These results show that during phase I particles can be either on thecell membrane or internalized in the cell and imply that during phase I internalization occurs.
An example of a trajectory showing phase II movement during quencher addition is givenin figure 4.5a. The trajectory corresponds to a LPEI particle tracked for 16 minutes. At firstphase I movement is displayed. After 585 seconds, phase II movement starts. With the start ofphase II single steps in the trajectory become visible and in the corresponding instantaneousvelocity plot (figure 4.5b) an increase shows up. Trypan blue is added after 840 seconds(in both figures indicated by a black arrow). The particle remains visible and has thereforealready been internalized.
35
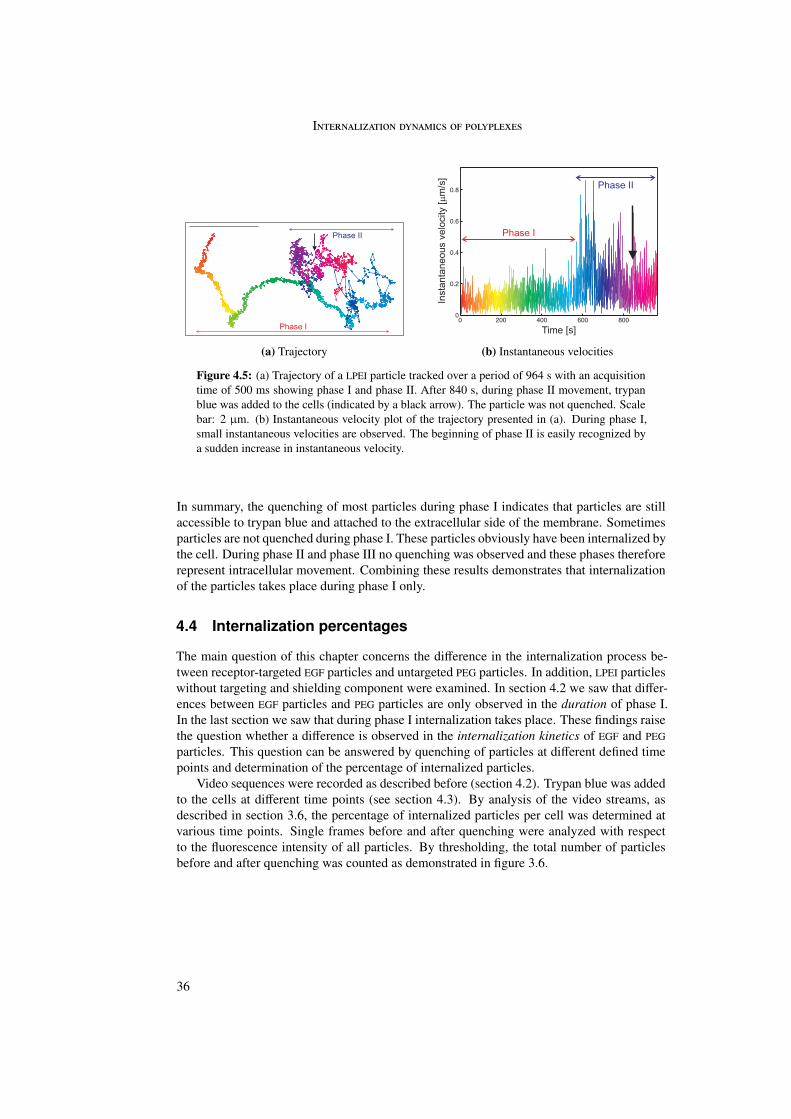
I
(a) Trajectory (b) Instantaneous velocities
Figure 4.5: (a) Trajectory of a LPEI particle tracked over a period of 964 s with an acquisitiontime of 500 ms showing phase I and phase II. After 840 s, during phase II movement, trypanblue was added to the cells (indicated by a black arrow). The particle was not quenched. Scalebar: 2 µm. (b) Instantaneous velocity plot of the trajectory presented in (a). During phase I,small instantaneous velocities are observed. The beginning of phase II is easily recognized bya sudden increase in instantaneous velocity.
In summary, the quenching of most particles during phase I indicates that particles are stillaccessible to trypan blue and attached to the extracellular side of the membrane. Sometimesparticles are not quenched during phase I. These particles obviously have been internalized bythe cell. During phase II and phase III no quenching was observed and these phases thereforerepresent intracellular movement. Combining these results demonstrates that internalizationof the particles takes place during phase I only.
4.4 Internalization percentages
The main question of this chapter concerns the difference in the internalization process be-tween receptor-targeted EGF particles and untargeted PEG particles. In addition, LPEI particleswithout targeting and shielding component were examined. In section 4.2 we saw that differ-ences between EGF particles and PEG particles are only observed in the duration of phase I.In the last section we saw that during phase I internalization takes place. These findings raisethe question whether a difference is observed in the internalization kinetics of EGF and PEGparticles. This question can be answered by quenching of particles at different defined timepoints and determination of the percentage of internalized particles.
Video sequences were recorded as described before (section 4.2). Trypan blue was addedto the cells at different time points (see section 4.3). By analysis of the video streams, asdescribed in section 3.6, the percentage of internalized particles per cell was determined atvarious time points. Single frames before and after quenching were analyzed with respectto the fluorescence intensity of all particles. By thresholding, the total number of particlesbefore and after quenching was counted as demonstrated in figure 3.6.
36
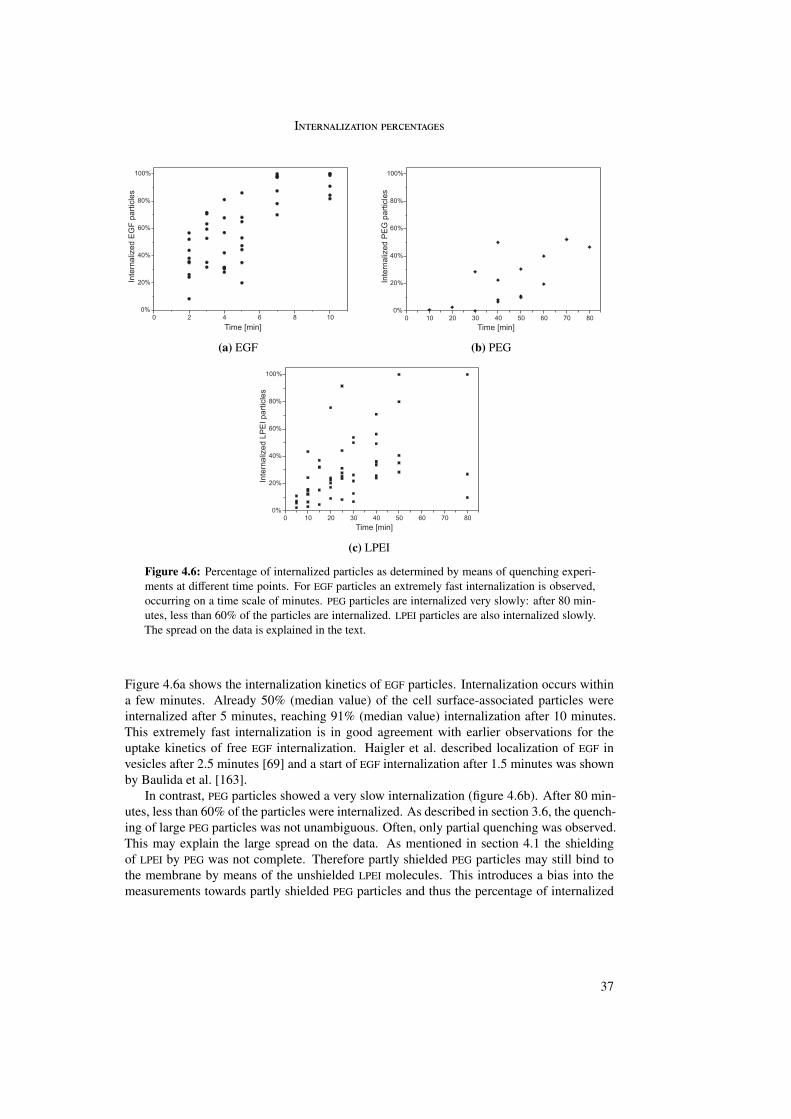
I
(a) EGF (b) PEG
(c) LPEI
Figure 4.6: Percentage of internalized particles as determined by means of quenching experi-ments at different time points. For EGF particles an extremely fast internalization is observed,occurring on a time scale of minutes. PEG particles are internalized very slowly: after 80 min-utes, less than 60% of the particles are internalized. LPEI particles are also internalized slowly.The spread on the data is explained in the text.
Figure 4.6a shows the internalization kinetics of EGF particles. Internalization occurs withina few minutes. Already 50% (median value) of the cell surface-associated particles wereinternalized after 5 minutes, reaching 91% (median value) internalization after 10 minutes.This extremely fast internalization is in good agreement with earlier observations for theuptake kinetics of free EGF internalization. Haigler et al. described localization of EGF invesicles after 2.5 minutes [69] and a start of EGF internalization after 1.5 minutes was shownby Baulida et al. [163].
In contrast, PEG particles showed a very slow internalization (figure 4.6b). After 80 min-utes, less than 60% of the particles were internalized. As described in section 3.6, the quench-ing of large PEG particles was not unambiguous. Often, only partial quenching was observed.This may explain the large spread on the data. As mentioned in section 4.1 the shieldingof LPEI by PEG was not complete. Therefore partly shielded PEG particles may still bind tothe membrane by means of the unshielded LPEI molecules. This introduces a bias into themeasurements towards partly shielded PEG particles and thus the percentage of internalized
37
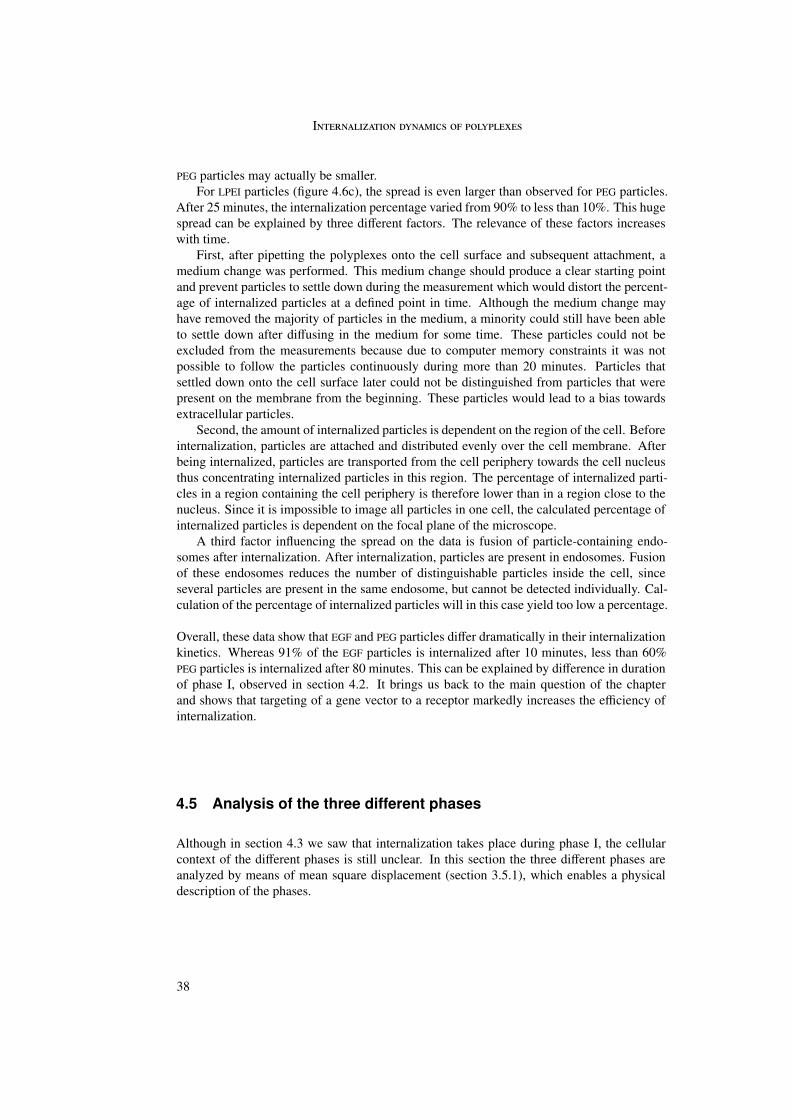
I
PEG particles may actually be smaller.For LPEI particles (figure 4.6c), the spread is even larger than observed for PEG particles.
After 25 minutes, the internalization percentage varied from 90% to less than 10%. This hugespread can be explained by three different factors. The relevance of these factors increaseswith time.
First, after pipetting the polyplexes onto the cell surface and subsequent attachment, amedium change was performed. This medium change should produce a clear starting pointand prevent particles to settle down during the measurement which would distort the percent-age of internalized particles at a defined point in time. Although the medium change mayhave removed the majority of particles in the medium, a minority could still have been ableto settle down after diffusing in the medium for some time. These particles could not beexcluded from the measurements because due to computer memory constraints it was notpossible to follow the particles continuously during more than 20 minutes. Particles thatsettled down onto the cell surface later could not be distinguished from particles that werepresent on the membrane from the beginning. These particles would lead to a bias towardsextracellular particles.
Second, the amount of internalized particles is dependent on the region of the cell. Beforeinternalization, particles are attached and distributed evenly over the cell membrane. Afterbeing internalized, particles are transported from the cell periphery towards the cell nucleusthus concentrating internalized particles in this region. The percentage of internalized parti-cles in a region containing the cell periphery is therefore lower than in a region close to thenucleus. Since it is impossible to image all particles in one cell, the calculated percentage ofinternalized particles is dependent on the focal plane of the microscope.
A third factor influencing the spread on the data is fusion of particle-containing endo-somes after internalization. After internalization, particles are present in endosomes. Fusionof these endosomes reduces the number of distinguishable particles inside the cell, sinceseveral particles are present in the same endosome, but cannot be detected individually. Cal-culation of the percentage of internalized particles will in this case yield too low a percentage.
Overall, these data show that EGF and PEG particles differ dramatically in their internalizationkinetics. Whereas 91% of the EGF particles is internalized after 10 minutes, less than 60%PEG particles is internalized after 80 minutes. This can be explained by difference in durationof phase I, observed in section 4.2. It brings us back to the main question of the chapterand shows that targeting of a gene vector to a receptor markedly increases the efficiency ofinternalization.
4.5 Analysis of the three different phases
Although in section 4.3 we saw that internalization takes place during phase I, the cellularcontext of the different phases is still unclear. In this section the three different phases areanalyzed by means of mean square displacement (section 3.5.1), which enables a physicaldescription of the phases.
38
A
Figure 4.7: Histogram of the instantaneous velocities during phase I generated from 10 EGFparticle trajectories. Phase I is characterized by a low instantaneous velocity typically belowv = 0.5 µm/s. The distribution contains a maximum at v = 0.1 µm/s.
4.5.1 Phase I
At the end of section 4.2 a definition was given for the three phases observed in section 4.2.1.Phase I was defined as containing no more than 5 successive steps with an instantaneousvelocity above v = 0.5 µm/s. Over 100 EGF, PEG and LPEI trajectories were divided intodifferent phases, according to the aforementioned definition. For each phase a histogram wasproduced depicting the number of frames with a specified instantaneous velocity within abin size of 0.05 µm/s. For phase I, the resulting distribution is presented in figure 4.7. It ischaracterized by a narrow velocity profile with a maximum in the distribution at v = 0.1 µm/s.
Phase I was further analyzed by plotting the mean square displacement (MSD) 〈r2〉 versus time∆t. (For a detailed description of mean square displacement see section 3.5.1.) In figure 4.8,the MSD plots of phase I of 10 representative EGF trajectories are displayed. The MSD plot forthe trajectory shown in figure 4.2a is included and is distinguishable as a dotted curve. Theplots show a quadratic dependence of 〈r2〉 on ∆t, indicating directed motion. Fitting equation3.5 to the data and averaging the obtained values for the 10 trajectories results in a mean driftvelocity vI = 0.015±0.003 µm/s and a mean diffusion coefficient DI = 4·10−4±4·10−4 µm2/s.The large standard deviation is a result of the broad spread of the diffusion coefficients fromcurve to curve in figure 4.8. For a single curve the diffusion coefficient can be calculatedmuch more accurately.
39
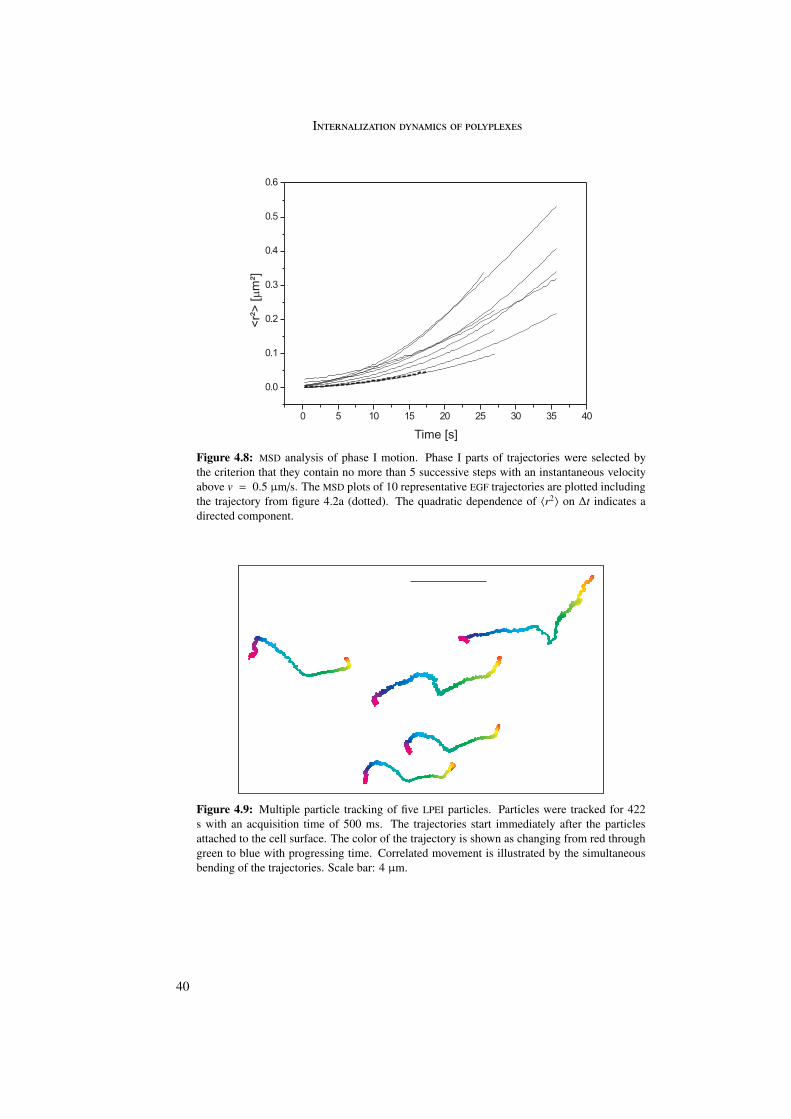
I
Figure 4.8: MSD analysis of phase I motion. Phase I parts of trajectories were selected bythe criterion that they contain no more than 5 successive steps with an instantaneous velocityabove v = 0.5 µm/s. The MSD plots of 10 representative EGF trajectories are plotted includingthe trajectory from figure 4.2a (dotted). The quadratic dependence of 〈r2〉 on ∆t indicates adirected component.
Figure 4.9: Multiple particle tracking of five LPEI particles. Particles were tracked for 422s with an acquisition time of 500 ms. The trajectories start immediately after the particlesattached to the cell surface. The color of the trajectory is shown as changing from red throughgreen to blue with progressing time. Correlated movement is illustrated by the simultaneousbending of the trajectories. Scale bar: 4 µm.
40
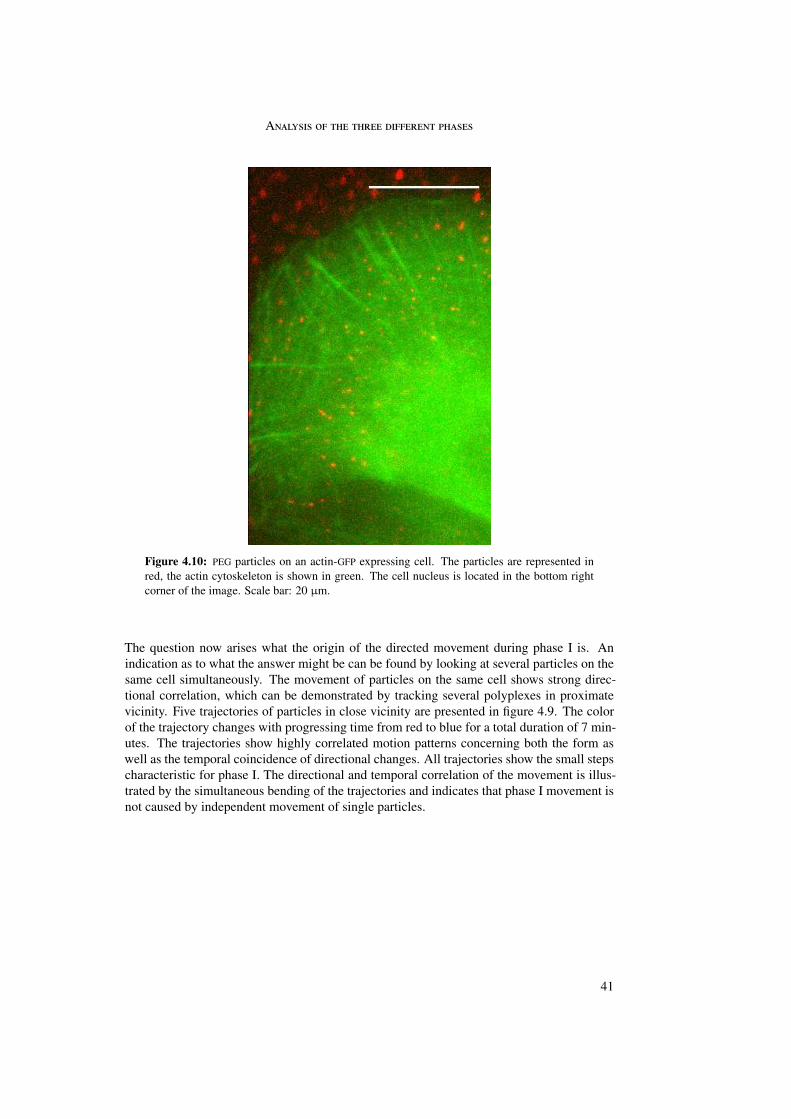
A
Figure 4.10: PEG particles on an actin-GFP expressing cell. The particles are represented inred, the actin cytoskeleton is shown in green. The cell nucleus is located in the bottom rightcorner of the image. Scale bar: 20 µm.
The question now arises what the origin of the directed movement during phase I is. Anindication as to what the answer might be can be found by looking at several particles on thesame cell simultaneously. The movement of particles on the same cell shows strong direc-tional correlation, which can be demonstrated by tracking several polyplexes in proximatevicinity. Five trajectories of particles in close vicinity are presented in figure 4.9. The colorof the trajectory changes with progressing time from red to blue for a total duration of 7 min-utes. The trajectories show highly correlated motion patterns concerning both the form aswell as the temporal coincidence of directional changes. All trajectories show the small stepscharacteristic for phase I. The directional and temporal correlation of the movement is illus-trated by the simultaneous bending of the trajectories and indicates that phase I movement isnot caused by independent movement of single particles.
41
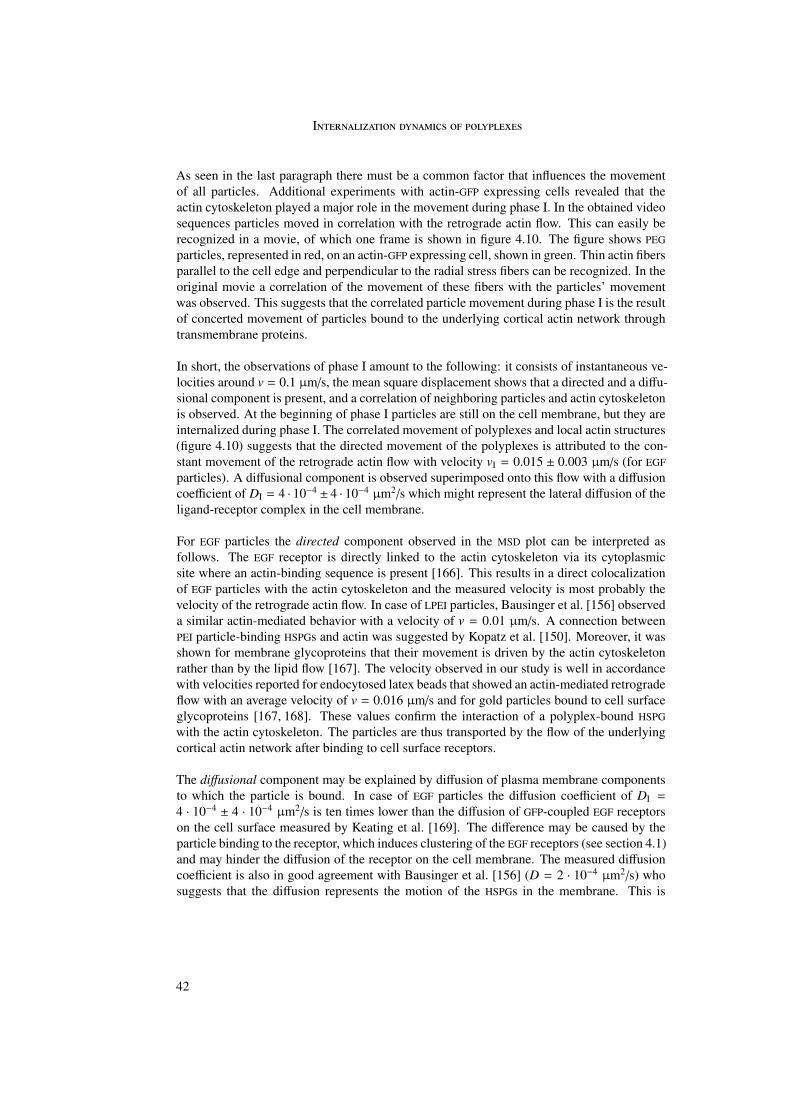
I
As seen in the last paragraph there must be a common factor that influences the movementof all particles. Additional experiments with actin-GFP expressing cells revealed that theactin cytoskeleton played a major role in the movement during phase I. In the obtained videosequences particles moved in correlation with the retrograde actin flow. This can easily berecognized in a movie, of which one frame is shown in figure 4.10. The figure shows PEGparticles, represented in red, on an actin-GFP expressing cell, shown in green. Thin actin fibersparallel to the cell edge and perpendicular to the radial stress fibers can be recognized. In theoriginal movie a correlation of the movement of these fibers with the particles’ movementwas observed. This suggests that the correlated particle movement during phase I is the resultof concerted movement of particles bound to the underlying cortical actin network throughtransmembrane proteins.
In short, the observations of phase I amount to the following: it consists of instantaneous ve-locities around v = 0.1 µm/s, the mean square displacement shows that a directed and a diffu-sional component is present, and a correlation of neighboring particles and actin cytoskeletonis observed. At the beginning of phase I particles are still on the cell membrane, but they areinternalized during phase I. The correlated movement of polyplexes and local actin structures(figure 4.10) suggests that the directed movement of the polyplexes is attributed to the con-stant movement of the retrograde actin flow with velocity vI = 0.015 ± 0.003 µm/s (for EGFparticles). A diffusional component is observed superimposed onto this flow with a diffusioncoefficient of DI = 4 · 10−4 ± 4 · 10−4 µm2/s which might represent the lateral diffusion of theligand-receptor complex in the cell membrane.
For EGF particles the directed component observed in the MSD plot can be interpreted asfollows. The EGF receptor is directly linked to the actin cytoskeleton via its cytoplasmicsite where an actin-binding sequence is present [166]. This results in a direct colocalizationof EGF particles with the actin cytoskeleton and the measured velocity is most probably thevelocity of the retrograde actin flow. In case of LPEI particles, Bausinger et al. [156] observeda similar actin-mediated behavior with a velocity of v = 0.01 µm/s. A connection betweenPEI particle-binding HSPGs and actin was suggested by Kopatz et al. [150]. Moreover, it wasshown for membrane glycoproteins that their movement is driven by the actin cytoskeletonrather than by the lipid flow [167]. The velocity observed in our study is well in accordancewith velocities reported for endocytosed latex beads that showed an actin-mediated retrogradeflow with an average velocity of v = 0.016 µm/s and for gold particles bound to cell surfaceglycoproteins [167, 168]. These values confirm the interaction of a polyplex-bound HSPGwith the actin cytoskeleton. The particles are thus transported by the flow of the underlyingcortical actin network after binding to cell surface receptors.
The diffusional component may be explained by diffusion of plasma membrane componentsto which the particle is bound. In case of EGF particles the diffusion coefficient of DI =
4 · 10−4 ± 4 · 10−4 µm2/s is ten times lower than the diffusion of GFP-coupled EGF receptorson the cell surface measured by Keating et al. [169]. The difference may be caused by theparticle binding to the receptor, which induces clustering of the EGF receptors (see section 4.1)and may hinder the diffusion of the receptor on the cell membrane. The measured diffusioncoefficient is also in good agreement with Bausinger et al. [156] (D = 2 · 10−4 µm2/s) whosuggests that the diffusion represents the motion of the HSPGs in the membrane. This is
42
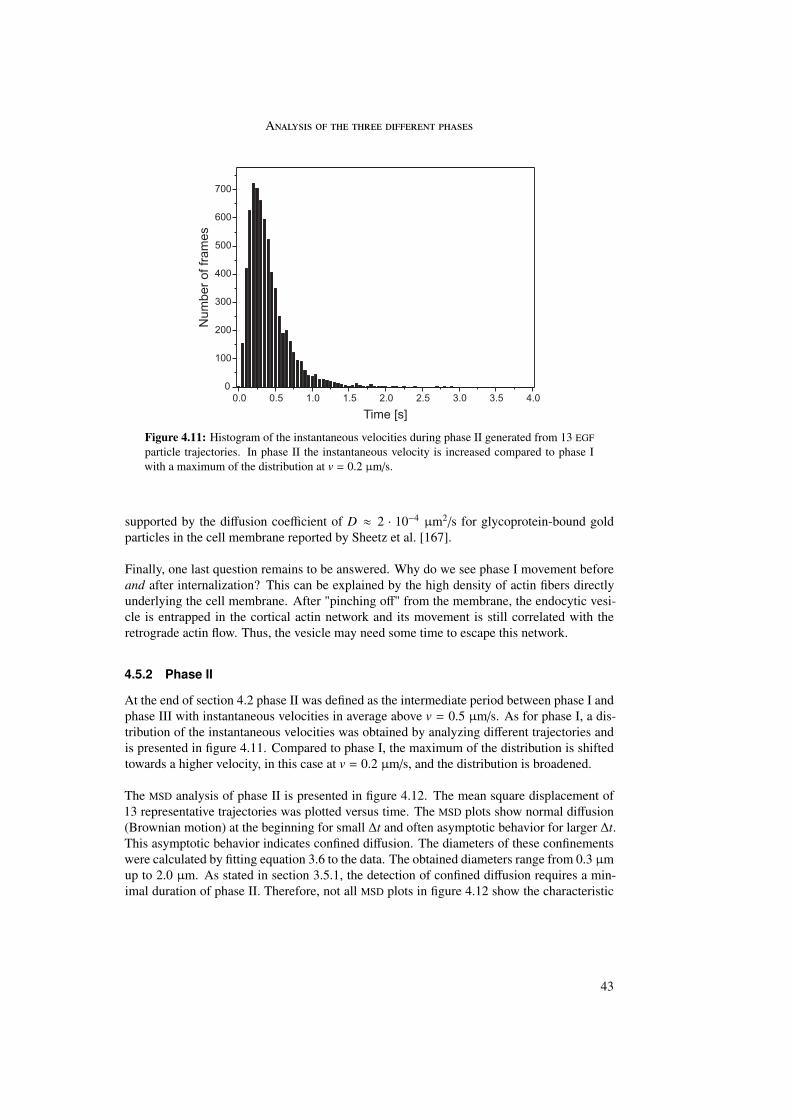
A
Figure 4.11: Histogram of the instantaneous velocities during phase II generated from 13 EGFparticle trajectories. In phase II the instantaneous velocity is increased compared to phase Iwith a maximum of the distribution at v = 0.2 µm/s.
supported by the diffusion coefficient of D ≈ 2 · 10−4 µm2/s for glycoprotein-bound goldparticles in the cell membrane reported by Sheetz et al. [167].
Finally, one last question remains to be answered. Why do we see phase I movement beforeand after internalization? This can be explained by the high density of actin fibers directlyunderlying the cell membrane. After "pinching off" from the membrane, the endocytic vesi-cle is entrapped in the cortical actin network and its movement is still correlated with theretrograde actin flow. Thus, the vesicle may need some time to escape this network.
4.5.2 Phase II
At the end of section 4.2 phase II was defined as the intermediate period between phase I andphase III with instantaneous velocities in average above v = 0.5 µm/s. As for phase I, a dis-tribution of the instantaneous velocities was obtained by analyzing different trajectories andis presented in figure 4.11. Compared to phase I, the maximum of the distribution is shiftedtowards a higher velocity, in this case at v = 0.2 µm/s, and the distribution is broadened.
The MSD analysis of phase II is presented in figure 4.12. The mean square displacement of13 representative trajectories was plotted versus time. The MSD plots show normal diffusion(Brownian motion) at the beginning for small ∆t and often asymptotic behavior for larger ∆t.This asymptotic behavior indicates confined diffusion. The diameters of these confinementswere calculated by fitting equation 3.6 to the data. The obtained diameters range from 0.3 µmup to 2.0 µm. As stated in section 3.5.1, the detection of confined diffusion requires a min-imal duration of phase II. Therefore, not all MSD plots in figure 4.12 show the characteristic
43
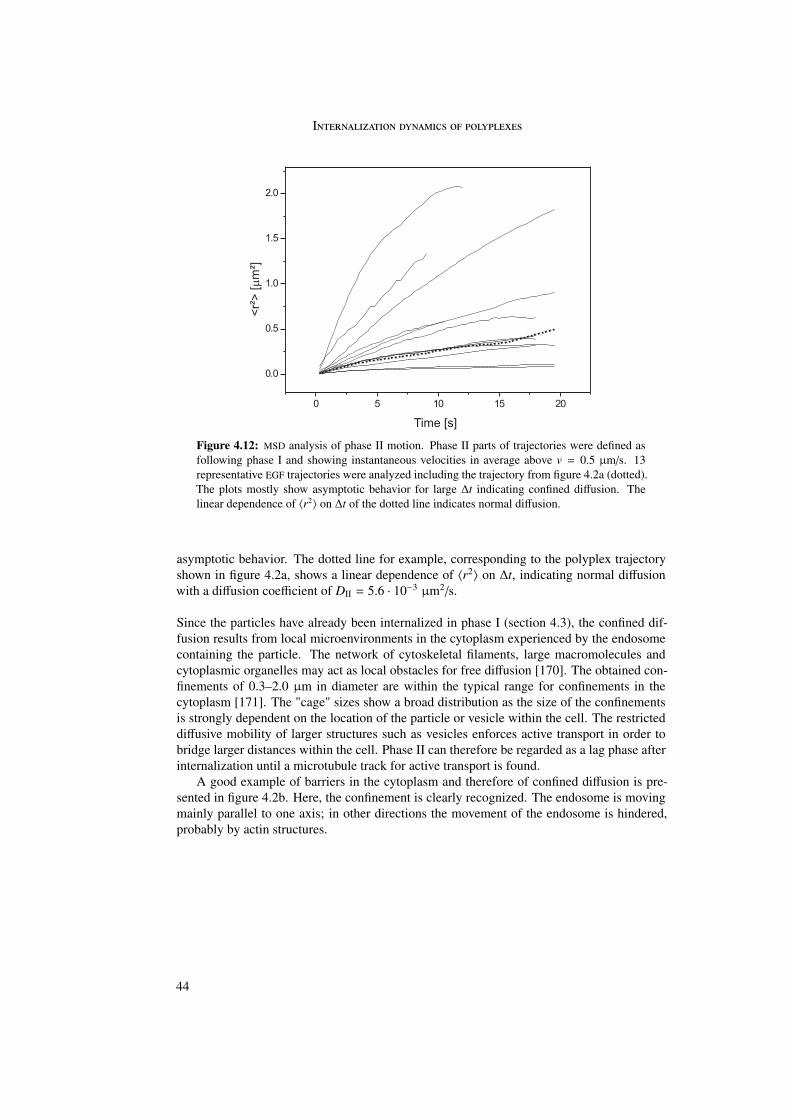
I
Figure 4.12: MSD analysis of phase II motion. Phase II parts of trajectories were defined asfollowing phase I and showing instantaneous velocities in average above v = 0.5 µm/s. 13representative EGF trajectories were analyzed including the trajectory from figure 4.2a (dotted).The plots mostly show asymptotic behavior for large ∆t indicating confined diffusion. Thelinear dependence of 〈r2〉 on ∆t of the dotted line indicates normal diffusion.
asymptotic behavior. The dotted line for example, corresponding to the polyplex trajectoryshown in figure 4.2a, shows a linear dependence of 〈r2〉 on ∆t, indicating normal diffusionwith a diffusion coefficient of DII = 5.6 · 10−3 µm2/s.
Since the particles have already been internalized in phase I (section 4.3), the confined dif-fusion results from local microenvironments in the cytoplasm experienced by the endosomecontaining the particle. The network of cytoskeletal filaments, large macromolecules andcytoplasmic organelles may act as local obstacles for free diffusion [170]. The obtained con-finements of 0.3–2.0 µm in diameter are within the typical range for confinements in thecytoplasm [171]. The "cage" sizes show a broad distribution as the size of the confinementsis strongly dependent on the location of the particle or vesicle within the cell. The restricteddiffusive mobility of larger structures such as vesicles enforces active transport in order tobridge larger distances within the cell. Phase II can therefore be regarded as a lag phase afterinternalization until a microtubule track for active transport is found.
A good example of barriers in the cytoplasm and therefore of confined diffusion is pre-sented in figure 4.2b. Here, the confinement is clearly recognized. The endosome is movingmainly parallel to one axis; in other directions the movement of the endosome is hindered,probably by actin structures.
44
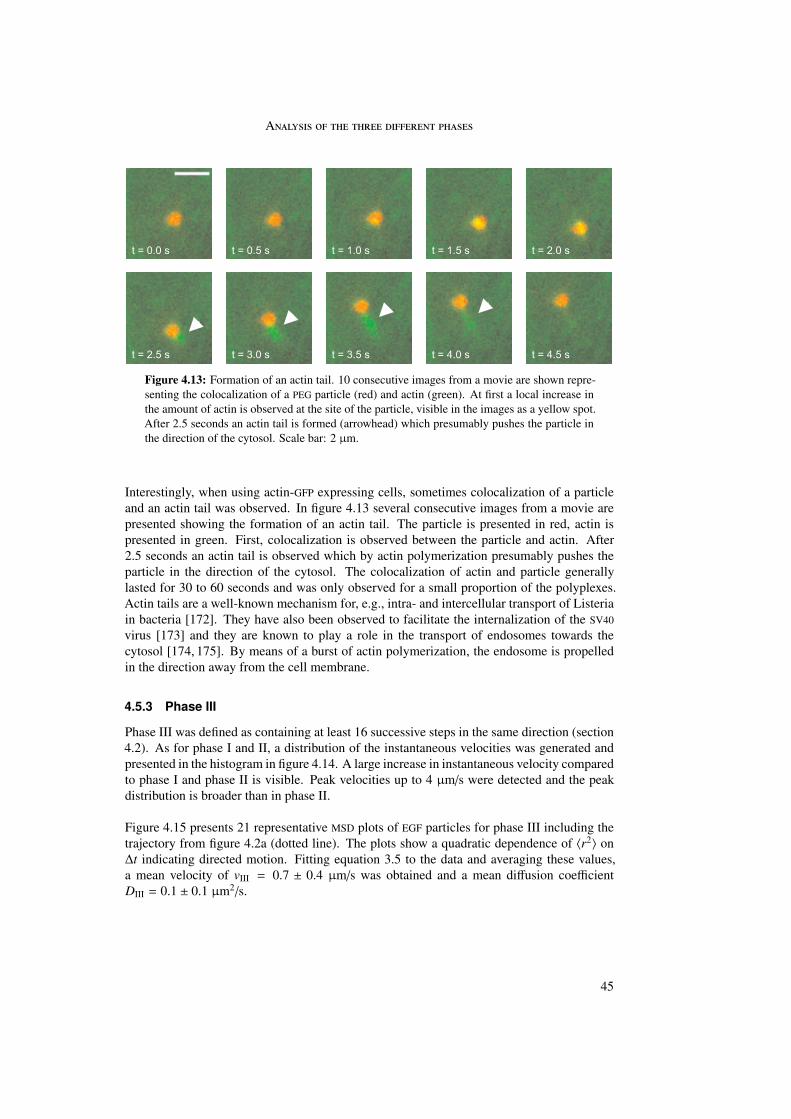
A
Figure 4.13: Formation of an actin tail. 10 consecutive images from a movie are shown repre-senting the colocalization of a PEG particle (red) and actin (green). At first a local increase inthe amount of actin is observed at the site of the particle, visible in the images as a yellow spot.After 2.5 seconds an actin tail is formed (arrowhead) which presumably pushes the particle inthe direction of the cytosol. Scale bar: 2 µm.
Interestingly, when using actin-GFP expressing cells, sometimes colocalization of a particleand an actin tail was observed. In figure 4.13 several consecutive images from a movie arepresented showing the formation of an actin tail. The particle is presented in red, actin ispresented in green. First, colocalization is observed between the particle and actin. After2.5 seconds an actin tail is observed which by actin polymerization presumably pushes theparticle in the direction of the cytosol. The colocalization of actin and particle generallylasted for 30 to 60 seconds and was only observed for a small proportion of the polyplexes.Actin tails are a well-known mechanism for, e.g., intra- and intercellular transport of Listeriain bacteria [172]. They have also been observed to facilitate the internalization of the SV40virus [173] and they are known to play a role in the transport of endosomes towards thecytosol [174, 175]. By means of a burst of actin polymerization, the endosome is propelledin the direction away from the cell membrane.
4.5.3 Phase III
Phase III was defined as containing at least 16 successive steps in the same direction (section4.2). As for phase I and II, a distribution of the instantaneous velocities was generated andpresented in the histogram in figure 4.14. A large increase in instantaneous velocity comparedto phase I and phase II is visible. Peak velocities up to 4 µm/s were detected and the peakdistribution is broader than in phase II.
Figure 4.15 presents 21 representative MSD plots of EGF particles for phase III including thetrajectory from figure 4.2a (dotted line). The plots show a quadratic dependence of 〈r2〉 on∆t indicating directed motion. Fitting equation 3.5 to the data and averaging these values,a mean velocity of vIII = 0.7 ± 0.4 µm/s was obtained and a mean diffusion coefficientDIII = 0.1 ± 0.1 µm2/s.
45
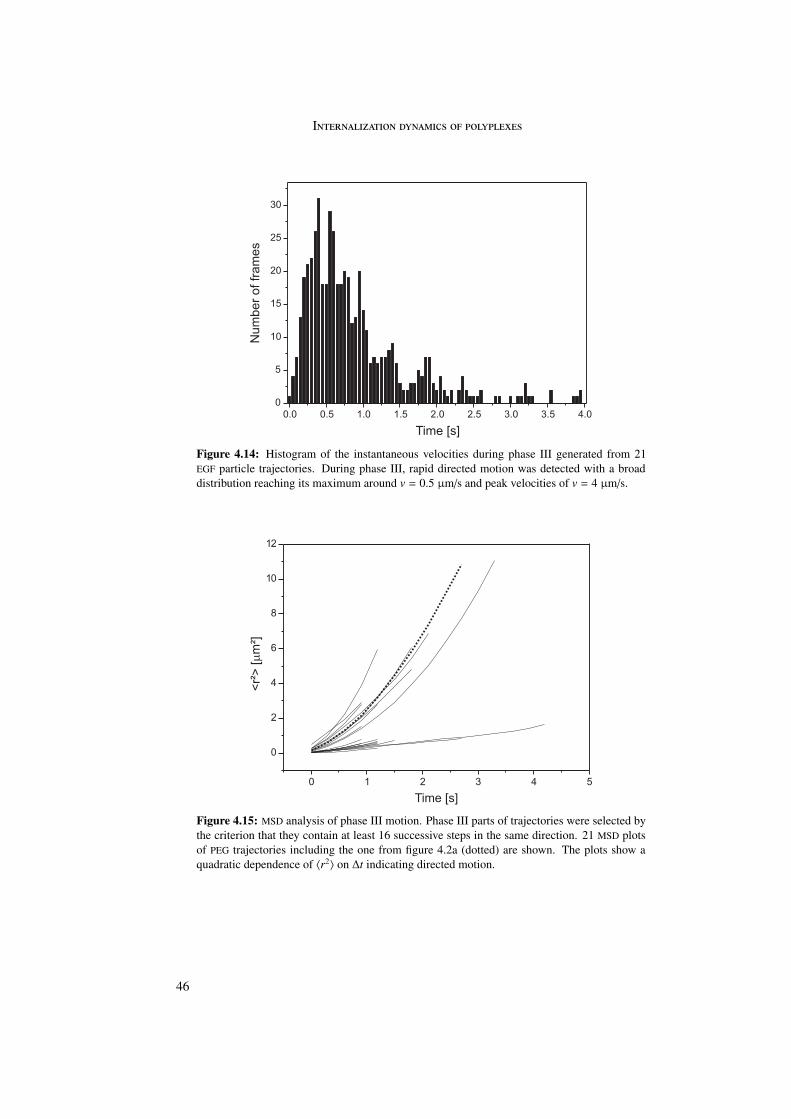
I
Figure 4.14: Histogram of the instantaneous velocities during phase III generated from 21EGF particle trajectories. During phase III, rapid directed motion was detected with a broaddistribution reaching its maximum around v = 0.5 µm/s and peak velocities of v = 4 µm/s.
Figure 4.15: MSD analysis of phase III motion. Phase III parts of trajectories were selected bythe criterion that they contain at least 16 successive steps in the same direction. 21 MSD plotsof PEG trajectories including the one from figure 4.2a (dotted) are shown. The plots show aquadratic dependence of 〈r2〉 on ∆t indicating directed motion.
46
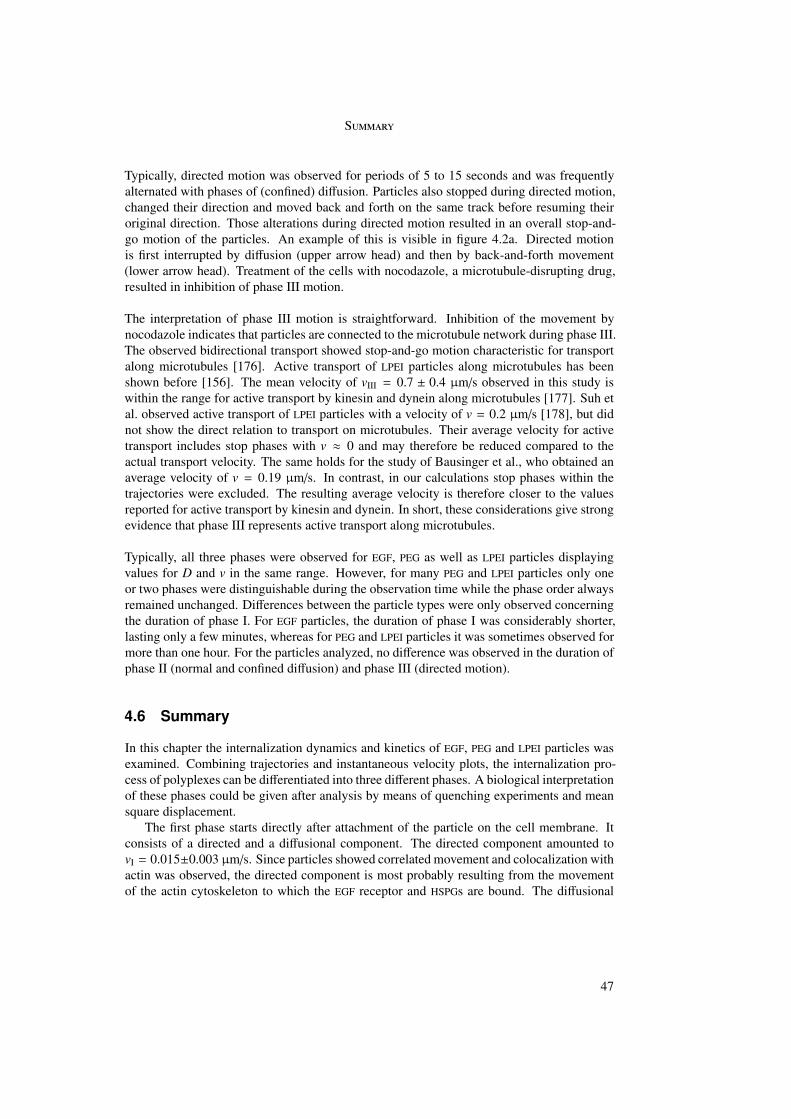
S
Typically, directed motion was observed for periods of 5 to 15 seconds and was frequentlyalternated with phases of (confined) diffusion. Particles also stopped during directed motion,changed their direction and moved back and forth on the same track before resuming theiroriginal direction. Those alterations during directed motion resulted in an overall stop-and-go motion of the particles. An example of this is visible in figure 4.2a. Directed motionis first interrupted by diffusion (upper arrow head) and then by back-and-forth movement(lower arrow head). Treatment of the cells with nocodazole, a microtubule-disrupting drug,resulted in inhibition of phase III motion.
The interpretation of phase III motion is straightforward. Inhibition of the movement bynocodazole indicates that particles are connected to the microtubule network during phase III.The observed bidirectional transport showed stop-and-go motion characteristic for transportalong microtubules [176]. Active transport of LPEI particles along microtubules has beenshown before [156]. The mean velocity of vIII = 0.7 ± 0.4 µm/s observed in this study iswithin the range for active transport by kinesin and dynein along microtubules [177]. Suh etal. observed active transport of LPEI particles with a velocity of v = 0.2 µm/s [178], but didnot show the direct relation to transport on microtubules. Their average velocity for activetransport includes stop phases with v ≈ 0 and may therefore be reduced compared to theactual transport velocity. The same holds for the study of Bausinger et al., who obtained anaverage velocity of v = 0.19 µm/s. In contrast, in our calculations stop phases within thetrajectories were excluded. The resulting average velocity is therefore closer to the valuesreported for active transport by kinesin and dynein. In short, these considerations give strongevidence that phase III represents active transport along microtubules.
Typically, all three phases were observed for EGF, PEG as well as LPEI particles displayingvalues for D and v in the same range. However, for many PEG and LPEI particles only oneor two phases were distinguishable during the observation time while the phase order alwaysremained unchanged. Differences between the particle types were only observed concerningthe duration of phase I. For EGF particles, the duration of phase I was considerably shorter,lasting only a few minutes, whereas for PEG and LPEI particles it was sometimes observed formore than one hour. For the particles analyzed, no difference was observed in the duration ofphase II (normal and confined diffusion) and phase III (directed motion).
4.6 Summary
In this chapter the internalization dynamics and kinetics of EGF, PEG and LPEI particles wasexamined. Combining trajectories and instantaneous velocity plots, the internalization pro-cess of polyplexes can be differentiated into three different phases. A biological interpretationof these phases could be given after analysis by means of quenching experiments and meansquare displacement.
The first phase starts directly after attachment of the particle on the cell membrane. Itconsists of a directed and a diffusional component. The directed component amounted tovI = 0.015±0.003 µm/s. Since particles showed correlated movement and colocalization withactin was observed, the directed component is most probably resulting from the movementof the actin cytoskeleton to which the EGF receptor and HSPGs are bound. The diffusional
47
I
component of DI = 4·10−4±4·10−4 µm2/s represents the motion of the receptor (EGFR in caseof EGF particles, HSPG for LPEI and probably PEG particles) on the cell surface. Quenchingexperiments showed that during phase I internalization occurs.
Phase II starts with an increase in instantaneous velocity which may represent the escapeof the particle from the cortical actin network. This phase is characterized by normal andlater confined diffusion within the cytosol. The diffusion is limited by local macromoleculesor proteins in the cytosol. The confinements showed sizes of 0.3–2.0 µm in diameter.
An abrupt increase in instantaneous velocity and clear directionality characterizes thebeginning of phase III. The directed motion is alternated with short stop phases, representingcharacteristic stop-and-go motion along microtubules. The directed motion during phase IIIhad a velocity of vIII = 0.7 ± 0.4 µm/s and was inhibited by addition of nocodazole.
A difference between the three particles was only observed in the duration of the first phase.EGF particles showed phase I movement for some minutes, for PEG and LPEI particles thisphase could take more than one hour. This is related to the difference in internalizationpercentages. The percentage of internalized EGF particles reached 50% within 5 minutes andmore than 90% within 10 minutes, whereas PEG and LPEI particles showed an extremely largespread but rarely more than 80% internalization, even after 80 minutes.
These results show that targeting of polyplexes by means of a ligand leads to faster and moreefficient internalization as compared to untargeted particles.
48
5. Photoinduced endosomal release ofpolyplexes
In the last chapter we have seen how polyplexes overcome the barrier of the cellular mem-brane. In this chapter we examine the next hurdle a vector encounters on its way to thenucleus: the escape from the endosome. As we have seen already, polyplexes are internal-ized by endocytosis and are therefore present in endosomes in the cell. Vectors that do notescape from the endosome end up in lysosomes. Since in lysosomes the DNA is degradedand is thus obviously not available for transcription in the nucleus, different techniques toinduce endosomal escape are under investigation. Examples to induce vector escape from en-dosomes are functionalized vectors with pH-sensitive peptides or polymers that destabilizethe endosomal membrane at the low pH prevailing in late endosomes [7]. For this technique,a change in vector synthesis is needed to implement the membrane-disrupting properties.
A vector-independent method developed by Berg et al. [179] employs photoactive com-pounds for disruption of endosomal membranes. The mechanism by which photoactivecompounds induce endosomal escape is described in detail in section 2.5.2. In short, thephotoactive compound binds to the cell membrane and is endocytosed together with thevector. Upon illumination with light of a defined wavelength, the photosensitizer becomesactivated and the cell membrane is damaged enabling escape of the vector. Studies usingfluorescent probes showed a change in distribution of the endosomal cargo within the cellbefore and after the activation of a photosensitizer and suggest successful endosomal dam-age and cargo release [179–181]. In addition, transfection studies with photoactive com-pounds showed enhancement in gene expression most probably due to improved release ofthe gene vector [17–19]. Photochemical release of gene vectors has also been implementedin vivo [181–183].
The detailed mechanism of endosomal release induced by photoactive compounds has not yetbeen unraveled. In this chapter, the endosomal release induced by activation of disulfonatedmeso-tetraphenylporphine with the sulfonate groups on adjacent phenyl rings (TPPS2a) is im-aged in real time using fluorescence microscopic methods. First the absorption and fluores-cence characteristics of TPPS2a are determined. This provides information on the photophys-ical processes of TPPS2a. Then, the visualization of endosomal release by means of micro-scopic methods is confirmed by the endosomal release of a fluorescent fluid phase marker,Alexa Fluor Dextran (AFD). Afterwards, the release of polyplexes is visualized.
Three different classes of polyplexes were examined. The first class consists of poly-ethyleneimine (LPEI) polyplexes. As described in section 2.5.1 LPEI polyplexes have a highbuffering ability that prevents trafficking to lysosomes. Therefore, no degradation of the parti-
49
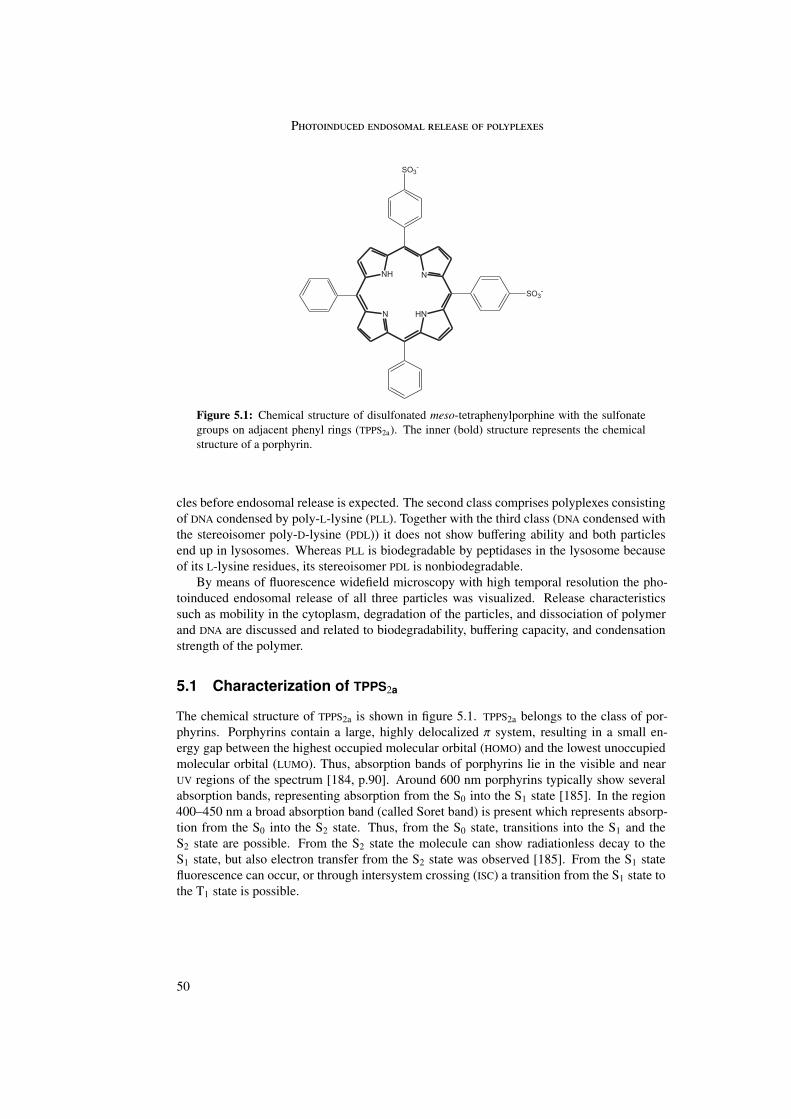
P
Figure 5.1: Chemical structure of disulfonated meso-tetraphenylporphine with the sulfonategroups on adjacent phenyl rings (TPPS2a). The inner (bold) structure represents the chemicalstructure of a porphyrin.
cles before endosomal release is expected. The second class comprises polyplexes consistingof DNA condensed by poly-L-lysine (PLL). Together with the third class (DNA condensed withthe stereoisomer poly-D-lysine (PDL)) it does not show buffering ability and both particlesend up in lysosomes. Whereas PLL is biodegradable by peptidases in the lysosome becauseof its L-lysine residues, its stereoisomer PDL is nonbiodegradable.
By means of fluorescence widefield microscopy with high temporal resolution the pho-toinduced endosomal release of all three particles was visualized. Release characteristicssuch as mobility in the cytoplasm, degradation of the particles, and dissociation of polymerand DNA are discussed and related to biodegradability, buffering capacity, and condensationstrength of the polymer.
5.1 Characterization of TPPS2a
The chemical structure of TPPS2a is shown in figure 5.1. TPPS2a belongs to the class of por-phyrins. Porphyrins contain a large, highly delocalized π system, resulting in a small en-ergy gap between the highest occupied molecular orbital (HOMO) and the lowest unoccupiedmolecular orbital (LUMO). Thus, absorption bands of porphyrins lie in the visible and nearUV regions of the spectrum [184, p.90]. Around 600 nm porphyrins typically show severalabsorption bands, representing absorption from the S0 into the S1 state [185]. In the region400–450 nm a broad absorption band (called Soret band) is present which represents absorp-tion from the S0 into the S2 state. Thus, from the S0 state, transitions into the S1 and theS2 state are possible. From the S2 state the molecule can show radiationless decay to theS1 state, but also electron transfer from the S2 state was observed [185]. From the S1 statefluorescence can occur, or through intersystem crossing (ISC) a transition from the S1 state tothe T1 state is possible.
50
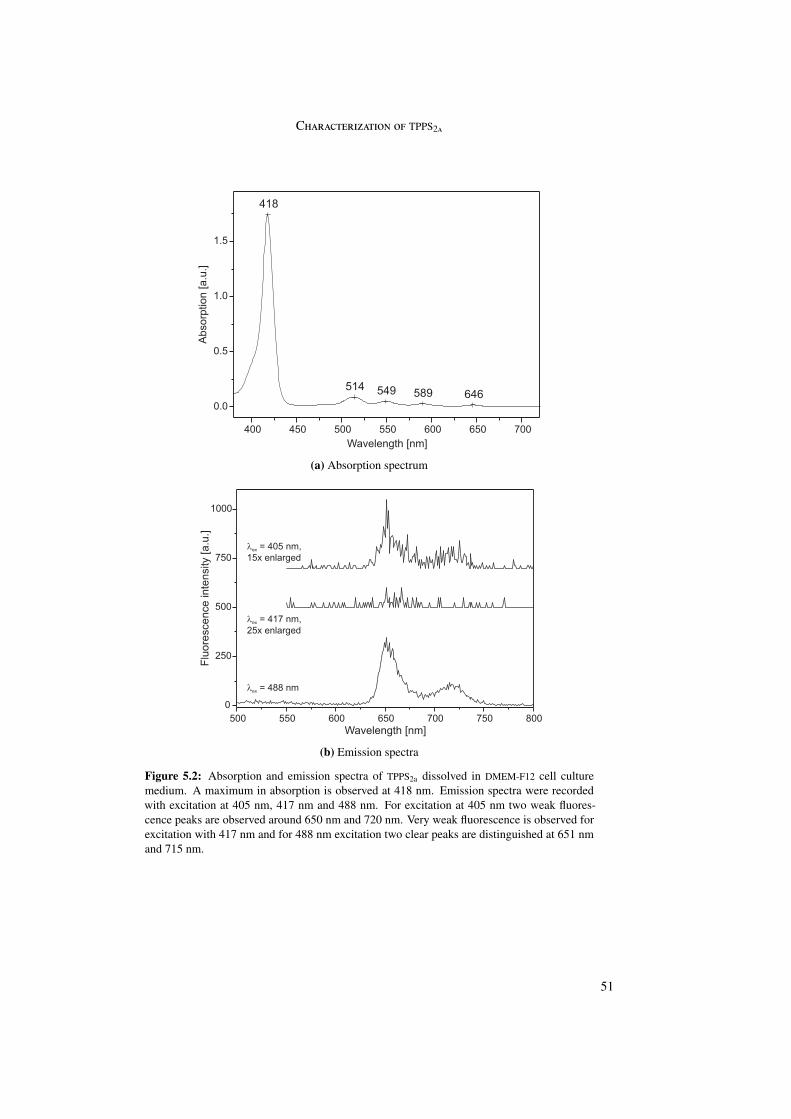
C TPPS2
(a) Absorption spectrum
(b) Emission spectra
Figure 5.2: Absorption and emission spectra of TPPS2a dissolved in DMEM-F12 cell culturemedium. A maximum in absorption is observed at 418 nm. Emission spectra were recordedwith excitation at 405 nm, 417 nm and 488 nm. For excitation at 405 nm two weak fluores-cence peaks are observed around 650 nm and 720 nm. Very weak fluorescence is observed forexcitation with 417 nm and for 488 nm excitation two clear peaks are distinguished at 651 nmand 715 nm.
51
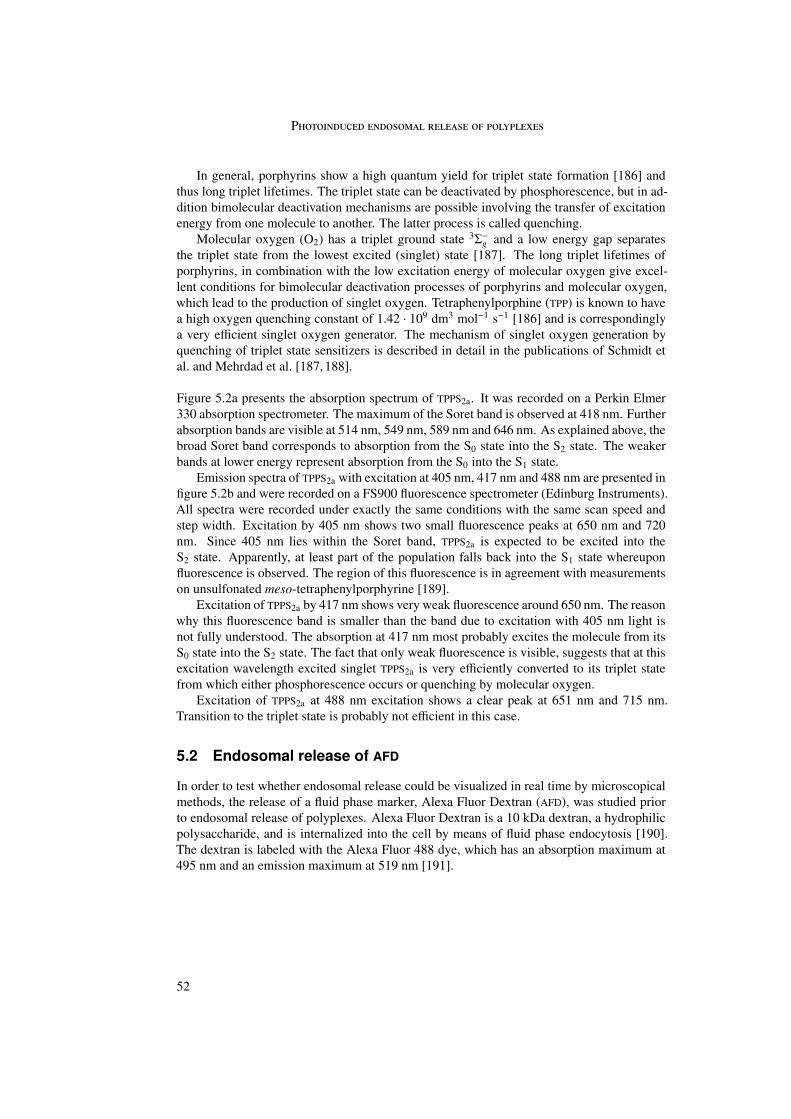
P
In general, porphyrins show a high quantum yield for triplet state formation [186] andthus long triplet lifetimes. The triplet state can be deactivated by phosphorescence, but in ad-dition bimolecular deactivation mechanisms are possible involving the transfer of excitationenergy from one molecule to another. The latter process is called quenching.
Molecular oxygen (O2) has a triplet ground state 3Σ−g and a low energy gap separatesthe triplet state from the lowest excited (singlet) state [187]. The long triplet lifetimes ofporphyrins, in combination with the low excitation energy of molecular oxygen give excel-lent conditions for bimolecular deactivation processes of porphyrins and molecular oxygen,which lead to the production of singlet oxygen. Tetraphenylporphine (TPP) is known to havea high oxygen quenching constant of 1.42 · 109 dm3 mol−1 s−1 [186] and is correspondinglya very efficient singlet oxygen generator. The mechanism of singlet oxygen generation byquenching of triplet state sensitizers is described in detail in the publications of Schmidt etal. and Mehrdad et al. [187, 188].
Figure 5.2a presents the absorption spectrum of TPPS2a. It was recorded on a Perkin Elmer330 absorption spectrometer. The maximum of the Soret band is observed at 418 nm. Furtherabsorption bands are visible at 514 nm, 549 nm, 589 nm and 646 nm. As explained above, thebroad Soret band corresponds to absorption from the S0 state into the S2 state. The weakerbands at lower energy represent absorption from the S0 into the S1 state.
Emission spectra of TPPS2a with excitation at 405 nm, 417 nm and 488 nm are presented infigure 5.2b and were recorded on a FS900 fluorescence spectrometer (Edinburg Instruments).All spectra were recorded under exactly the same conditions with the same scan speed andstep width. Excitation by 405 nm shows two small fluorescence peaks at 650 nm and 720nm. Since 405 nm lies within the Soret band, TPPS2a is expected to be excited into theS2 state. Apparently, at least part of the population falls back into the S1 state whereuponfluorescence is observed. The region of this fluorescence is in agreement with measurementson unsulfonated meso-tetraphenylporphyrine [189].
Excitation of TPPS2a by 417 nm shows very weak fluorescence around 650 nm. The reasonwhy this fluorescence band is smaller than the band due to excitation with 405 nm light isnot fully understood. The absorption at 417 nm most probably excites the molecule from itsS0 state into the S2 state. The fact that only weak fluorescence is visible, suggests that at thisexcitation wavelength excited singlet TPPS2a is very efficiently converted to its triplet statefrom which either phosphorescence occurs or quenching by molecular oxygen.
Excitation of TPPS2a at 488 nm excitation shows a clear peak at 651 nm and 715 nm.Transition to the triplet state is probably not efficient in this case.
5.2 Endosomal release of AFD
In order to test whether endosomal release could be visualized in real time by microscopicalmethods, the release of a fluid phase marker, Alexa Fluor Dextran (AFD), was studied priorto endosomal release of polyplexes. Alexa Fluor Dextran is a 10 kDa dextran, a hydrophilicpolysaccharide, and is internalized into the cell by means of fluid phase endocytosis [190].The dextran is labeled with the Alexa Fluor 488 dye, which has an absorption maximum at495 nm and an emission maximum at 519 nm [191].
52
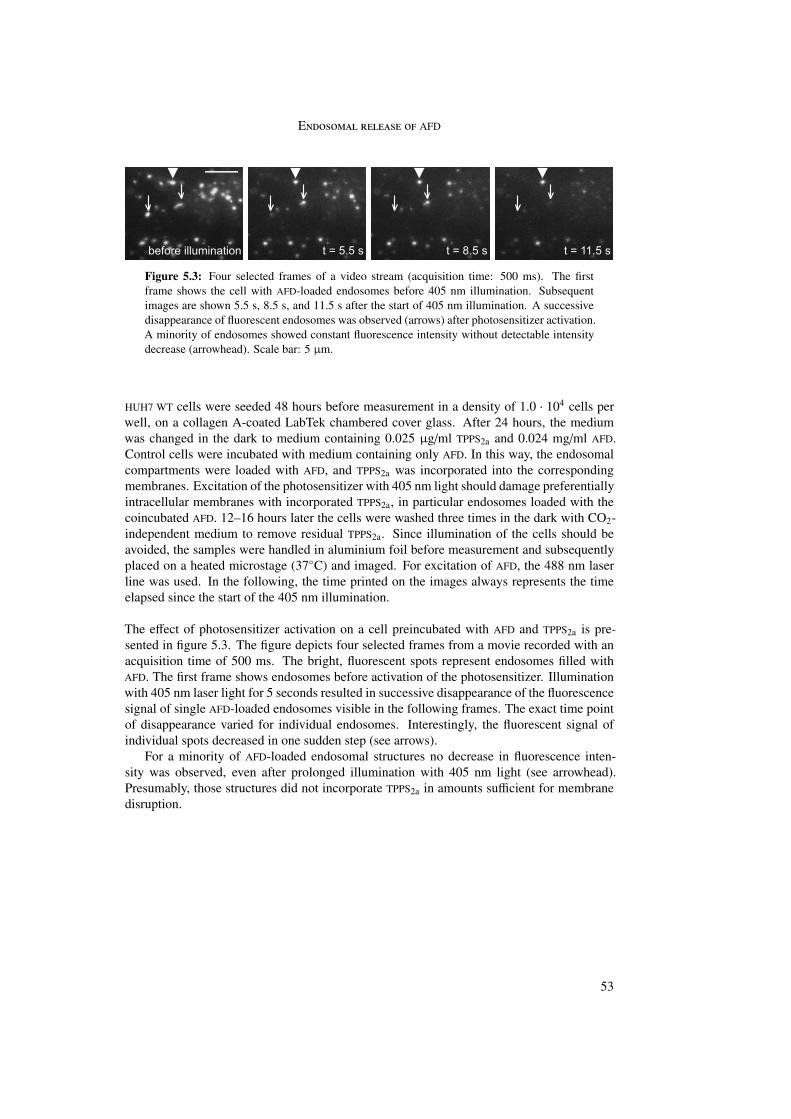
E AFD
Figure 5.3: Four selected frames of a video stream (acquisition time: 500 ms). The firstframe shows the cell with AFD-loaded endosomes before 405 nm illumination. Subsequentimages are shown 5.5 s, 8.5 s, and 11.5 s after the start of 405 nm illumination. A successivedisappearance of fluorescent endosomes was observed (arrows) after photosensitizer activation.A minority of endosomes showed constant fluorescence intensity without detectable intensitydecrease (arrowhead). Scale bar: 5 µm.
HUH7 WT cells were seeded 48 hours before measurement in a density of 1.0 · 104 cells perwell, on a collagen A-coated LabTek chambered cover glass. After 24 hours, the mediumwas changed in the dark to medium containing 0.025 µg/ml TPPS2a and 0.024 mg/ml AFD.Control cells were incubated with medium containing only AFD. In this way, the endosomalcompartments were loaded with AFD, and TPPS2a was incorporated into the correspondingmembranes. Excitation of the photosensitizer with 405 nm light should damage preferentiallyintracellular membranes with incorporated TPPS2a, in particular endosomes loaded with thecoincubated AFD. 12–16 hours later the cells were washed three times in the dark with CO2-independent medium to remove residual TPPS2a. Since illumination of the cells should beavoided, the samples were handled in aluminium foil before measurement and subsequentlyplaced on a heated microstage (37◦C) and imaged. For excitation of AFD, the 488 nm laserline was used. In the following, the time printed on the images always represents the timeelapsed since the start of the 405 nm illumination.
The effect of photosensitizer activation on a cell preincubated with AFD and TPPS2a is pre-sented in figure 5.3. The figure depicts four selected frames from a movie recorded with anacquisition time of 500 ms. The bright, fluorescent spots represent endosomes filled withAFD. The first frame shows endosomes before activation of the photosensitizer. Illuminationwith 405 nm laser light for 5 seconds resulted in successive disappearance of the fluorescencesignal of single AFD-loaded endosomes visible in the following frames. The exact time pointof disappearance varied for individual endosomes. Interestingly, the fluorescent signal ofindividual spots decreased in one sudden step (see arrows).
For a minority of AFD-loaded endosomal structures no decrease in fluorescence inten-sity was observed, even after prolonged illumination with 405 nm light (see arrowhead).Presumably, those structures did not incorporate TPPS2a in amounts sufficient for membranedisruption.
53
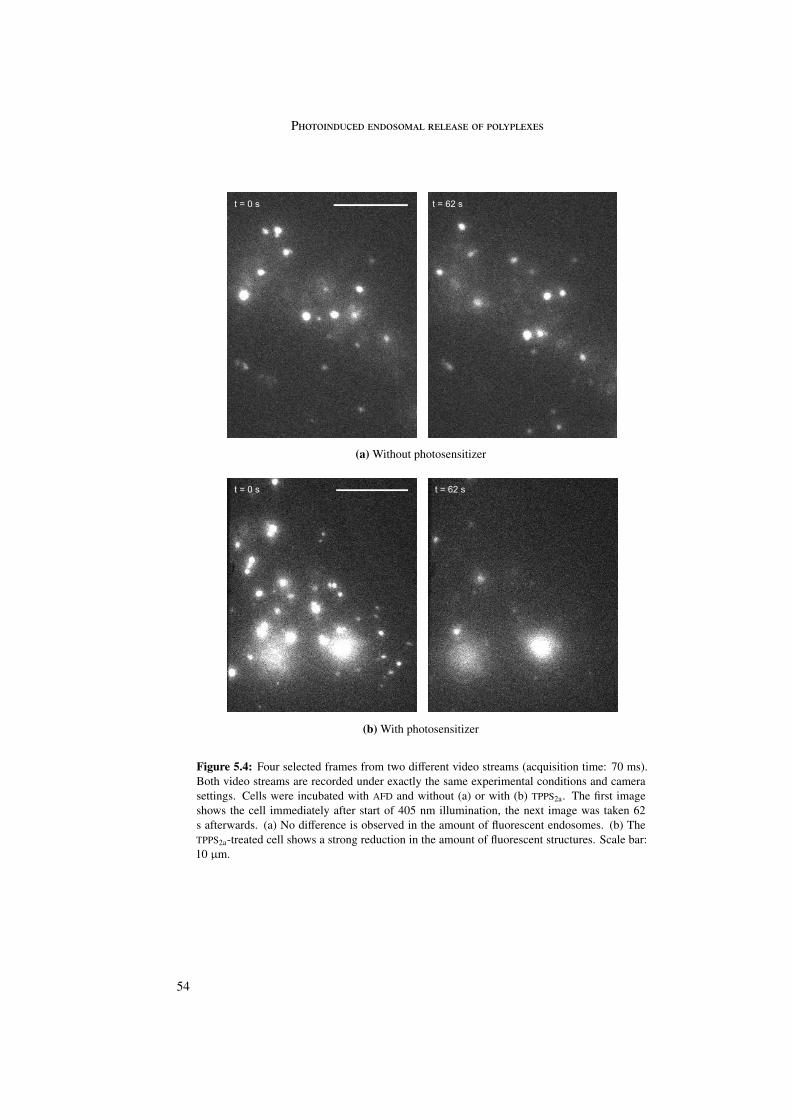
P
(a) Without photosensitizer
(b) With photosensitizer
Figure 5.4: Four selected frames from two different video streams (acquisition time: 70 ms).Both video streams are recorded under exactly the same experimental conditions and camerasettings. Cells were incubated with AFD and without (a) or with (b) TPPS2a. The first imageshows the cell immediately after start of 405 nm illumination, the next image was taken 62s afterwards. (a) No difference is observed in the amount of fluorescent endosomes. (b) TheTPPS2a-treated cell shows a strong reduction in the amount of fluorescent structures. Scale bar:10 µm.
54
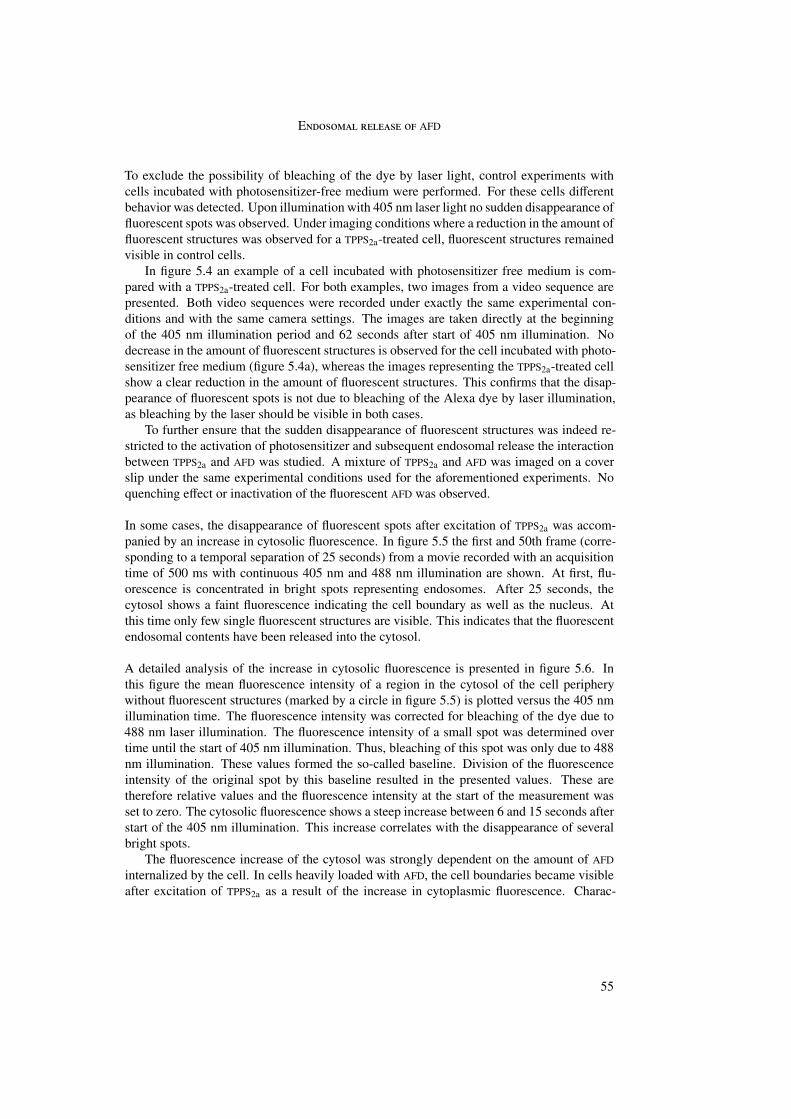
E AFD
To exclude the possibility of bleaching of the dye by laser light, control experiments withcells incubated with photosensitizer-free medium were performed. For these cells differentbehavior was detected. Upon illumination with 405 nm laser light no sudden disappearance offluorescent spots was observed. Under imaging conditions where a reduction in the amount offluorescent structures was observed for a TPPS2a-treated cell, fluorescent structures remainedvisible in control cells.
In figure 5.4 an example of a cell incubated with photosensitizer free medium is com-pared with a TPPS2a-treated cell. For both examples, two images from a video sequence arepresented. Both video sequences were recorded under exactly the same experimental con-ditions and with the same camera settings. The images are taken directly at the beginningof the 405 nm illumination period and 62 seconds after start of 405 nm illumination. Nodecrease in the amount of fluorescent structures is observed for the cell incubated with photo-sensitizer free medium (figure 5.4a), whereas the images representing the TPPS2a-treated cellshow a clear reduction in the amount of fluorescent structures. This confirms that the disap-pearance of fluorescent spots is not due to bleaching of the Alexa dye by laser illumination,as bleaching by the laser should be visible in both cases.
To further ensure that the sudden disappearance of fluorescent structures was indeed re-stricted to the activation of photosensitizer and subsequent endosomal release the interactionbetween TPPS2a and AFD was studied. A mixture of TPPS2a and AFD was imaged on a coverslip under the same experimental conditions used for the aforementioned experiments. Noquenching effect or inactivation of the fluorescent AFD was observed.
In some cases, the disappearance of fluorescent spots after excitation of TPPS2a was accom-panied by an increase in cytosolic fluorescence. In figure 5.5 the first and 50th frame (corre-sponding to a temporal separation of 25 seconds) from a movie recorded with an acquisitiontime of 500 ms with continuous 405 nm and 488 nm illumination are shown. At first, flu-orescence is concentrated in bright spots representing endosomes. After 25 seconds, thecytosol shows a faint fluorescence indicating the cell boundary as well as the nucleus. Atthis time only few single fluorescent structures are visible. This indicates that the fluorescentendosomal contents have been released into the cytosol.
A detailed analysis of the increase in cytosolic fluorescence is presented in figure 5.6. Inthis figure the mean fluorescence intensity of a region in the cytosol of the cell peripherywithout fluorescent structures (marked by a circle in figure 5.5) is plotted versus the 405 nmillumination time. The fluorescence intensity was corrected for bleaching of the dye due to488 nm laser illumination. The fluorescence intensity of a small spot was determined overtime until the start of 405 nm illumination. Thus, bleaching of this spot was only due to 488nm illumination. These values formed the so-called baseline. Division of the fluorescenceintensity of the original spot by this baseline resulted in the presented values. These aretherefore relative values and the fluorescence intensity at the start of the measurement wasset to zero. The cytosolic fluorescence shows a steep increase between 6 and 15 seconds afterstart of the 405 nm illumination. This increase correlates with the disappearance of severalbright spots.
The fluorescence increase of the cytosol was strongly dependent on the amount of AFDinternalized by the cell. In cells heavily loaded with AFD, the cell boundaries became visibleafter excitation of TPPS2a as a result of the increase in cytoplasmic fluorescence. Charac-
55
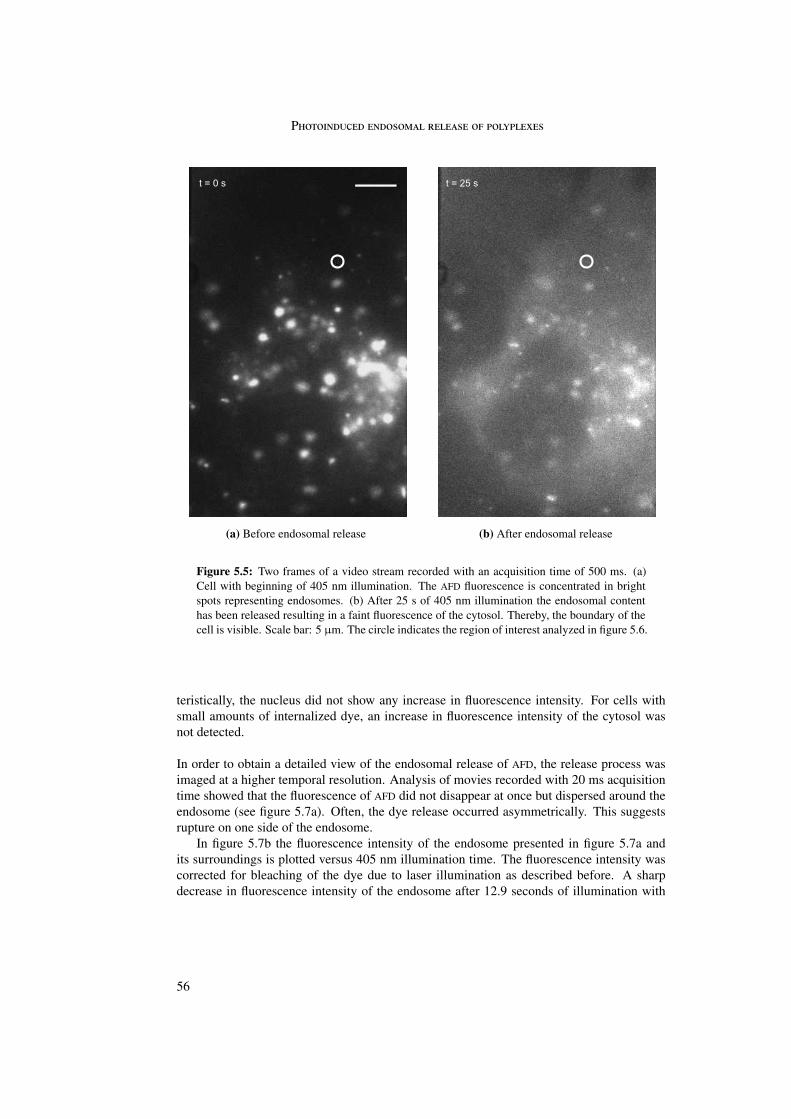
P
(a) Before endosomal release (b) After endosomal release
Figure 5.5: Two frames of a video stream recorded with an acquisition time of 500 ms. (a)Cell with beginning of 405 nm illumination. The AFD fluorescence is concentrated in brightspots representing endosomes. (b) After 25 s of 405 nm illumination the endosomal contenthas been released resulting in a faint fluorescence of the cytosol. Thereby, the boundary of thecell is visible. Scale bar: 5 µm. The circle indicates the region of interest analyzed in figure 5.6.
teristically, the nucleus did not show any increase in fluorescence intensity. For cells withsmall amounts of internalized dye, an increase in fluorescence intensity of the cytosol wasnot detected.
In order to obtain a detailed view of the endosomal release of AFD, the release process wasimaged at a higher temporal resolution. Analysis of movies recorded with 20 ms acquisitiontime showed that the fluorescence of AFD did not disappear at once but dispersed around theendosome (see figure 5.7a). Often, the dye release occurred asymmetrically. This suggestsrupture on one side of the endosome.
In figure 5.7b the fluorescence intensity of the endosome presented in figure 5.7a andits surroundings is plotted versus 405 nm illumination time. The fluorescence intensity wascorrected for bleaching of the dye due to laser illumination as described before. A sharpdecrease in fluorescence intensity of the endosome after 12.9 seconds of illumination with
56
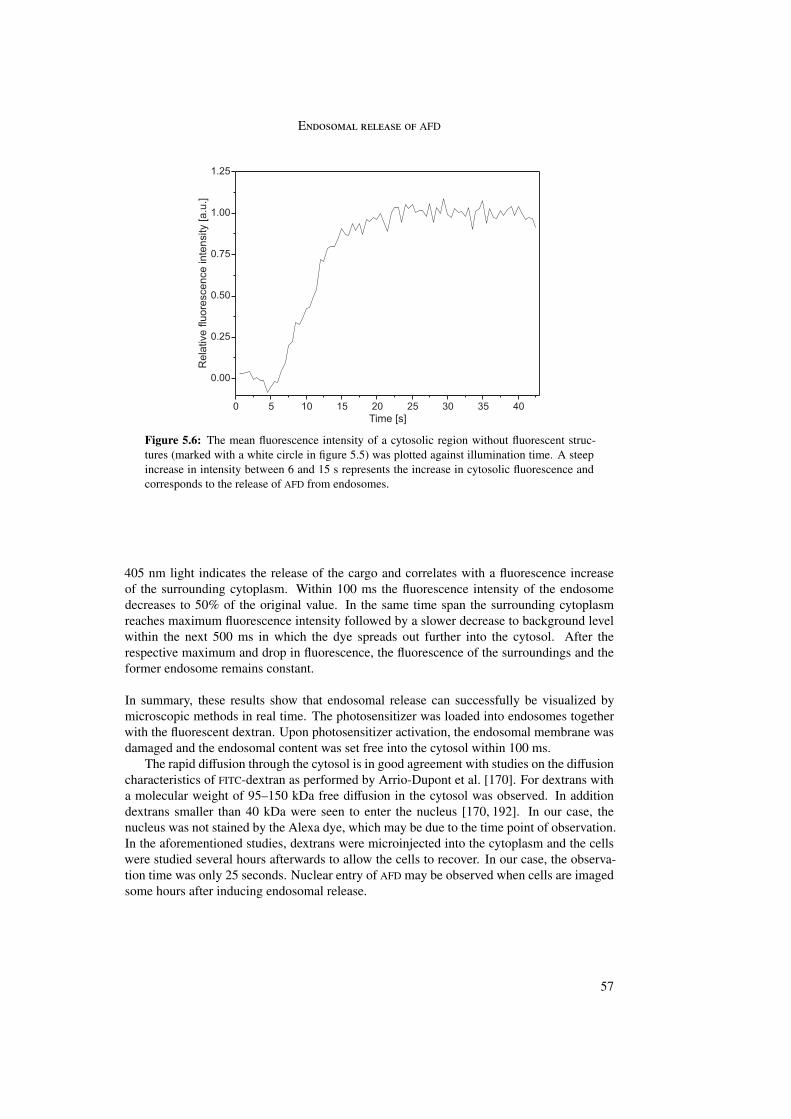
E AFD
Figure 5.6: The mean fluorescence intensity of a cytosolic region without fluorescent struc-tures (marked with a white circle in figure 5.5) was plotted against illumination time. A steepincrease in intensity between 6 and 15 s represents the increase in cytosolic fluorescence andcorresponds to the release of AFD from endosomes.
405 nm light indicates the release of the cargo and correlates with a fluorescence increaseof the surrounding cytoplasm. Within 100 ms the fluorescence intensity of the endosomedecreases to 50% of the original value. In the same time span the surrounding cytoplasmreaches maximum fluorescence intensity followed by a slower decrease to background levelwithin the next 500 ms in which the dye spreads out further into the cytosol. After therespective maximum and drop in fluorescence, the fluorescence of the surroundings and theformer endosome remains constant.
In summary, these results show that endosomal release can successfully be visualized bymicroscopic methods in real time. The photosensitizer was loaded into endosomes togetherwith the fluorescent dextran. Upon photosensitizer activation, the endosomal membrane wasdamaged and the endosomal content was set free into the cytosol within 100 ms.
The rapid diffusion through the cytosol is in good agreement with studies on the diffusioncharacteristics of FITC-dextran as performed by Arrio-Dupont et al. [170]. For dextrans witha molecular weight of 95–150 kDa free diffusion in the cytosol was observed. In additiondextrans smaller than 40 kDa were seen to enter the nucleus [170, 192]. In our case, thenucleus was not stained by the Alexa dye, which may be due to the time point of observation.In the aforementioned studies, dextrans were microinjected into the cytoplasm and the cellswere studied several hours afterwards to allow the cells to recover. In our case, the observa-tion time was only 25 seconds. Nuclear entry of AFD may be observed when cells are imagedsome hours after inducing endosomal release.
57
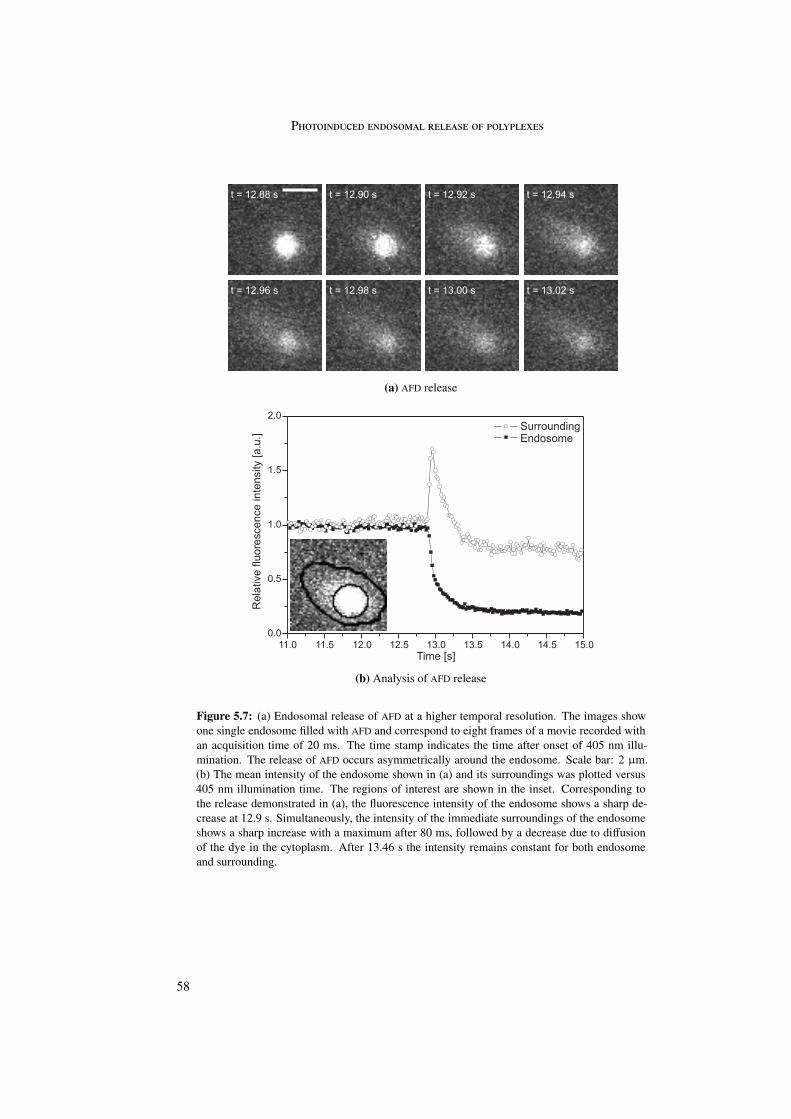
P
(a) AFD release
(b) Analysis of AFD release
Figure 5.7: (a) Endosomal release of AFD at a higher temporal resolution. The images showone single endosome filled with AFD and correspond to eight frames of a movie recorded withan acquisition time of 20 ms. The time stamp indicates the time after onset of 405 nm illu-mination. The release of AFD occurs asymmetrically around the endosome. Scale bar: 2 µm.(b) The mean intensity of the endosome shown in (a) and its surroundings was plotted versus405 nm illumination time. The regions of interest are shown in the inset. Corresponding tothe release demonstrated in (a), the fluorescence intensity of the endosome shows a sharp de-crease at 12.9 s. Simultaneously, the intensity of the immediate surroundings of the endosomeshows a sharp increase with a maximum after 80 ms, followed by a decrease due to diffusionof the dye in the cytoplasm. After 13.46 s the intensity remains constant for both endosomeand surrounding.
58
E
5.3 Endosomal release of polyplexes
After ensuring visualization of photoinduced endosomal release of AFD, the release dynamicsof polyplexes was investigated. Since LPEI, PLL and PDL polyplexes differ in their endosomalbuffering capacity, biodegradability and their binding strength to DNA, they are expected toshow distinct release dynamics.
LPEI is a nonbiodegradable polymer with protonatable amino groups with a pKa in therange of 4 to 7. As we have seen in section 2.5.1 this characteristic leads to buffering ofendosomes such that lysosomal enzymes remain inactive and degradation of the gene vectoris impeded.
The cationic polymer PLL does not show the buffering ability as seen for LPEI [45, 193].After endocytosis, endosomes containing PLL particles show a decrease in pH and maturationto lysosomes takes place [193]. PLL is biodegradable because of its L-amino acid lysine.Therefore, in principle peptidases and proteases in the lysosomes are able to degrade PLL andconsequently DNases are able to degrade DNA. However, studies with DNase I have shown thatthe strong condensation of DNA by PLL protects polyplexes against degradation [194].
Like PLL, the D-amino acid stereoisomer PDL does not possess buffering abilities. Theintracellular pathway of PDL particles is therefore similar to that of PLL particles. In contrastto PLL, PDL is nonbiodegradable, because of the D-amino acid residues. Nevertheless, thischaracteristic does not influence the capability to protect DNA from enzymatic degradation[195].
In order to image both components of the polymer/DNA particles simultaneously, the cationicpolymer was covalently labeled with Alexa Fluor 488 succinimidyl ester (A488) and DNAwith cy5. The labeled particles were purified to exclude free dye and polymer (see section3.1.7). HUH7 WT cells were seeded 48 hours before measurement in a density of 1.0 ·104 cellsper well, on a collagen A-coated LabTek chambered cover glass. After 24 hours, the mediumwas changed in the dark to medium containing 0.025 µg/ml TPPS2a and 0.1–1.0 µg/ml DNA de-pending on the polymer. Control cells were incubated with medium containing only DNA. 12–16 hours later the cells were washed in the dark three times with CO2-independent medium toremove residual TPPS2a and subsequently placed on a heated microstage (37◦C) and imaged.Since illumination of the cells should be avoided, the samples were handled in aluminium foilbefore measurement. The focal plane of the microscope was found by weak excitation of thecy5-labeled DNA at 647 nm, since the photosensitizer was least activated at this wavelength.
The 12–16 hours incubation of polyplexes and photosensitizer differs from earlier pub-lished procedures [19]. In earlier publications cells were incubated overnight with photosen-sitizer only prior to incubation with polyplexes for 4 hours in photosensitizer free medium.The simultaneous, long incubation of polyplexes and photosensitizer as described above waschosen to ensure that particles and photosensitizer were in the same cellular compartmentwhen observed under the microscope. To exclude adverse effects of this long incubationin photosensitizer-containing medium on the transfection ability of polyplexes, transfectionexperiments were carried out by Carolin Fella (Prof. E. Wagner, LMU, Munich) using bothprocedures. Comparing the long overnight incubation of particles with the 4-hour incubationon the following day, a higher transfection efficiency was observed for particles incubatedovernight. This indicates that the transfection ability of polyplexes is not impaired by longerincubation times used for the microscopical observations.
59
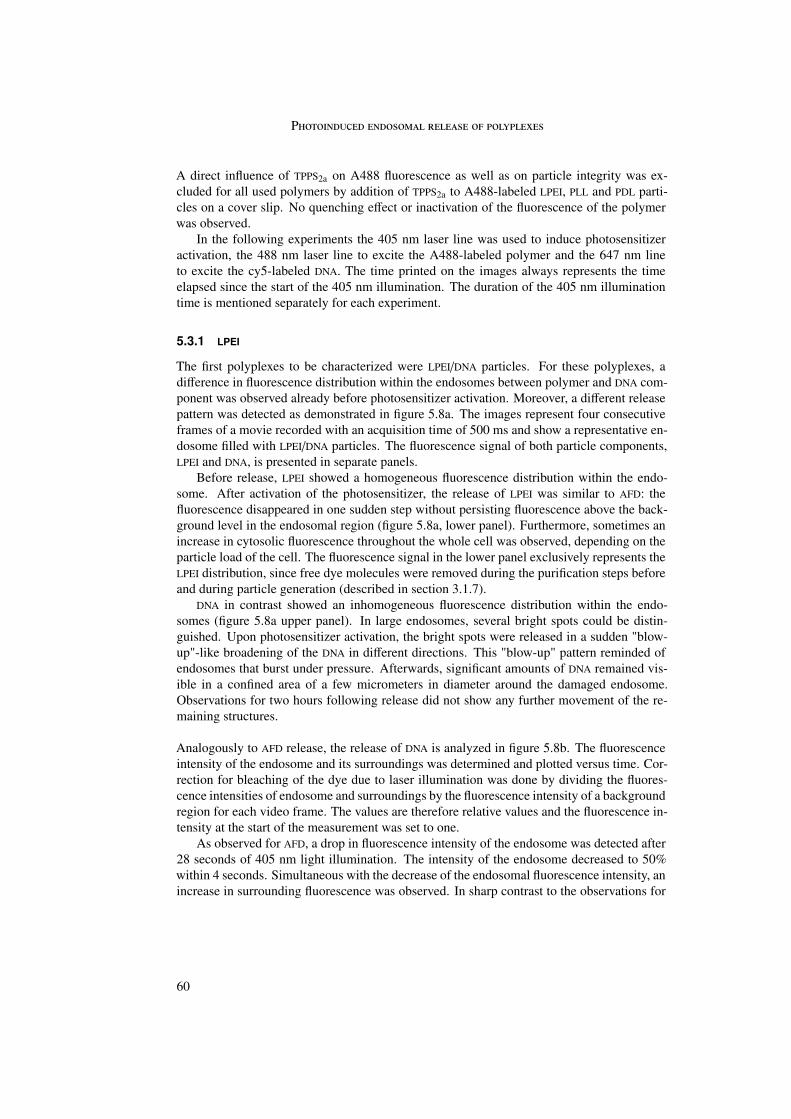
P
A direct influence of TPPS2a on A488 fluorescence as well as on particle integrity was ex-cluded for all used polymers by addition of TPPS2a to A488-labeled LPEI, PLL and PDL parti-cles on a cover slip. No quenching effect or inactivation of the fluorescence of the polymerwas observed.
In the following experiments the 405 nm laser line was used to induce photosensitizeractivation, the 488 nm laser line to excite the A488-labeled polymer and the 647 nm lineto excite the cy5-labeled DNA. The time printed on the images always represents the timeelapsed since the start of the 405 nm illumination. The duration of the 405 nm illuminationtime is mentioned separately for each experiment.
5.3.1 LPEI
The first polyplexes to be characterized were LPEI/DNA particles. For these polyplexes, adifference in fluorescence distribution within the endosomes between polymer and DNA com-ponent was observed already before photosensitizer activation. Moreover, a different releasepattern was detected as demonstrated in figure 5.8a. The images represent four consecutiveframes of a movie recorded with an acquisition time of 500 ms and show a representative en-dosome filled with LPEI/DNA particles. The fluorescence signal of both particle components,LPEI and DNA, is presented in separate panels.
Before release, LPEI showed a homogeneous fluorescence distribution within the endo-some. After activation of the photosensitizer, the release of LPEI was similar to AFD: thefluorescence disappeared in one sudden step without persisting fluorescence above the back-ground level in the endosomal region (figure 5.8a, lower panel). Furthermore, sometimes anincrease in cytosolic fluorescence throughout the whole cell was observed, depending on theparticle load of the cell. The fluorescence signal in the lower panel exclusively represents theLPEI distribution, since free dye molecules were removed during the purification steps beforeand during particle generation (described in section 3.1.7).
DNA in contrast showed an inhomogeneous fluorescence distribution within the endo-somes (figure 5.8a upper panel). In large endosomes, several bright spots could be distin-guished. Upon photosensitizer activation, the bright spots were released in a sudden "blow-up"-like broadening of the DNA in different directions. This "blow-up" pattern reminded ofendosomes that burst under pressure. Afterwards, significant amounts of DNA remained vis-ible in a confined area of a few micrometers in diameter around the damaged endosome.Observations for two hours following release did not show any further movement of the re-maining structures.
Analogously to AFD release, the release of DNA is analyzed in figure 5.8b. The fluorescenceintensity of the endosome and its surroundings was determined and plotted versus time. Cor-rection for bleaching of the dye due to laser illumination was done by dividing the fluores-cence intensities of endosome and surroundings by the fluorescence intensity of a backgroundregion for each video frame. The values are therefore relative values and the fluorescence in-tensity at the start of the measurement was set to one.
As observed for AFD, a drop in fluorescence intensity of the endosome was detected after28 seconds of 405 nm light illumination. The intensity of the endosome decreased to 50%within 4 seconds. Simultaneous with the decrease of the endosomal fluorescence intensity, anincrease in surrounding fluorescence was observed. In sharp contrast to the observations for
60
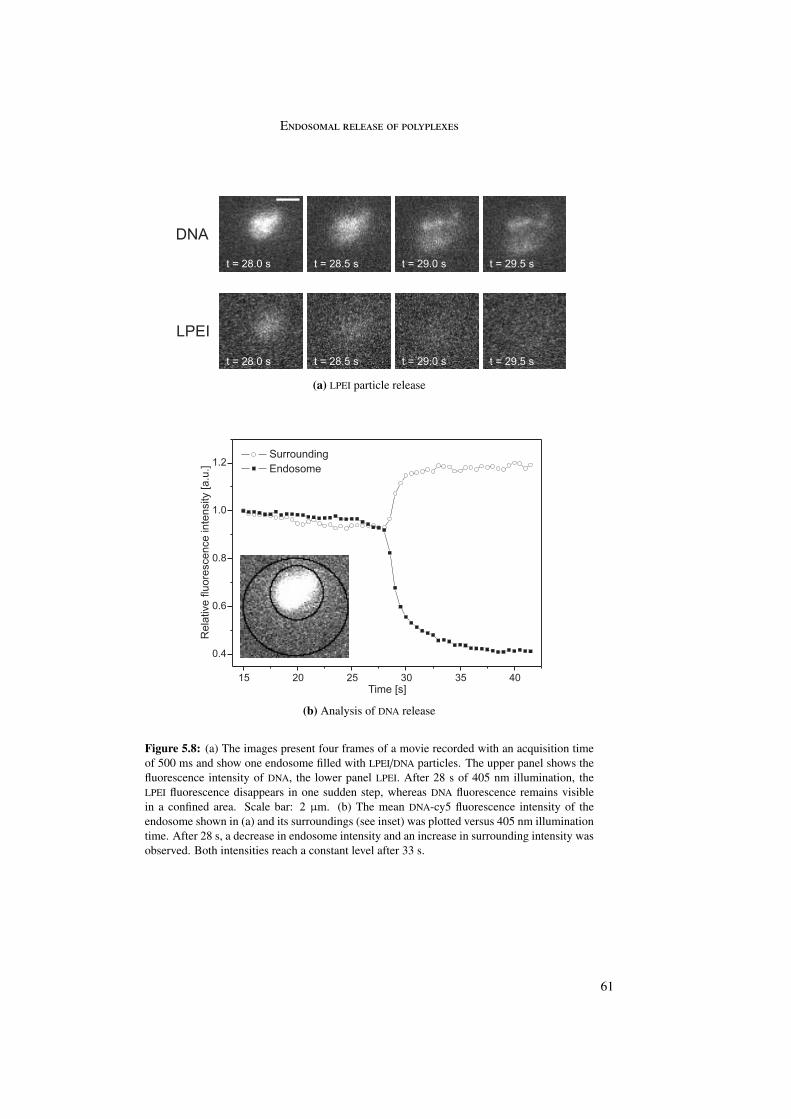
E
(a) LPEI particle release
(b) Analysis of DNA release
Figure 5.8: (a) The images present four frames of a movie recorded with an acquisition timeof 500 ms and show one endosome filled with LPEI/DNA particles. The upper panel shows thefluorescence intensity of DNA, the lower panel LPEI. After 28 s of 405 nm illumination, theLPEI fluorescence disappears in one sudden step, whereas DNA fluorescence remains visiblein a confined area. Scale bar: 2 µm. (b) The mean DNA-cy5 fluorescence intensity of theendosome shown in (a) and its surroundings (see inset) was plotted versus 405 nm illuminationtime. After 28 s, a decrease in endosome intensity and an increase in surrounding intensity wasobserved. Both intensities reach a constant level after 33 s.
61
P
AFD, the fluorescence intensity of the surroundings remained at a constant level and did notdecrease to the background value. This shows that after membrane rupture, the DNA dispersesin a sudden burst around the endosomal region but remains immobile afterwards. Thereforethe intensity of the surroundings does not drop back to background level as observed for AFD,which diffused into the cytoplasm.
In short, we observed the following differences between the release patterns of DNA and LPEI:first, the heterogeneity (DNA) versus the homogeneity (LPEI) of the fluorescence within theendosome; second, the particulate versus homogeneous spread into the cytosol after release;third, the confined reminiscence of the DNA fluorescence versus spread of LPEI fluorescencethroughout the whole cell; and fourth, the different time scales of endosomal fluorescencedecrease.
From these differences, the release of LPEI/DNA particles can be interpreted as follows.After endosomal rupture, diffusion of LPEI through the cytosol is observed resulting in de-creasing fluorescence intensity of the former endosome and an increase in cytosolic fluores-cence. LPEI has a molecular weight of 22 kDa allowing diffusion in the cytoplasm [171,192].Plasmid DNA in contrast cannot diffuse in the cytosol due to its large size [107,108]. Its diffu-sion in the cytoplasm is hindered by various cellular structures and DNA is therefore largelyimmobile. This explains the observed differences in the diffusion behavior between LPEI andDNA.
The fact that this difference was observed implies that LPEI and DNA are dissociated toa large extent during endosomal release. Decondensation of LPEI and DNA in the cytoplasmwas shown by Itaka et al. [196]. Dissociation in the cytoplasm may be induced by RNA[197]. However, this process takes place on a larger time scale than the rapid release of LPEIobserved here. This suggests that the particles in the endosome have to be in a decondensedstate already before rupture of the endosomal membrane. The inhomogeneous pattern of theDNA versus the homogeneous distribution of LPEI in the intact endosomes supports (partial)decondensation of the polyplexes in the endosome.
The release of DNA was observed as a fast broadening of fluorescent structures that wereimmobile afterwards. The fast movement of the nondiffusible DNA for a very short momentmay be induced by pressure. An eventual pressure in the endosomes may be explained by the"proton sponge" effect of LPEI (section 2.5.1). The buffering capacity and reduced acidifica-tion is accompanied by an increased chloride accumulation resulting in osmotic swelling ofthe endosomes [45]. Damaging the membrane of an endosome under pressure would there-fore lead to a burst that is observed as a fast broadening of the nondiffusible DNA. The "protonsponge" effect also inhibits progression to lysosomes by buffering the pH of endosomes [198].Therefore the DNA is protected against degradation even in case LPEI and DNA decondensatein the endosome before release. This is in agreement with the observation of nondiffusibleand therefore intact plasmid DNA after endosomal release.
62
E
To summarize, LPEI/DNA particles seem to be dissociated already before endosomal release.They are present in endosomes, since no lysosomal degradation of the DNA is observed. Uponrelease, LPEI diffuses freely through the cytoplasm due to its small size. DNA is released outof the endosome under pressure and is afterwards immobile in the cytoplasm.
5.3.2 PLL
For LPEI and DNA no colocalization was found after endosomal release which implies thatLPEI particles are dissociated during endosomal release. To determine whether the releasebehavior of DNA and polymer was dependent on binding affinity to and the characteristics ofthe cationic polymer, a polymer with stronger DNA binding properties was used. In previousstudies it was shown that the polymer poly-L-lysine (PLL) has a much higher affinity for DNAthan LPEI resulting in stronger particle condensation [196]. It was shown that the condensedstate of the PLL particles was maintained in the cytoplasm and thus no dissociation took place.Therefore, colocalization of PLL and DNA after endosomal release is expected.
For PLL/DNA particles, polymer and DNA showed comparable release patterns. According tothe release dynamics, two endosomal populations were classified. These two populations aredepicted in figure 5.9. Two images from a video sequence are presented directly after thestart of the 405 nm illumination and at t = 110.5 s. The fluorescence signal of DNA and PLLis presented in different channels.
A homogeneous fluorescence distribution within the endosome was characteristic forPLL as well as for DNA before photosensitizer activation. In sharp contrast to the releaseof LPEI/DNA particles, all endosomes showed simultaneous and similar endosomal releaseof both PLL and DNA. The majority of endosomes released their contents completely in onesudden step without visible remaining fluorescence. For a small fraction of endosomes, illu-mination with 405 nm only led to a small decrease in fluorescence intensity for PLL as wellas DNA. In figure 5.9 three endosomes are visible showing this behavior (arrowheads).
In figure 5.10 and figure 5.11 an example of these differing populations of endosomes ispresented. Figure 5.10 shows three consecutive frames from a movie recorded with 500 msacquisition time. The fluorescence intensity of both particle components of the endosomemarked with an arrow simultaneously decreased in a sudden step after illumination with 405nm laser light. Only slight fluorescence remained in the endosomal region for both compo-nents (figure 5.10, arrow). The second endosome, marked with an arrowhead, shows endoso-mal release at a later time point. The decrease in endosomal fluorescence was accompaniedby a slight increase in cytosolic fluorescence intensity of PLL.
In figure 5.11 one endosome is presented which shows only a small decrease in fluores-cence intensity for PLL as well as DNA after illumination with 405 nm light. The release isindicated by the change in diameter of the fluorescence signal between frame two and three.Particles with only a small decrease in intensity after release were comparably bright evenafter prolonged illumination. The spots persisted at the location of the original endosomewithout any movement.
As mentioned at the beginning of this section, PLL/DNA particles were expected to showcolocalized endosomal release, because of the higher DNA binding affinity. This was indeedobserved. For the majority of endosomes, a rapid diffusion of PLL as well as DNA was noticed
63
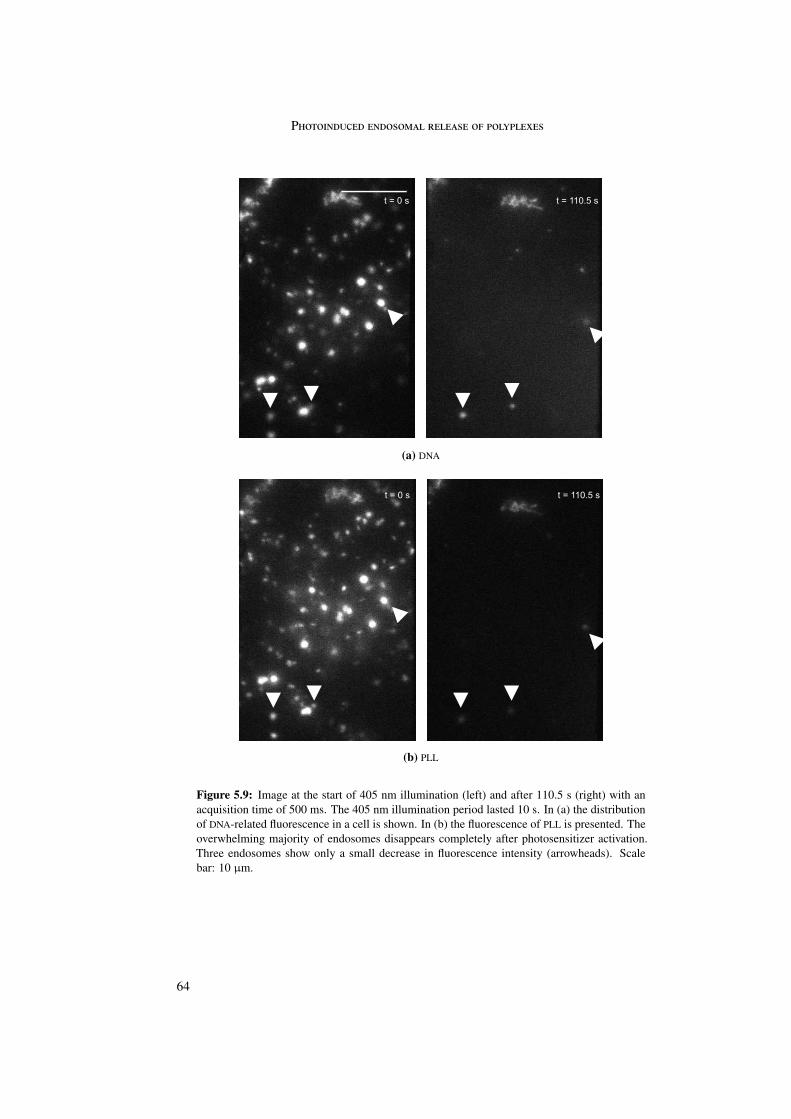
P
(a) DNA
(b) PLL
Figure 5.9: Image at the start of 405 nm illumination (left) and after 110.5 s (right) with anacquisition time of 500 ms. The 405 nm illumination period lasted 10 s. In (a) the distributionof DNA-related fluorescence in a cell is shown. In (b) the fluorescence of PLL is presented. Theoverwhelming majority of endosomes disappears completely after photosensitizer activation.Three endosomes show only a small decrease in fluorescence intensity (arrowheads). Scalebar: 10 µm.
64
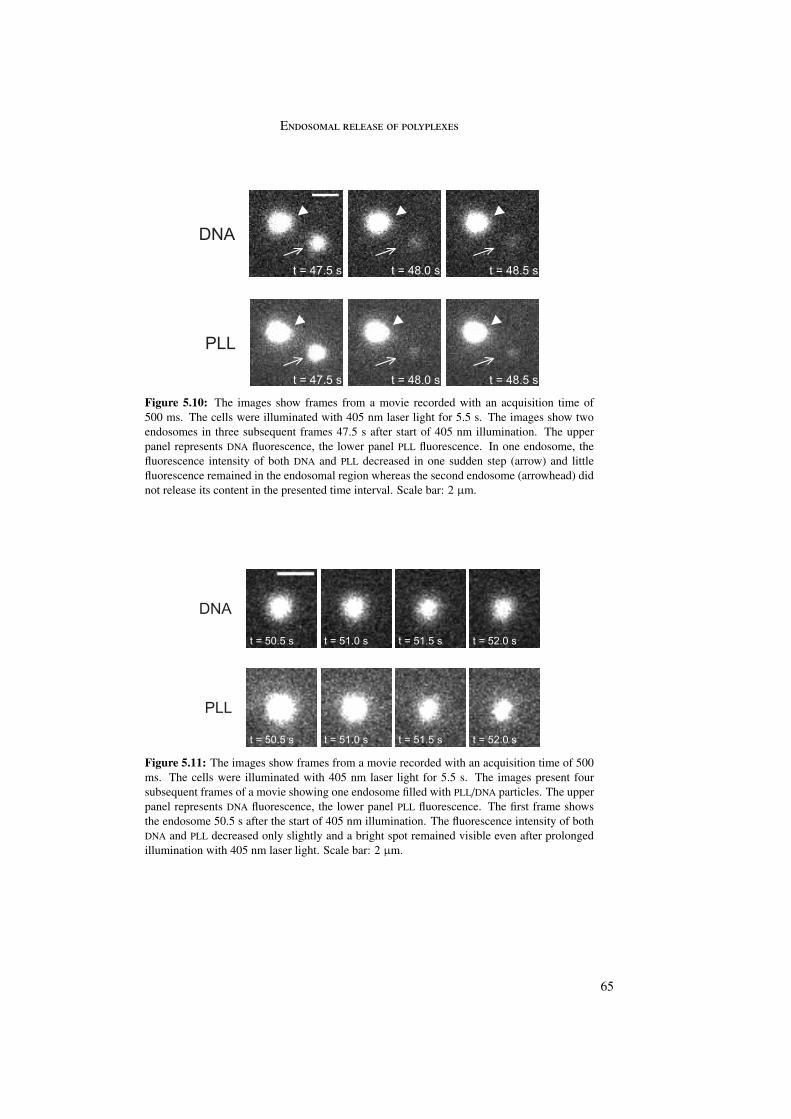
E
Figure 5.10: The images show frames from a movie recorded with an acquisition time of500 ms. The cells were illuminated with 405 nm laser light for 5.5 s. The images show twoendosomes in three subsequent frames 47.5 s after start of 405 nm illumination. The upperpanel represents DNA fluorescence, the lower panel PLL fluorescence. In one endosome, thefluorescence intensity of both DNA and PLL decreased in one sudden step (arrow) and littlefluorescence remained in the endosomal region whereas the second endosome (arrowhead) didnot release its content in the presented time interval. Scale bar: 2 µm.
Figure 5.11: The images show frames from a movie recorded with an acquisition time of 500ms. The cells were illuminated with 405 nm laser light for 5.5 s. The images present foursubsequent frames of a movie showing one endosome filled with PLL/DNA particles. The upperpanel represents DNA fluorescence, the lower panel PLL fluorescence. The first frame showsthe endosome 50.5 s after the start of 405 nm illumination. The fluorescence intensity of bothDNA and PLL decreased only slightly and a bright spot remained visible even after prolongedillumination with 405 nm laser light. Scale bar: 2 µm.
65
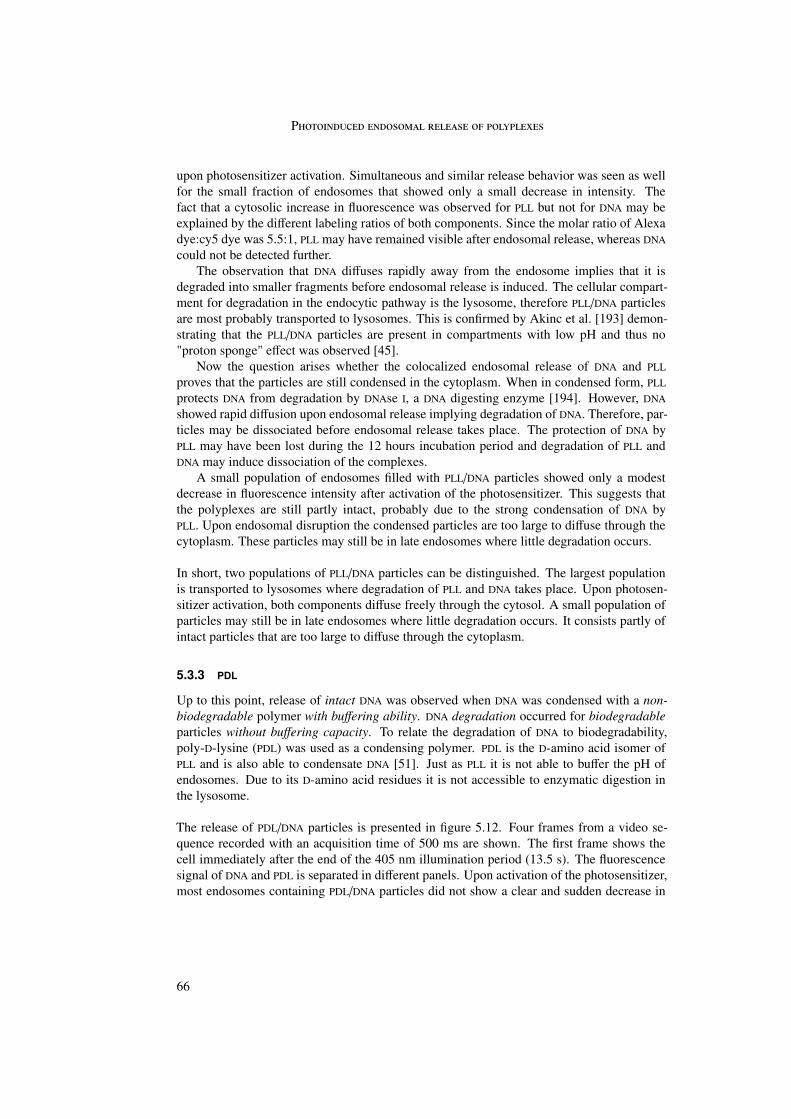
P
upon photosensitizer activation. Simultaneous and similar release behavior was seen as wellfor the small fraction of endosomes that showed only a small decrease in intensity. Thefact that a cytosolic increase in fluorescence was observed for PLL but not for DNA may beexplained by the different labeling ratios of both components. Since the molar ratio of Alexadye:cy5 dye was 5.5:1, PLL may have remained visible after endosomal release, whereas DNAcould not be detected further.
The observation that DNA diffuses rapidly away from the endosome implies that it isdegraded into smaller fragments before endosomal release is induced. The cellular compart-ment for degradation in the endocytic pathway is the lysosome, therefore PLL/DNA particlesare most probably transported to lysosomes. This is confirmed by Akinc et al. [193] demon-strating that the PLL/DNA particles are present in compartments with low pH and thus no"proton sponge" effect was observed [45].
Now the question arises whether the colocalized endosomal release of DNA and PLLproves that the particles are still condensed in the cytoplasm. When in condensed form, PLLprotects DNA from degradation by DNAse I, a DNA digesting enzyme [194]. However, DNAshowed rapid diffusion upon endosomal release implying degradation of DNA. Therefore, par-ticles may be dissociated before endosomal release takes place. The protection of DNA byPLL may have been lost during the 12 hours incubation period and degradation of PLL andDNA may induce dissociation of the complexes.
A small population of endosomes filled with PLL/DNA particles showed only a modestdecrease in fluorescence intensity after activation of the photosensitizer. This suggests thatthe polyplexes are still partly intact, probably due to the strong condensation of DNA byPLL. Upon endosomal disruption the condensed particles are too large to diffuse through thecytoplasm. These particles may still be in late endosomes where little degradation occurs.
In short, two populations of PLL/DNA particles can be distinguished. The largest populationis transported to lysosomes where degradation of PLL and DNA takes place. Upon photosen-sitizer activation, both components diffuse freely through the cytosol. A small population ofparticles may still be in late endosomes where little degradation occurs. It consists partly ofintact particles that are too large to diffuse through the cytoplasm.
5.3.3 PDL
Up to this point, release of intact DNA was observed when DNA was condensed with a non-biodegradable polymer with buffering ability. DNA degradation occurred for biodegradableparticles without buffering capacity. To relate the degradation of DNA to biodegradability,poly-D-lysine (PDL) was used as a condensing polymer. PDL is the D-amino acid isomer ofPLL and is also able to condensate DNA [51]. Just as PLL it is not able to buffer the pH ofendosomes. Due to its D-amino acid residues it is not accessible to enzymatic digestion inthe lysosome.
The release of PDL/DNA particles is presented in figure 5.12. Four frames from a video se-quence recorded with an acquisition time of 500 ms are shown. The first frame shows thecell immediately after the end of the 405 nm illumination period (13.5 s). The fluorescencesignal of DNA and PDL is separated in different panels. Upon activation of the photosensitizer,most endosomes containing PDL/DNA particles did not show a clear and sudden decrease in
66
E
Figure 5.12: Four images from a video sequence recorded with an acquisition time of 500 msare shown. The first frame shows the cell immediately after the 405 nm illumination time (13.5s). Following frames are taken 38 s, 114 s and 338 s after the start of 405 nm illumination. Theupper panel represents DNA fluorescence, the lower panel PDL fluorescence. Most particles donot show a clear decrease in intensity. Some particles show a decrease in intensity in the DNAfluorescence signal but no decrease in PDL fluorescence (boxed particle). Scale bar: 10 µm.
intensity. As this could also be caused by a lack of photosensitizer in the endosomes, the ef-ficacy of endosomal release was verified in control samples with the same amount of TPPS2aand LPEI/DNA particles under the same imaging conditions.
A second, small fraction of PDL/DNA particle-loaded endosomes was observed that showeda slight decrease in intensity of the PDL signal and a stronger decrease in intensity of the DNAsignal. In figure 5.12 these are marked by boxes.
Since PDL particles do not show buffering ability, the two observed populations of PDL par-ticles are expected to be in lysosomes. The largest population of lysosomes did not show aclear decrease in intensity. For these particles, PDL has successfully protected the DNA fromdegradation. Particles remain intact and therefore immobile in the cytoplasm upon photosen-sitizer activation.
For a small population of lysosomes, a modest decrease in the intensity of the DNA signalwas observed. In these lysosomes, nucleases may have been able to cleave a certain amountof DNA during the long incubation period. Although it was shown that PLL and PDL can protectDNA from degradation in experiments with 30 minutes incubation in crude cell lysates [195],our results with 12 hours incubation suggest that DNA is not fully protected against lysosomaldegradation on longer time scales. Overall, the nonbiodegradable PDL protects the DNA fromdegradation, although not as efficiently as observed for LPEI.
67
P
Taken together, two populations of PDL/DNA particles can be distinguished. The largest pop-ulation is presumably transported to lysosomes but degradation of DNA is hindered by PDL.Upon photosensitizer activation, intact particles remain immobile in the cytosol. A small pop-ulation of particles may be partly degraded and release of DNA into the cytosol is observed.
5.4 Summary
In this study we visualized endosomal release of polyplexes induced by photosensitizer ac-tivation. The release of a fluid phase marker provided information on the efficacy of pho-toinduced endosomal release and on the time scale of release. By comparing the endosomalrelease of three different classes of polyplexes, release characteristics like mobility in the cy-toplasm, degradation of the particles and dissociation of polymer and DNA were investigated.The results demonstrate that the characteristics of the cationic polymer used to condensateDNA significantly influence the release behavior of the polyplexes.
Experiments with a fluorescently labeled dextran showed successful loading of endosomeswith photosensitizer and AFD. Upon photosensitizer activation, the endosomal membrane wasdamaged and the endosomal content was set free into the cytosol within 100 ms. AFD rapidlydiffused through the cytosol without staining the nucleus within the observation period.
For the release of the cationic polymers, the following behavior was observed. Upon release,the intact (since nonbiodegradable) LPEI diffused quickly away from the original endosomeand was spread throughout the cytosol, which can be explained by the small size of the poly-mer. On the time scales of observation, no diffusion of LPEI into the nucleus was observed.
PLL has a higher binding affinity to DNA than LPEI. Therefore, PLL was expected to protectthe DNA more efficiently than LPEI and thus to prevent dissociation of the polyplex. In thiscase, the intact particles would remain immobile in the cytoplasm. Nonetheless the releasebehavior of PLL was similar to LPEI. PLL diffused from the endosome without any remainingstructures on the site of the endosome and in rare cases an increase in cytosolic backgroundindicated diffusion throughout the cytosol. PLL is biodegradable and may therefore be de-graded in the lysosome. Then, PLL is able to freely diffuse from the endosome throughout thecytosol upon photosensitizer activation.
For PDL, almost no release was observed upon photosensitizer activation. PDL condensesDNA in the same way as PLL. In contrast to the condensation of LPEI, the strong condensa-tion of PDL protects DNA against degradation. PDL itself is not biodegradable and thereforePDL/DNA particles remain intact. Thus, after photosensitizer activation particles remain im-mobile in the cytoplasm.
The release of DNA showed more distinguishable patterns. For LPEI/DNA particles, release ofintact DNA was detected. The fact that LPEI/DNA particles remain in endosomes instead oflysosomes may play a major role in the conservation of DNA. Since LPEI/DNA particles havebuffering ability which leads to reduced acidification DNA is prevented from degradation bylysosomal enzymes. The relatively weak binding affinity of LPEI to DNA, compared to PLLand PDL, may be lost within the endosomes already.
For PLL/DNA particles, fast release of both polymer and DNA was observed. Since PLL is
68

S
biodegradable and does not show a proton sponge effect, it may be degraded in the lysosome.This induces degradation of DNA and probably dissociation of the polyplex.
PDL/DNA particles remain largely intact in lysosomes due to the nonbiodegradability ofPDL. Therefore, DNA remains largely within the endosome upon photosensitizer activation.Some DNA was released, possibly due to some lysosomal activity as a consequence of thelong incubation time of 12 hours.
69

6. Cellular effects of photoinduced endosomalrelease
In the last chapter we saw that activation of TPPS2a results in cargo release from endosomes.TPPS2a is excited into a singlet state and subsequently falls back into a triplet state. This tripletstate is quenched by molecular oxygen whereupon singlet oxygen is generated. Damage ofmacromolecules in the endosomal membrane by singlet oxygen then leads to endosomalescape.
Apart from increasing endosomal release of gene vectors, the generation of singlet oxy-gen by photoactivation of porphyrins is known to have side effects. Singlet oxygen is a highlyreactive species with a lifetime of maximal 4 µs in H2O [105] and a diffusion radius of 50nm [106]. It easily oxidizes organic macromolecules like membrane lipids, proteins, aminoacids, DNA and RNA [20, 199] that are in close proximity. Generation of large amounts ofsinglet oxygen in the cell leads to damage of cell membranes, mitochondria, lysosomes andnuclei and eventually to apoptosis of cells [200]. These harmful side effects are exploitedby photodynamic therapy, a method to reduce cancer growth. In this method, photosensitivecompounds (often porphyrins) are intravenously administered to the body and accumulate intumor tissue. Upon photosensitizer activation, singlet oxygen is produced and reacts withintracellular targets which eventually leads to tumor necrosis [200].
In addition to singlet oxygen-related side effects, a direct influence of porphyrins oncellular compartments was observed. Porphyrins interact with the microtubule cytoskeletonby inhibition of microtubule assembly [201], most probably by binding to tubulin [202].
In this chapter the influence of TPPS2a on different compartments of the cell is examined. First,the interaction of TPPS2a with microtubules and actin cytoskeleton is studied. Second, theeffect of photoactivation on early and late endosomes is demonstrated. Finally, an influenceon endosomal motion is observed immediately after start of photosensitizer activation.
6.1 Microtubules and actin
It has been demonstrated earlier that porphyrins have a toxic effect on the cytoskeleton byinhibition of microtubule assembly [201]. Porphyrins bind to tubulin heterodimers [202] anda decrease in the amount of microtubules was found upon incubation of cells with tetra(4-sulfonatophenyl)porphine (TPPS4) [203]. Nevertheless, visualization of microtubule damageby means of high resolution microscopy has not yet been performed. This motivated us toperform highly sensitive microscopic experiments with tubulin-GFP (green fluorescent pro-tein) and actin-GFP expressing HUH7 cells. This enabled the visualization of microtubule
71
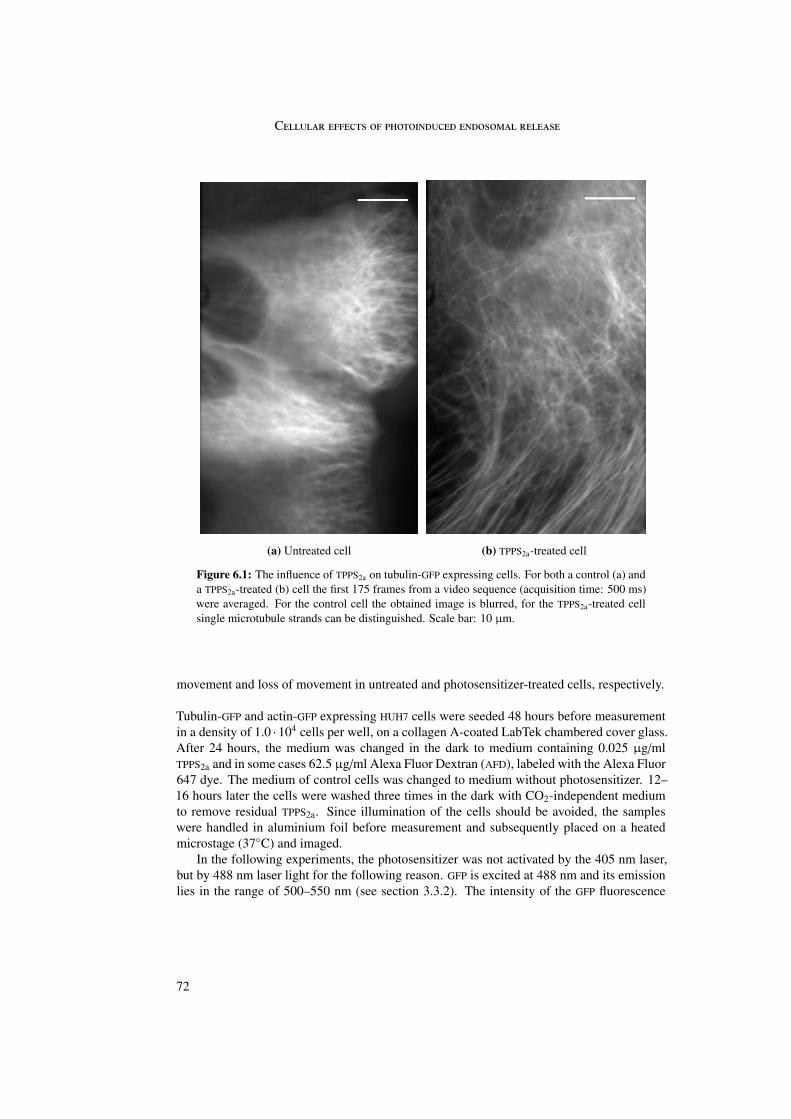
C
(a) Untreated cell (b) TPPS2a-treated cell
Figure 6.1: The influence of TPPS2a on tubulin-GFP expressing cells. For both a control (a) anda TPPS2a-treated (b) cell the first 175 frames from a video sequence (acquisition time: 500 ms)were averaged. For the control cell the obtained image is blurred, for the TPPS2a-treated cellsingle microtubule strands can be distinguished. Scale bar: 10 µm.
movement and loss of movement in untreated and photosensitizer-treated cells, respectively.
Tubulin-GFP and actin-GFP expressing HUH7 cells were seeded 48 hours before measurementin a density of 1.0 · 104 cells per well, on a collagen A-coated LabTek chambered cover glass.After 24 hours, the medium was changed in the dark to medium containing 0.025 µg/mlTPPS2a and in some cases 62.5 µg/ml Alexa Fluor Dextran (AFD), labeled with the Alexa Fluor647 dye. The medium of control cells was changed to medium without photosensitizer. 12–16 hours later the cells were washed three times in the dark with CO2-independent mediumto remove residual TPPS2a. Since illumination of the cells should be avoided, the sampleswere handled in aluminium foil before measurement and subsequently placed on a heatedmicrostage (37◦C) and imaged.
In the following experiments, the photosensitizer was not activated by the 405 nm laser,but by 488 nm laser light for the following reason. GFP is excited at 488 nm and its emissionlies in the range of 500–550 nm (see section 3.3.2). The intensity of the GFP fluorescence
72
M
strongly depends on the amount of GFP expressed in the cells. To visualize microtubules andactin filaments, the intensity of the 488 nm laser light was increased by a factor of 10–100compared to the endosomal release experiments described in the last chapter. As a conse-quence of this, the photosensitizer was activated with the 488 nm laser, since at this wave-length TPPS2a shows weak absorption (figure 5.2a). This implies that differentiation betweenvisualization of the microtubules and activation of the photosensitizer was impossible.
The effect of TPPS2a incubation and activation on microtubules is presented in figure 6.1. Forboth a control and a TPPS2a-treated cell, the first 175 frames from a video sequence, recordedwith an acquisition time of 500 ms, were averaged and the resulting image is presented.For the untreated cell the obtained image is blurred (figure 6.1a). Individual strands cannotbe distinguished. In untreated cells microtubules show the typical bending and bucklingcaused by polymerization and depolymerization. This movement results in a blur when thefluorescence intensity of several frames from a video sequence is averaged. In contrast, inthe averaged image of the photosensitizer-treated cell, single microtubules can be identified(figure 6.1b). Microtubule motion was largely absent in this case and thus averaging ofimages does not result in blur. This suggests that microtubule motion is inhibited by TPPS2a.Remarkably, in both the untreated and TPPS2a-treated cell an intact microtubule network wasobserved, which remained intact during observation.
In cases where cells were incubated with TPPS2a and Alexa Fluor Dextran (AFD) inhibitionof microtubule movement was observed before endosomal release of AFD took place. Thissuggests that inhibition of microtubule dynamics was not induced by the endosomal releaseprocess itself nor by free TPPS2a released upon endosomal release, but resulted from directinteraction of the photosensitizer with microtubules before cargo release.
Inhibition of microtubule dynamics was also observed after 2 hours of photosensitizerincubation in the dark. After 6 hours of re-incubation in photosensitizer-free medium norenewed movement was detected.
Whether the microtubule movement was inhibited already before photosensitizer activa-tion could not be distinguished. First, due to the high intensity of the 488 nm laser, imagingof the microtubules implied photosensitizer activation. Therefore, imaging and activation ofthe photosensitizer could not be separated. Second, to determine motion during a movie, sev-eral consecutive frames are necessary: one single frame does not show movement. Duringimaging of these frames, the photosensitizer was activated because of the aforementionedreason and thus inhibition of microtubule motion before photosensitizer activation could notbe distinguished.
These observations suggest a direct contact between photosensitizer and microtubules. Ob-viously, for this to happen the photosensitizer has to be present in the cytosol. Two possi-ble mechanisms exist for TPPS2a to get into the cytosol and intervene with the microtubuledynamics. The first possibility is that TPPS2a is released from the endosome upon photosen-sitizer activation and rapidly spreads out throughout the cytosol. Since we have seen thatmicrotubule dynamics were absent before endosomal release of dextran, this does not seema probable mechanism.
The second possibility is that during the long incubation time TPPS2a penetrates directlythrough either the cell membrane or the endosomal membrane to get into the cytosol. Al-though little photosensitizer is expected in the cytosol due to the preferential incorporation
73
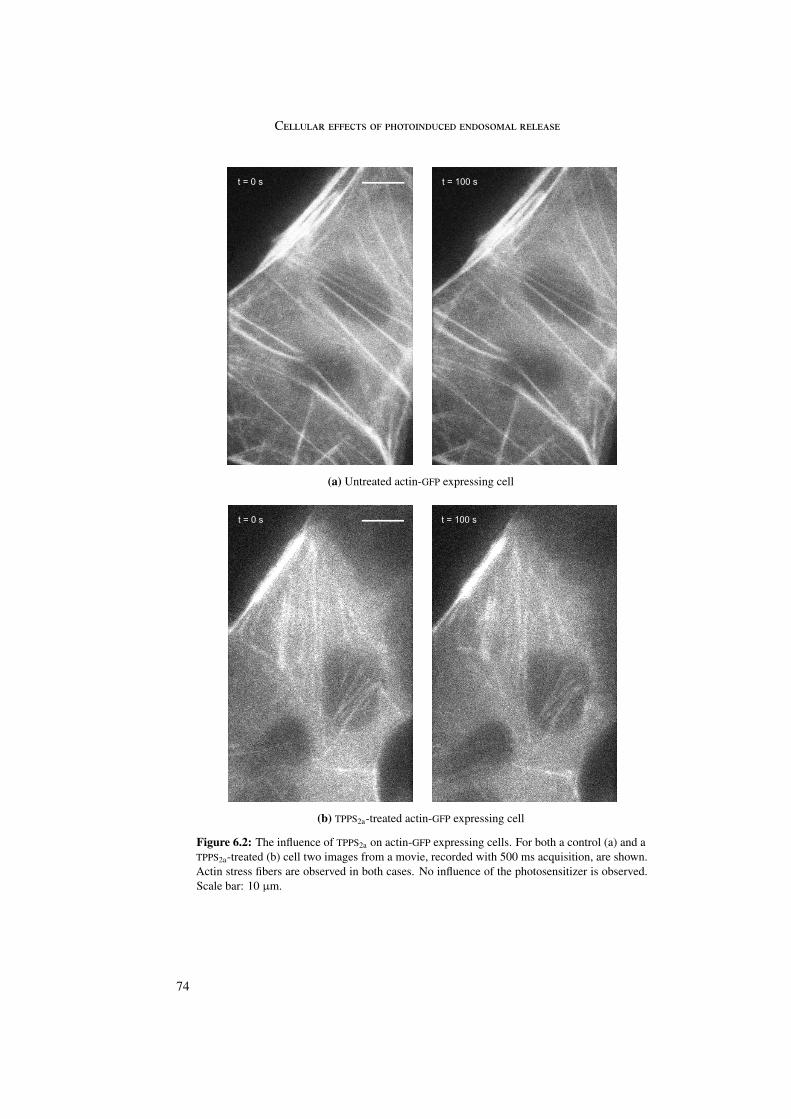
C
(a) Untreated actin-GFP expressing cell
(b) TPPS2a-treated actin-GFP expressing cell
Figure 6.2: The influence of TPPS2a on actin-GFP expressing cells. For both a control (a) and aTPPS2a-treated (b) cell two images from a movie, recorded with 500 ms acquisition, are shown.Actin stress fibers are observed in both cases. No influence of the photosensitizer is observed.Scale bar: 10 µm.
74
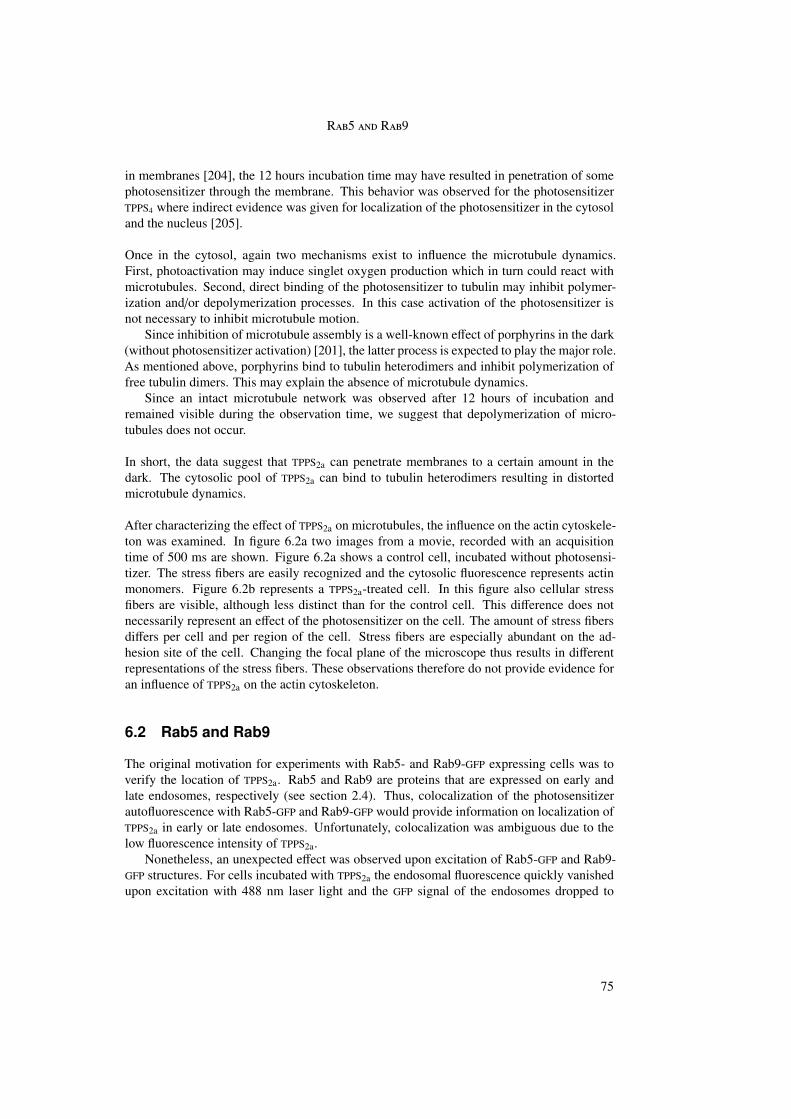
R5 R9
in membranes [204], the 12 hours incubation time may have resulted in penetration of somephotosensitizer through the membrane. This behavior was observed for the photosensitizerTPPS4 where indirect evidence was given for localization of the photosensitizer in the cytosoland the nucleus [205].
Once in the cytosol, again two mechanisms exist to influence the microtubule dynamics.First, photoactivation may induce singlet oxygen production which in turn could react withmicrotubules. Second, direct binding of the photosensitizer to tubulin may inhibit polymer-ization and/or depolymerization processes. In this case activation of the photosensitizer isnot necessary to inhibit microtubule motion.
Since inhibition of microtubule assembly is a well-known effect of porphyrins in the dark(without photosensitizer activation) [201], the latter process is expected to play the major role.As mentioned above, porphyrins bind to tubulin heterodimers and inhibit polymerization offree tubulin dimers. This may explain the absence of microtubule dynamics.
Since an intact microtubule network was observed after 12 hours of incubation andremained visible during the observation time, we suggest that depolymerization of micro-tubules does not occur.
In short, the data suggest that TPPS2a can penetrate membranes to a certain amount in thedark. The cytosolic pool of TPPS2a can bind to tubulin heterodimers resulting in distortedmicrotubule dynamics.
After characterizing the effect of TPPS2a on microtubules, the influence on the actin cytoskele-ton was examined. In figure 6.2a two images from a movie, recorded with an acquisitiontime of 500 ms are shown. Figure 6.2a shows a control cell, incubated without photosensi-tizer. The stress fibers are easily recognized and the cytosolic fluorescence represents actinmonomers. Figure 6.2b represents a TPPS2a-treated cell. In this figure also cellular stressfibers are visible, although less distinct than for the control cell. This difference does notnecessarily represent an effect of the photosensitizer on the cell. The amount of stress fibersdiffers per cell and per region of the cell. Stress fibers are especially abundant on the ad-hesion site of the cell. Changing the focal plane of the microscope thus results in differentrepresentations of the stress fibers. These observations therefore do not provide evidence foran influence of TPPS2a on the actin cytoskeleton.
6.2 Rab5 and Rab9
The original motivation for experiments with Rab5- and Rab9-GFP expressing cells was toverify the location of TPPS2a. Rab5 and Rab9 are proteins that are expressed on early andlate endosomes, respectively (see section 2.4). Thus, colocalization of the photosensitizerautofluorescence with Rab5-GFP and Rab9-GFP would provide information on localization ofTPPS2a in early or late endosomes. Unfortunately, colocalization was ambiguous due to thelow fluorescence intensity of TPPS2a.
Nonetheless, an unexpected effect was observed upon excitation of Rab5-GFP and Rab9-GFP structures. For cells incubated with TPPS2a the endosomal fluorescence quickly vanishedupon excitation with 488 nm laser light and the GFP signal of the endosomes dropped to
75
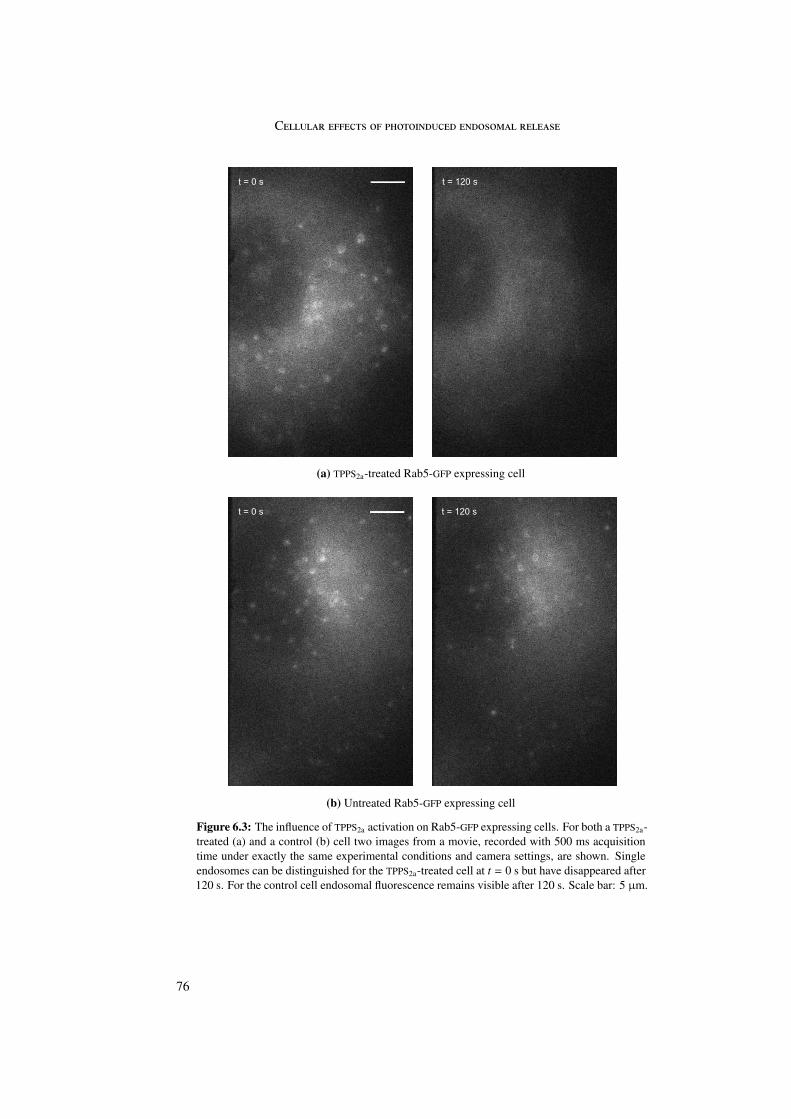
C
(a) TPPS2a-treated Rab5-GFP expressing cell
(b) Untreated Rab5-GFP expressing cell
Figure 6.3: The influence of TPPS2a activation on Rab5-GFP expressing cells. For both a TPPS2a-treated (a) and a control (b) cell two images from a movie, recorded with 500 ms acquisitiontime under exactly the same experimental conditions and camera settings, are shown. Singleendosomes can be distinguished for the TPPS2a-treated cell at t = 0 s but have disappeared after120 s. For the control cell endosomal fluorescence remains visible after 120 s. Scale bar: 5 µm.
76
R5 R9
background level.
Rab5- and Rab9-GFP expressing cells were seeded and treated similarly as described in thelast section. It has to be noted that in the following experiments, the 405 nm laser wasnot used to activate the photosensitizer. Just as for the excitation of tubulin-GFP and actin-GFP, the intensity of the 488 nm laser was such that the photosensitizer was activated at thiswavelength.
The effect of 488 nm excitation on Rab5-GFP expressing cells incubated overnight with TPPS2ais shown in figure 6.3a. The first image shows the cell directly after start of the illumination.The cell shows a high cytosolic background which indicates the boundary of the cell and thenucleus. No background fluorescence is observed within the cell nucleus. Single fluorescentstructures represent GFP-expressing endosomes. After 120 seconds of illumination the signalof the endosomes has dropped to background level: single fluorescent endosomes cannot bedetected anymore.
To exclude the possibility of GFP bleaching by the 488 nm laser, the experiment wasrepeated without TPPS2a. Figure 6.3b shows an untreated Rab5-GFP expressing cell. Theimages were selected from a movie, recorded with an acquisition time of 500 ms underexactly the same experimental conditions and camera settings as the TPPS2a-treated cell. Inthis case fluorescent endosomes are distinguished at t = 0 s as well as at t = 120 s. Singleendosomes show a slight decrease in fluorescence intensity, most probably due to bleachingof GFP by laser light. The cytosolic background is lower than in the case of photosensitizer-treated cells.
A similar effect was observed for Rab9-GFP expressing cells. An example of a TPPS2a-treated and a control cell is presented in figure 6.4. For both cells single endosomes canbe distinguished at the start of illumination. After 25 seconds, the single endosomes in theTPPS2a-treated cell have disappeared and only cytosolic background fluorescence is visible(figure 6.4a), whereas in the untreated cell single endosomes can easily be recognized (fig-ure 6.4b).
These results show that the disappearance of single fluorescent structures in TPPS2a-treatedcells is due to the activation of TPPS2a rather than to bleaching of GFP by laser. For both Rab5-and Rab9-GFP expressing cells incubated with TPPS2a endosomal structures were detectedimmediately after start of illumination. This strongly indicates that the disappearance offluorescent structures is dependent on singlet oxygen, generated upon illumination, and isnot due to interaction of the photosensitizer itself with the Rab proteins.
To understand the influence of photosensitizer activation on Rab5 and Rab9 we first have tolook at the mechanism of Rab protein membrane binding. Rab proteins are small GTPasesthat bind to the membrane of a specific compartment [206]. They play a role in vesicle fusionand transport [89,207]. In the cytosol, Rab proteins are present in a GDP-bound conformation[208]. Binding to a GDI protein (GDP Dissociation Inhibitor) is necessary to deliver the Rab-GDP complex to the target membrane. In the membrane GDP is replaced by GTP which resultsin stable binding of the protein to the membrane [209]. Rab proteins can thus switch betweena membrane-bound conformation and a cytosolic conformation. The observed disappearanceof single fluorescent structures and the increased cytosolic fluorescence may therefore be
77
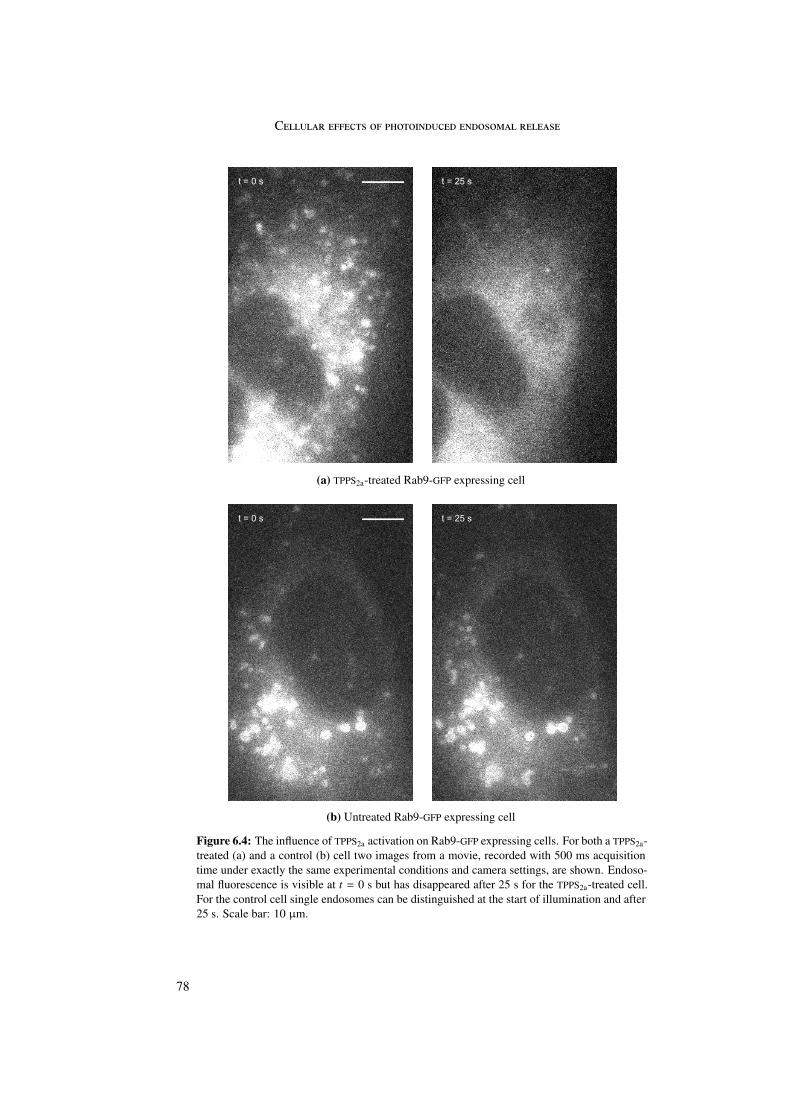
C
(a) TPPS2a-treated Rab9-GFP expressing cell
(b) Untreated Rab9-GFP expressing cell
Figure 6.4: The influence of TPPS2a activation on Rab9-GFP expressing cells. For both a TPPS2a-treated (a) and a control (b) cell two images from a movie, recorded with 500 ms acquisitiontime under exactly the same experimental conditions and camera settings, are shown. Endoso-mal fluorescence is visible at t = 0 s but has disappeared after 25 s for the TPPS2a-treated cell.For the control cell single endosomes can be distinguished at the start of illumination and after25 s. Scale bar: 10 µm.
78
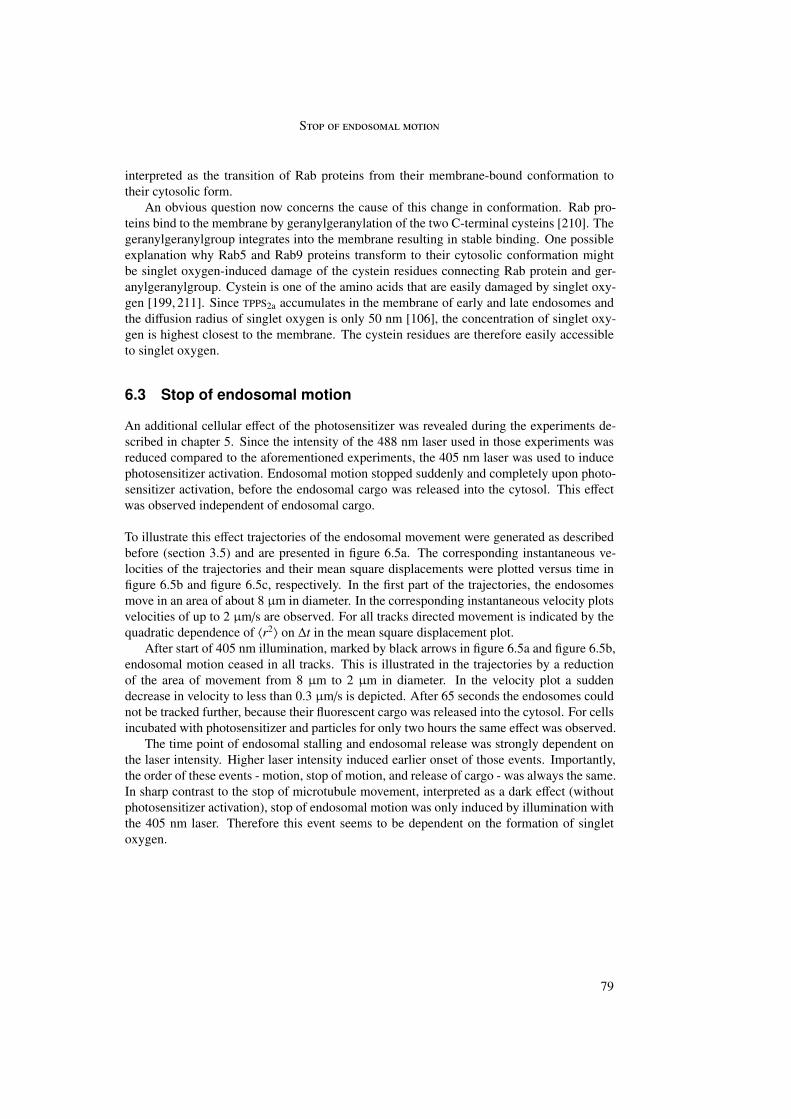
S
interpreted as the transition of Rab proteins from their membrane-bound conformation totheir cytosolic form.
An obvious question now concerns the cause of this change in conformation. Rab pro-teins bind to the membrane by geranylgeranylation of the two C-terminal cysteins [210]. Thegeranylgeranylgroup integrates into the membrane resulting in stable binding. One possibleexplanation why Rab5 and Rab9 proteins transform to their cytosolic conformation mightbe singlet oxygen-induced damage of the cystein residues connecting Rab protein and ger-anylgeranylgroup. Cystein is one of the amino acids that are easily damaged by singlet oxy-gen [199, 211]. Since TPPS2a accumulates in the membrane of early and late endosomes andthe diffusion radius of singlet oxygen is only 50 nm [106], the concentration of singlet oxy-gen is highest closest to the membrane. The cystein residues are therefore easily accessibleto singlet oxygen.
6.3 Stop of endosomal motion
An additional cellular effect of the photosensitizer was revealed during the experiments de-scribed in chapter 5. Since the intensity of the 488 nm laser used in those experiments wasreduced compared to the aforementioned experiments, the 405 nm laser was used to inducephotosensitizer activation. Endosomal motion stopped suddenly and completely upon photo-sensitizer activation, before the endosomal cargo was released into the cytosol. This effectwas observed independent of endosomal cargo.
To illustrate this effect trajectories of the endosomal movement were generated as describedbefore (section 3.5) and are presented in figure 6.5a. The corresponding instantaneous ve-locities of the trajectories and their mean square displacements were plotted versus time infigure 6.5b and figure 6.5c, respectively. In the first part of the trajectories, the endosomesmove in an area of about 8 µm in diameter. In the corresponding instantaneous velocity plotsvelocities of up to 2 µm/s are observed. For all tracks directed movement is indicated by thequadratic dependence of 〈r2〉 on ∆t in the mean square displacement plot.
After start of 405 nm illumination, marked by black arrows in figure 6.5a and figure 6.5b,endosomal motion ceased in all tracks. This is illustrated in the trajectories by a reductionof the area of movement from 8 µm to 2 µm in diameter. In the velocity plot a suddendecrease in velocity to less than 0.3 µm/s is depicted. After 65 seconds the endosomes couldnot be tracked further, because their fluorescent cargo was released into the cytosol. For cellsincubated with photosensitizer and particles for only two hours the same effect was observed.
The time point of endosomal stalling and endosomal release was strongly dependent onthe laser intensity. Higher laser intensity induced earlier onset of those events. Importantly,the order of these events - motion, stop of motion, and release of cargo - was always the same.In sharp contrast to the stop of microtubule movement, interpreted as a dark effect (withoutphotosensitizer activation), stop of endosomal motion was only induced by illumination withthe 405 nm laser. Therefore this event seems to be dependent on the formation of singletoxygen.
79
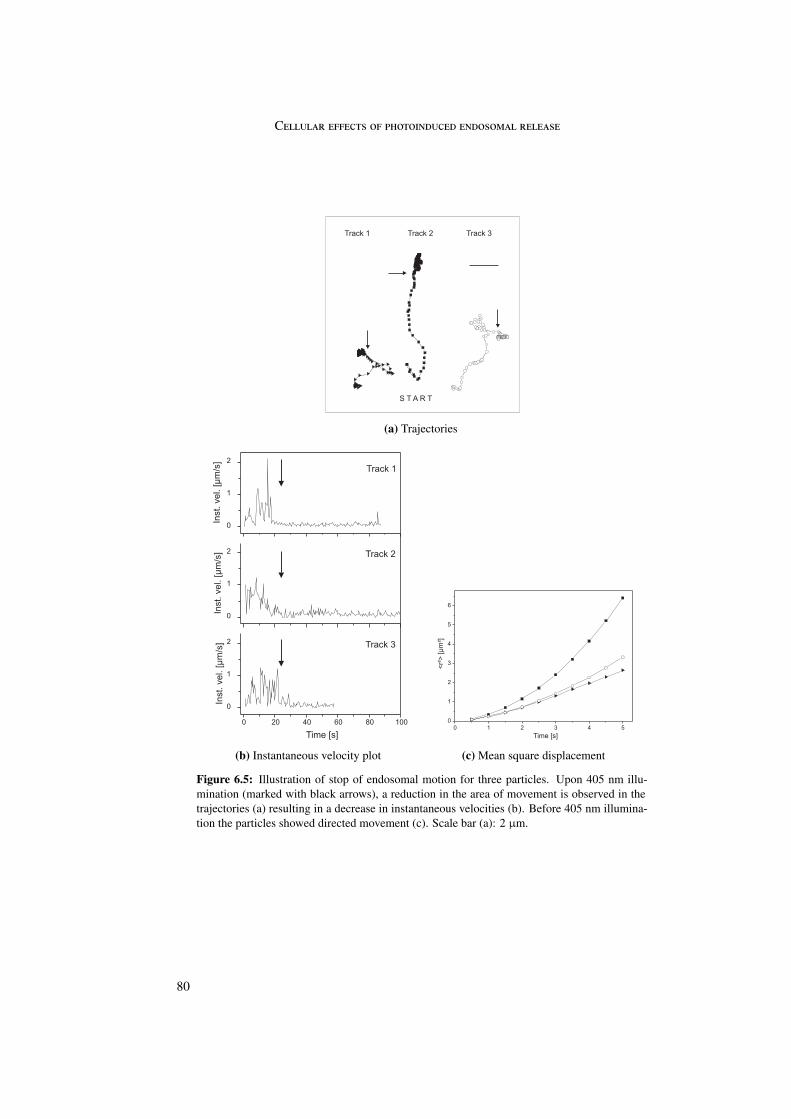
C
(a) Trajectories
(b) Instantaneous velocity plot (c) Mean square displacement
Figure 6.5: Illustration of stop of endosomal motion for three particles. Upon 405 nm illu-mination (marked with black arrows), a reduction in the area of movement is observed in thetrajectories (a) resulting in a decrease in instantaneous velocities (b). Before 405 nm illumina-tion the particles showed directed movement (c). Scale bar (a): 2 µm.
80
S
The inhibition of active transport along microtubules was not caused by photochemical dam-age of microtubules as the experiments with tubulin-GFP cells described in section 6.1 showedan intact microtubule cytoskeleton upon photosensitizer activation. This indicates that endo-somal stalling may be induced by singlet oxygen damage and may involve motor proteins.Singlet oxygen has a limited diffusion radius (50 nm) from its site of generation [106]. AsTPPS2a is attached to endosomal membranes and presumably to microtubules, the generatedsinglet oxygen could interact at some point in the link between microtubules and endosomaltransport. This may occur either by direct damage of motor proteins or by destruction ofproteins involved in linkage of motor proteins to membranes.
It has been shown that Rab proteins play a role in vesicle mobility and fusion [89, 207].They are associated with the link between motor proteins and endosomes [207, 212, 213].As described in section 6.2 photosensitizer activation may induce relocation of Rab proteinsfrom the endosomal membrane to the cytosol. The dissociation of Rab proteins from endo-somes could thus result in loss of motor protein connection with the endosome. This wouldlead to an immediate stop of endosomal motion.
6.4 Summary
In this chapter the side effects of TPPS2a on cellular compartments were studied. These sideeffects may either be classified as resulting from intracellular singlet oxygen generation orfrom direct binding to TPPS2a.
A stop of microtubule motion was observed that was interpreted as reduced polymer-ization of tubulin. Since an intact microtubule network was observed a decrease in depoly-merization was not probable. A dark effect of porphyrins by binding to tubulin has beendemonstrated before. This requires a direct interaction of photosensitizer and microtubuleswhich may occur via penetration through the plasma membrane during the 12 hours incuba-tion period.
A second side effect concerned Rab proteins. Rab5 and Rab9 are early and late endosomemarkers respectively and were transformed into their cytosolic form upon photosensitizer ac-tivation. Singlet oxygen may damage the link between Rab protein and endosomal membraneand thus the Rab protein may dissociate from the membrane and may be transported into thecytosol.
For the third side effect a clear dependence on photosensitizer activation was detected.Immediately after illumination with 405 nm laser light, stop of endosomal motion was ob-served. This stop was observed before cargo release occurred. Since Rab proteins connectendosomes to motor proteins and dissociation of the Rab proteins from the endosomal mem-brane was observed, the stop of endosomal motion may be caused by a loss of connectionbetween endosomes and Rab proteins.
81

Bibliography
[1] Charisius H. Viren, die das Auge retten. Süddeutsche Zeitung, 2007. 28th April, p.1.[2] Perrault I, Rozet JM, Gerber S, Ghazi I, Leowski C, et al. Leber congenital amaurosis. Mol
Genet Metab, 68(2) pp. 200–208, 1999.[3] Bainbridge JWB, Smith AJ, Barker SS, Robbie S, Henderson R, et al. Effect of gene therapy on
visual function in Leber’s congenital amaurosis. N Engl J Med, 2008.[4] Maguire AM, Simonelli F, Pierce EA, Pugh EN, Mingozzi F, et al. Safety and efficacy of gene
transfer for Leber’s congenital amaurosis. N Engl J Med, 2008.[5] Rosenberg SA, Aebersold P, Cornetta K, Kasid A, Morgan RA, et al. Gene transfer into humans -
immunotherapy of patients with advanced melanoma, using tumor-infiltrating lymphocytes mod-ified by retroviral gene transduction. N Engl J Med, 323(9) pp. 570–578, 1990.
[6] Stribley JM, Rehman KS, Niu H, and Christman GM. Gene therapy and reproductive medicine.Fertil Steril, 77(4) pp. 645–657, 2002.
[7] Cho YW, Kim JD, and Park K. Polycation gene delivery systems: escape from endosomes tocytosol. J Pharm Pharmacol, 55(6) pp. 721–734, 2003.
[8] Mislick KA and Baldeschwieler JD. Evidence for the role of proteoglycans in cation-mediatedgene transfer. Proc Natl Acad Sci U S A, 93(22) pp. 12349–12354, 1996.
[9] Payne CK, Jones SA, Chen C, and Zhuang X. Internalization and trafficking of cell surfaceproteoglycans and proteoglycan-binding ligands. Traffic, 8(4) pp. 389–401, 2007.
[10] Hess GT, Humphries WH, Fay NC, and Payne CK. Cellular binding, motion, and internalizationof synthetic gene delivery polymers. Biochim Biophys Acta, 1773(10) pp. 1583–1588, 2007.
[11] Ruponen M, Ylä-Herttuala S, and Urtti A. Interactions of polymeric and liposomal gene deliv-ery systems with extracellular glycosaminoglycans: physicochemical and transfection studies.Biochim Biophys Acta, 1415(2) pp. 331–341, 1999.
[12] Kircheis R, Kichler A, Wallner G, Kursa M, Ogris M, et al. Coupling of cell-binding ligands topolyethylenimine for targeted gene delivery. Gene Ther, 4(5) pp. 409–418, 1997.
[13] von Gersdorff K, Ogris M, and Wagner E. Cryoconserved shielded and EGF receptor targetedDNA polyplexes: cellular mechanisms. Eur J Pharm Biopharm, 60(2) pp. 279–285, 2005.
[14] Ogris M, Steinlein P, Carotta S, Brunner S, and Wagner E. DNA/polyethylenimine transfec-tion particles: influence of ligands, polymer size, and PEGylation on internalization and geneexpression. AAPS PharmSci, 3(3) p. E21, 2001.
[15] Puri C, Tosoni D, Comai R, Rabellino A, Segat D, et al. Relationships between EGFR signaling-competent and endocytosis-competent membrane microdomains. Mol Biol Cell, 16(6) pp. 2704–2718, 2005.
[16] Sigismund S, Woelk T, Puri C, Maspero E, Tacchetti C, et al. Clathrin-independent endocytosisof ubiquitinated cargos. Proc Natl Acad Sci U S A, 102(8) pp. 2760–2765, 2005.
[17] Engesaeter B, Bonsted A, Lillehammer T, Engebraaten O, Berg K, et al. Photochemically medi-ated delivery of AdhCMV-TRAIL augments the TRAIL-induced apoptosis in colorectal cancercell lines. Cancer Biol Ther, 5(11) pp. 1511–1520, 2006.
83
BIBLIOGRAPHY
[18] Prasmickaite L, Hellum M, Kaalhus O, Høgset A, Wagner E, et al. Photochemical internalizationof transgenes controlled by the heat-shock protein 70 promoter. Photochem Photobiol, 82(3) pp.809–816, 2006.
[19] Kloeckner J, Prasmickaite L, Høgset A, Berg K, and Wagner E. Photochemically enhanced genedelivery of EGF receptor-targeted DNA polyplexes. J Drug Target, 12(4) pp. 205–213, 2004.
[20] Ryter SW and Tyrrell RM. Singlet molecular oxygen (1O2): a possible effector of eukaryoticgene expression. Free Radic Biol Med, 24(9) pp. 1520–1534, 1998.
[21] de Bruin K, Ruthardt N, von Gersdorff K, Bausinger R, Wagner E, et al. Cellular dynamics ofEGF receptor-targeted synthetic viruses. Mol Ther, 15(7) pp. 1297–1305, 2007.
[22] Watson JD and Crick FH. Molecular structure of nucleic acids; a structure for deoxyribosenucleic acid. Nature, 171(4356) pp. 737–738, 1953.
[23] Sullivan SM. Introduction to gene therapy and guidelines to pharmaceutical development. InRolland A and Sullivan SM (editors), Pharmaceutical gene delivery systems, volume 131 ofDrugs and the pharmaceutical sciences, pp. 1–16. Marcel Dekker, Inc., New York, NY, 2003.
[24] Flotte TR. Gene therapy: the first two decades and the current state-of-the-art. J Cell Physiol,213(2) pp. 301–305, 2007.
[25] Edelstein ML, Abedi MR, and Wixon J. Gene therapy clinical trials worldwide to 2007 - anupdate. J Gene Med, 9(10) pp. 833–842, 2007.
[26] Raper SE, Chirmule N, Lee FS, Wivel NA, Bagg A, et al. Fatal systemic inflammatory responsesyndrome in a ornithine transcarbamylase deficient patient following adenoviral gene transfer.Mol Genet Metab, 80(1-2) pp. 148–158, 2003.
[27] Hacein-Bey-Abina S, von Kalle C, Schmidt M, Deist FL, Wulffraat N, et al. A serious adverseevent after successful gene therapy for X-linked severe combined immunodeficiency. N Engl JMed, 348(3) pp. 255–256, 2003.
[28] Ott MG, Schmidt M, Schwarzwaelder K, Stein S, Siler U, et al. Correction of X-linked chronicgranulomatous disease by gene therapy, augmented by insertional activation of MDS1-EVI1,PRDM16 or SETBP1. Nat Med, 12(4) pp. 401–409, 2006.
[29] Morgan RA, Dudley ME, Wunderlich JR, Hughes MS, Yang JC, et al. Cancer regression inpatients after transfer of genetically engineered lymphocytes. Science, 314(5796) pp. 126–129,2006.
[30] Slama J, Andree C, Winkler T, Swain WF, and Eriksson E. Gene transfer. Ann Plast Surg, 35(4)pp. 429–439, 1995.
[31] Gary DJ, Puri N, and Won YY. Polymer-based siRNA delivery: perspectives on the fundamentaland phenomenological distinctions from polymer-based DNA delivery. J Control Release, 121(1-2) pp. 64–73, 2007.
[32] Kichler A. Gene transfer with modified polyethylenimines. J Gene Med, 6 Suppl 1 pp. S3–10,2004.
[33] Walther W and Stein U. Viral vectors for gene transfer: a review of their use in the treatment ofhuman diseases. Drugs, 60(2) pp. 249–271, 2000.
[34] Bessis N, GarciaCozar FJ, and Boissier MC. Immune responses to gene therapy vectors: influ-ence on vector function and effector mechanisms. Gene Ther, 11 Suppl 1 pp. S10–S17, 2004.
[35] Waehler R, Russell SJ, and Curiel DT. Engineering targeted viral vectors for gene therapy. NatRev Genet, 8(8) pp. 573–587, 2007.
[36] Mrsny RJ. Tissue- and cell-specific targeting for the delivery of genetic information. In AmijiMM (editor), Polymeric gene delivery, chapter 2, pp. 5–28. CRC Press LLC, Boca Raton, Florida,2005.
[37] Thomas CE, Ehrhardt A, and Kay MA. Progress and problems with the use of viral vectors for
84
gene therapy. Nat Rev Genet, 4(5) pp. 346–358, 2003.[38] van Gaal EVB, Hennink WE, Crommelin DJA, and Mastrobattista E. Plasmid engineering for
controlled and sustained gene expression for nonviral gene therapy. Pharm Res, 23(6) pp. 1053–1074, 2006.
[39] Uyechi-O’Brien LS and Szoka FC. Mechanisms for cationic lipids in gene transfer. In RollandA and Sullivan SM (editors), Pharmaceutical gene delivery systems, volume 131 of Drugs andthe pharmaceutical sciences, chapter 4, pp. 79–108. Marcel Dekker, Inc., New York, NY, 2003.
[40] Conwell CC and Huang L. Recent advances in non-viral gene delivery. In Non-viral vectors forgene therapy. Elsevier academic press, 2005.
[41] Wightman L, Kircheis R, Rössler V, Carotta S, Ruzicka R, et al. Different behavior of branchedand linear polyethylenimine for gene delivery in vitro and in vivo. J Gene Med, 3(4) pp. 362–372,2001.
[42] Merdan T, Kopecek J, and Kissel T. Prospects for cationic polymers in gene and oligonucleotidetherapy against cancer. Adv Drug Deliv Rev, 54(5) pp. 715–758, 2002.
[43] Behr JP. The proton sponge: a trick to enter cells the viruses did not exploit. Chimia, 51 pp.34–36, 1997.
[44] Boussif O, Lezoualc’h F, Zanta MA, Mergny MD, Scherman D, et al. A versatile vector for geneand oligonucleotide transfer into cells in culture and in vivo: polyethylenimine. Proc Natl AcadSci U S A, 92(16) pp. 7297–7301, 1995.
[45] Sonawane ND, Szoka FC, and Verkman AS. Chloride accumulation and swelling in endosomesenhances DNA transfer by polyamine-DNA polyplexes. J Biol Chem, 278(45) pp. 44826–44831,2003.
[46] Laemmli UK. Characterization of DNA condensates induced by poly(ethylene oxide) and polyly-sine. Proc Natl Acad Sci U S A, 72(11) pp. 4288–4292, 1975.
[47] Kornguth SE and Stahmann MA. Effect of polylysine on the leakage and retention of compoundsby Ehrlich ascites tumor cells. Cancer Res, 21 pp. 907–912, 1961.
[48] Shen WC and Ryser HJ. Conjugation of poly-L-lysine to albumin and horseradish peroxidase: anovel method of enhancing the cellular uptake of proteins. Proc Natl Acad Sci U S A, 75(4) pp.1872–1876, 1978.
[49] Pruzanski W and Saito S. The influence of natural and synthetic cationic substances on phago-cytic activity of human polymorphonuclear cells. An alternative pathway of phagocytic enhance-ment. Exp Cell Res, 117(1) pp. 1–13, 1978.
[50] Elferink JG. Cytolytic effect of polylysine on rabbit polymorphonuclear leukocytes. Inflamma-tion, 9(3) pp. 321–331, 1985.
[51] Reich Z, Ittah Y, Weinberger S, and Minsky A. Chiral and structural discrimination in bindingof polypeptides with condensed nucleic acid structures. J Biol Chem, 265(10) pp. 5590–5594,1990.
[52] Plank C, Mechtler K, Szoka FC, and Wagner E. Activation of the complement system by syn-thetic DNA complexes: a potential barrier for intravenous gene delivery. Hum Gene Ther, 7(12)pp. 1437–1446, 1996.
[53] Ogris M, Brunner S, Schüller S, Kircheis R, and Wagner E. PEGylated DNA/transferrin-PEIcomplexes: reduced interaction with blood components, extended circulation in blood and po-tential for systemic gene delivery. Gene Ther, 6(4) pp. 595–605, 1999.
[54] Ward CM, Read ML, and Seymour LW. Systemic circulation of poly(L-lysine)/DNA vectors isinfluenced by polycation molecular weight and type of DNA: differential circulation in mice andrats and the implications for human gene therapy. Blood, 97(8) pp. 2221–2229, 2001.
[55] Goula D, Benoist C, Mantero S, Merlo G, Levi G, et al. Polyethylenimine-based intravenous
85
BIBLIOGRAPHY
delivery of transgenes to mouse lung. Gene Ther, 5(9) pp. 1291–1295, 1998.[56] Shir A, Ogris M, Wagner E, and Levitzki A. EGF receptor-targeted synthetic double-stranded
RNA eliminates glioblastoma, breast cancer, and adenocarcinoma tumors in mice. PLoS Med,3(1) p. e6, 2006.
[57] Conner SD and Schmid SL. Regulated portals of entry into the cell. Nature, 422(6927) pp.37–44, 2003.
[58] May RC and Machesky LM. Phagocytosis and the actin cytoskeleton. J Cell Sci, 114(Pt 6) pp.1061–1077, 2001.
[59] Alberts B, Johnson A, Lewis J, Raff M, Roberts K, et al. Molecular biology of the cell. GarlandScience, Taylor & Francis Group, LLC, 5th edition, 2008.
[60] Liu J and Shapiro JI. Endocytosis and signal transduction: basic science update. Biol Res Nurs,5(2) pp. 117–128, 2003.
[61] Robinson MS. The role of clathrin, adaptors and dynamin in endocytosis. Curr Opin Cell Biol,6(4) pp. 538–544, 1994.
[62] Gaidarov I, Santini F, Warren RA, and Keen JH. Spatial control of coated-pit dynamics in livingcells. Nat Cell Biol, 1(1) pp. 1–7, 1999.
[63] Merrifield CJ, Feldman ME, Wan L, and Almers W. Imaging actin and dynamin recruitmentduring invagination of single clathrin-coated pits. Nat Cell Biol, 4(9) pp. 691–698, 2002.
[64] Merrifield CJ, Perrais D, and Zenisek D. Coupling between clathrin-coated-pit invagination,cortactin recruitment, and membrane scission observed in live cells. Cell, 121(4) pp. 593–606,2005.
[65] Ehrlich M, Boll W, Oijen AV, Hariharan R, Chandran K, et al. Endocytosis by random initiationand stabilization of clathrin-coated pits. Cell, 118(5) pp. 591–605, 2004.
[66] Kirchhausen T. Clathrin. Annu Rev Biochem, 69 pp. 699–727, 2000.[67] Carpentier JL, Gorden P, Anderson RG, Goldstein JL, Brown MS, et al. Co-localization of 125I-
epidermal growth factor and ferritin-low density lipoprotein in coated pits: a quantitative electronmicroscopic study in normal and mutant human fibroblasts. J Cell Biol, 95(1) pp. 73–77, 1982.
[68] Schlessinger J, Shechter Y, Willingham MC, and Pastan I. Direct visualization of binding, ag-gregation, and internalization of insulin and epidermal growth factor on living fibroblastic cells.Proc Natl Acad Sci U S A, 75(6) pp. 2659–2663, 1978.
[69] Haigler HT, McKanna JA, and Cohen S. Direct visualization of the binding and internalizationof a ferritin conjugate of epidermal growth factor in human carcinoma cells a-431. J Cell Biol,81(2) pp. 382–395, 1979.
[70] Wilde A, Beattie EC, Lem L, Riethof DA, Liu SH, et al. EGF receptor signaling stimulates SRCkinase phosphorylation of clathrin, influencing clathrin redistribution and EGF uptake. Cell,96(5) pp. 677–687, 1999.
[71] Rust MJ, Lakadamyali M, Zhang F, and Zhuang X. Assembly of endocytic machinery aroundindividual influenza viruses during viral entry. Nat Struct Mol Biol, 11(6) pp. 567–573, 2004.
[72] Nichols BJ and Lippincott-Schwartz J. Endocytosis without clathrin coats. Trends Cell Biol,11(10) pp. 406–412, 2001.
[73] Sandvig K, Torgersen ML, Raa HA, and van Deurs B. Clathrin-independent endocytosis: fromnonexisting to an extreme degree of complexity. Histochem Cell Biol, 129(3) pp. 267–276, 2008.
[74] Hommelgaard AM, Roepstorff K, Vilhardt F, Torgersen ML, Sandvig K, et al. Caveolae: stablemembrane domains with a potential for internalization. Traffic, 6(9) pp. 720–724, 2005.
[75] Thomsen P, Roepstorff K, Stahlhut M, and van Deurs B. Caveolae are highly immobile plasmamembrane microdomains, which are not involved in constitutive endocytic trafficking. Mol BiolCell, 13(1) pp. 238–250, 2002.
86
[76] Kurzchalia TV and Parton RG. Membrane microdomains and caveolae. Curr Opin Cell Biol,11(4) pp. 424–431, 1999.
[77] Norkin LC. Simian virus 40 infection via MHC class I molecules and caveolae. Immunol Rev,168 pp. 13–22, 1999.
[78] Montesano R, Roth J, Robert A, and Orci L. Non-coated membrane invaginations are involvedin binding and internalization of cholera and tetanus toxins. Nature, 296(5858) pp. 651–653,1982.
[79] Pelkmans L, Kartenbeck J, and Helenius A. Caveolar endocytosis of simian virus 40 reveals anew two-step vesicular-transport pathway to the ER. Nat Cell Biol, 3(5) pp. 473–483, 2001.
[80] Henley JR, Krueger EW, Oswald BJ, and McNiven MA. Dynamin-mediated internalization ofcaveolae. J Cell Biol, 141(1) pp. 85–99, 1998.
[81] Mayor S and Pagano RE. Pathways of clathrin-independent endocytosis. Nat Rev Mol Cell Biol,8(8) pp. 603–612, 2007.
[82] Gruenberg J and Maxfield FR. Membrane transport in the endocytic pathway. Curr Opin CellBiol, 7(4) pp. 552–563, 1995.
[83] Yamashiro DJ, Tycko B, Fluss SR, and Maxfield FR. Segregation of transferrin to a mildly acidic(pH 6.5) para-Golgi compartment in the recycling pathway. Cell, 37(3) pp. 789–800, 1984.
[84] Rink J, Ghigo E, Kalaidzidis Y, and Zerial M. Rab conversion as a mechanism of progressionfrom early to late endosomes. Cell, 122(5) pp. 735–749, 2005.
[85] Mu FT, Callaghan JM, Steele-Mortimer O, Stenmark H, Parton RG, et al. EEA1, an earlyendosome-associated protein. EEA1 is a conserved alpha-helical peripheral membrane proteinflanked by cysteine "fingers" and contains a calmodulin-binding IQ motif. J Biol Chem, 270(22)pp. 13503–13511, 1995.
[86] Mills IG, Jones AT, and Clague MJ. Involvement of the endosomal autoantigen EEA1 in homo-typic fusion of early endosomes. Curr Biol, 8(15) pp. 881–884, 1998.
[87] Woodman PG. Biogenesis of the sorting endosome: the role of Rab5. Traffic, 1(9) pp. 695–701,2000.
[88] Gorvel JP, Chavrier P, Zerial M, and Gruenberg J. Rab5 controls early endosome fusion in vitro.Cell, 64(5) pp. 915–925, 1991.
[89] Nielsen E, Severin F, Backer JM, Hyman AA, and Zerial M. Rab5 regulates motility of earlyendosomes on microtubules. Nat Cell Biol, 1(6) pp. 376–382, 1999.
[90] Mellman I, Fuchs R, and Helenius A. Acidification of the endocytic and exocytic pathways.Annu Rev Biochem, 55 pp. 663–700, 1986.
[91] Piper RC and Luzio JP. Late endosomes: sorting and partitioning in multivesicular bodies.Traffic, 2(9) pp. 612–621, 2001.
[92] Piper RC and Katzmann DJ. Biogenesis and function of multivesicular bodies. Annu Rev CellDev Biol, 23 pp. 519–547, 2007.
[93] Blanc IL, Luyet PP, Pons V, Ferguson C, Emans N, et al. Endosome-to-cytosol transport of viralnucleocapsids. Nat Cell Biol, 7(7) pp. 653–664, 2005.
[94] Abrami L, Lindsay M, Parton RG, Leppla SH, and van der Goot FG. Membrane insertion ofanthrax protective antigen and cytoplasmic delivery of lethal factor occur at different stages ofthe endocytic pathway. J Cell Biol, 166(5) pp. 645–651, 2004.
[95] Bright NA, Gratian MJ, and Luzio JP. Endocytic delivery to lysosomes mediated by concurrentfusion and kissing events in living cells. Curr Biol, 15(4) pp. 360–365, 2005.
[96] Riederer MA, Soldati T, Shapiro AD, Lin J, and Pfeffer SR. Lysosome biogenesis requires Rab9function and receptor recycling from endosomes to the trans-Golgi network. J Cell Biol, 125(3)pp. 573–582, 1994.
87
BIBLIOGRAPHY
[97] Ganley IG, Carroll K, Bittova L, and Pfeffer S. Rab9 GTPase regulates late endosome size andrequires effector interaction for its stability. Mol Biol Cell, 15(12) pp. 5420–5430, 2004.
[98] Luzio JP, Poupon V, Lindsay MR, Mullock BM, Piper RC, et al. Membrane dynamics and thebiogenesis of lysosomes. Mol Membr Biol, 20(2) pp. 141–154, 2003.
[99] Mullock BM, Bright NA, Fearon CW, Gray SR, and Luzio JP. Fusion of lysosomes with lateendosomes produces a hybrid organelle of intermediate density and is NSF dependent. J CellBiol, 140(3) pp. 591–601, 1998.
[100] Winchester B. Lysosomal metabolism of glycoproteins. Glycobiology, 15(6) pp. 1R–15R, 2005.[101] Dempsey CE. The actions of melittin on membranes. Biochim Biophys Acta, 1031(2) pp. 143–
161, 1990.[102] Akinc A, Thomas M, Klibanov AM, and Langer R. Exploring polyethylenimine-mediated DNA
transfection and the proton sponge hypothesis. J Gene Med, 7(5) pp. 657–663, 2005.[103] Høgset A, Prasmickaite L, Hellum M, Engesaeter BO, Olsen VM, et al. Photochemical transfec-
tion: a technology for efficient light-directed gene delivery. Somat Cell Mol Genet, 27(1-6) pp.97–113, 2002.
[104] Berg K, Selbo PK, Weyergang A, Dietze A, Prasmickaite L, et al. Porphyrin-related photosensi-tizers for cancer imaging and therapeutic applications. J Microsc, 218(Pt 2) pp. 133–147, 2005.
[105] Redmond RW and Kochevar IE. Spatially resolved cellular responses to singlet oxygen. Pho-tochem Photobiol, 82(5) pp. 1178–1186, 2006.
[106] Moan J. On the diffusion length of singlet oxygen in cells and tissues. J Photochem PhotobiolB Bio, 6 pp. 343–347, 1990.
[107] Dowty ME, Williams P, Zhang G, Hagstrom JE, and Wolff JA. Plasmid DNA entry into postmi-totic nuclei of primary rat myotubes. Proc Natl Acad Sci U S A, 92(10) pp. 4572–4576, 1995.
[108] Lukacs GL, Haggie P, Seksek O, Lechardeur D, Freedman N, et al. Size-dependent DNA mobil-ity in cytoplasm and nucleus. J Biol Chem, 275(3) pp. 1625–1629, 2000.
[109] Margalit A, Vlcek S, Gruenbaum Y, and Foisner R. Breaking and making of the nuclear envelope.J Cell Biochem, 95(3) pp. 454–465, 2005.
[110] Brunner S, Sauer T, Carotta S, Cotten M, Saltik M, et al. Cell cycle dependence of gene transferby lipoplex, polyplex and recombinant adenovirus. Gene Ther, 7(5) pp. 401–407, 2000.
[111] Grosse S, Thévenot G, Monsigny M, and Fajac I. Which mechanism for nuclear import ofplasmid DNA complexed with polyethylenimine derivatives? J Gene Med, 8(7) pp. 845–851,2006.
[112] Talcott B and Moore MS. Getting across the nuclear pore complex. Trends Cell Biol, 9(8) pp.312–318, 1999.
[113] van der Aa MAEM, Mastrobattista E, Oosting RS, Hennink WE, Koning GA, et al. The nuclearpore complex: the gateway to successful nonviral gene delivery. Pharm Res, 23(3) pp. 447–459,2006.
[114] Zanta MA, Belguise-Valladier P, and Behr JP. Gene delivery: a single nuclear localization signalpeptide is sufficient to carry DNA to the cell nucleus. Proc Natl Acad Sci U S A, 96(1) pp. 91–96,1999.
[115] Sebestyén MG, Ludtke JJ, Bassik MC, Zhang G, Budker V, et al. DNA vector chemistry: thecovalent attachment of signal peptides to plasmid DNA. Nat Biotechnol, 16(1) pp. 80–85, 1998.
[116] von Gersdorff K. PEG-shielded and EGF receptor targeted DNA polyplexes: cellular mecha-nisms. Ph.D. thesis, LMU München, 2006.
[117] Plank C, Zatloukal K, Cotten M, Mechtler K, and Wagner E. Gene transfer into hepatocytesusing asialoglycoprotein receptor mediated endocytosis of DNA complexed with an artificialtetra-antennary galactose ligand. Bioconjug Chem, 3(6) pp. 533–539, 1992.
88
[118] Boeckle S, von Gersdorff K, van der Piepen S, Culmsee C, Wagner E, et al. Purification ofpolyethylenimine polyplexes highlights the role of free polycations in gene transfer. J GeneMed, 6(10) pp. 1102–1111, 2004.
[119] Moerner W and Fromm D. Methods of single molecule fluorescence spectroscopy and mi-croscopy. Rev Sci Instrum, 74(8) pp. 3597–3619, 2003.
[120] Koehler A. A new system of illumination for photomicrographic purposes. Zeitschrift fuerWissenschaftliche Mikroskopie, 10 pp. 433–440, 1893.
[121] Davidson MW and Abramowitz M. Optical microscopy.http://www.olympusmicro.com/primer/microscopy.pdf, 1999.
[122] Lichtman JW and Conchello JA. Fluorescence microscopy. Nat Methods, 2(12) pp. 910–919,2005.
[123] Abramowitz M. Microscope basics and beyond. For Olympus America Inc.http://www.olympusmicro.com/primer/basicsandbeyond.pdf, 2003.
[124] Inoue S and Spring K. Video Microscopy. Plenum Publishing, New York, NY, 2nd edition, 1997.[125] Lakowicz JR. Principles of fluorescence spectroscopy. Kluwer Academic/Plenum publishers,
New York, NY, 2nd edition, 2003.[126] Atkins P and de Paula J. Atkins’ physical chemistry. Oxford University Press, Oxford, 7th
edition, 2002.[127] Eftink MR. Fluorescence quenching: theory and applications. In Lakowicz JR (editor), Princi-
ples, volume 2 of Topics in fluorescence spectroscopy, chapter 2, p. 58. Plenum Press, New York,NY&, 1991.
[128] Nikon. How to use a microscope and take a photomicrograph. Nikon corporation, 1997.[129] Schmidt T, Schütz GJ, Baumgartner W, Gruber HJ, and Schindler H. Imaging of single molecule
diffusion. Proc Natl Acad Sci U S A, 93(7) pp. 2926–2929, 1996.[130] Saxton MJ and Jacobson K. Single-particle tracking: applications to membrane dynamics. Annu
Rev Biophys Biomol Struct, 26 pp. 373–399, 1997.[131] Levi V and Gratton E. Exploring dynamics in living cells by tracking single particles. Cell
Biochem Biophys, 48(1) pp. 1–15, 2007.[132] Seisenberger G, Ried MU, Endress T, Büning H, Hallek M, et al. Real-time single-molecule
imaging of the infection pathway of an adeno-associated virus. Science, 294(5548) pp. 1929–1932, 2001.
[133] Kues T, Peters R, and Kubitscheck U. Visualization and tracking of single protein molecules inthe cell nucleus. Biophys J, 80(6) pp. 2954–2967, 2001.
[134] Lakadamyali M, Rust MJ, Babcock HP, and Zhuang X. Visualizing infection of individualinfluenza viruses. Proc Natl Acad Sci U S A, 100(16) pp. 9280–9285, 2003.
[135] Ritchie K, Iino R, Fujiwara T, Murase K, and Kusumi A. The fence and picket structure of theplasma membrane of live cells as revealed by single molecule techniques (review). Mol MembrBiol, 20(1) pp. 13–18, 2003.
[136] Yildiz A, Forkey JN, McKinney SA, Ha T, Goldman YE, et al. Myosin V walks hand-over-hand:single fluorophore imaging with 1.5-nm localization. Science, 300(5628) pp. 2061–2065, 2003.
[137] Cheezum MK, Walker WF, and Guilford WH. Quantitative comparison of algorithms for track-ing single fluorescent particles. Biophys J, 81(4) pp. 2378–2388, 2001.
[138] Anderson CM, Georgiou GN, Morrison IE, Stevenson GV, and Cherry RJ. Tracking of cellsurface receptors by fluorescence digital imaging microscopy using a charge-coupled devicecamera. Low-density lipoprotein and influenza virus receptor mobility at 4 degrees C. J Cell Sci,101 ( Pt 2) pp. 415–425, 1992.
[139] Cover T and Hart P. Nearest neighbor pattern classification. IEEE Trans Information Theory, 13
89
BIBLIOGRAPHY
pp. 21–27, 1967.[140] Saxton MJ. Lateral diffusion in an archipelago. Single-particle diffusion. Biophys J, 64(6) pp.
1766–1780, 1993.[141] Saxton MJ. Anomalous diffusion due to obstacles: a Monte Carlo study. Biophys J, 66(2 Pt 1)
pp. 394–401, 1994.[142] Saxton MJ. Single-particle tracking: models of directed transport. Biophys J, 67(5) pp. 2110–
2119, 1994.[143] Saxton MJ. Single-particle tracking: effects of corrals. Biophys J, 69(2) pp. 389–398, 1995.[144] Saxton MJ. Anomalous diffusion due to binding: a Monte Carlo study. Biophys J, 70(3) pp.
1250–1262, 1996.[145] Saxton MJ. Single-particle tracking: the distribution of diffusion coefficients. Biophys J, 72(4)
pp. 1744–1753, 1997.[146] Qian H, Sheetz MP, and Elson EL. Single particle tracking. Analysis of diffusion and flow in
two-dimensional systems. Biophys J, 60(4) pp. 910–921, 1991.[147] Klessinger M and Michl J. Excited states and photochemistry of organic molecules. VCH
Publishers, Inc., New York, NY, 1995.[148] McNamee CE, Yamamoto S, and Higashitani K. Effect of the physicochemical properties of
poly(ethylene glycol) brushes on their binding to cells. Biophys J, 93(1) pp. 324–334, 2007.[149] Belting M. Heparan sulfate proteoglycan as a plasma membrane carrier. Trends Biochem Sci,
28(3) pp. 145–151, 2003.[150] Kopatz I, Remy JS, and Behr JP. A model for non-viral gene delivery: through syndecan adhe-
sion molecules and powered by actin. J Gene Med, 6(7) pp. 769–776, 2004.[151] Bernfield M, Götte M, Park PW, Reizes O, Fitzgerald ML, et al. Functions of cell surface heparan
sulfate proteoglycans. Annu Rev Biochem, 68 pp. 729–777, 1999.[152] Martinho RG, Castel S, Ureña J, Fernández-Borja M, Makiya R, et al. Ligand binding to heparan
sulfate proteoglycans induces their aggregation and distribution along actin cytoskeleton. MolBiol Cell, 7(11) pp. 1771–1788, 1996.
[153] von Gersdorff K, Sanders NN, Vandenbroucke R, Smedt SCD, Wagner E, et al. The internaliza-tion route resulting in successful gene expression depends on both cell line and polyethyleniminepolyplex type. Mol Ther, 14(5) pp. 745–753, 2006.
[154] Rejman J, Bragonzi A, and Conese M. Role of clathrin- and caveolae-mediated endocytosis ingene transfer mediated by lipo- and polyplexes. Mol Ther, 12(3) pp. 468–474, 2005.
[155] Grosse S, Aron Y, Thévenot G, François D, Monsigny M, et al. Potocytosis and cellular exitof complexes as cellular pathways for gene delivery by polycations. J Gene Med, 7(10) pp.1275–1286, 2005.
[156] Bausinger R, von Gersdorff K, Braeckmans K, Ogris M, Wagner E, et al. The transport ofnanosized gene carriers unraveled by live-cell imaging. Angew Chem Int Ed Engl, 45(10) pp.1568–1572, 2006.
[157] DeRouchey J, Walker GF, Wagner E, and Rädler JO. Decorated rods: a "bottom-up" self-assembly of monomolecular DNA complexes. J Phys Chem B, 110(10) pp. 4548–4554, 2006.
[158] Luten J, van Steenbergen MJ, Lok MC, de Graaff AM, van Nostrum CF, et al. Degrad-able PEG-folate coated poly(DMAEA-co-BA)phosphazene-based polyplexes exhibit receptor-specific gene expression. Eur J Pharm Sci, 2007.
[159] Herbst RS. Review of epidermal growth factor receptor biology. Int J Radiat Oncol Biol Phys,59(2 Suppl) pp. 21–26, 2004.
[160] Carpenter G. Receptors for epidermal growth factor and other polypeptide mitogens. Annu RevBiochem, 56 pp. 881–914, 1987.
90
[161] Hinrichsen L, Harborth J, Andrees L, Weber K, and Ungewickell EJ. Effect of clathrin heavychain- and alpha-adaptin-specific small inhibitory RNAs on endocytic accessory proteins andreceptor trafficking in HeLa cells. J Biol Chem, 278(46) pp. 45160–45170, 2003.
[162] Orth JD, Krueger EW, Weller SG, and McNiven MA. A novel endocytic mechanism of epidermalgrowth factor receptor sequestration and internalization. Cancer Res, 66(7) pp. 3603–3610,2006.
[163] Baulida J, Kraus MH, Alimandi M, Fiore PPD, and Carpenter G. All ErbB receptors otherthan the epidermal growth factor receptor are endocytosis impaired. J Biol Chem, 271(9) pp.5251–5257, 1996.
[164] Vonna L, Wiedemann A, Aepfelbacher M, and Sackmann E. Micromechanics of filopodia medi-ated capture of pathogens by macrophages. Eur Biophys J, 36(2) pp. 145–151, 2007.
[165] Kress H, Stelzer EHK, Holzer D, Buss F, Griffiths G, et al. Filopodia act as phagocytic tentaclesand pull with discrete steps and a load-dependent velocity. Proc Natl Acad Sci U S A, 104(28)pp. 11633–11638, 2007.
[166] den Hartigh JC, van Bergen en Henegouwen PM, Verkleij AJ, and Boonstra J. The EGF receptoris an actin-binding protein. J Cell Biol, 119(2) pp. 349–355, 1992.
[167] Sheetz MP, Turney S, Qian H, and Elson EL. Nanometre-level analysis demonstrates that lipidflow does not drive membrane glycoprotein movements. Nature, 340(6231) pp. 284–288, 1989.
[168] Caspi A, Yeger O, Grosheva I, Bershadsky AD, and Elbaum M. A new dimension in retrogradeflow: centripetal movement of engulfed particles. Biophys J, 81(4) pp. 1990–2000, 2001.
[169] Keating E, Nohe A, and Petersen N. Studies of distribution, location and dynamic properties ofEGFR on the cell surface measured by image correlation spectroscopy. Eur Biophys J, 2007.
[170] Arrio-Dupont M, Foucault G, Vacher M, Devaux PF, and Cribier S. Translational diffusion ofglobular proteins in the cytoplasm of cultured muscle cells. Biophys J, 78(2) pp. 901–907, 2000.
[171] Luby-Phelps K. Cytoarchitecture and physical properties of cytoplasm: volume, viscosity, diffu-sion, intracellular surface area. Int Rev Cytol, 192 pp. 189–221, 2000.
[172] Tilney LG and Tilney MS. The wily ways of a parasite: induction of actin assembly by listeria.Trends Microbiol, 1(1) pp. 25–31, 1993.
[173] Pelkmans L, Püntener D, and Helenius A. Local actin polymerization and dynamin recruitmentin SV40-induced internalization of caveolae. Science, 296(5567) pp. 535–539, 2002.
[174] Merrifield CJ, Moss SE, Ballestrem C, Imhof BA, Giese G, et al. Endocytic vesicles move at thetips of actin tails in cultured mast cells. Nat Cell Biol, 1(1) pp. 72–74, 1999.
[175] Taunton J, Rowning BA, Coughlin ML, Wu M, Moon RT, et al. Actin-dependent propulsion ofendosomes and lysosomes by recruitment of N-WASP. J Cell Biol, 148(3) pp. 519–530, 2000.
[176] Murray JW, Bananis E, and Wolkoff AW. Reconstitution of ATP-dependent movement of endo-cytic vesicles along microtubules in vitro: an oscillatory bidirectional process. Mol Biol Cell,11(2) pp. 419–433, 2000.
[177] King SJ and Schroer TA. Dynactin increases the processivity of the cytoplasmic dynein motor.Nat Cell Biol, 2(1) pp. 20–24, 2000.
[178] Suh J, Wirtz D, and Hanes J. Efficient active transport of gene nanocarriers to the cell nucleus.Proc Natl Acad Sci U S A, 100(7) pp. 3878–3882, 2003.
[179] Berg K, Selbo PK, Prasmickaite L, Tjelle TE, Sandvig K, et al. Photochemical internalization: anovel technology for delivery of macromolecules into cytosol. Cancer Res, 59(6) pp. 1180–1183,1999.
[180] Høgset A, Prasmickaite L, Tjelle TE, and Berg K. Photochemical transfection: a new technologyfor light-induced, site-directed gene delivery. Hum Gene Ther, 11(6) pp. 869–880, 2000.
[181] Selbo PK, Sivam G, Fodstad O, Sandvig K, and Berg K. In vivo documentation of photochemical
91
BIBLIOGRAPHY
internalization, a novel approach to site specific cancer therapy. Int J Cancer, 92(5) pp. 761–766,2001.
[182] Ndoye A, Dolivet G, Høgset A, Leroux A, Fifre A, et al. Eradication of p53-mutated head andneck squamous cell carcinoma xenografts using nonviral p53 gene therapy and photochemicalinternalization. Mol Ther, 13(6) pp. 1156–1162, 2006.
[183] Nishiyama N, Iriyama A, Jang WD, Miyata K, Itaka K, et al. Light-induced gene transfer frompackaged DNA enveloped in a dendrimeric photosensitizer. Nat Mater, 4(12) pp. 934–941, 2005.
[184] Falk J. Porphyrins and metalloporphyrins. Elsevier publishing company, 1964.[185] LeGourrierec D, Andersson M, Davidsson J, Mukhtar E, Sun L, et al. Photoinduced elec-
tron transfer from a higher excited state of a porphyrin in a zinc porphyrin-ruthenium(II) tris-bipyridine dyad. J Phys Chem A, 103 (5) pp. 557–559, 1999.
[186] Bonnett R, McGarvey DJ, Harriman A, Land EJ, Truscott TG, et al. Photophysical properties ofmeso-tetraphenylporphyrin and some meso-tetra(hydroxyphenyl)porphyrins. Photochem Photo-biol, 48(3) pp. 271–276, 1988.
[187] Schmidt R. Photosensitized generation of singlet oxygen. Photochem Photobiol, 82(5) pp. 1161–1177, 2006.
[188] Mehrdad Z, Noll A, Grabner EW, and Schmidt R. Sensitization of singlet oxygen via encountercomplexes and via exciplexes of ππ∗ triplet excited sensitizers and oxygen. Photochem PhotobiolSci, 1(4) pp. 263–269, 2002.
[189] Korinek M, Dedic R, Svoboda A, and Hála J. Luminescence study of singlet oxygen productionby meso-tetraphenylporphine. J Fluoresc, 14(1) pp. 71–74, 2004.
[190] Berlin RD and Oliver JM. Surface functions during mitosis. II. quantitation of pinocytosis andkinetic characterization of the mitotic cycle with a new fluorescence technique. J Cell Biol, 85(3)pp. 660–671, 1980.
[191] Probes M. Product information: dextran conjugates. Revised 05-april-2006.[192] Seksek O, Biwersi J, and Verkman AS. Translational diffusion of macromolecule-sized solutes
in cytoplasm and nucleus. J Cell Biol, 138(1) pp. 131–142, 1997.[193] Akinc A and Langer R. Measuring the pH environment of DNA delivered using nonviral vectors:
implications for lysosomal trafficking. Biotechnol Bioeng, 78(5) pp. 503–508, 2002.[194] Capan Y, Woo BH, Gebrekidan S, Ahmed S, and DeLuca PP. Stability of poly(L-lysine)-
complexed plasmid DNA during mechanical stress and DNase I treatment. Pharm Dev Technol,4(4) pp. 491–498, 1999.
[195] Ramsay E and Gumbleton M. Polylysine and polyornithine gene transfer complexes: a studyof complex stability and cellular uptake as a basis for their differential in-vitro transfection effi-ciency. J Drug Target, 10(1) pp. 1–9, 2002.
[196] Itaka K, Harada A, Yamasaki Y, Nakamura K, Kawaguchi H, et al. In situ single cell observa-tion by fluorescence resonance energy transfer reveals fast intra-cytoplasmic delivery and easyrelease of plasmid DNA complexed with linear polyethylenimine. J Gene Med, 6(1) pp. 76–84,2004.
[197] Huth S, Hoffmann F, von Gersdorff K, Laner A, Reinhardt D, et al. Interaction of polyaminegene vectors with RNA leads to the dissociation of plasmid DNA-carrier complexes. J GeneMed, 8(12) pp. 1416–1424, 2006.
[198] van Weert AW, Dunn KW, Gueze HJ, Maxfield FR, and Stoorvogel W. Transport from lateendosomes to lysosomes, but not sorting of integral membrane proteins in endosomes, dependson the vacuolar proton pump. J Cell Biol, 130(4) pp. 821–834, 1995.
[199] Spikes JD and Straight R. Sensitized photochemical processes in biological systems. Annu RevPhys Chem, 18 pp. 409–436, 1967.
92
[200] Ochsner M. Photophysical and photobiological processes in the photodynamic therapy of tu-mours. J Photochem Photobiol B, 39(1) pp. 1–18, 1997.
[201] Boekelheide K, Eveleth J, Tatum AH, and Winkelman JW. Microtubule assembly inhibition byporphyrins and related compounds. Photochem Photobiol, 46(5) pp. 657–661, 1987.
[202] Tian F, Johnson EM, Zamarripa M, Sansone S, and Brancaleon L. Binding of porphyrins totubulin heterodimers. Biomacromolecules, 8(12) pp. 3767–3778, 2007.
[203] Berg K. The unpolymerized form of tubulin is the target for microtubule inhibition by photoac-tivated tetra(4-sulfonatophenyl)porphine. Biochim Biophys Acta, 1135(2) pp. 147–153, 1992.
[204] Berg K, Western A, Bommer JC, and Moan J. Intracellular localization of sulfonated meso-tetraphenylporphines in a human carcinoma cell line. Photochem Photobiol, 52(3) pp. 481–487,1990.
[205] Berg K, Moan J, Bommer JC, and Winkelman JW. Cellular inhibition of microtubule assemblyby photoactivated sulphonated meso-tetraphenylporphines. Int J Radiat Biol, 58(3) pp. 475–487,1990.
[206] Zerial M and McBride H. Rab proteins as membrane organizers. Nat Rev Mol Cell Biol, 2(2) pp.107–117, 2001.
[207] Jordens I, Marsman M, Kuijl C, and Neefjes J. Rab proteins, connecting transport and vesiclefusion. Traffic, 6(12) pp. 1070–1077, 2005.
[208] Pfeffer S. A model for Rab GTPase localization. Biochem Soc Trans, 33(Pt 4) pp. 627–630,2005.
[209] Ali BR and Seabra MC. Targeting of Rab GTPases to cellular membranes. Biochem Soc Trans,33(Pt 4) pp. 652–656, 2005.
[210] Goody RS, Rak A, and Alexandrov K. The structural and mechanistic basis for recycling of rabproteins between membrane compartments. Cell Mol Life Sci, 62(15) pp. 1657–1670, 2005.
[211] Davies MJ. Singlet oxygen-mediated damage to proteins and its consequences. Biochem BiophysRes Commun, 305(3) pp. 761–770, 2003.
[212] Pfeffer SR. Motivating endosome motility. Nat Cell Biol, 1(6) pp. E145–E147, 1999.[213] Hammer JA and Wu XS. Rabs grab motors: defining the connections between Rab GTPases and
motor proteins. Curr Opin Cell Biol, 14(1) pp. 69–75, 2002.
93

Acknowledgments
This work would not have been possible without the help of many people. First, I wouldlike to thank Prof. Christoph Bräuchle for giving me the opportunity to work in his excel-lently equipped laboratories. His continuous support and encouragement throughout my PhDhelped me to work out my own ideas and to concentrate on relevant issues.
It was a great privilege to cooperate with Prof. Ernst Wagner and Manfred Ogris. Duringmany fruitful discussions I was fortunate to benefit from their extensive pharmaceutical andgene therapeutic knowledge.
This PhD would not have existed in this form without the help of Nadia Ruthardt. I am deeplyindebted to her for teaching me the necessary biological background and how to write papersas well as for giving me moral support during these three years. Nadia, I’ll provide you withtons of licorice when I’m back in the Netherlands!
I owe many thanks to Carolin Fella and Katharina von Gersdorff who prepared a lot of sam-ples for me and who assisted me in performing experiments in their laboratories. Our cooper-ation was not limited to the necessary meetings, but during these three years we also sharedour daily PhD-related problems. Thank you!
Much appreciation is also extended to my students Caro Kurth, Jan Lich, Richard Moll andDaniel Wacker. I very much enjoyed working with you! A special thanks for my ex-studentand now colleague Anna Sauer for being so patient with me during the last few months.
I would like to thank all my colleagues and ex-colleagues from the Bräuchle group for thegood atmosphere. In particular I thank Iko, Robert, Adam, Johanna, Ondrej, Sergey, PeterSchwaderer, Sebastian, Stephan, Julia, Dina, Christophe and Barbara.
For various reasons I thank the following people from the Wagner group: Julia Klöckner,Julia Fahrmeir, Gelja Maiwald, Wolfgang Rödl, Martin Meyer and Olga Brück.
I am grateful to Monika Franke for preparing and culturing the cells and to Moritz Ehrl andSilke Steger for helping me to find my way in German bureaucracy.
Furthermore, I extend my warmest appreciation to Kevin Braeckmans and Niek Sanders fromGhent University who made life much easier during the first six months of my PhD.
Finally, above all, my deepest thanks go to Paul. His moral support was indispensable forthis work.
95

List of publications
Peer-reviewed publications
De Bruin K, Ruthardt N, von Gersdorff K, Bausinger R, Ogris M, Wagner E, Bräuchle C.Cellular dynamics of EGF receptor-targeted synthetic viruses, Mol. Ther. 15 (7), p1297
De Bruin KG, Fella C, Ogris M, Wagner E, Bräuchle C. Dynamics of photoinduced endo-somal release of polyplexes, accepted for publication in Journal of Controlled Release
Oral presentations
De Bruin KG, Photochemical release of artificial viruses, Gene Therapy Meeting, LMU Mu-nich, June 2007
Poster presentations
De Bruin KG, Ruthardt N, Braeckmans K, Wagner E, Bräuchle C, Uptake kinetics and dy-namics of functionalized and non-functionalized polyplexes in HUH7 cells, Annual Meetingof the European Society of Gene Therapy, Athens, November 2006
De Bruin KG, Ruthardt N, Wagner E, Bräuchle C, Uptake kinetics and dynamics of function-alized and non-functionalized polyplexes in HUH7 cells, CeNS Winter School 2007, Mautern-dorf, February 2007
De Bruin KG, Ruthardt N, Braeckmans K, Wagner E, Bräuchle C, Observation of nanoparti-cle uptake in living cells by single particle tracking, 58. Mosbacher Kolloquium (Gesellschaftfür Biochemie und Molekularbiologie), Mosbach, March 2007
De Bruin KG, Ruthardt N, Fella C, Ogris M, Wagner E, Bräuchle C, Effects of photochemi-cal release on a single cell level, Annual Meeting of the European Society of Gene Therapy,Rotterdam, November 2007
De Bruin KG, Fella C, Ogris M, Wagner E, Ruthardt N, Bräuchle C, A microscopic viewon photoinduced polyplex release from endosomes, 10th European Symposium on Drug De-livery, Noordwijk, April 2008
97


Curriculum Vitae
Karla de Bruin
Date of birth 23 July 1979Place of birth Almelo, NetherlandsNationality DutchMarital status Unmarried
Education
Jan 2005 – July 2008 PhD in physical chemistry under supervision ofProf. C. Bräuchle, LMU Munich
Sep 2002 – March 2003 Master thesis in physical chemistry undersupervision of Prof. F. Merkt, ETH Zurich
Sep 1998 – Aug 2003 MSc. in chemistry, University of AmsterdamSep 1991 – June 1997 High school, Almelo, Netherlands
Awards and scholarships
April 2008 Jan Feijen Prize for the best scientific poster presented duringthe 10th European Symposium on Controlled Drug Delivery
Sep 2003 – May 2004 "Bonusbeurs" scholarship of the University of AmsterdamSep 2002 – March 2003 Erasmus scholarshipSep 2002 – March 2003 Scholarship of the "Stichting Vrijvrouwe van Renswoude"
99