Embed Size (px)
Citation preview
Fund Name
ASSET C L ASS
Templeton Asian Growth Fund
SEPTEMBER 30, 2011
SEMIANNUAL REPORTAND SHAREHOLDER LETTER
A series of Templeton Global Investment Trust
I NTERNAT IONAL
Sign up for electronic deliveryon franklintempleton.com
Franklin Templeton InvestmentsGain From Our Perspective®
Franklin Templeton’s distinct multi-manager structure combines thespecialized expertise of three world-class investment management groups—Franklin, Templeton and Mutual Series.
Each of our portfolio management groups operates autonomously, relying on its own research and staying true to the unique investment disciplines that underlie its success.
Franklin. Founded in 1947, Franklin is a recognized leader in fixed income investingand also brings expertise in growth- and value-style U.S. equity investing.
Templeton. Founded in 1940, Templeton pioneered international investing and, in 1954, launched what has become the industry’s oldest global fund. Today, withoffices in over 25 countries, Templeton offers investors a truly global perspective.
Mutual Series. Founded in 1949, Mutual Series is dedicated to a unique style of value investing, searching aggressively for opportunity among what it believes are undervalued stocks, as well as arbitrage situations and distressed securities.
Because our management groups work independently and adhere to differentinvestment approaches, Franklin, Templeton and Mutual Series funds typicallyhave distinct portfolios. That’s why our funds can be used to build trulydiversified allocation plans covering every major asset class.
At Franklin Templeton Investments, we seek to consistently provide investors with exceptional risk-adjusted returns over the long term, as well as the reliable,accurate and personal service that has helped us become one of the most trustednames in financial services.
TRUE DIVERSIFICATION
RELIABILITY YOU CAN TRUST
SPECIALIZED EXPERTISE
MUTUAL FUNDS | RETIREMENT PLANS | 529 COLLEGE SAVINGS PLANS | SEPARATE ACCOUNTS
Not part of the semiannual report
Not part of the semiannual report | 1
Semiannual Report
Templeton Asian Growth Fund . . . . . . . . . . . 3
Performance Summary . . . . . . . . . . . . . . . . . 8
Your Fund’s Expenses . . . . . . . . . . . . . . . . . . 11
Financial Highlights and Statement of Investments . . . . . . . . . . . . . . 13
Financial Statements . . . . . . . . . . . . . . . . . . 18
Notes to Financial Statements . . . . . . . . . . . 21
Shareholder Information . . . . . . . . . . . . . . . . 31
Shareholder Letter . . . . . . . . . . . . . . . . . . . 1
Contents
Shareholder LetterDear Shareholder:
During the six months ended September 30, 2011, Asian economies as awhole continued to grow faster than developed economies and other emergingmarket economies. Investors, however, focused less on Asian economic andequity fundamentals but rather on U.S. fiscal issues and the prolonged euro-zone sovereign debt crisis. As a result, Asian stocks, along with developed andother emerging market stocks, declined significantly in August and September,posting losses for the period.
Although the recent environment has been challenging, we remain cautiouslyoptimistic about Asian economies as they continue to show growth. Keep inmind we have navigated through past periods of economic uncertainty andmarket volatility by remaining committed to our long-term perspective anddisciplined investment approach. First and foremost for us, this means usingour on-the-ground research team to conduct rigorous, company-by-companyanalysis to find what we consider to be bargain opportunities.
Templeton Asian Growth Fund’s semiannual report goes into greater detailabout prevailing conditions during the period under review. In addition, youwill find Fund performance data, financial information and a discussion aboutinvestment decisions. Please remember all securities markets fluctuate, as domutual fund share prices.
If you would like more frequent updates, franklintempleton.com providesdaily prices, monthly performance figures, portfolio holdings and other infor-mation. You can also access your account, buy and sell shares, read timelyarticles, and find helpful financial planning tools. We hope you will takeadvantage of these online services.
NOT FDIC INSURED | MAY LOSE VALUE | NO BANK GUARANTEE
Historically, patient investors have achieved rewarding results by evaluatingtheir goals, diversifying their assets globally and maintaining a disciplinedinvestment program, all hallmarks of the Templeton investment philosophydeveloped more than 50 years ago. We continue to recommend investors con-sult their financial advisors and review their portfolios to design a long-termstrategy and portfolio allocation that meet their individual needs, goals and risktolerance. We firmly believe most people benefit from professional advice andthat advice is invaluable as investors navigate changing market environments.
We thank you for investing with Franklin Templeton, welcome your questionsand comments, and look forward to serving your investment needs in theyears ahead.
Sincerely,
Mark MobiusExecutive ChairmanTempleton Emerging Markets Group
This letter reflects our analysis and opinions as of September 30, 2011. The information is not a complete analysisof every aspect of any market, country, industry, security or fund. Statements of fact are from sources consideredreliable.
2 | Not part of the semiannual report
Semiannual Report | 3
This semiannual report for Templeton Asian Growth Fund covers the periodended September 30, 2011.
Economic and Market Overview
The fundamental and financial strength of Asian economies was evident duringthe reporting period as they continued to report strong economic data, albeit a moderation from 2010. This strength, however, was not reflected in Asia’sequity prices as the eurozone’s sovereign debt crisis and U.S. fiscal concernsled investors to hold cash, shying away from investments in developed andemerging markets.
In Asia, inflation remained a key concern. While some economies such as Indiaand Thailand maintained a tightening monetary policy to curb inflationarypressures, the fragile global environment led countries such as Indonesia andSouth Korea to use a more neutral policy. In China, inflation showed signsof moderation as government efforts to curb food prices succeeded. As aresult, China also refrained from raising interest rates toward the end of thereporting period.
Semiannual Report
Templeton Asian Growth FundYour Fund’s Goal and Main Investments: Templeton Asian Growth Fund seeks long-
term capital appreciation by investing, under normal market conditions, at least 80% of its net assets in
securities of companies located in the Asian region (excluding Australia, New Zealand and Japan) as
defined in the prospectus. Such companies have their principal securities trading markets in, derive at
least 50% of their total revenues or profits from goods or services produced or sales made in, have at
least 50% of their assets in, are linked to currencies of, or are organized under the laws of or have
principal offices in, Asia region countries.
The dollar value, number of shares or principal amount, and names of all portfolio holdings are listed in the Fund’sStatement of Investments (SOI). The SOI begins on page 16.
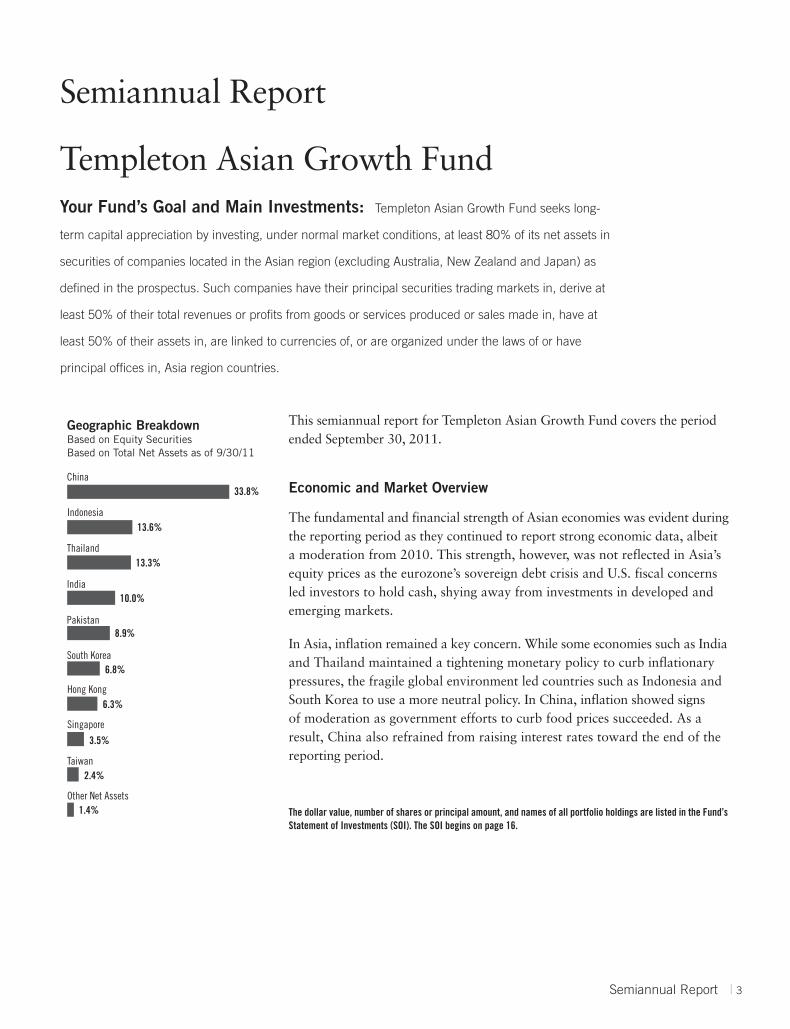
Geographic BreakdownBased on Equity SecuritiesBased on Total Net Assets as of 9/30/11
China
Pakistan
Indonesia
Thailand
India
South Korea
13.6%
13.3%
33.8%
10.0%
8.9%
6.8%
6.3%
3.5%
2.4%
1.4%
Hong Kong
Singapore
Taiwan
Other Net Assets
4 | Semiannual Report
1. Source: © 2011 Morningstar. All Rights Reserved. The information contained herein: (1) is proprietary to Morningstarand/or its content providers; (2) may not be copied or distributed; and (3) is not warranted to be accurate, complete ortimely. Neither Morningstar nor its content providers are responsible for any damages or losses arising from any use ofthis information. The index is unmanaged and includes reinvested dividends. One cannot invest directly in an index,and an index is not representative of the Fund’s portfolio.
Stock prices in Asia, along with stocks in developed and emerging markets,remained largely range bound in the first four months of the reportingperiod. Global stock markets, however, tumbled in the final two months asthe prolonged eurozone debt crisis and lack of a comprehensive solutioncontinued to weigh heavily on investor sentiment. Renewed worries that theU.S. could slip back into a recession further accelerated market declines.
High volatility and increased uncertainty also gave investors reasons to lock inprofits from 2009 and 2010. Many Asian markets returned more than 100%in U.S. dollar (USD) terms during those years, as measured by the MSCI All-Country (AC) Asia ex-Japan Index, which tracks stock performance in Asiaexcluding Japan.1 Largely as a result of profit taking, the MSCI AC Asia ex-Japan Index had a -20.68% total return in USD terms during the six-monthreporting period.1
Southeast Asian markets were the strongest performers in the region duringthe reporting period. Strong domestic demand, rising disposable incomesand relatively low unemployment made these economies more resilient toglobal economic uncertainties. Relatively more export-dependent markets,such as China and South Korea, however, underperformed their regionalpeers.
Investment Strategy
When choosing equity investments for the Fund, we apply a fundamentalresearch, value-oriented, long-term approach, focusing on the market price of acompany’s securities relative to our evaluation of the company’s long-termearnings, asset value and cash flow potential. As we look for investments, weconsider specific companies, rather than sectors, while doing in-depth researchto assess factors such as management strength and local conditions. We alsoconsider a company’s profit and loss outlook, balance sheet strength, cash flowtrends and asset value in relation to the current price.
Performance Overview
Templeton Asian Growth Fund – Class A had a -24.45% cumulative totalreturn for the six months ended September 30, 2011. In comparison, the MSCIAC Asia ex-Japan Index had a -20.68% total return for the same period.1
Performance data represent past
performance, which does not
guarantee future results. Investment
return and principal value will
fluctuate, and you may have a gain
or loss when you sell your shares.
Current performance may differ
from figures shown. Please visit
franklintempleton.com or call
(800) 342-5236 for most recent
month-end performance.
Semiannual Report | 5
Please note index performance information is provided for reference and we donot attempt to track any index but rather undertake investments on the basis offundamental research. In addition, the Fund’s return reflects the effect of feesand expenses for professional management, while an index does not have suchcosts. You can find more of the Fund’s performance data in the PerformanceSummary beginning on page 8.
Manager’s Discussion
For the six months under review, three of the largest detractors from the Fund’sabsolute performance were China VTM (Vanadium Titano-Magnetite) Mining,a major iron ore mine operator in China’s Sichuan Province; Chalco (AluminumCorporation of China), the country’s leading producer of alumina and primaryaluminum products; and Hyundai Development, one of South Korea’s leadingresidential property developers. Lower iron ore prices and general iron ore mar-ket weakness led China VTM Mining’s stock price to correct during the period.However, the company’s favorable long-term demand outlook, driven by China’ssteel production, as well as what we considered attractive valuations and highreturn potential on equity, led us to maintain a long-term positive view of thecompany. Chalco’s share price declined during the six-month period due to poorearnings results, lower aluminum prices and economic slowdown concerns inChina. Taking a long-term view, however, we believe Chalco is well positionedto benefit from China’s continuing growth. In our view, a long-term potentialuptrend in aluminum prices combined with demand from China’s manufacturing,construction and consumer segments could support the company businesses.Hyundai Development’s share price lagged due to the bankruptcy contingen-cies of small construction firms. However, in our assessment, the company’sstrong brand recognition coupled with relatively low interest rates could sup-port Hyundai Development, and we continued to hold the stock at period-end.
The top three contributors to the Fund’s absolute performance during the six-month reporting period were Indonesia’s major car and motorcycle companyAstra International, Korean apparel manufacturer Avista and China’s leadingintegrated energy company Sinopec (China Petroleum & Chemical). In addi-tion to having market leadership and an extensive distribution network in theautomotive industry, Astra is engaged in financial services, heavy equipmentand mining, agribusiness, information technology (IT) and infrastructure. In
6 | Semiannual Report
our view, the wide scope of Astra’s business interests positions the companywell to benefit from Indonesia’s robust economic growth, higher income levelsand the availability of affordable credit. Sinopec’s share price remained relativelydefensive during the market correction. Lower oil prices and the company’sability to limit losses in its refining business despite the government’s pricecontrols alleviated some market concerns. Avista benefited from recoveringconsumer demand in South Korea. The company’s numerous fashion brandsand broad product offerings allowed it to target a wide range of consumers,providing a more diversified earnings base.
Portfolio inflows and our ongoing search for undervalued companies led usto increase the Fund’s investments in India and China via Hong Kong-listedChina H and Red Chip shares, as well as initiate investment in Singapore.2
We also identified companies with what we considered attractive fundamentalsand selectively added to our positions in South Korea, Pakistan and Thailand.Consequently, the Fund expanded its holdings in capital goods, oil and gasexploration and production, coal and consumable fuels, metals and mining, ITservices and food retail companies. Key purchases included new investmentin Singapore’s SembCorp Marine, a leading global rig builder, and additionalinvestments in CNOOC, China’s largest offshore oil and gas exploration andproduction company, and the aforementioned China VTM Mining.
Oil, gas and consumable fuels, banking, automobile, and apparel and luxurygoods companies continued to account for significant positions in the Fund,highlighting our favorable outlook for consumer- and commodity-relatedcompanies due to rising per capita incomes and increasing consumption inemerging markets. The valuations of some commodity companies becamemore attractive to us after recent commodity price declines. Because compa-nies do not benefit equally from rising commodity prices, we continued to bevery selective in deciding on investment opportunities, as is consistent withour long-term, value-oriented investment strategy.
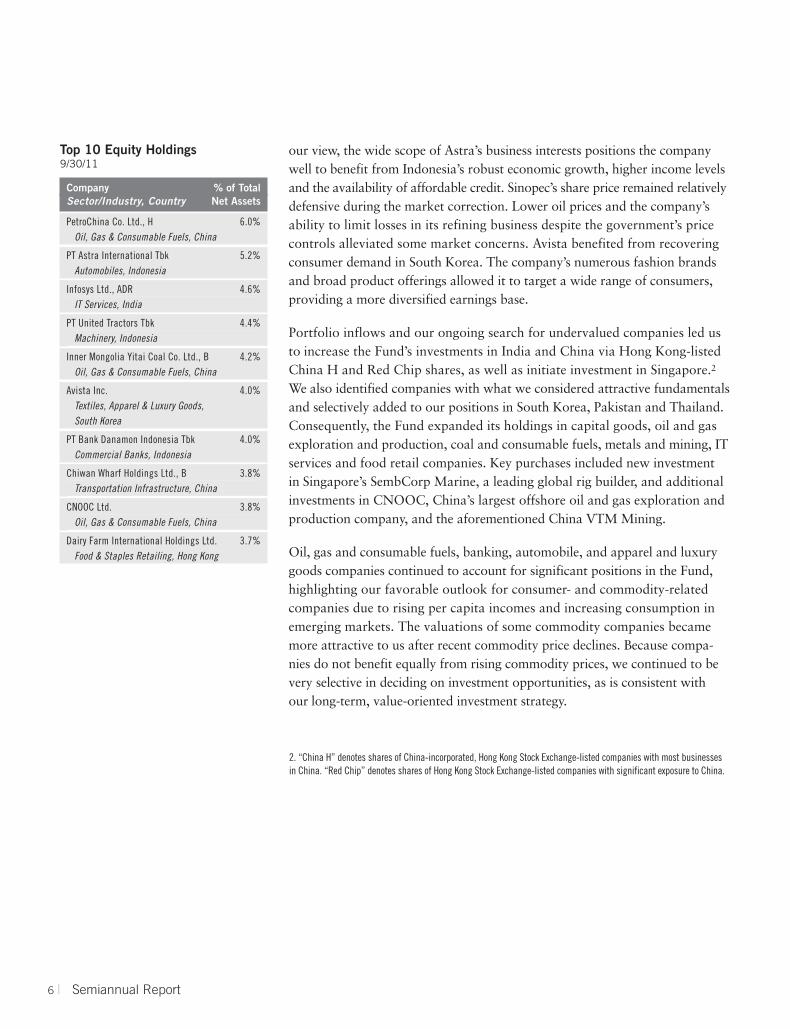
Top 10 Equity Holdings 9/30/11
Company % of Total Sector/Industry, Country Net Assets
PetroChina Co. Ltd., H 6.0%Oil, Gas & Consumable Fuels, China
PT Astra International Tbk 5.2%Automobiles, Indonesia
Infosys Ltd., ADR 4.6%IT Services, India
PT United Tractors Tbk 4.4%Machinery, Indonesia
Inner Mongolia Yitai Coal Co. Ltd., B 4.2%Oil, Gas & Consumable Fuels, China
Avista Inc. 4.0%Textiles, Apparel & Luxury Goods,South Korea
PT Bank Danamon Indonesia Tbk 4.0%Commercial Banks, Indonesia
Chiwan Wharf Holdings Ltd., B 3.8%Transportation Infrastructure, China
CNOOC Ltd. 3.8%Oil, Gas & Consumable Fuels, China
Dairy Farm International Holdings Ltd. 3.7%Food & Staples Retailing, Hong Kong
2. “China H” denotes shares of China-incorporated, Hong Kong Stock Exchange-listed companies with most businessesin China. “Red Chip” denotes shares of Hong Kong Stock Exchange-listed companies with significant exposure to China.
Semiannual Report | 7
Thank you for your participation in Templeton Asian Growth Fund. We lookforward to serving your future investment needs.
Mark Mobius
Allan Lam
Dennis Lim
Portfolio Management TeamTempleton Asian Growth Fund
The foregoing information reflects our analysis, opinions and portfolio holdings as of September 30, 2011, the endof the reporting period. The way we implement our main investment strategies and the resulting portfolio holdingsmay change depending on factors such as market and economic conditions. These opinions may not be relied uponas investment advice or an offer for a particular security. The information is not a complete analysis of everyaspect of any market, country, industry, security or the Fund. Statements of fact are from sources consideredreliable, but the investment manager makes no representation or warranty as to their completeness or accuracy.Although historical performance is no guarantee of future results, these insights may help you understand ourinvestment management philosophy.
8 | Semiannual Report
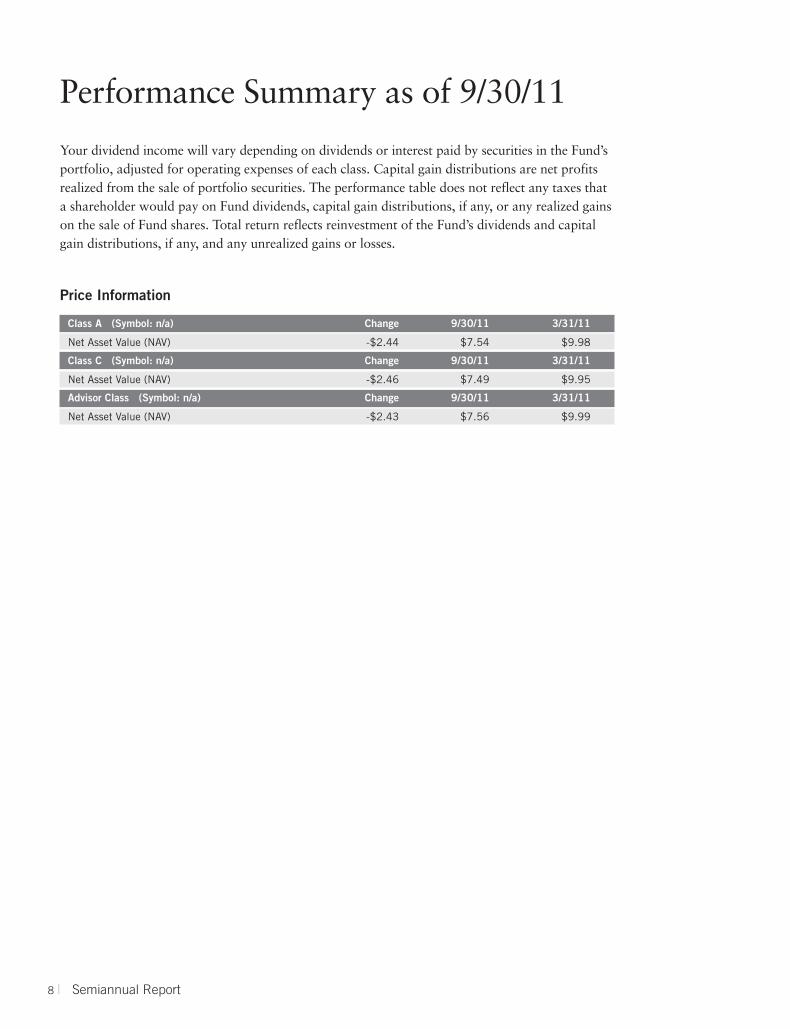
Price Information
Class A (Symbol: n/a) Change 9/30/11 3/31/11
Net Asset Value (NAV) -$2.44 $7.54 $9.98
Class C (Symbol: n/a) Change 9/30/11 3/31/11
Net Asset Value (NAV) -$2.46 $7.49 $9.95
Advisor Class (Symbol: n/a) Change 9/30/11 3/31/11
Net Asset Value (NAV) -$2.43 $7.56 $9.99
Performance Summary as of 9/30/11
Your dividend income will vary depending on dividends or interest paid by securities in the Fund’sportfolio, adjusted for operating expenses of each class. Capital gain distributions are net profitsrealized from the sale of portfolio securities. The performance table does not reflect any taxes thata shareholder would pay on Fund dividends, capital gain distributions, if any, or any realized gainson the sale of Fund shares. Total return reflects reinvestment of the Fund’s dividends and capitalgain distributions, if any, and any unrealized gains or losses.
Semiannual Report | 9
Performance Summary (continued)
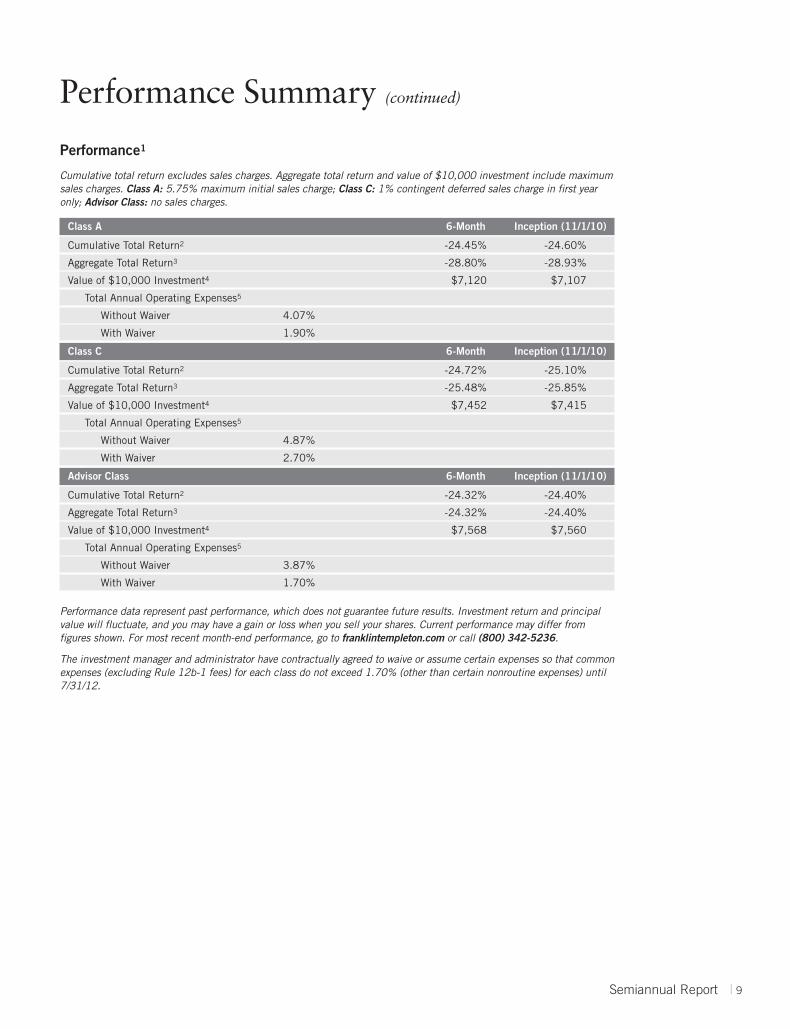
Performance1
Cumulative total return excludes sales charges. Aggregate total return and value of $10,000 investment include maximumsales charges. Class A: 5.75% maximum initial sales charge; Class C: 1% contingent deferred sales charge in first yearonly; Advisor Class: no sales charges.
Class A 6-Month Inception (11/1/10)
Cumulative Total Return2 -24.45% -24.60%
Aggregate Total Return3 -28.80% -28.93%
Value of $10,000 Investment4 $7,120 $7,107
Total Annual Operating Expenses5
Without Waiver 4.07%
With Waiver 1.90%
Class C 6-Month Inception (11/1/10)
Cumulative Total Return2 -24.72% -25.10%
Aggregate Total Return3 -25.48% -25.85%
Value of $10,000 Investment4 $7,452 $7,415
Total Annual Operating Expenses5
Without Waiver 4.87%
With Waiver 2.70%
Advisor Class 6-Month Inception (11/1/10)
Cumulative Total Return2 -24.32% -24.40%
Aggregate Total Return3 -24.32% -24.40%
Value of $10,000 Investment4 $7,568 $7,560
Total Annual Operating Expenses5
Without Waiver 3.87%
With Waiver 1.70%
Performance data represent past performance, which does not guarantee future results. Investment return and principalvalue will fluctuate, and you may have a gain or loss when you sell your shares. Current performance may differ fromfigures shown. For most recent month-end performance, go to franklintempleton.com or call (800) 342-5236.
The investment manager and administrator have contractually agreed to waive or assume certain expenses so that commonexpenses (excluding Rule 12b-1 fees) for each class do not exceed 1.70% (other than certain nonroutine expenses) until7/31/12.
10 | Semiannual Report
Performance Summary (continued)
Endnotes
Special risks are associated with foreign investing, including currency fluctuations, economic instability and political developments. Investmentsin emerging market countries involve heightened risks related to the same factors, in addition to those associated with these markets’ smallersize, lesser liquidity and lack of established legal, political, business and social frameworks to support securities markets. The Fund may alsoexperience greater volatility than a fund that is more broadly diversified geographically. Smaller company stocks have historically had moreprice volatility than large-company stocks, particularly over the short term. The Fund is designed for the aggressive portion of a well-diversifiedportfolio. The Fund is actively managed but there is no guarantee that the manager’s investment decisions will produce the desired results. TheFund’s prospectus also includes a description of the main investment risks.
Class C: These shares have higher annual fees and expenses than Class A shares.
Advisor Class: Shares are available to certain eligible investors as described in the prospectus.
1. If the manager and administrator had not waived fees, the Fund’s total return would have been lower.
2. Cumulative total return represents the change in value of an investment over the periods indicated.
3. Aggregate total return represents the change in value of an investment over the periods indicated. Since the Fund has existed for less than oneyear, average annual total returns are not available.
4. These figures represent the value of a hypothetical $10,000 investment in the Fund over the periods indicated.
5. Figures are as stated in the Fund’s prospectus current as of the date of this report. In periods of market volatility, assets may decline significantly,causing total annual Fund operating expenses to become higher than the figures shown.
Semiannual Report | 11
Your Fund’s Expenses
As a Fund shareholder, you can incur two types of costs:
• Transaction costs, including sales charges (loads) on Fund purchases; and
• Ongoing Fund costs, including management fees, distribution and service (12b-1) fees, and otherFund expenses. All mutual funds have ongoing costs, sometimes referred to as operating expenses.
The following table shows ongoing costs of investing in the Fund and can help you understandthese costs and compare them with those of other mutual funds. The table assumes a $1,000investment held for the six months indicated.
Actual Fund Expenses
The first line (Actual) for each share class listed in the table provides actual account values andexpenses. The “Ending Account Value” is derived from the Fund’s actual return, which includesthe effect of Fund expenses.
You can estimate the expenses you paid during the period by following these steps. Of course,your account value and expenses will differ from those in this illustration:
1. Divide your account value by $1,000.If an account had an $8,600 value, then $8,600 ÷ $1,000 = 8.6.
2. Multiply the result by the number under the heading “Expenses Paid During Period.”If Expenses Paid During Period were $7.50, then 8.6 x $7.50 = $64.50.
In this illustration, the estimated expenses paid this period are $64.50.
Hypothetical Example for Comparison with Other Funds
Information in the second line (Hypothetical) for each class in the table can help you compareongoing costs of investing in the Fund with those of other mutual funds. This information maynot be used to estimate the actual ending account balance or expenses you paid during the period.The hypothetical “Ending Account Value” is based on the actual expense ratio for each class andan assumed 5% annual rate of return before expenses, which does not represent the Fund’s actualreturn. The figure under the heading “Expenses Paid During Period” shows the hypothetical expensesyour account would have incurred under this scenario. You can compare this figure with the 5%hypothetical examples that appear in shareholder reports of other funds.
12 | Semiannual Report
Your Fund’s Expenses (continued)
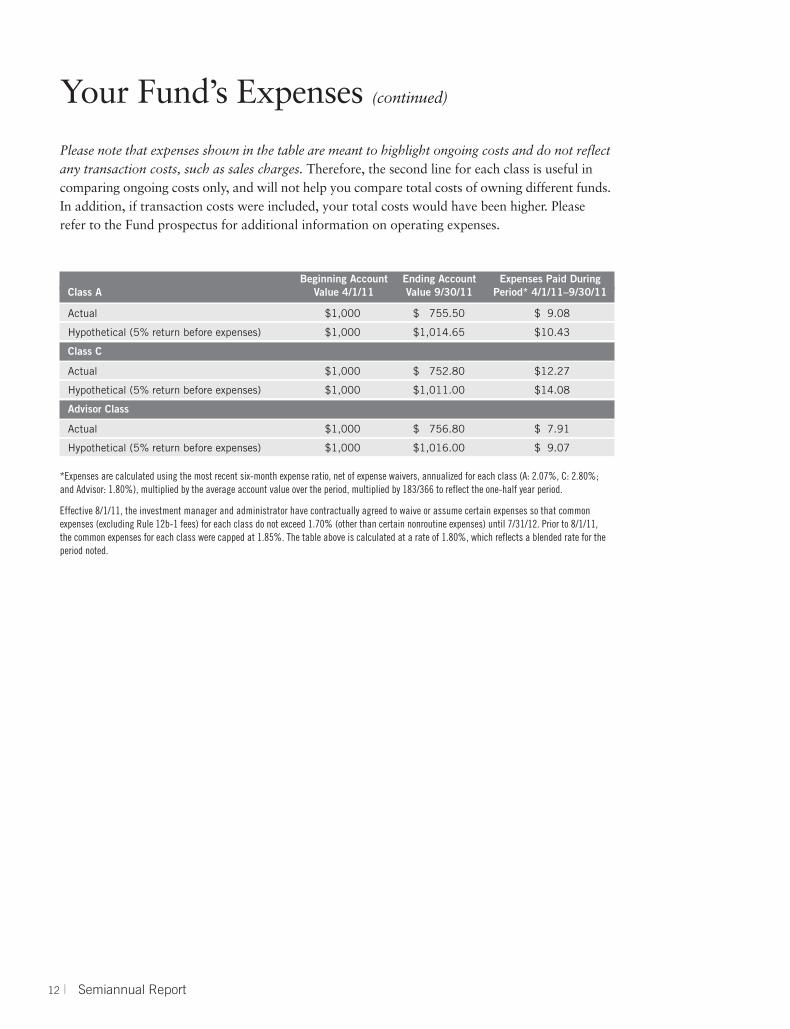
Please note that expenses shown in the table are meant to highlight ongoing costs and do not reflectany transaction costs, such as sales charges. Therefore, the second line for each class is useful incomparing ongoing costs only, and will not help you compare total costs of owning different funds.In addition, if transaction costs were included, your total costs would have been higher. Pleaserefer to the Fund prospectus for additional information on operating expenses.
Beginning Account Ending Account Expenses Paid DuringClass A Value 4/1/11 Value 9/30/11 Period* 4/1/11–9/30/11
Actual $1,000 $ 755.50 $ 9.08
Hypothetical (5% return before expenses) $1,000 $1,014.65 $10.43
Class C
Actual $1,000 $ 752.80 $12.27
Hypothetical (5% return before expenses) $1,000 $1,011.00 $14.08
Advisor Class
Actual $1,000 $ 756.80 $ 7.91
Hypothetical (5% return before expenses) $1,000 $1,016.00 $ 9.07
*Expenses are calculated using the most recent six-month expense ratio, net of expense waivers, annualized for each class (A: 2.07%, C: 2.80%;and Advisor: 1.80%), multiplied by the average account value over the period, multiplied by 183/366 to reflect the one-half year period.
Effective 8/1/11, the investment manager and administrator have contractually agreed to waive or assume certain expenses so that commonexpenses (excluding Rule 12b-1 fees) for each class do not exceed 1.70% (other than certain nonroutine expenses) until 7/31/12. Prior to 8/1/11,the common expenses for each class were capped at 1.85%. The table above is calculated at a rate of 1.80%, which reflects a blended rate for theperiod noted.
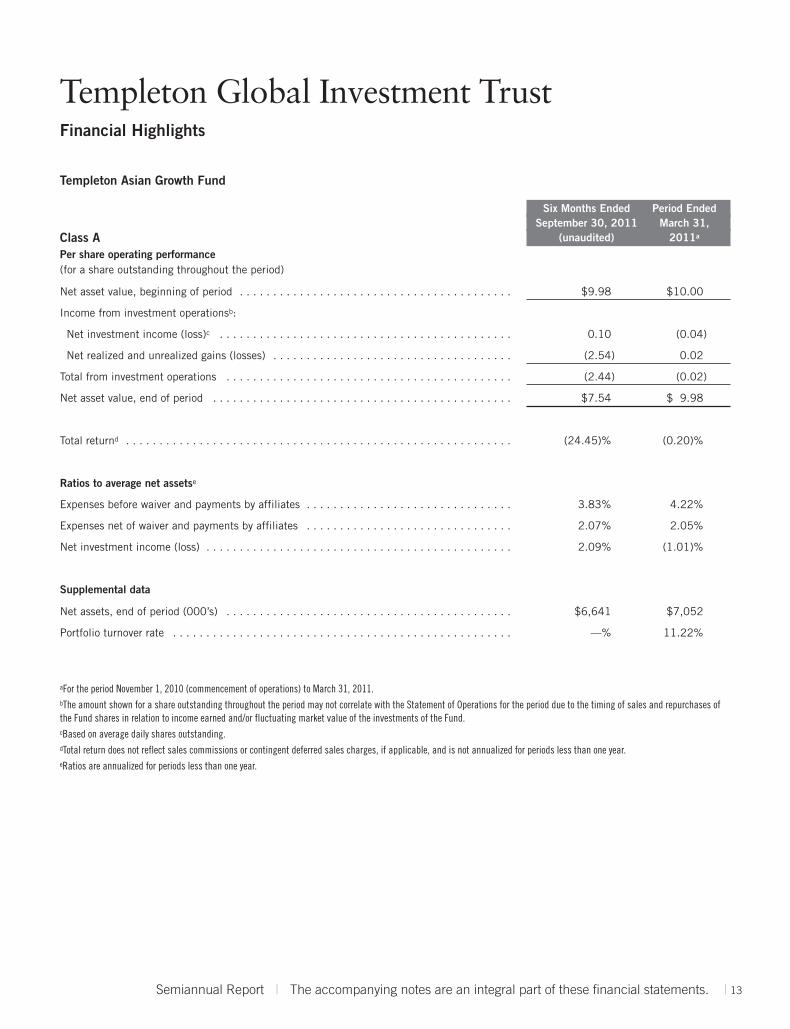
Templeton Global Investment TrustFinancial Highlights
Templeton Asian Growth Fund
Peri Six Months Ended Period EndedSeptember 30, 2011 March 31,
Class A (unaudited) 2011a
Per share operating performance(for a share outstanding throughout the period)
Net asset value, beginning of period . . . . . . . . . . . . . . . . . . . . . . . . . . . . . . . . . . . . . . . . . $9.98 $10.00
Income from investment operationsb:
Net investment income (loss)c . . . . . . . . . . . . . . . . . . . . . . . . . . . . . . . . . . . . . . . . . . . . 0.10 (0.04)
Net realized and unrealized gains (losses) . . . . . . . . . . . . . . . . . . . . . . . . . . . . . . . . . . . . (2.54) 0.02
Total from investment operations . . . . . . . . . . . . . . . . . . . . . . . . . . . . . . . . . . . . . . . . . . . (2.44) (0.02)
Net asset value, end of period . . . . . . . . . . . . . . . . . . . . . . . . . . . . . . . . . . . . . . . . . . . . . $7.54 $ 9.98
Total returnd . . . . . . . . . . . . . . . . . . . . . . . . . . . . . . . . . . . . . . . . . . . . . . . . . . . . . . . . . . (24.45)% (0.20)%
Ratios to average net assetse
Expenses before waiver and payments by affiliates . . . . . . . . . . . . . . . . . . . . . . . . . . . . . . . 3.83% 4.22%
Expenses net of waiver and payments by affiliates . . . . . . . . . . . . . . . . . . . . . . . . . . . . . . . 2.07% 2.05%
Net investment income (loss) . . . . . . . . . . . . . . . . . . . . . . . . . . . . . . . . . . . . . . . . . . . . . . 2.09% (1.01)%
Supplemental data
Net assets, end of period (000’s) . . . . . . . . . . . . . . . . . . . . . . . . . . . . . . . . . . . . . . . . . . . $6,641 $7,052
Portfolio turnover rate . . . . . . . . . . . . . . . . . . . . . . . . . . . . . . . . . . . . . . . . . . . . . . . . . . . —% 11.22%
aFor the period November 1, 2010 (commencement of operations) to March 31, 2011.bThe amount shown for a share outstanding throughout the period may not correlate with the Statement of Operations for the period due to the timing of sales and repurchases ofthe Fund shares in relation to income earned and/or fluctuating market value of the investments of the Fund.cBased on average daily shares outstanding.dTotal return does not reflect sales commissions or contingent deferred sales charges, if applicable, and is not annualized for periods less than one year.eRatios are annualized for periods less than one year.
Semiannual Report | The accompanying notes are an integral part of these financial statements. | 13
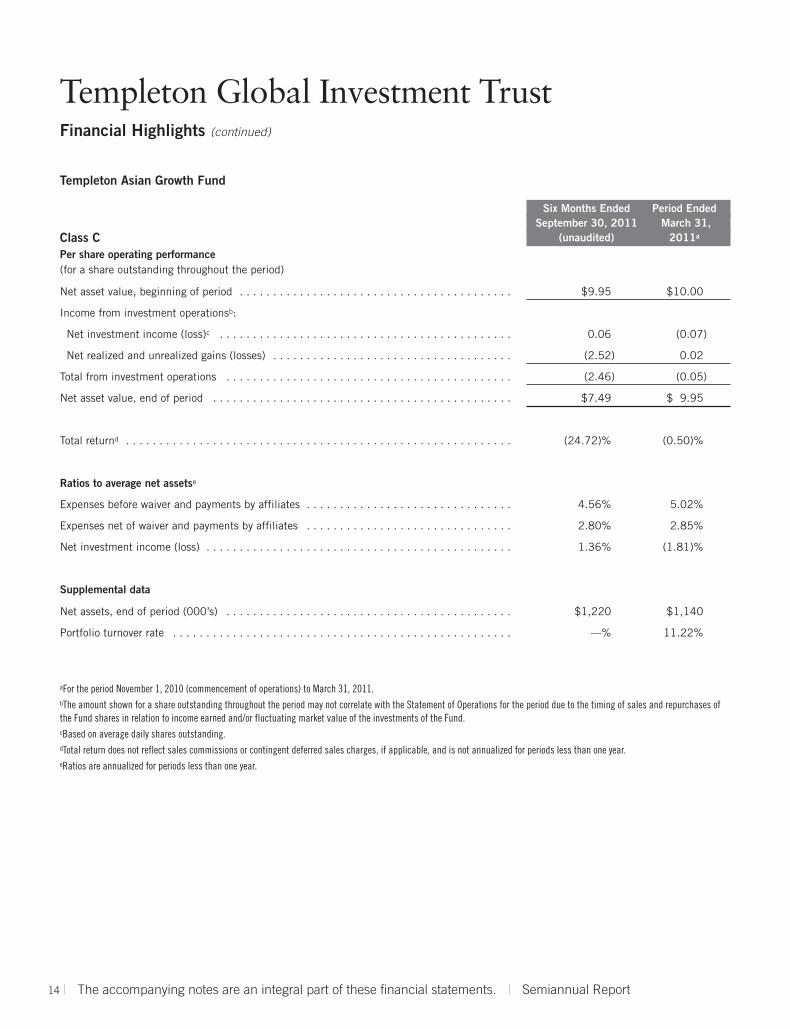
Templeton Global Investment TrustFinancial Highlights (continued)
Templeton Asian Growth Fund
Six Months Ended Period EndedSeptember 30, 2011 March 31,
Class C (unaudited) 2011a
Per share operating performance(for a share outstanding throughout the period)
Net asset value, beginning of period . . . . . . . . . . . . . . . . . . . . . . . . . . . . . . . . . . . . . . . . . $9.95 $10.00
Income from investment operationsb:
Net investment income (loss)c . . . . . . . . . . . . . . . . . . . . . . . . . . . . . . . . . . . . . . . . . . . . 0.06 (0.07)
Net realized and unrealized gains (losses) . . . . . . . . . . . . . . . . . . . . . . . . . . . . . . . . . . . . (2.52) 0.02
Total from investment operations . . . . . . . . . . . . . . . . . . . . . . . . . . . . . . . . . . . . . . . . . . . (2.46) (0.05)
Net asset value, end of period . . . . . . . . . . . . . . . . . . . . . . . . . . . . . . . . . . . . . . . . . . . . . $7.49 $ 9.95
Total returnd . . . . . . . . . . . . . . . . . . . . . . . . . . . . . . . . . . . . . . . . . . . . . . . . . . . . . . . . . . (24.72)% (0.50)%
Ratios to average net assetse
Expenses before waiver and payments by affiliates . . . . . . . . . . . . . . . . . . . . . . . . . . . . . . . 4.56% 5.02%
Expenses net of waiver and payments by affiliates . . . . . . . . . . . . . . . . . . . . . . . . . . . . . . . 2.80% 2.85%
Net investment income (loss) . . . . . . . . . . . . . . . . . . . . . . . . . . . . . . . . . . . . . . . . . . . . . . 1.36% (1.81)%
Supplemental data
Net assets, end of period (000’s) . . . . . . . . . . . . . . . . . . . . . . . . . . . . . . . . . . . . . . . . . . . $1,220 $1,140
Portfolio turnover rate . . . . . . . . . . . . . . . . . . . . . . . . . . . . . . . . . . . . . . . . . . . . . . . . . . . —% 11.22%
aFor the period November 1, 2010 (commencement of operations) to March 31, 2011.bThe amount shown for a share outstanding throughout the period may not correlate with the Statement of Operations for the period due to the timing of sales and repurchases ofthe Fund shares in relation to income earned and/or fluctuating market value of the investments of the Fund.cBased on average daily shares outstanding.dTotal return does not reflect sales commissions or contingent deferred sales charges, if applicable, and is not annualized for periods less than one year.eRatios are annualized for periods less than one year.
14 | The accompanying notes are an integral part of these financial statements. | Semiannual Report
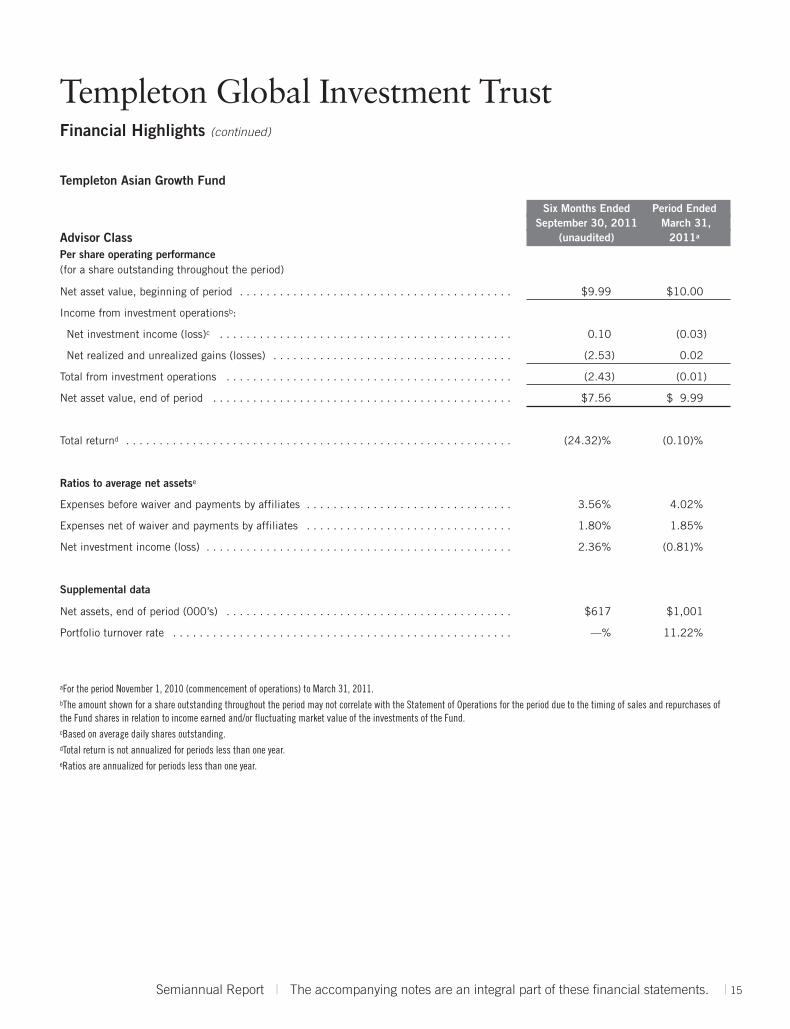
Templeton Global Investment TrustFinancial Highlights (continued)
Templeton Asian Growth Fund
Six Months Ended Period EndedSeptember 30, 2011 March 31,
Advisor Class (unaudited) 2011a
Per share operating performance(for a share outstanding throughout the period)
Net asset value, beginning of period . . . . . . . . . . . . . . . . . . . . . . . . . . . . . . . . . . . . . . . . . $9.99 $10.00
Income from investment operationsb:
Net investment income (loss)c . . . . . . . . . . . . . . . . . . . . . . . . . . . . . . . . . . . . . . . . . . . . 0.10 (0.03)
Net realized and unrealized gains (losses) . . . . . . . . . . . . . . . . . . . . . . . . . . . . . . . . . . . . (2.53) 0.02
Total from investment operations . . . . . . . . . . . . . . . . . . . . . . . . . . . . . . . . . . . . . . . . . . . (2.43) (0.01)
Net asset value, end of period . . . . . . . . . . . . . . . . . . . . . . . . . . . . . . . . . . . . . . . . . . . . . $7.56 $ 9.99
Total returnd . . . . . . . . . . . . . . . . . . . . . . . . . . . . . . . . . . . . . . . . . . . . . . . . . . . . . . . . . . (24.32)% (0.10)%
Ratios to average net assetse
Expenses before waiver and payments by affiliates . . . . . . . . . . . . . . . . . . . . . . . . . . . . . . . 3.56% 4.02%
Expenses net of waiver and payments by affiliates . . . . . . . . . . . . . . . . . . . . . . . . . . . . . . . 1.80% 1.85%
Net investment income (loss) . . . . . . . . . . . . . . . . . . . . . . . . . . . . . . . . . . . . . . . . . . . . . . 2.36% (0.81)%
Supplemental data
Net assets, end of period (000’s) . . . . . . . . . . . . . . . . . . . . . . . . . . . . . . . . . . . . . . . . . . . $617 $1,001
Portfolio turnover rate . . . . . . . . . . . . . . . . . . . . . . . . . . . . . . . . . . . . . . . . . . . . . . . . . . . —% 11.22%
aFor the period November 1, 2010 (commencement of operations) to March 31, 2011.bThe amount shown for a share outstanding throughout the period may not correlate with the Statement of Operations for the period due to the timing of sales and repurchases ofthe Fund shares in relation to income earned and/or fluctuating market value of the investments of the Fund.cBased on average daily shares outstanding.dTotal return is not annualized for periods less than one year.eRatios are annualized for periods less than one year.
Semiannual Report | The accompanying notes are an integral part of these financial statements. | 15
16 | Semiannual Report
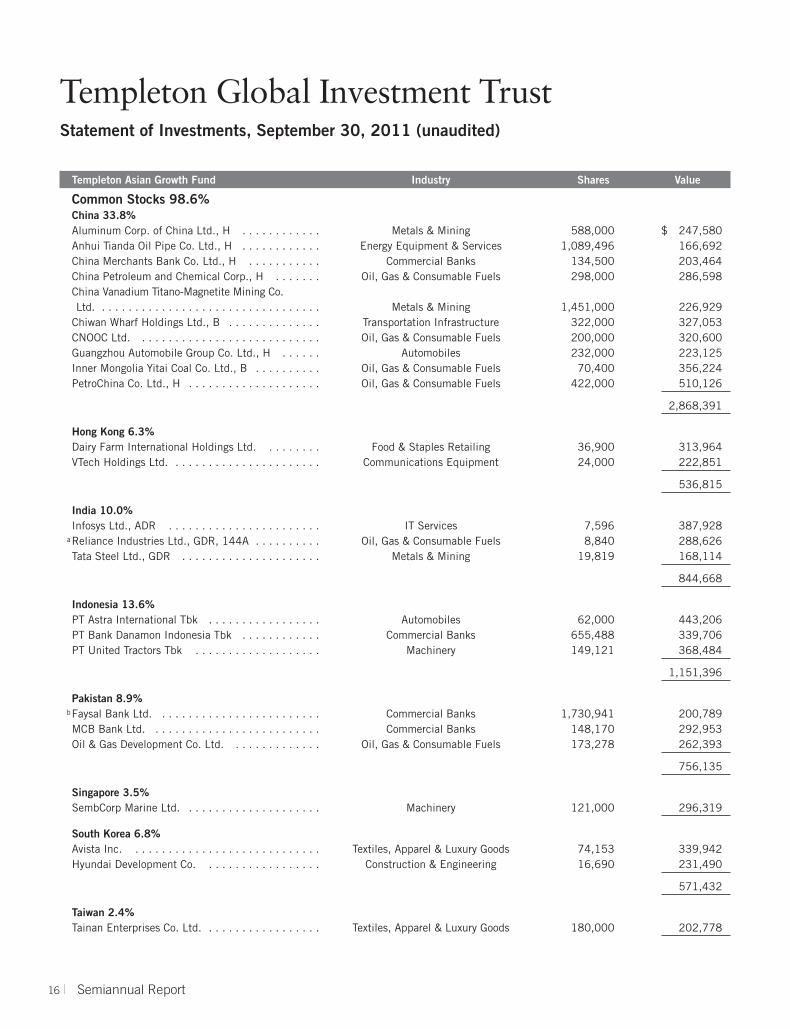
Templeton Global Investment TrustStatement of Investments, September 30, 2011 (unaudited)
Templeton Asian Growth Fund Industry Shares Value
Common Stocks 98.6%China 33.8%Aluminum Corp. of China Ltd., H . . . . . . . . . . . . Metals & Mining 588,000 $ 247,580Anhui Tianda Oil Pipe Co. Ltd., H . . . . . . . . . . . . Energy Equipment & Services 1,089,496 166,692China Merchants Bank Co. Ltd., H . . . . . . . . . . . Commercial Banks 134,500 203,464China Petroleum and Chemical Corp., H . . . . . . . Oil, Gas & Consumable Fuels 298,000 286,598China Vanadium Titano-Magnetite Mining Co. Ltd. . . . . . . . . . . . . . . . . . . . . . . . . . . . . . . . . . Metals & Mining 1,451,000 226,929
Chiwan Wharf Holdings Ltd., B . . . . . . . . . . . . . . Transportation Infrastructure 322,000 327,053CNOOC Ltd. . . . . . . . . . . . . . . . . . . . . . . . . . . . Oil, Gas & Consumable Fuels 200,000 320,600Guangzhou Automobile Group Co. Ltd., H . . . . . . Automobiles 232,000 223,125Inner Mongolia Yitai Coal Co. Ltd., B . . . . . . . . . . Oil, Gas & Consumable Fuels 70,400 356,224PetroChina Co. Ltd., H . . . . . . . . . . . . . . . . . . . . Oil, Gas & Consumable Fuels 422,000 510,126
2,868,391
Hong Kong 6.3%Dairy Farm International Holdings Ltd. . . . . . . . . Food & Staples Retailing 36,900 313,964VTech Holdings Ltd. . . . . . . . . . . . . . . . . . . . . . . Communications Equipment 24,000 222,851
536,815
India 10.0%Infosys Ltd., ADR . . . . . . . . . . . . . . . . . . . . . . . IT Services 7,596 387,928
aReliance Industries Ltd., GDR, 144A . . . . . . . . . . Oil, Gas & Consumable Fuels 8,840 288,626Tata Steel Ltd., GDR . . . . . . . . . . . . . . . . . . . . . Metals & Mining 19,819 168,114
844,668
Indonesia 13.6%PT Astra International Tbk . . . . . . . . . . . . . . . . . Automobiles 62,000 443,206PT Bank Danamon Indonesia Tbk . . . . . . . . . . . . Commercial Banks 655,488 339,706PT United Tractors Tbk . . . . . . . . . . . . . . . . . . . Machinery 149,121 368,484
1,151,396
Pakistan 8.9%bFaysal Bank Ltd. . . . . . . . . . . . . . . . . . . . . . . . . Commercial Banks 1,730,941 200,789MCB Bank Ltd. . . . . . . . . . . . . . . . . . . . . . . . . . Commercial Banks 148,170 292,953Oil & Gas Development Co. Ltd. . . . . . . . . . . . . . Oil, Gas & Consumable Fuels 173,278 262,393
756,135
Singapore 3.5%SembCorp Marine Ltd. . . . . . . . . . . . . . . . . . . . . Machinery 121,000 296,319
South Korea 6.8%Avista Inc. . . . . . . . . . . . . . . . . . . . . . . . . . . . . Textiles, Apparel & Luxury Goods 74,153 339,942Hyundai Development Co. . . . . . . . . . . . . . . . . . Construction & Engineering 16,690 231,490
571,432
Taiwan 2.4%Tainan Enterprises Co. Ltd. . . . . . . . . . . . . . . . . . Textiles, Apparel & Luxury Goods 180,000 202,778
Semiannual Report | The accompanying notes are an integral part of these financial statements. | 17
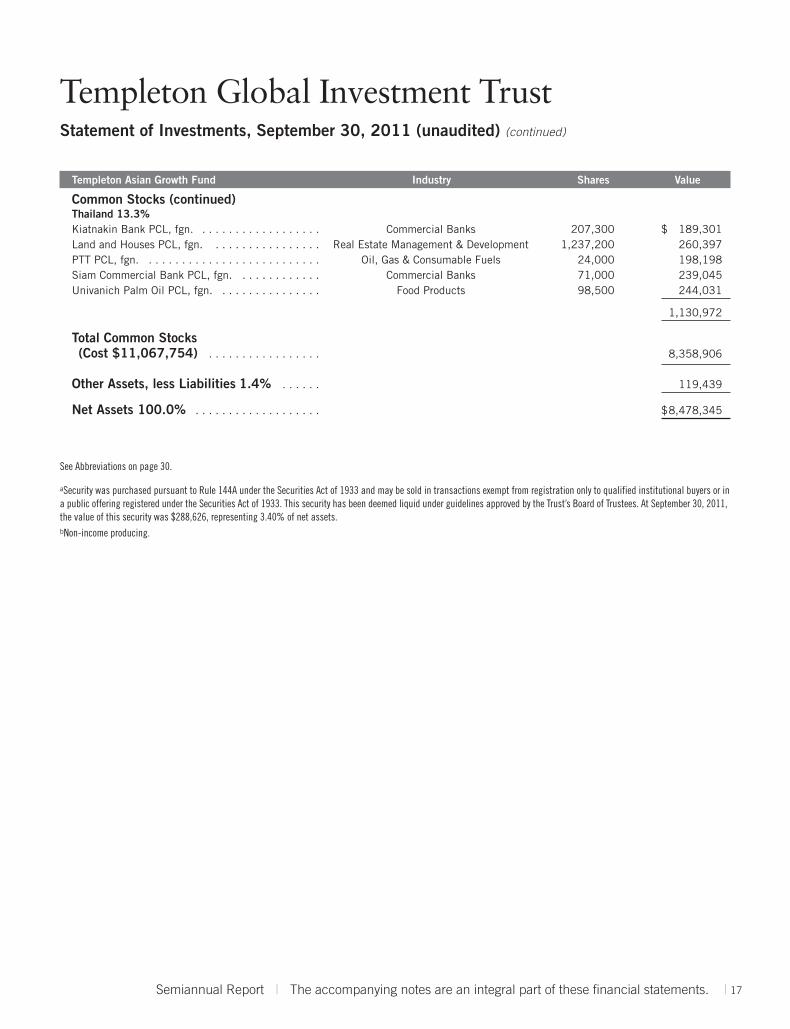
Templeton Global Investment TrustStatement of Investments, September 30, 2011 (unaudited) (continued)
Thailand 13.3%Kiatnakin Bank PCL, fgn. . . . . . . . . . . . . . . . . . . Commercial Banks 207,300 $ 189,301Land and Houses PCL, fgn. . . . . . . . . . . . . . . . . Real Estate Management & Development 1,237,200 260,397PTT PCL, fgn. . . . . . . . . . . . . . . . . . . . . . . . . . . Oil, Gas & Consumable Fuels 24,000 198,198Siam Commercial Bank PCL, fgn. . . . . . . . . . . . . Commercial Banks 71,000 239,045Univanich Palm Oil PCL, fgn. . . . . . . . . . . . . . . . Food Products 98,500 244,031
1,130,972
Total Common Stocks(Cost $11,067,754) . . . . . . . . . . . . . . . . . 8,358,906
Other Assets, less Liabilities 1.4% . . . . . . 119,439
Net Assets 100.0% . . . . . . . . . . . . . . . . . . . $8,478,345
See Abbreviations on page 30.
aSecurity was purchased pursuant to Rule 144A under the Securities Act of 1933 and may be sold in transactions exempt from registration only to qualified institutional buyers or ina public offering registered under the Securities Act of 1933. This security has been deemed liquid under guidelines approved by the Trust’s Board of Trustees. At September 30, 2011,the value of this security was $288,626, representing 3.40% of net assets.bNon-income producing.
Templeton Asian Growth Fund Industry Shares Value
Common Stocks (continued)
18 | The accompanying notes are an integral part of these financial statements. | Semiannual Report
Templeton Global Investment TrustFinancial Statements
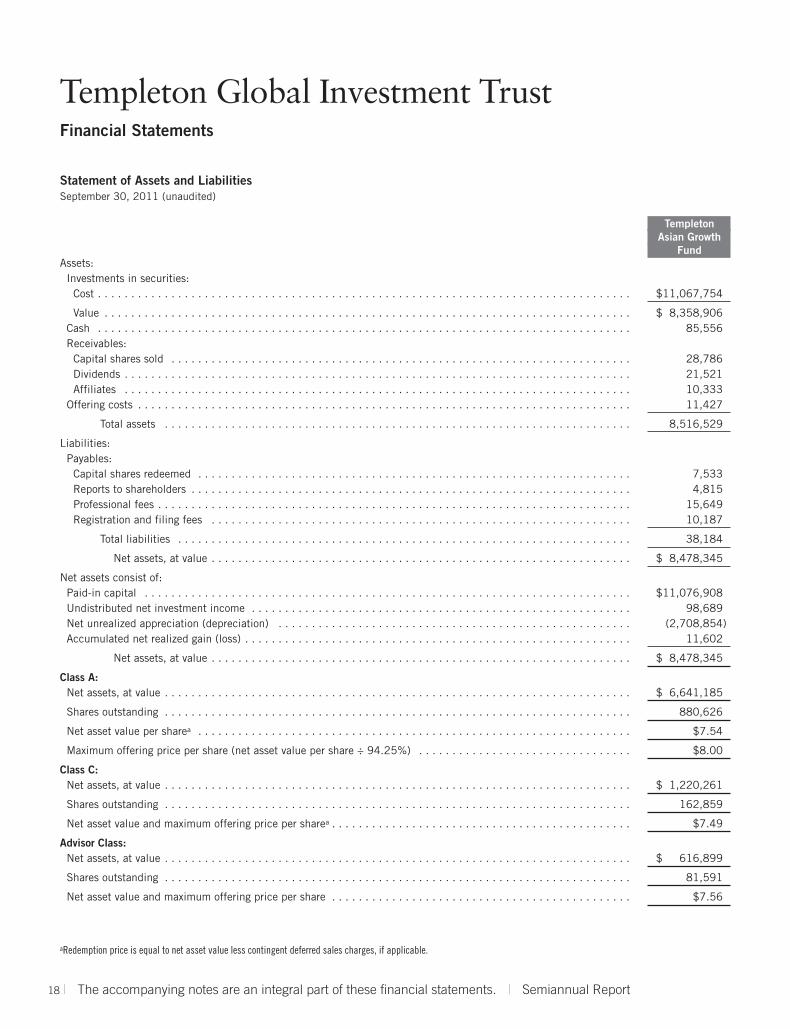
Statement of Assets and LiabilitiesSeptember 30, 2011 (unaudited)
Templeton Asian Growth
FundAssets:
Investments in securities:Cost . . . . . . . . . . . . . . . . . . . . . . . . . . . . . . . . . . . . . . . . . . . . . . . . . . . . . . . . . . . . . . . . . . . . . . . . . . . . . . . . $11,067,754
Value . . . . . . . . . . . . . . . . . . . . . . . . . . . . . . . . . . . . . . . . . . . . . . . . . . . . . . . . . . . . . . . . . . . . . . . . . . . . . . . $ 8,358,906Cash . . . . . . . . . . . . . . . . . . . . . . . . . . . . . . . . . . . . . . . . . . . . . . . . . . . . . . . . . . . . . . . . . . . . . . . . . . . . . . . . 85,556Receivables:
Capital shares sold . . . . . . . . . . . . . . . . . . . . . . . . . . . . . . . . . . . . . . . . . . . . . . . . . . . . . . . . . . . . . . . . . . . . . 28,786Dividends . . . . . . . . . . . . . . . . . . . . . . . . . . . . . . . . . . . . . . . . . . . . . . . . . . . . . . . . . . . . . . . . . . . . . . . . . . . . 21,521Affiliates . . . . . . . . . . . . . . . . . . . . . . . . . . . . . . . . . . . . . . . . . . . . . . . . . . . . . . . . . . . . . . . . . . . . . . . . . . . . 10,333
Offering costs . . . . . . . . . . . . . . . . . . . . . . . . . . . . . . . . . . . . . . . . . . . . . . . . . . . . . . . . . . . . . . . . . . . . . . . . . . 11,427
Total assets . . . . . . . . . . . . . . . . . . . . . . . . . . . . . . . . . . . . . . . . . . . . . . . . . . . . . . . . . . . . . . . . . . . . . . 8,516,529
Liabilities:Payables:
Capital shares redeemed . . . . . . . . . . . . . . . . . . . . . . . . . . . . . . . . . . . . . . . . . . . . . . . . . . . . . . . . . . . . . . . . . 7,533Reports to shareholders . . . . . . . . . . . . . . . . . . . . . . . . . . . . . . . . . . . . . . . . . . . . . . . . . . . . . . . . . . . . . . . . . . 4,815Professional fees . . . . . . . . . . . . . . . . . . . . . . . . . . . . . . . . . . . . . . . . . . . . . . . . . . . . . . . . . . . . . . . . . . . . . . . 15,649Registration and filing fees . . . . . . . . . . . . . . . . . . . . . . . . . . . . . . . . . . . . . . . . . . . . . . . . . . . . . . . . . . . . . . . 10,187
Total liabilities . . . . . . . . . . . . . . . . . . . . . . . . . . . . . . . . . . . . . . . . . . . . . . . . . . . . . . . . . . . . . . . . . . . . 38,184
Net assets, at value . . . . . . . . . . . . . . . . . . . . . . . . . . . . . . . . . . . . . . . . . . . . . . . . . . . . . . . . . . . . . . . $ 8,478,345
Net assets consist of:Paid-in capital . . . . . . . . . . . . . . . . . . . . . . . . . . . . . . . . . . . . . . . . . . . . . . . . . . . . . . . . . . . . . . . . . . . . . . . . . $11,076,908Undistributed net investment income . . . . . . . . . . . . . . . . . . . . . . . . . . . . . . . . . . . . . . . . . . . . . . . . . . . . . . . . . 98,689Net unrealized appreciation (depreciation) . . . . . . . . . . . . . . . . . . . . . . . . . . . . . . . . . . . . . . . . . . . . . . . . . . . . . (2,708,854)Accumulated net realized gain (loss) . . . . . . . . . . . . . . . . . . . . . . . . . . . . . . . . . . . . . . . . . . . . . . . . . . . . . . . . . . 11,602
Net assets, at value . . . . . . . . . . . . . . . . . . . . . . . . . . . . . . . . . . . . . . . . . . . . . . . . . . . . . . . . . . . . . . . $ 8,478,345
Class A:Net assets, at value . . . . . . . . . . . . . . . . . . . . . . . . . . . . . . . . . . . . . . . . . . . . . . . . . . . . . . . . . . . . . . . . . . . . . . $ 6,641,185
Shares outstanding . . . . . . . . . . . . . . . . . . . . . . . . . . . . . . . . . . . . . . . . . . . . . . . . . . . . . . . . . . . . . . . . . . . . . . 880,626
Net asset value per sharea . . . . . . . . . . . . . . . . . . . . . . . . . . . . . . . . . . . . . . . . . . . . . . . . . . . . . . . . . . . . . . . . . $7.54
Maximum offering price per share (net asset value per share ÷ 94.25%) . . . . . . . . . . . . . . . . . . . . . . . . . . . . . . . . $8.00
Class C:Net assets, at value . . . . . . . . . . . . . . . . . . . . . . . . . . . . . . . . . . . . . . . . . . . . . . . . . . . . . . . . . . . . . . . . . . . . . . $ 1,220,261
Shares outstanding . . . . . . . . . . . . . . . . . . . . . . . . . . . . . . . . . . . . . . . . . . . . . . . . . . . . . . . . . . . . . . . . . . . . . . 162,859
Net asset value and maximum offering price per sharea . . . . . . . . . . . . . . . . . . . . . . . . . . . . . . . . . . . . . . . . . . . . . $7.49
Advisor Class:Net assets, at value . . . . . . . . . . . . . . . . . . . . . . . . . . . . . . . . . . . . . . . . . . . . . . . . . . . . . . . . . . . . . . . . . . . . . . $ 616,899
Shares outstanding . . . . . . . . . . . . . . . . . . . . . . . . . . . . . . . . . . . . . . . . . . . . . . . . . . . . . . . . . . . . . . . . . . . . . . 81,591
Net asset value and maximum offering price per share . . . . . . . . . . . . . . . . . . . . . . . . . . . . . . . . . . . . . . . . . . . . . $7.56
aRedemption price is equal to net asset value less contingent deferred sales charges, if applicable.
Semiannual Report | The accompanying notes are an integral part of these financial statements. | 19
Templeton Global Investment TrustFinancial Statements (continued)
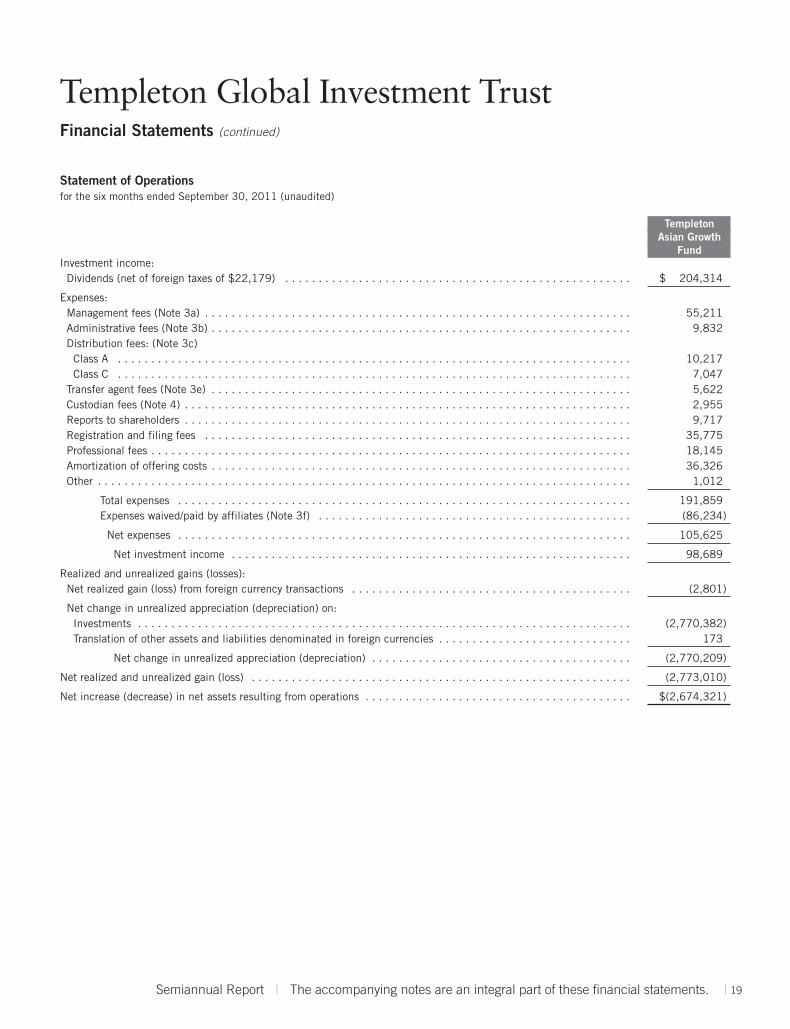
Statement of Operationsfor the six months ended September 30, 2011 (unaudited)
Templeton Asian Growth
FundInvestment income:
Dividends (net of foreign taxes of $22,179) . . . . . . . . . . . . . . . . . . . . . . . . . . . . . . . . . . . . . . . . . . . . . . . . . . . . $ 204,314
Expenses:Management fees (Note 3a) . . . . . . . . . . . . . . . . . . . . . . . . . . . . . . . . . . . . . . . . . . . . . . . . . . . . . . . . . . . . . . . . 55,211Administrative fees (Note 3b) . . . . . . . . . . . . . . . . . . . . . . . . . . . . . . . . . . . . . . . . . . . . . . . . . . . . . . . . . . . . . . . 9,832Distribution fees: (Note 3c)
Class A . . . . . . . . . . . . . . . . . . . . . . . . . . . . . . . . . . . . . . . . . . . . . . . . . . . . . . . . . . . . . . . . . . . . . . . . . . . . . 10,217Class C . . . . . . . . . . . . . . . . . . . . . . . . . . . . . . . . . . . . . . . . . . . . . . . . . . . . . . . . . . . . . . . . . . . . . . . . . . . . . 7,047
Transfer agent fees (Note 3e) . . . . . . . . . . . . . . . . . . . . . . . . . . . . . . . . . . . . . . . . . . . . . . . . . . . . . . . . . . . . . . . 5,622Custodian fees (Note 4) . . . . . . . . . . . . . . . . . . . . . . . . . . . . . . . . . . . . . . . . . . . . . . . . . . . . . . . . . . . . . . . . . . . 2,955Reports to shareholders . . . . . . . . . . . . . . . . . . . . . . . . . . . . . . . . . . . . . . . . . . . . . . . . . . . . . . . . . . . . . . . . . . . 9,717Registration and filing fees . . . . . . . . . . . . . . . . . . . . . . . . . . . . . . . . . . . . . . . . . . . . . . . . . . . . . . . . . . . . . . . . 35,775Professional fees . . . . . . . . . . . . . . . . . . . . . . . . . . . . . . . . . . . . . . . . . . . . . . . . . . . . . . . . . . . . . . . . . . . . . . . . 18,145Amortization of offering costs . . . . . . . . . . . . . . . . . . . . . . . . . . . . . . . . . . . . . . . . . . . . . . . . . . . . . . . . . . . . . . . 36,326Other . . . . . . . . . . . . . . . . . . . . . . . . . . . . . . . . . . . . . . . . . . . . . . . . . . . . . . . . . . . . . . . . . . . . . . . . . . . . . . . . 1,012
Total expenses . . . . . . . . . . . . . . . . . . . . . . . . . . . . . . . . . . . . . . . . . . . . . . . . . . . . . . . . . . . . . . . . . . . . 191,859Expenses waived/paid by affiliates (Note 3f) . . . . . . . . . . . . . . . . . . . . . . . . . . . . . . . . . . . . . . . . . . . . . . . (86,234)
Net expenses . . . . . . . . . . . . . . . . . . . . . . . . . . . . . . . . . . . . . . . . . . . . . . . . . . . . . . . . . . . . . . . . . . . . 105,625
Net investment income . . . . . . . . . . . . . . . . . . . . . . . . . . . . . . . . . . . . . . . . . . . . . . . . . . . . . . . . . . . . 98,689
Realized and unrealized gains (losses):Net realized gain (loss) from foreign currency transactions . . . . . . . . . . . . . . . . . . . . . . . . . . . . . . . . . . . . . . . . . . (2,801)
Net change in unrealized appreciation (depreciation) on:Investments . . . . . . . . . . . . . . . . . . . . . . . . . . . . . . . . . . . . . . . . . . . . . . . . . . . . . . . . . . . . . . . . . . . . . . . . . . (2,770,382)Translation of other assets and liabilities denominated in foreign currencies . . . . . . . . . . . . . . . . . . . . . . . . . . . . . 173
Net change in unrealized appreciation (depreciation) . . . . . . . . . . . . . . . . . . . . . . . . . . . . . . . . . . . . . . . (2,770,209)
Net realized and unrealized gain (loss) . . . . . . . . . . . . . . . . . . . . . . . . . . . . . . . . . . . . . . . . . . . . . . . . . . . . . . . . . (2,773,010)
Net increase (decrease) in net assets resulting from operations . . . . . . . . . . . . . . . . . . . . . . . . . . . . . . . . . . . . . . . . $(2,674,321)
20 | The accompanying notes are an integral part of these financial statements. | Semiannual Report
Templeton Global Investment TrustFinancial Statements (continued)
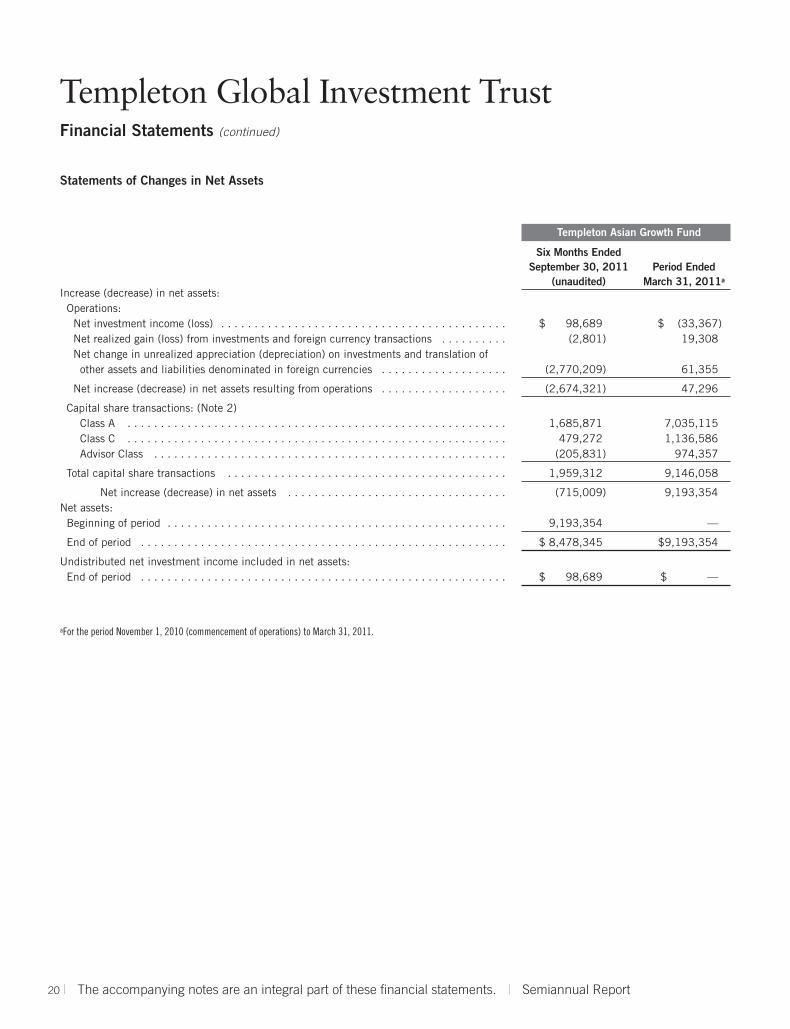
Statements of Changes in Net Assets
Templeton Asian Growth Fund
Six Months EndedSeptember 30, 2011 Period Ended
(unaudited) March 31, 2011a
Increase (decrease) in net assets:Operations:
Net investment income (loss) . . . . . . . . . . . . . . . . . . . . . . . . . . . . . . . . . . . . . . . . . . . $ 98,689 $ (33,367)Net realized gain (loss) from investments and foreign currency transactions . . . . . . . . . . (2,801) 19,308Net change in unrealized appreciation (depreciation) on investments and translation of
other assets and liabilities denominated in foreign currencies . . . . . . . . . . . . . . . . . . . (2,770,209) 61,355
Net increase (decrease) in net assets resulting from operations . . . . . . . . . . . . . . . . . . . (2,674,321) 47,296
Capital share transactions: (Note 2)Class A . . . . . . . . . . . . . . . . . . . . . . . . . . . . . . . . . . . . . . . . . . . . . . . . . . . . . . . . . 1,685,871 7,035,115Class C . . . . . . . . . . . . . . . . . . . . . . . . . . . . . . . . . . . . . . . . . . . . . . . . . . . . . . . . . 479,272 1,136,586Advisor Class . . . . . . . . . . . . . . . . . . . . . . . . . . . . . . . . . . . . . . . . . . . . . . . . . . . . . (205,831) 974,357
Total capital share transactions . . . . . . . . . . . . . . . . . . . . . . . . . . . . . . . . . . . . . . . . . . 1,959,312 9,146,058
Net increase (decrease) in net assets . . . . . . . . . . . . . . . . . . . . . . . . . . . . . . . . . (715,009) 9,193,354Net assets:
Beginning of period . . . . . . . . . . . . . . . . . . . . . . . . . . . . . . . . . . . . . . . . . . . . . . . . . . . 9,193,354 —
End of period . . . . . . . . . . . . . . . . . . . . . . . . . . . . . . . . . . . . . . . . . . . . . . . . . . . . . . . $ 8,478,345 $9,193,354
Undistributed net investment income included in net assets:End of period . . . . . . . . . . . . . . . . . . . . . . . . . . . . . . . . . . . . . . . . . . . . . . . . . . . . . . . $ 98,689 $ —
aFor the period November 1, 2010 (commencement of operations) to March 31, 2011.
Semiannual Report | 21
Templeton Global Investment TrustNotes to Financial Statements (unaudited)
Templeton Asian Growth Fund
1. ORGANIZATION AND SIGNIFICANT ACCOUNTING POLICIES
Templeton Global Investment Trust (Trust) is registered under the Investment Company Act of1940, as amended, (1940 Act) as an open-end investment company, consisting of five separatefunds. The Templeton Asian Growth Fund (Fund) is included in this report. The financial state-ments of the remaining funds in the Trust are presented separately. The Fund offers three classesof shares: Class A, Class C, and Advisor Class. Each class of shares differs by its initial salesload, contingent deferred sales charges, distribution fees, voting rights on matters affecting a single class and its exchange privilege.
The following summarizes the Fund’s significant accounting policies.
a. Financial Instrument Valuation
The Fund’s investments in securities and other financial instruments are carried at fair value daily.Fair value is the price that would be received to sell an asset or paid to transfer a liability in anorderly transaction between market participants on the measurement date. Under proceduresapproved by the Trust’s Board of Trustees, the Fund may utilize independent pricing services,quotations from securities and financial instrument dealers, and other market sources to deter-mine fair value.
Equity securities listed on an exchange or on the NASDAQ National Market System are valuedat the last quoted sale price or the official closing price of the day, respectively. Foreign equitysecurities are valued as of the close of trading on the foreign stock exchange on which the secu-rity is primarily traded, or the NYSE, whichever is earlier. The value is then converted into itsU.S. dollar equivalent at the foreign exchange rate in effect at the close of the NYSE on the daythat the value of the security is determined. Over-the-counter securities are valued within therange of the most recent quoted bid and ask prices. Securities that trade in multiple markets oron multiple exchanges are valued according to the broadest and most representative market.Certain equity securities are valued based upon fundamental characteristics or relationships tosimilar securities.
The Fund has procedures to determine the fair value of securities and other financial instrumentsfor which market prices are not readily available or which may not be reliably priced. Underthese procedures, the Fund primarily employs a market-based approach which may use relatedor comparable assets or liabilities, recent transactions, market multiples, book values, and otherrelevant information for the investment to determine the fair value of the investment. The Fundmay also use an income-based valuation approach in which the anticipated future cash flows ofthe investment are discounted to calculate fair value. Discounts may also be applied due to thenature or duration of any restrictions on the disposition of the investments. Due to the inherentuncertainty of valuations of such investments, the fair values may differ significantly from thevalues that would have been used had an active market existed.
22 | Semiannual Report
Templeton Global Investment TrustNotes to Financial Statements (unaudited) (continued)
Templeton Asian Growth Fund
1. ORGANIZATION AND SIGNIFICANT ACCOUNTING POLICIES (continued)
a. Financial Instrument Valuation (continued)
Trading in securities on foreign securities stock exchanges and over-the-counter markets may becompleted before the daily close of business on the NYSE. Occasionally, events occur betweenthe time at which trading in a foreign security is completed and the close of the NYSE thatmight call into question the reliability of the value of a portfolio security held by the Fund. As aresult, differences may arise between the value of the Fund’s portfolio securities as determined atthe foreign market close and the latest indications of value at the close of the NYSE. In order tominimize the potential for these differences, the investment manager monitors price movementsfollowing the close of trading in foreign stock markets through a series of country specific mar-ket proxies (such as baskets of American Depositary Receipts, futures contracts and exchangetraded funds). These price movements are measured against established trigger thresholds foreach specific market proxy to assist in determining if an event has occurred that may call intoquestion the reliability of the values of the foreign securities held by the Fund. If such an eventoccurs, the securities may be valued using fair value procedures, which may include the use ofindependent pricing services. At September 30, 2011, a market event occurred resulting in a portion of the securities held by the Fund being valued using fair value procedures.
b. Foreign Currency Translation
Portfolio securities and other assets and liabilities denominated in foreign currencies are translatedinto U.S. dollars based on the exchange rate of such currencies against U.S. dollars on the dateof valuation. The Fund may enter into foreign currency exchange contracts to facilitate transac-tions denominated in a foreign currency. Purchases and sales of securities, income and expenseitems denominated in foreign currencies are translated into U.S. dollars at the exchange rate ineffect on the transaction date. Portfolio securities and assets and liabilities denominated in for-eign currencies contain risks that those currencies will decline in value relative to the U.S. dollar.Occasionally, events may impact the availability or reliability of foreign exchange rates used toconvert the U.S. dollar equivalent value. If such an event occurs, the foreign exchange rate willbe valued at fair value using procedures established and approved by the Trust’s Board of Trustees.
The Fund does not separately report the effect of changes in foreign exchange rates from changesin market prices on securities held. Such changes are included in net realized and unrealized gainor loss from investments on the Statement of Operations.
Realized foreign exchange gains or losses arise from sales of foreign currencies, currency gainsor losses realized between the trade and settlement dates on securities transactions and the dif-ference between the recorded amounts of dividends, interest, and foreign withholding taxes andthe U.S. dollar equivalent of the amounts actually received or paid. Net unrealized foreign exchangegains and losses arise from changes in foreign exchange rates on foreign denominated assets andliabilities other than investments in securities held at the end of the reporting period.
Semiannual Report | 23
Templeton Global Investment TrustNotes to Financial Statements (unaudited) (continued)
Templeton Asian Growth Fund
1. ORGANIZATION AND SIGNIFICANT ACCOUNTING POLICIES (continued)
c. Income Taxes
It is the Fund’s policy to qualify as a regulated investment company under the Internal RevenueCode. The Fund intends to distribute to shareholders substantially all of its taxable income andnet realized gains to relieve it from federal income and excise taxes. As a result, no provisionfor U.S. federal income taxes is required. The Fund files U.S. income tax returns as well as taxreturns in certain other jurisdictions. The Fund records a provision for taxes in its financialstatements including penalties and interest, if any, for a tax position taken on a tax return (orexpected to be taken) when it fails to meet the more likely than not (a greater than 50% proba-bility) threshold and based on the technical merits, the tax position may not be sustained uponexamination by the tax authorities. As of September 30, 2011, and for all open tax years, theFund has determined that no provision for income tax is required in the Fund’s financial state-ments. Open tax years are those that remain subject to examination and are based on each taxjurisdiction statute of limitation.
The Fund may be subject to foreign taxation related to income received, capital gains on the saleof securities and certain foreign currency transactions in the foreign jurisdictions in which itinvests. Foreign taxes, if any, are recorded based on the tax regulations and rates that exist inthe foreign markets in which the Fund invests. When a capital gain tax is determined to applythe Fund records an estimated deferred tax liability for unrealized gains on these securities in anamount that would be payable if the securities were disposed of on the valuation date.
d. Security Transactions, Investment Income, Expenses and Distributions
Security transactions are accounted for on trade date. Realized gains and losses on security trans-actions are determined on a specific identification basis. Estimated expenses are accrued daily.Dividend income is recorded on the ex-dividend date except that certain dividends from foreignsecurities are recognized as soon as the Fund is notified of the ex-dividend date. Distributions toshareholders are recorded on the ex-dividend date and are determined according to income taxregulations (tax basis). Distributable earnings determined on a tax basis may differ from earningsrecorded in accordance with accounting principles generally accepted in the United States ofAmerica. These differences may be permanent or temporary. Permanent differences are reclassifiedamong capital accounts to reflect their tax character. These reclassifications have no impact onnet assets or the results of operations. Temporary differences are not reclassified, as they mayreverse in subsequent periods.
Common expenses incurred by the Trust are allocated among the funds based on the ratio of netassets of each fund to the combined net assets of the Trust. Fund specific expenses are chargeddirectly to the fund that incurred the expense.
24 | Semiannual Report
Templeton Global Investment TrustNotes to Financial Statements (unaudited) (continued)
Templeton Asian Growth Fund
1. ORGANIZATION AND SIGNIFICANT ACCOUNTING POLICIES (continued)
d. Security Transactions, Investment Income, Expenses and Distributions (continued)
Realized and unrealized gains and losses and net investment income, not including class specificexpenses, are allocated daily to each class of shares based upon the relative proportion of netassets of each class. Differences in per share distributions, by class, are generally due to differ-ences in class specific expenses.
e. Offering Costs
Offering costs are amortized on a straight line basis over twelve months.
f. Accounting Estimates
The preparation of financial statements in accordance with accounting principles generally acceptedin the United States of America requires management to make estimates and assumptions thataffect the reported amounts of assets and liabilities at the date of the financial statements andthe amounts of income and expenses during the reporting period. Actual results could differfrom those estimates.
g. Guarantees and Indemnifications
Under the Trust’s organizational documents, its officers and trustees are indemnified by the Trustagainst certain liabilities arising out of the performance of their duties to the Trust. Additionally,in the normal course of business, the Trust, on behalf of the Fund, enters into contracts withservice providers that contain general indemnification clauses. The Trust’s maximum exposureunder these arrangements is unknown as this would involve future claims that may be made againstthe Trust that have not yet occurred. Currently, the Trust expects the risk of loss to be remote.
2. SHARES OF BENEFICIAL INTEREST
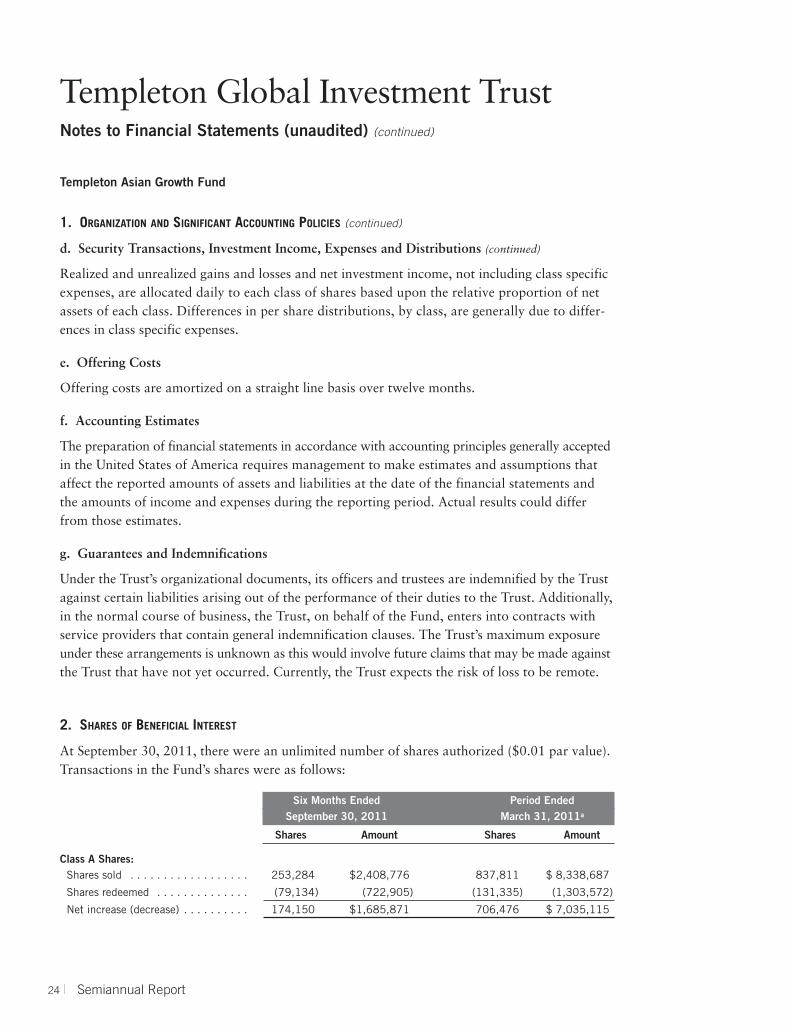
At September 30, 2011, there were an unlimited number of shares authorized ($0.01 par value).Transactions in the Fund’s shares were as follows:
Six Months Ended Period Ended September 30, 2011 March 31, 2011a
Shares Amount Shares Amount
Class A Shares:Shares sold . . . . . . . . . . . . . . . . . . 253,284 $2,408,776 837,811 $ 8,338,687
Shares redeemed . . . . . . . . . . . . . . (79,134) (722,905) (131,335) (1,303,572)
Net increase (decrease) . . . . . . . . . . 174,150 $1,685,871 706,476 $ 7,035,115
Semiannual Report | 25
Templeton Global Investment TrustNotes to Financial Statements (unaudited) (continued)
Templeton Asian Growth Fund
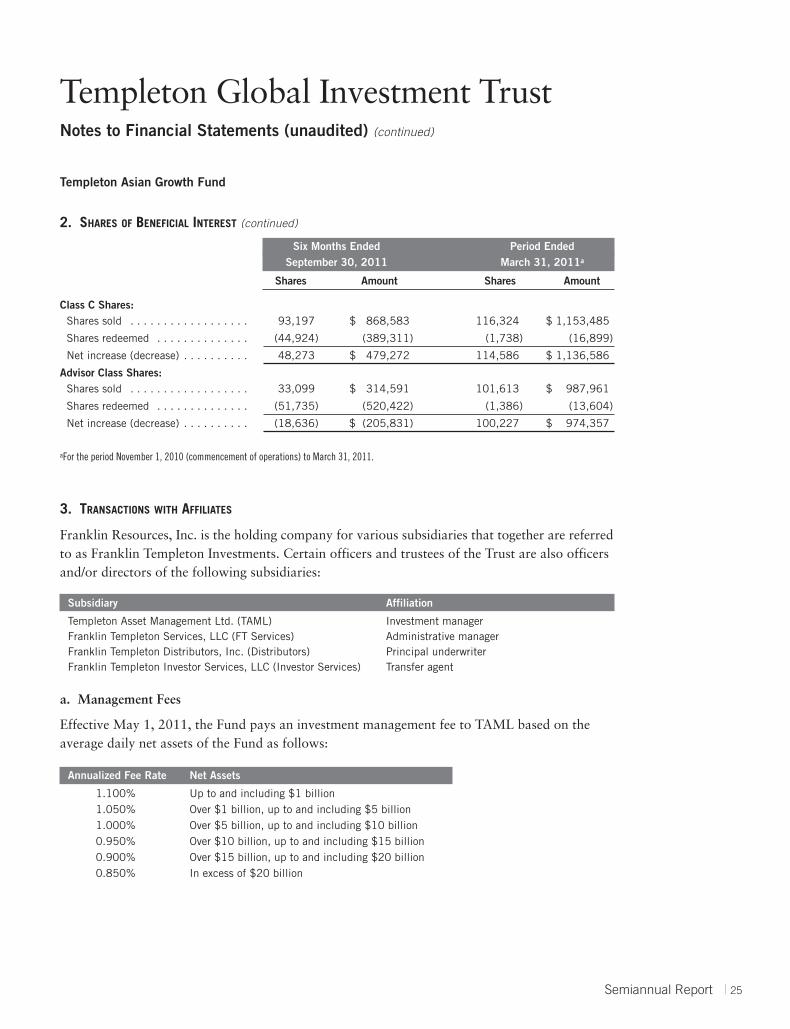
2. SHARES OF BENEFICIAL INTEREST (continued)
Six Months Ended Period Ended September 30, 2011 March 31, 2011a
Shares Amount Shares Amount
Class C Shares:Shares sold . . . . . . . . . . . . . . . . . . 93,197 $ 868,583 116,324 $ 1,153,485
Shares redeemed . . . . . . . . . . . . . . (44,924) (389,311) (1,738) (16,899)
Net increase (decrease) . . . . . . . . . . 48,273 $ 479,272 114,586 $ 1,136,586
Advisor Class Shares:Shares sold . . . . . . . . . . . . . . . . . . 33,099 $ 314,591 101,613 $ 987,961
Shares redeemed . . . . . . . . . . . . . . (51,735) (520,422) (1,386) (13,604)
Net increase (decrease) . . . . . . . . . . (18,636) $ (205,831) 100,227 $ 974,357
aFor the period November 1, 2010 (commencement of operations) to March 31, 2011.
3. TRANSACTIONS WITH AFFILIATES
Franklin Resources, Inc. is the holding company for various subsidiaries that together are referredto as Franklin Templeton Investments. Certain officers and trustees of the Trust are also officersand/or directors of the following subsidiaries:
Subsidiary Affiliation
Templeton Asset Management Ltd. (TAML) Investment managerFranklin Templeton Services, LLC (FT Services) Administrative managerFranklin Templeton Distributors, Inc. (Distributors) Principal underwriterFranklin Templeton Investor Services, LLC (Investor Services) Transfer agent
a. Management Fees
Effective May 1, 2011, the Fund pays an investment management fee to TAML based on theaverage daily net assets of the Fund as follows:
Annualized Fee Rate Net Assets
1.100% Up to and including $1 billion1.050% Over $1 billion, up to and including $5 billion1.000% Over $5 billion, up to and including $10 billion0.950% Over $10 billion, up to and including $15 billion0.900% Over $15 billion, up to and including $20 billion0.850% In excess of $20 billion
26 | Semiannual Report
Templeton Global Investment TrustNotes to Financial Statements (unaudited) (continued)
Templeton Asian Growth Fund
3. TRANSACTIONS WITH AFFILIATES (continued)
a. Management Fees (continued)
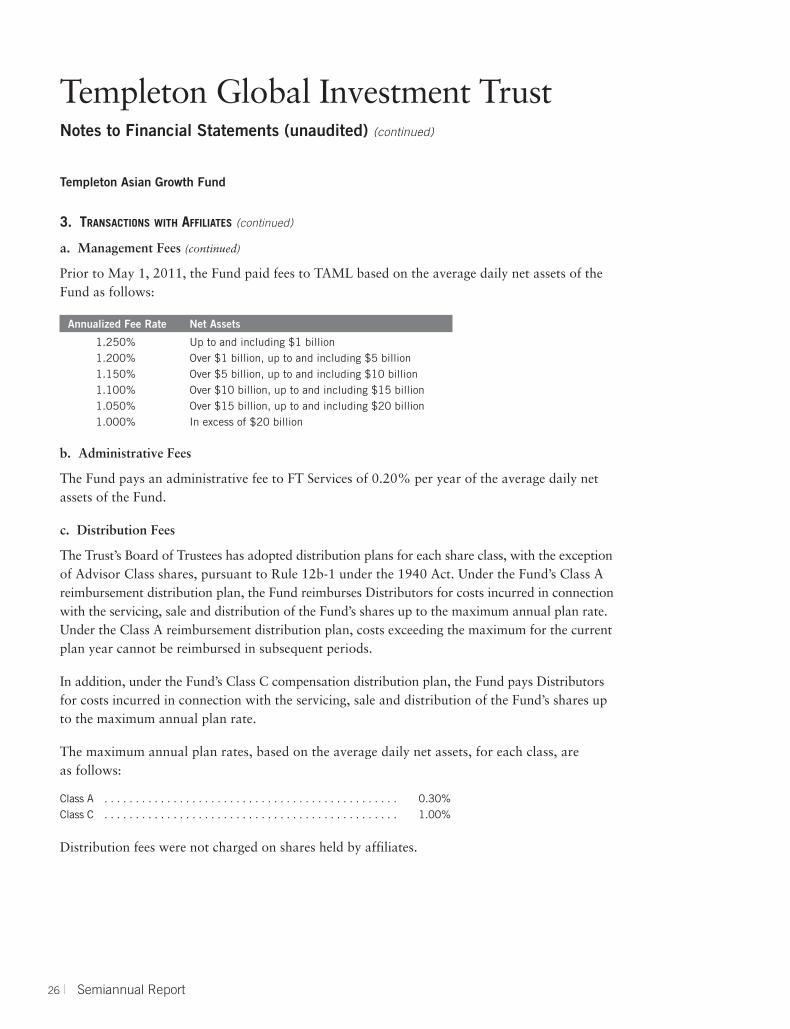
Prior to May 1, 2011, the Fund paid fees to TAML based on the average daily net assets of theFund as follows:
Annualized Fee Rate Net Assets
1.250% Up to and including $1 billion1.200% Over $1 billion, up to and including $5 billion1.150% Over $5 billion, up to and including $10 billion1.100% Over $10 billion, up to and including $15 billion1.050% Over $15 billion, up to and including $20 billion1.000% In excess of $20 billion
b. Administrative Fees
The Fund pays an administrative fee to FT Services of 0.20% per year of the average daily netassets of the Fund.
c. Distribution Fees
The Trust’s Board of Trustees has adopted distribution plans for each share class, with the exceptionof Advisor Class shares, pursuant to Rule 12b-1 under the 1940 Act. Under the Fund’s Class Areimbursement distribution plan, the Fund reimburses Distributors for costs incurred in connectionwith the servicing, sale and distribution of the Fund’s shares up to the maximum annual plan rate.Under the Class A reimbursement distribution plan, costs exceeding the maximum for the currentplan year cannot be reimbursed in subsequent periods.
In addition, under the Fund’s Class C compensation distribution plan, the Fund pays Distributorsfor costs incurred in connection with the servicing, sale and distribution of the Fund’s shares upto the maximum annual plan rate.
The maximum annual plan rates, based on the average daily net assets, for each class, areas follows:
Class A . . . . . . . . . . . . . . . . . . . . . . . . . . . . . . . . . . . . . . . . . . . . . . . 0.30%Class C . . . . . . . . . . . . . . . . . . . . . . . . . . . . . . . . . . . . . . . . . . . . . . . 1.00%
Distribution fees were not charged on shares held by affiliates.
Semiannual Report | 27
Templeton Global Investment TrustNotes to Financial Statements (unaudited) (continued)
Templeton Asian Growth Fund
3. TRANSACTIONS WITH AFFILIATES (continued)
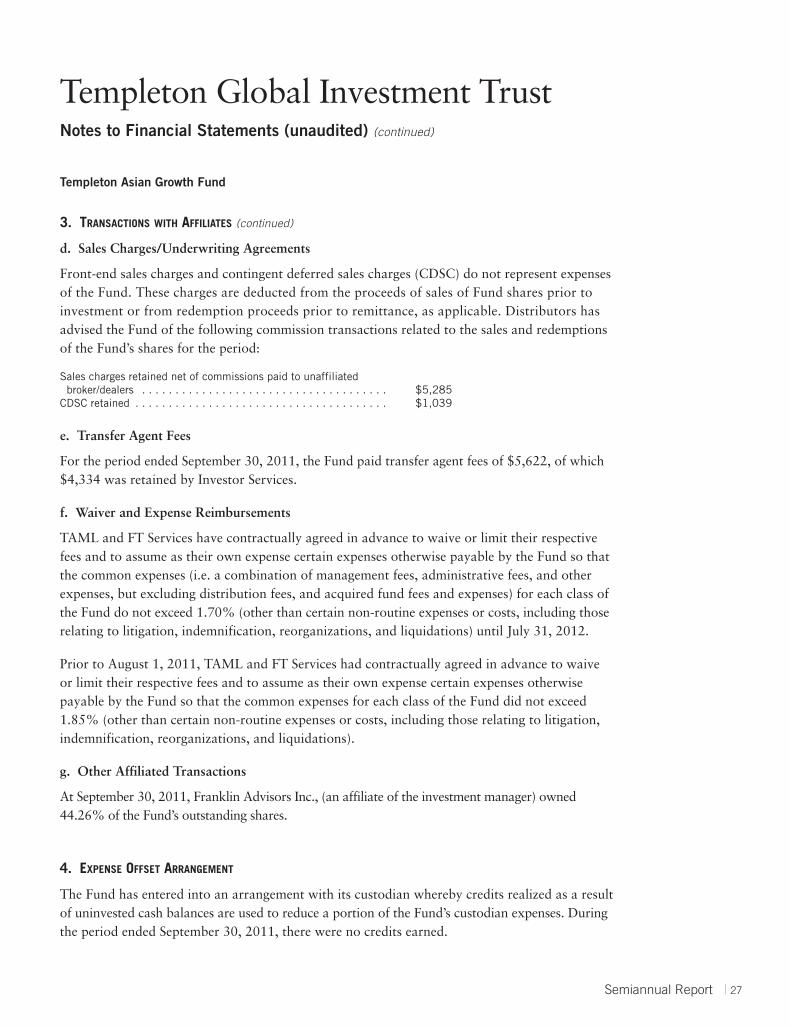
d. Sales Charges/Underwriting Agreements
Front-end sales charges and contingent deferred sales charges (CDSC) do not represent expensesof the Fund. These charges are deducted from the proceeds of sales of Fund shares prior toinvestment or from redemption proceeds prior to remittance, as applicable. Distributors hasadvised the Fund of the following commission transactions related to the sales and redemptionsof the Fund’s shares for the period:
Sales charges retained net of commissions paid to unaffiliated broker/dealers . . . . . . . . . . . . . . . . . . . . . . . . . . . . . . . . . . . . . $5,285
CDSC retained . . . . . . . . . . . . . . . . . . . . . . . . . . . . . . . . . . . . . . $1,039
e. Transfer Agent Fees
For the period ended September 30, 2011, the Fund paid transfer agent fees of $5,622, of which$4,334 was retained by Investor Services.
f. Waiver and Expense Reimbursements
TAML and FT Services have contractually agreed in advance to waive or limit their respectivefees and to assume as their own expense certain expenses otherwise payable by the Fund so thatthe common expenses (i.e. a combination of management fees, administrative fees, and otherexpenses, but excluding distribution fees, and acquired fund fees and expenses) for each class ofthe Fund do not exceed 1.70% (other than certain non-routine expenses or costs, including thoserelating to litigation, indemnification, reorganizations, and liquidations) until July 31, 2012.
Prior to August 1, 2011, TAML and FT Services had contractually agreed in advance to waiveor limit their respective fees and to assume as their own expense certain expenses otherwisepayable by the Fund so that the common expenses for each class of the Fund did not exceed1.85% (other than certain non-routine expenses or costs, including those relating to litigation,indemnification, reorganizations, and liquidations).
g. Other Affiliated Transactions
At September 30, 2011, Franklin Advisors Inc., (an affiliate of the investment manager) owned44.26% of the Fund’s outstanding shares.
4. EXPENSE OFFSET ARRANGEMENT
The Fund has entered into an arrangement with its custodian whereby credits realized as a resultof uninvested cash balances are used to reduce a portion of the Fund’s custodian expenses. Duringthe period ended September 30, 2011, there were no credits earned.
28 | Semiannual Report
Templeton Global Investment TrustNotes to Financial Statements (unaudited) (continued)
Templeton Asian Growth Fund
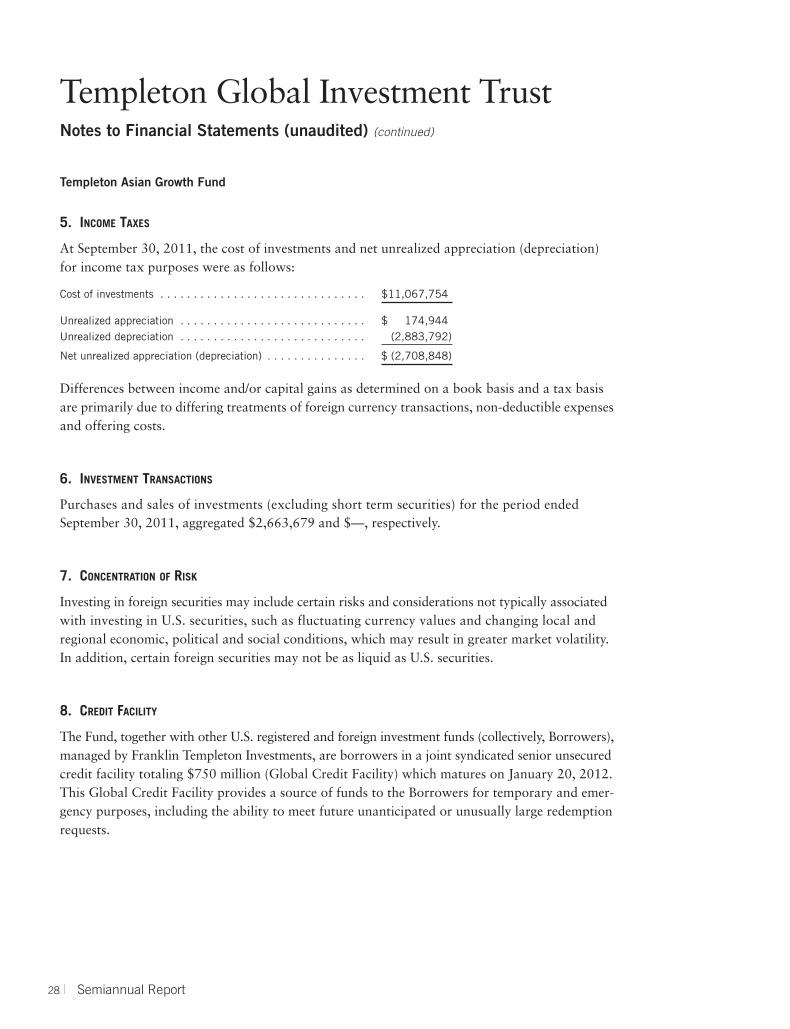
5. INCOME TAXES
At September 30, 2011, the cost of investments and net unrealized appreciation (depreciation)for income tax purposes were as follows:
Cost of investments . . . . . . . . . . . . . . . . . . . . . . . . . . . . . . . $11,067,754
Unrealized appreciation . . . . . . . . . . . . . . . . . . . . . . . . . . . . $ 174,944Unrealized depreciation . . . . . . . . . . . . . . . . . . . . . . . . . . . . (2,883,792)
Net unrealized appreciation (depreciation) . . . . . . . . . . . . . . . $ (2,708,848)
Differences between income and/or capital gains as determined on a book basis and a tax basisare primarily due to differing treatments of foreign currency transactions, non-deductible expensesand offering costs.
6. INVESTMENT TRANSACTIONS
Purchases and sales of investments (excluding short term securities) for the period endedSeptember 30, 2011, aggregated $2,663,679 and $—, respectively.
7. CONCENTRATION OF RISK
Investing in foreign securities may include certain risks and considerations not typically associatedwith investing in U.S. securities, such as fluctuating currency values and changing local andregional economic, political and social conditions, which may result in greater market volatility.In addition, certain foreign securities may not be as liquid as U.S. securities.
8. CREDIT FACILITY
The Fund, together with other U.S. registered and foreign investment funds (collectively, Borrowers),managed by Franklin Templeton Investments, are borrowers in a joint syndicated senior unsecuredcredit facility totaling $750 million (Global Credit Facility) which matures on January 20, 2012.This Global Credit Facility provides a source of funds to the Borrowers for temporary and emer-gency purposes, including the ability to meet future unanticipated or unusually large redemptionrequests.
Semiannual Report | 29
Templeton Global Investment TrustNotes to Financial Statements (unaudited) (continued)
Templeton Asian Growth Fund
8. CREDIT FACILITY (continued)
Under the terms of the Global Credit Facility, the Fund shall, in addition to interest charged onany borrowings made by the Fund and other costs incurred by the Fund, pay its share of feesand expenses incurred in connection with the implementation and maintenance of the GlobalCredit Facility, based upon its relative share of the aggregate net assets of all of the Borrowers,including an annual commitment fee of 0.08% based upon the unused portion of the GlobalCredit Facility, which is reflected in other expenses on the Statement of Operations. During theperiod ended September 30, 2011, the Fund did not use the Global Credit Facility.
9. FAIR VALUE MEASUREMENTS
The Fund follows a fair value hierarchy that distinguishes between market data obtained fromindependent sources (observable inputs) and the Fund’s own market assumptions (unobservableinputs). These inputs are used in determining the value of the Fund’s investments and are sum-marized in the following fair value hierarchy:
• Level 1 – quoted prices in active markets for identical securities
• Level 2 – other significant observable inputs (including quoted prices for similar securities,interest rates, prepayment speed, credit risk, etc.)
• Level 3 – significant unobservable inputs (including the Fund’s own assumptions in determiningthe fair value of investments)
The inputs or methodology used for valuing securities are not an indication of the risk associatedwith investing in those securities.
For movements between the levels within the fair value hierarchy, the Fund has adopted a policyof recognizing the transfers as of the date of the underlying event which caused the movement.Additionally, at September 30, 2011, due to market events, the Fund employed fair value proce-dures to value a portion of its holdings. Such procedures resulted in a temporary transfer ofsecurities valued at $6,401,879 from Level 1 to Level 2 within the fair value hierarchy.
30 | Semiannual Report
Templeton Global Investment TrustNotes to Financial Statements (unaudited) (continued)
Templeton Asian Growth Fund
9. FAIR VALUE MEASUREMENTS (continued)
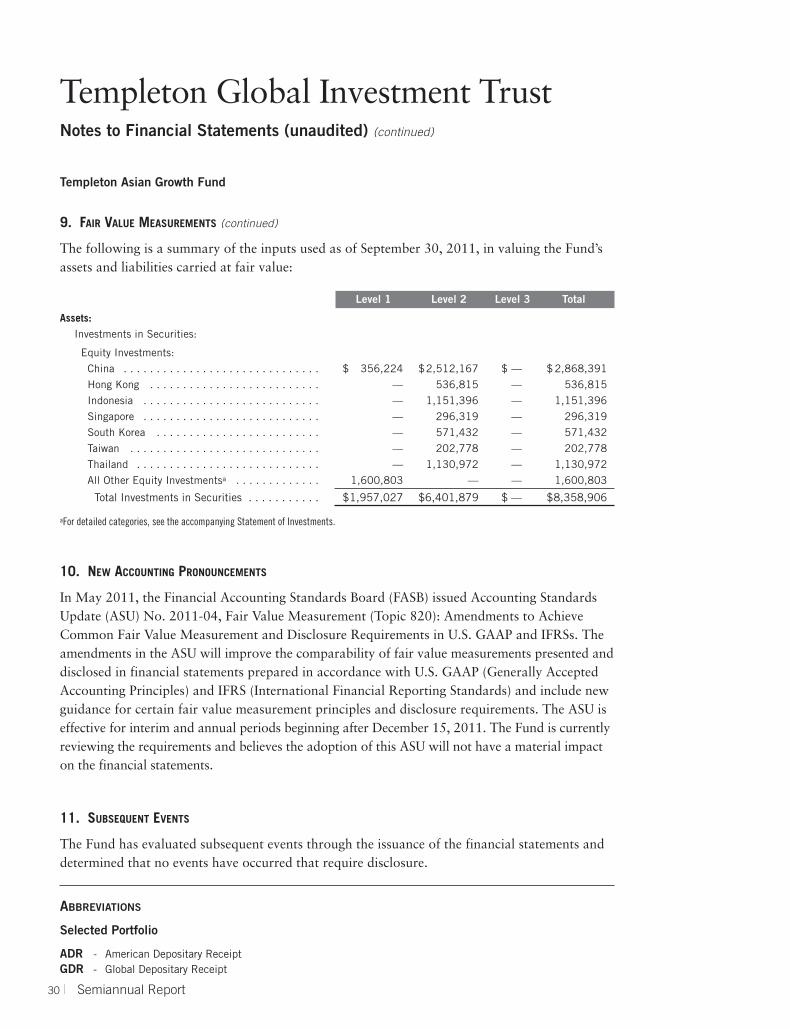
The following is a summary of the inputs used as of September 30, 2011, in valuing the Fund’sassets and liabilities carried at fair value:
Level 1 Level 2 Level 3 Total
Assets:
Investments in Securities:
Equity Investments:
China . . . . . . . . . . . . . . . . . . . . . . . . . . . . . . $ 356,224 $2,512,167 $ — $ 2,868,391
Hong Kong . . . . . . . . . . . . . . . . . . . . . . . . . . — 536,815 — 536,815
Indonesia . . . . . . . . . . . . . . . . . . . . . . . . . . . — 1,151,396 — 1,151,396
Singapore . . . . . . . . . . . . . . . . . . . . . . . . . . . — 296,319 — 296,319
South Korea . . . . . . . . . . . . . . . . . . . . . . . . . — 571,432 — 571,432
Taiwan . . . . . . . . . . . . . . . . . . . . . . . . . . . . . — 202,778 — 202,778
Thailand . . . . . . . . . . . . . . . . . . . . . . . . . . . . — 1,130,972 — 1,130,972
All Other Equity Investmentsa . . . . . . . . . . . . . 1,600,803 — — 1,600,803
Total Investments in Securities . . . . . . . . . . . $1,957,027 $6,401,879 $ — $8,358,906
aFor detailed categories, see the accompanying Statement of Investments.
10. NEW ACCOUNTING PRONOUNCEMENTS
In May 2011, the Financial Accounting Standards Board (FASB) issued Accounting StandardsUpdate (ASU) No. 2011-04, Fair Value Measurement (Topic 820): Amendments to AchieveCommon Fair Value Measurement and Disclosure Requirements in U.S. GAAP and IFRSs. Theamendments in the ASU will improve the comparability of fair value measurements presented anddisclosed in financial statements prepared in accordance with U.S. GAAP (Generally AcceptedAccounting Principles) and IFRS (International Financial Reporting Standards) and include newguidance for certain fair value measurement principles and disclosure requirements. The ASU iseffective for interim and annual periods beginning after December 15, 2011. The Fund is currentlyreviewing the requirements and believes the adoption of this ASU will not have a material impacton the financial statements.
11. SUBSEQUENT EVENTS
The Fund has evaluated subsequent events through the issuance of the financial statements anddetermined that no events have occurred that require disclosure.
ABBREVIATIONS
Selected Portfolio
ADR - American Depositary ReceiptGDR - Global Depositary Receipt
Templeton Global Investment TrustShareholder Information
Templeton Asian Growth Fund
Proxy Voting Policies and Procedures
The Fund’s investment manager has established Proxy Voting Policies and Procedures (Policies) thatthe Fund uses to determine how to vote proxies relating to portfolio securities. Shareholders mayview the Fund’s complete Policies online at franklintempleton.com. Alternatively, shareholders mayrequest copies of the Policies free of charge by calling the Proxy Group collect at (954) 527-7678or by sending a written request to: Franklin Templeton Companies, LLC, 300 S.E. 2nd Street, FortLauderdale, FL 33301, Attention: Proxy Group. Copies of the Fund’s proxy voting records are alsomade available online at franklintempleton.com and posted on the U.S. Securities and ExchangeCommission’s website at sec.gov and reflect the most recent 12-month period ended June 30.
Quarterly Statement of Investments
The Fund files a complete statement of investments with the U.S. Securities and ExchangeCommission for the first and third quarters for each fiscal year on Form N-Q. Shareholders mayview the filed Form N-Q by visiting the Commission’s website at sec.gov. The filed form may alsobe viewed and copied at the Commission’s Public Reference Room in Washington, DC. Informationregarding the operations of the Public Reference Room may be obtained by calling (800) SEC-0330.
Semiannual Report | 31

This page intentionally left blank.
Franklin Templeton FundsLiterature Request. To receive a summary prospectus and/or prospectus, please call us at (800) DIAL BEN/342-5236 or
visit franklintempleton.com. Investors should carefully consider a fund’s investment goals, risks, charges and expenses
before investing. The prospectus contains this and other information. Please carefully read a prospectus before investing.
To ensure the highest quality of service, we may monitor, record and access telephone calls to or from our service
departments. These calls can be identified by the presence of a regular beeping tone.
VALUEFranklin All Cap Value FundFranklin Balance Sheet Investment FundFranklin Large Cap Value FundFranklin MicroCap Value Fund1
Franklin MidCap Value FundFranklin Small Cap Value FundMutual Beacon FundMutual Quest FundMutual Recovery Fund2
Mutual Shares Fund
BLENDFranklin Focused Core Equity FundFranklin Large Cap Equity FundFranklin Rising Dividends Fund
GROWTHFranklin DynaTech FundFranklin Flex Cap Growth FundFranklin Growth FundFranklin Growth Opportunities FundFranklin Small Cap Growth FundFranklin Small-Mid Cap Growth Fund
SECTORFranklin Biotechnology Discovery FundFranklin Global Real Estate FundFranklin Gold & Precious Metals FundFranklin Natural Resources FundFranklin Real Estate Securities FundFranklin Utilities FundMutual Financial Services Fund
GLOBALFranklin World Perspectives FundMutual Global Discovery FundTempleton Global Opportunities TrustTempleton Global Smaller Companies FundTempleton Growth FundTempleton World Fund
1. The fund is closed to new investors. Existing shareholders and select retirement plans cancontinue adding to their accounts.2. The fund is a continuously offered, closed-end fund. Shares may be purchased daily; thereis no daily redemption. However, each quarter, pending board approval, the fund will authorizethe repurchase of 5%–25% of the outstanding number of shares. Investors may tender all ora portion of their shares during the tender period.3. Effective 7/1/11, Templeton Income Fund changed its name to Templeton Global BalancedFund. Additionally, the fund changed its goal and pricing structure. Under normalcircumstances, the fund will invest: at least 25% of its assets in fixed income senior securities
and at least 25% of its assets in equity securities; at least 40% of its assets in non-U.S.investments; and in issuers located in at least three different countries (including the U.S.).4. An investment in the fund is neither insured nor guaranteed by the U.S. government or byany other entity or institution.5. For investors subject to the alternative minimum tax, a small portion of fund dividends maybe taxable. Distributions of capital gains are generally taxable.6. The fund invests primarily in insured municipal securities.7. The funds of the Franklin Templeton Variable Insurance Products Trust are generally availableonly through insurance company variable contracts.
AlabamaArizonaCalifornia (4 funds)ColoradoConnecticutFloridaGeorgiaKentuckyLouisianaMarylandMassachusettsMichigan
MinnesotaMissouriNew JerseyNew York (2 funds)North CarolinaOhioOregonPennsylvaniaTennesseeVirginia
INSURANCE FUNDSFranklin Templeton Variable Insurance Products Trust7
10/11 Not part of the semiannual report
INTERNATIONALFranklin India Growth FundFranklin International Growth FundFranklin International Small Cap Growth FundMutual European FundMutual International FundTempleton Asian Growth FundTempleton BRIC FundTempleton China World FundTempleton Developing Markets TrustTempleton Emerging Markets Small Cap FundTempleton Foreign FundTempleton Foreign Smaller Companies FundTempleton Frontier Markets Fund
HYBRIDFranklin Balanced FundFranklin Convertible Securities FundFranklin Equity Income FundFranklin Income FundTempleton Emerging Markets Balanced FundTempleton Global Balanced Fund3
ASSET ALLOCATIONFranklin Templeton Corefolio® Allocation FundFranklin Templeton Founding Funds Allocation FundFranklin Templeton Conservative Allocation FundFranklin Templeton Growth Allocation FundFranklin Templeton Moderate Allocation FundFranklin Templeton 2015 Retirement Target FundFranklin Templeton 2025 Retirement Target FundFranklin Templeton 2035 Retirement Target FundFranklin Templeton 2045 Retirement Target FundFranklin Templeton Global Allocation Fund
FIXED INCOMEFranklin Adjustable U.S. Government Securities Fund4
Franklin Floating Rate Daily Access FundFranklin High Income Fund
Franklin Limited Maturity U.S. GovernmentSecurities Fund4
Franklin Low Duration Total Return FundFranklin Real Return FundFranklin Strategic Income FundFranklin Strategic Mortgage PortfolioFranklin Templeton Hard Currency FundFranklin Total Return FundFranklin U.S. Government Securities Fund4
Templeton Global Bond FundTempleton Global Total Return FundTempleton International Bond Fund
TAX-FREE INCOME5
NationalDouble Tax-Free Income FundFederal Tax-Free Income FundHigh Yield Tax-Free Income FundInsured Tax-Free Income Fund6
Limited-/ Intermediate-TermCalifornia Intermediate-Term Tax-Free Income FundFederal Intermediate-Term Tax-Free Income FundFederal Limited-Term Tax-Free Income FundNew York Intermediate-Term Tax-Free Income Fund
State-Specific
© 2011 Franklin Templeton Investments. All rights reserved. 490 S 11/11
Semiannual Report and Shareholder Letter
Templeton Asian Growth Fund
Investment ManagerTempleton Asset Management Ltd.
DistributorFranklin Templeton Distributors, Inc.(800) DIAL BEN®/342-5236franklintempleton.com
Shareholder Services(800) 632-2301
VALUE BLEND GROWTH SECTOR GLOBAL I NTERNAT IONAL HYBRID ASSET ALLOCAT ION F IXED INCOME TAX-FREE INCOME
Authorized for distribution only when accompanied or preceded by a summary prospectus and/or prospectus.Investors should carefully consider a fund’s investment goals, risks, charges and expenses before investing. A prospectus contains this and other information; please read it carefully before investing.
To ensure the highest quality of service, telephone calls to or from our service departments may be monitored, recorded andaccessed. These calls can be identified by the presence of a regular beeping tone.
< GAIN FROM OUR PERSPECTIVE® >