Embed Size (px)
Citation preview

1
International Coffee Outlook
India International Coffee Festival 2012
“Growing with Coffee”18 to 20 January 2012
International Coffee Organization
New Delhi, India
Robério Oliveira Silva
Executive Director
ICO composite indicator price Monthly averages: January 2000 to December 2011
in current terms
200
220
240
80
100
120
140
160
180
200
US
cent
s/lb
International Coffee Organization
0
20
40
60

2
World ProductionCrop years 2000/01 to 2011/12*
123 2
129.0 128.3
122 9
134.2 132.4
130
140
150
113.0
107.7
123.2
106.3
116.3
111.4
120.0122.9
50
60
70
80
90
100
110
120
mil
lion
bag
s
International Coffee Organization
*Estimated
0
10
20
30
40
2000/01 2001/02 2002/03 2003/04 2004/05 2005/06 2006/07 2007/08 2008/09 2009/10 2010/11* 2011/12*
Production: 10 leading producers(Volume in 000 bags ‐ % of world production)
2010/11 2011/12*%
change
Brazil 48 095 43 480 ‐9.6a 8 095 3 80 9.6
Vietnam 19 467 18 500 ‐5.0
Ethiopia 7 500 9 804 +30.7
Indonesia 9 129 8 750 ‐4.2
Colombia 8 523 8 500 ‐0.3
India 5 033 5 370 +6.7
International Coffee Organization
Peru 3 976 5 000 +25.7
Mexico 4 850 4 500 ‐7.2
Honduras 4 326 4 300 ‐0.6
Guatemala 3 950 3 450 ‐12.7*Estimated

3
India: Share of Arabica/Robusta on total production Crop years 1985/86 to 2011/12*
90%
100%
20%
30%
40%
50%
60%
70%
80%
International Coffee Organization
*Estimated
0%
10%
20%
Arabica Robusta
India: Share of total production in Asia and WorldCrop years 1985/86 to 2011/12*
30%
35%
10%
15%
20%
25%
International Coffee Organization
0%
5%
Asia World
*Estimated

4
Opening stocks in exporting countriesCrop years 1964 to 2011*
85.890
100
70.768.1
81.080.2
71.0
64.5
53.8 53.855.1
40.3
49.5
44.8
29.6
32.630.5
32.734.6
52.452.0
54.9
48.2
45.342.6
64.063.5
55.8
53.154.2
52.2
47.4
53.5
44.242.2
40.041.0
55.154.0
48.3
52.7
41.2
37.2
28.427.730
40
50
60
70
80
mil
lion
bag
s
International Coffee Organization
*Estimated
19.520.5
18.517.3
0
10
20
Inventories in importing countriesCalendar years 1964 to 2011*
20 321.1
21.4
22.4 22.3
25
8.8
6.6
9.08.4
7.98.2
9.2
10.5
7.87.5
6.86 3
7.8
9.3
8.5
7.5
6 4
7.9
9.8
12.6
9.3
11.6
18.1
16.0
19.3
16.1
14.8
9.3
7.78.4 8.2
10.5
16.1
18.6
20.120.1
20.320.2
19.118.4
10
15
20
mil
lion
bag
s
International Coffee Organization
*Estimated at the end of Sep‐11
6.15.6 5.7
6.3 6.1 6.4
0
5

5
World stocks/consumption relation1964 to 2011*
1.4
1.6
0.6
0.8
1.0
1.2
International Coffee Organization
*Estimated
0.0
0.2
0.4
Inventories in importing countriesDecember 2010 and September 2011*
Dec‐10 Sep‐11* Change(000 bags)
All importing countries 18 431 22 285 4 556
European Union 12 425 14 927 2 502Belgium 4 865 6 616 1 751Italy 2 127 2 592 466Germany 2 680 2 934 254France 427 490 64Others 2 326 2 299 4
International Coffee Organization
Others 2 326 2 299 ‐4
Japan 1 755 2 510 755Norway 124 124 0Switzerland 154 143 ‐11USA 3 974 4 582 608
*Preliminary

6
Total exports to all destinationsCalendar years 2000 to 2011*
104.0
100
110
120
89.6 90.988.8
86.4
91.187.6
91.696.3 97.5 96.2 96.8
30
40
50
60
70
80
90
100
mil
lion
bag
s
International Coffee Organization
*Estimated
0
10
20
30
2000 2001 2002 2003 2004 2005 2006 2007 2008 2009 2010 2011*
calendar year
Exports by group and by type of coffeeDecember to November (000 bags)
2010/11 (Dec‐10 to Nov‐11)
2009/10(Dec‐10 to Nov‐11) Change
Total 103 931 95 557 10.1%
Colombian Milds 9 102 8 496 7.1%
Other Milds 25 435 22 743 11.8%
Brazilian Naturals 32 518 32 226 0.9%
Robustas 36 875 32 092 14 9%
International Coffee Organization
Robustas 36 875 32 092 14.9%
Arabicas 67 056 63 465 5.7%
Robustas 36 875 32 092 14.9%

7
Arbitrage: New York – LondonMonthly averages 2nd and 3rd positions
January 1990 to November 2011
180
200
60
80
100
120
140
160
US cents per pound
International Coffee Organization
0
20
40
Exports by the top 10 exporting countriesDecember to November (000 bags)
2010/11 2009/10 Change
Brazil 33 869 32 154 5.3%
Vietnam 17 025 14 503 17.4%
Colombia 7 982 7 504 6.4%
Indonesia 6 190 5 725 8.1%
India 5 993 4 430 35.3%
Peru 4 027 3 752 7.3%
International Coffee Organization
Honduras 3 900 3 181 22.6%
Guatemala 3 700 3 442 7.5%
Uganda 3 138 2 691 16.6%
Mexico 2 865 2 509 14.2%
8
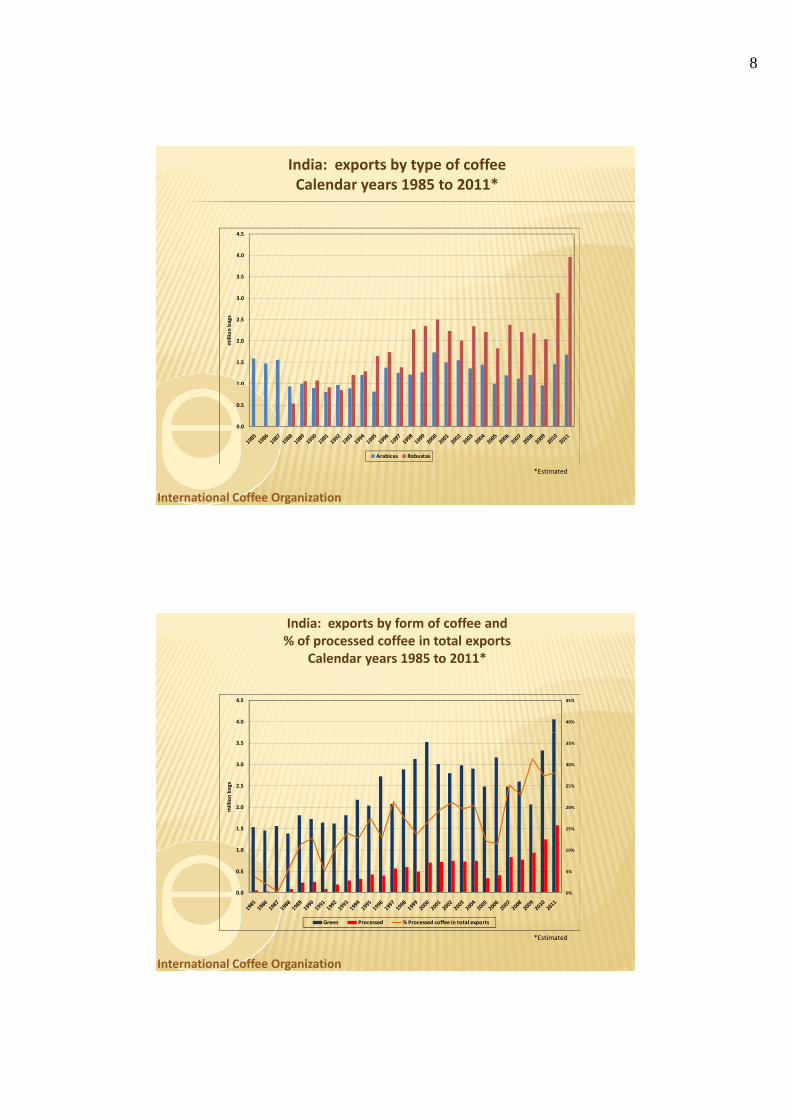
India: exports by type of coffeeCalendar years 1985 to 2011*
4.0
4.5
1.0
1.5
2.0
2.5
3.0
3.5
million bags
International Coffee Organization
0.0
0.5
Arabicas Robustas
*Estimated
India: exports by form of coffee and % of processed coffee in total exports
Calendar years 1985 to 2011*
40%
45%
4.0
4.5
10%
15%
20%
25%
30%
35%
1.0
1.5
2.0
2.5
3.0
3.5
million bags
International Coffee Organization
*Estimated
0%
5%
0.0
0.5
Green Processed % Processed coffee in total exports

9
Value of coffee exportsCalendar years 2000 to 2011*
23.525
8.2
6.9
9.3
10.8
12.8
15.4
13.3
16.7
10
15
20
billion US dollars
International Coffee Organization
*Estimated
5.4 5.25.6
0
5
2000 2001 2002 2003 2004 2005 2006 2007 2008 2009 2010 2011*
World consumption Calendar years 2000 to 2010*
124.6129.3
132.9 131.8135.0
130
140
150
105.5109.8 111.4
114.0
120.0 120.8124.6
50
60
70
80
90
100
110
120
million bags
International Coffee Organization
*Estimated
0
10
20
30
40
2000 2001 2002 2003 2004 2005 2006 2007 2008 2009 2010

10
World coffee consumption Evolution 2000 – 2010
(in thousand bags)
Change (2010)‐(2000)
Period growth rate (%)2000 2010* Volume %
Traditional markets 63 589 70 973 7 383 11.6 1.1
Producing countries 26 383 41 331 14 948 56.7 4.6
International Coffee Organization
Emerging markets 15 994 22 693 6 699 41.9 3.6
World total 105 966 134 997 29 030 27.4 2.5
*Estimated
Estimated consumption: 10 leading markets by volume
2009 2010 % changemillion bags
World total 131 8 135 0 2 4World total 131.8 135.0 2.4USA 21.4 21.7 1.6Brazil 18.2 18.9 4.1Germany 8.9 9.3 4.4Japan 7.1 7.2 0.9Italy 5.8 5.8 ‐0.4
0 6
International Coffee Organization
France 5.7 5.7 0.6Russian Federation 3.1 3.7 16.9Canada 3.3 3.6 8.9Spain 3.4 3.2 ‐3.6United Kingdom 3.2 3.1 ‐2.7
11
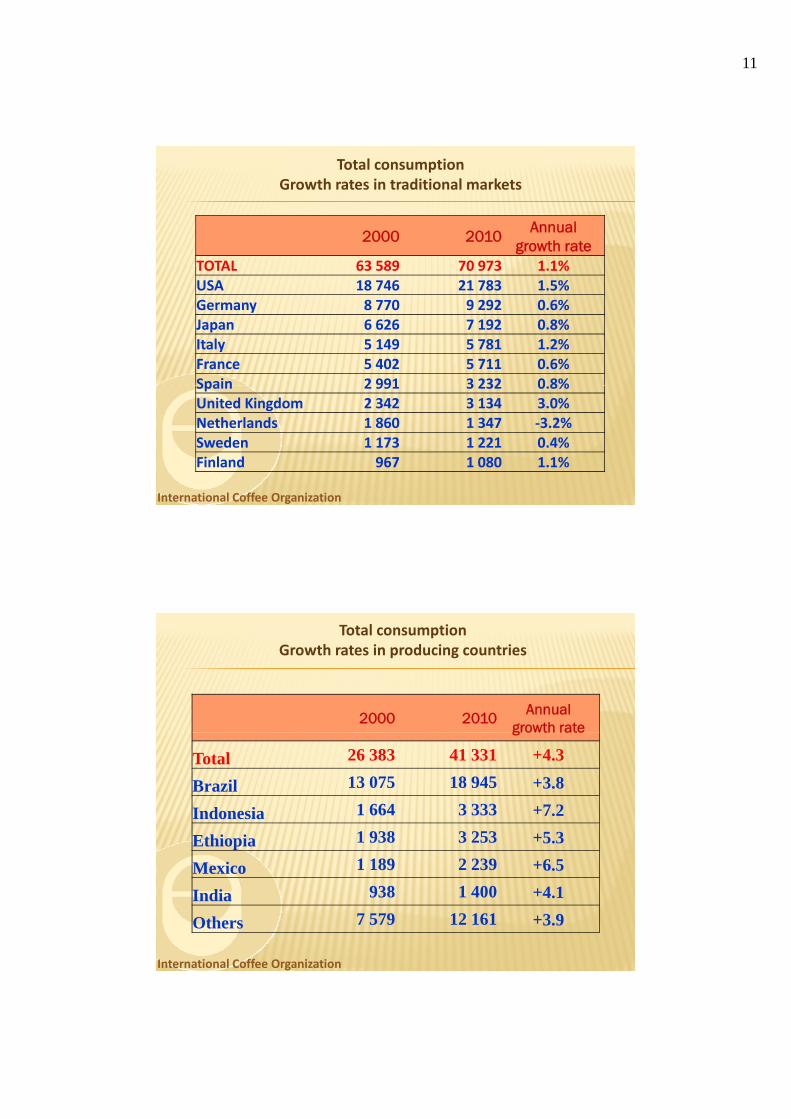
Total consumption Growth rates in traditional markets
2000 2010Annual
growth rateTOTAL 63 589 70 973 1 1%TOTAL 63 589 70 973 1.1%USA 18 746 21 783 1.5%Germany 8 770 9 292 0.6%Japan 6 626 7 192 0.8%Italy 5 149 5 781 1.2%France 5 402 5 711 0.6%Spain 2 991 3 232 0 8%
International Coffee Organization
Spain 2 991 3 232 0.8%United Kingdom 2 342 3 134 3.0%Netherlands 1 860 1 347 ‐3.2%Sweden 1 173 1 221 0.4%Finland 967 1 080 1.1%
Total consumptionGrowth rates in producing countries
2000 2010Annual
growth rategrowth rate
Total 26 383 41 331 +4.3
Brazil 13 075 18 945 +3.8
Indonesia 1 664 3 333 +7.2
Ethiopia 1 938 3 253 +5.3
International Coffee Organization
Mexico 1 189 2 239 +6.5
India 938 1 400 +4.1
Others 7 579 12 161 +3.9

12
Top 10 producers: ratio (domestic consumption/total production)Crop years 2000/01 and 2011/12*
2000 2011*
Brazil 42.2% 46.6%
Vietnam 2.7% 8.6%
Ethiopia 64.7% 34.5%
Indonesia 24.0% 38.1%
Colombia 13.5% 16.5%
India 22.9% 32.7%
Mexico 27 1% 52 3%
International Coffee Organization
*Estimated
Mexico 27.1% 52.3%
Peru 7.5% 5.6%
Honduras 8.6% 10.7%
Guatemala 6.1% 9.4%
Total consumptionGrowth rates in emerging markets
2000 2010Annual
growth rateTotal 15 994 22 693 3 6%Total 15 994 22 693 3.6%Russian Federation 1 863 3 661 7.0%
Poland 2 046 2 156 0.5%
Algeria 1 779 2 021 1.3%
Korea, Rep. of 1 246 1 666 3.0%
Ukraine 179 1 485 23.6%
Australia 832 1 370 5.1%
R i 551 796 3 7%
International Coffee Organization
Romania 551 796 3.7%
Turkey 291 610 7.7%
Israel 287 553 6.8%
South Africa, Rep.of 368 553 4.1%
Serbia 644 548 ‐1.6%

13
Thank youThank youध यवाद
www ico org
International Coffee Organization
www.ico.org
Robério Oliveira Silva
Executive Director