Embed Size (px)
Citation preview

127
International Communications Market Report 2012
3
3 Television and audio-visual

128
Contents
3.1 Market developments in the TV and audio-visual markets 129
3.1.1 Industry metrics and summary 129 3.1.2 Global TV revenues increased in 2011, driven by strong growth in
subscription income 131 3.1.3 Digital take-up slows down as more countries reach switchover 132 3.1.4 Continued growth in value-added services on DTV 135 3.1.5 UK consumers most likely to use online TV services 139
3.2 The TV and audio-visual industries 141
3.2.1 Summary 141 3.2.2 Television revenues among comparator countries 141 3.2.3 TV revenue per head among comparator countries 145 3.2.4 TV licence fees most common in Europe 147 3.2.5 Revenues up marginally for most free-to-air broadcasters 148 3.2.6 Pay-TV revenues up despite difficult trading conditions 148
3.3 The TV and audio-visual consumers 151
3.3.1 Summary 151 3.3.2 Digital television take-up on main sets 151 3.3.3 Take-up of HDTV services, digital video recorders and connected TVs 155 3.3.4 Pay-TV take-up 158 3.3.5 Consumption of broadcast television services 161

129
3.1 Market developments in the TV and audio-visual markets 3.1.1 Industry metrics and summary The TV and audio-visual chapter focuses on three topics – key market developments in the sector, industry revenue, and trends among TV and audio-visual consumers. It includes a global overview and country-level analysis of the 17 comparator countries.
• Key Market Developments details some of the major TV and audio-visual industry trends during the past year, covering analysis of global revenue, take-up of digital television and technology developments.
• The TV and audio-visual industries section focuses on key revenue trends in comparator countries, including financial results for major pay-TV and free-to-air broadcasters.
• The TV and audio-visual consumer section examines patterns of digital television take-up, including the adoption of high-definition television services and digital video recorders. This section also examines how viewers in different countries consume broadcast television channels and TV online.
Figure 3.1 TV industry metrics
Source: IDATE / industry data / Ofcom / Mediametrie, Eurodata TV Worldwide. Figures have been converted to GBP using IMF 2011 average exchange rates. ¹The Japanese licence fee costs £117 in terrestrial households or £200 to receive a larger number of channels via satellite.²Refers to average TV viewing per head, per day.
UK
FRA
GER
ITA
USA
CAN
JPN
AUS
ESP
NED
SWE
IRL
POL
BR
A
RU
S
IND
CH
N
TV revenue (£bn) 11.3 10.2 11.6 7.8 100 4.4 31.1 5.3 4.8 2.6 1.8 0.9 2.4 12.4 3.6 5.5 12.4
Revs change (%, YOY) 2.7 2.6 3.1 -2.7 6.5 5.7 2.8 4.4 -4.9 5.4 5.1 1.6 10.4 12.7 16.6 14.2 14.4
Revenue per cap (£) 180 155 142 127 320 128 244 244 102 155 198 182 62 63 26 5 9
from advertising 56 46 43 63 115 66 111 115 36 49 61 37 20 36 20 1 6
from subscription 80 76 48 40 204 44 91 95 27 66 96 111 41 25 6 3 4
From public funds 44 33 51 24 1 18 42 34 39 40 41 34 1 1 0 0 0
TV licence fee¹ 146 107 187 97 n/a n/a 200 n/a n/a n/a 199 139 42 n/a n/a n/a n/a
Largest TV platform
Platform
% of homes
Dsat DTT Dsat DTT DCab DCab Dcab DTT DTT Dcab Acab Dsat DSat DSat ACab Acab Dcab
44% 30% 35% 43% 40% 53% 27% 49% 69% 47% 33% 53% 45% 45% 34% 58% 28%
TV viewing (mins/day)² 242 227 225 253 293 240 n/a 189 239 191 162 205 242 225 220 119 163
No.1 channel share (%) 21 24 14 19 7 9 n/a 15 15 19 23 23 17 40 17 9 7
DTV take-up (%) 99 97 66 93 89 87 77 83 100 77 67 90 62 69 40 40 43
Pay TV take-up (%) 55 62 64 35 89 93 63 34 27 99 92 76 78 23 64 94 57
DSO date 2012 2011 2008 2012 2009 2011 2011 2013 2010 2006 2007 2012 2013 2016 2015 2014 2015

130
Some of the key market developments seen during the past year include:
• Global TV revenues increased in 2011, by 6.7% year on year, to £258bn. Despite the challenging economic conditions, global TV revenues have increased by 5.2% on a compound annual basis over the four-year period since 2007.
• Global subscription revenues show little sign of slowing down and increased for the fourth year in a row, from £95bn in 2007 to £133bn in 2011 – a compound annual growth rate of 9%. At £133bn, income generated from subscription fees represented over half (52%) of the total global TV revenue of £258bn in 2011. In 2010 and 2007 subscription income as a proportion of total revenue was lower, at 50% and 45% respectively.
• The global recovery in net advertising revenues seen in 2010 has been sustained in 2011, with revenues increasing 3.5% (or £3bn) to £105bn year on year. Advertising income as a proportion of global TV revenue has declined over the past four years (from 46% in 2007 to 41% in 2011) while income from TV subscriptions has seen a corresponding increase over the same time period.
• By the end of 2011, the vast majority of homes had digital television in the UK, France and Spain. In the UK, 99% of TV homes had access to DTV at the end of 2011, a figure surpassed only by Spain where, following the completion of switchover, access to DTV stands at 100%. In France, penetration of digital TV stood at 97% in 2011.
• Over a quarter (28%) of primary TV sets receive an IPTV service in France, where this constitutes a mainstream alternative to DTV. In most other countries, including the UK, IPTV penetration is much lower, due in part to the challenges of gaining a foothold in the face of a range of well-established competing digital platforms.
• The UK also has one of the highest proportions of TV homes with high definition among the countries included in our research - at 41%, higher than France (18%), Germany (28%) and Japan (31%), but behind the US (49%).
• People in the UK and France have the highest ownership of connected TVs among the countries included in our research. In both the UK and France, 15% of respondents claimed to have a television that connects to the internet, providing access to features such as catch-up services, social networking, customised electronic programming guides (EPG) and gaming.
• Digital video recorders are widely available in the UK, with 39% of people in our research claiming to own a DVR device. Of the nine countires surveyed, the UK records the greatest uptake, followed by the US (32%), Australia (29%) and China (27%).
• UK consumers are more likely to access TV content over the internet than those in other countries in our research. Almost a quarter (23%) of UK internet users claimed to do this every week – driven by the popularity in the UK of internet TV catch-up services from the free-to-air broadcasters, such as BBC iPlayer, 4oD and ITV Player.

131
3.1.2 Global TV revenues increased in 2011, driven by strong growth in subscription income
Ofcom estimates that global TV revenues increased in 2011, by 6.7% year on year, to £258bn. Despite the challenging economic conditions, global TV revenues have increased on average by 5.2% per annum over the four-year period since 2007.
Our analysis of global television revenues incorporates the three main components of net advertising revenue, TV licence fees and subscriptions - it excludes revenues generated from pay-per-view (PPV), video on demand (VOD) and over the top/streaming (OTT) services. However, data from PwC’s Global Media and Entertainment Outlook: 2012-2016 indicates that global income for these services combined has increased by 21.4% on a compound annual basis over the past four years, from £2.2bn in 2007 to £5.8bn in 2011, as they have become an increasingly intrinsic part of many pay-TV offerings. However, the amount of income generated by these services is still significantly below the three main components of TV revenue.
Figure 3.2 Global TV revenues
Source: Ofcom analysis based on data taken from PricewaterhouseCoopers Global Entertainment and Media Outlook 2012-2016 @ www.pwc.com/outlook. IDATE / industry data / Ofcom for US and UK revenues. Notes: Net TV advertising revenues for Russia have been calculated by discounting 15% of TV advertising spending to remove agency fees and production costs. Interpretation and manipulation of data are solely Ofcom’s responsibility. Ofcom has used an exchange rate of $1.604 to the GBP, representing the IMF average for 2011.
The 6.7% increase in global television revenues, to £258bn in 2011, was driven primarily by continued growth in subscription income, combined with a sustained recovery in advertising revenues.
Despite difficult trading conditions, global subscription revenues showed little sign of slowing down and increased for the fourth year in a row, from £121bn in 2010 to £133bn in 2011 – a year-on-year increase of 10.5%. At £133bn, income generated from subscription fees represented over half (52%) of the total global TV revenue of £258bn in 2011; in 2010 and 2007 subscription income as a proportion of total revenue was lower, at 50% and 45% respectively.
Following a decline in 2009, global net television revenues (NAR) bounced back in 2010, with an 11.8% increase to £102bn. This recovery has been sustained in 2011, with revenues increasing by 3.5% (or £3bn) to £105bn.
£211bn £221bn £221bn£242bn £258bn
0
50
100
150
200
250
300
2007 2008 2009 2010 2011
Revenue (£bn)CAGR (4yr)YOY5.2%6.7%

132
Public funding, usually sourced from TV licence fees or government grants, remained unchanged in 2011 at £20bn. Revenue from this source has also been relatively stable over the four-year period, growing on an average compound basis by 1.4% per year from £19bn in 2007.
Figure 3.3 TV industry revenues, by source
Source: Ofcom analysis based on data taken from PricewaterhouseCoopers Global Entertainment and Media Outlook 2012-2016 @ www.pwc.com/outlook. IDATE / industry data / Ofcom for US and UK revenues. Notes: Net TV advertising revenues for Russia have been calculated by discounting 15% of TV advertising spending to remove agency fees and production costs. Interpretation and manipulation of data are solely Ofcom's responsibility. Ofcom has used an exchange rate of $1.604 to the GBP, representing the IMF average for 2011.
3.1.3 Digital take-up slows down as more countries reach switchover In 2011, take-up of digital television (DTV) slowed overall. In only a few comparator countries (all approaching scheduled switchover from analogue) did the proportion of primary TV sets receiving DTV increase more quickly in 2011 than in 2010. Levels of DTV conversion fell into three broad categories:
• Almost complete digital conversion. In Spain (100%), the UK (99%) and France (97%), all or nearly all main TV sets received DTV in 2011. Since Spain’s switchover in 2010, the remaining 2% of analogue households have converted to receive DTV. In the UK, almost all households received DTV in their homes at the end of 2011.
• DTV available in 60% to 80% of homes. In the Netherlands (77%), Japan (77%), Brazil (69%), Sweden (67%), Germany (66%) and Poland (62%) the majority of households receive DTV. In many of these countries terrestrial broadcasting is less popular than in markets like the UK and Spain, and DTV faces greater competition from competitors such as analogue cable.
• Analogue platform predominating. In developing TV markets like China (DTV take-up at 43%), Russia (40%) and India (40%), the majority of primary TV sets are currently analogue. Switchover is scheduled for 2013 in India and 2015 in China and Russia, so higher rates of switchover are likely in coming years.
The rate of switchover to digital slowed in the growing number of comparator countries where conversion was almost complete. Year-on-year growth in the proportion of TV
£95bn £103bn £111bn £121bn £133bn
£19bn £19bn £19bn £20bn £20bn
£98bn £98bn £91bn £102bn £105bn
0%
20%
40%
60%
80%
100%
2007 2008 2009 2010 2011
Advertising
Public funds
Subscriptions
£211bn £221bn
1.8%
1.4%
9.0%
CAGR (4yr)£258bn£242bn£221bn
YOY
3.5%
-0.2%
10.5%
5.2%6.7%
Pro
porti
on o
f rev
enue
s

133
households receiving DTV on primary sets was 2pp in Spain and 3pp in France in 2011, whereas it was 14pp in both in 2010. In Ireland both DTV penetration (90%) and percentage increase in converted households (8pp) were high, but the increase was lower than it had been between 2009 and 2010 (18pp).
By contrast, in Australia the pace of digital conversion quickened in 2011 (11pp year-on-year growth), despite high levels of digital penetration (83%). With switchover scheduled for 2013, Australia is likely to maintain high rates of conversion in the near future. Poland was the only other non-BRIC country where households converted to DTV more quickly than in previous years, although from a lower base of DTV households.
Among countries where 60% to 80% of households receive DTV (Germany, the Netherlands, Sweden and Brazil), the speed at which households adopted DTV slowed in 2011. In Brazil the proportion of DTV households increased by 20pp in 2009-2010, but by 10pp in 2011 (still the fastest rate of change in this category of countries). In Germany the decline in the speed of digital adoption was particularly pronounced: the proportion of digital households grew by 4pp in 2011, in comparison with a 12pp increase in 2010.
Figure 3.4 Take-up of digital and analogue television: 2011
Source: IDATE / industry data / Ofcom.
Since 2006, eight countries have completed digital terrestrial switchover. France, Canada and Japan reached switchover in 2011, as did the Netherlands, Sweden, Germany, the US and Spain in previous years. However, 23% of TV households in Japan did not receive DTV on their primary set, nor did large minorities of households in the Netherlands, Sweden and Germany. The popularity of analogue cable in these countries may be slowing the conversion to digital.
There are a number of terrestrial switchover initiatives across several TV markets, scheduled for completion in 2012 and 2013. Whereas digital conversion in the UK was largely complete in 2011, ready for switchover in 2012, in India, where the scheduled deadline for completion is 2014, it stood at just 40%. China and Russia are scheduled to switch in 2015.
99% 97%
66%
93% 89% 87%77%
83%
100%
77%67%
90%
62%69%
40% 40% 43%
1% 3%
34%
7% 11% 13%23%
17%
0%
23%33%
10%
38%31%
60% 60% 57%
0%
20%
40%
60%
80%
100%
UK FRAGER ITA US CAN JPN AUS ESP NEDSWE IRE POL BRA RUS IND CHI
AnalogueDigital
Proportion of TV homes (%)
+1 +3 +4 +1 +2 +9 +4 +11 +2 +9 +4 +8 +7 +10 +9 +9 +9Year-on-year change (pp)

134
Figure 3.5 Timeline for digital switchover, by country and date
Source: IDATE / industry data / Ofcom.
In India, Russia and China, growth in the proportion of DTV homes accelerated slightly in 2011. In all three it stood at 9pp, whereas in 2010 the increase had been 8pp. In 2011 households in BRIC countries converted fastest among all the comparator countries other than Australia, despite the deceleration of the speed of conversion in Brazil. However, the proportion of homes in Russia, India and China receiving DTV is still comparatively low, with 60% of primary TV sets remaining analogue. Russia and China are not scheduled to complete switchover until 2015, the latest deadlines set by any of the comparator countries.
Figure 3.6 Percentage point change in the take-up of DTV: 2010 and 2011
Source: IDATE / industry data / Ofcom.
Over a quarter of homes in France now have access to an IPTV service
Internet protocol television (IPTV) is the term used for television and/or video signals that are delivered to subscribers or viewers using internet protocol (IP) technology, and is typically used in the context of streamed linear and on-demand content.
In 2011, IPTV developed further as a competitor to digital platform technologies, encouraged by the marketing of triple-play bundled services in countries with high-bandwidth infrastructure. In France, where well over a quarter of primary TV sets (28%) can receive an IPTV service, it constitutes a mainstream alternative to DTV. IPTV has penetrated the
2006 2007 2008 2009 2010 2011 2012 2013 2014
NED SWE GER USA
Switchover complete
ESP
FRA
JPNCAN
IRL
UKITA
POL
Switchover underway
AUS
IND
2015
RUS
2016
BRA
CHNSwitchover deadline
4
1412
64
9 910
14
10
6
18
5
20
8 8 8
1
3 4
12
9
4
11
2
9
4
8 7
10 9 9 9
0
4
8
12
16
20
24
UK FRA GER ITA US CAN JPN AUS ESP NED SWE IRE POL BRA RUS IND CHI
Per
cent
age
poin
t cha
nge
2010 2011
2 year change
+4 +17 +16 +7 +6 +18 +13 +22 +16 +19 +10 +26 +12 +30 +17 +17 +18

135
market more quickly here than in any other comparator country, benefiting from early introduction, competition between providers on price and the low availability of cable services.
Take-up of IPTV services exceeded 4% in seven of the comparator countries, reaching 5% in Canada (it was under 1% in the UK). In Sweden and the Netherlands, the proportion of main sets connected to IPTV exceeded 10% for the first time (11% in both). Uptake increased particularly quickly in the Netherlands, where just 5% of main sets could access IPTV a year earlier. This was a faster rate of growth than that seen in any other comparator country, including France. In the Netherlands, where IPTV increased by 6 percentage points in 2011, IPTV subscriptions including catch-up TV, video on demand and HD quality are available at a cost comparable to that for basic digital cable, which is not available across the whole country.
Figure 3.7 IPTV take-up on main TV sets in countries where take-up exceeded 4% in 2011
Source: IDATE / industry data / Ofcom. Notes: The chart only shows countries where IPTV take-up exceeded 4% of television homes in 2011.
3.1.4 Continued growth in value-added services on DTV The transition to digital television continues in the countries covered in this report, with eight countries now complete and three more countries switching over in 2012. As digital TV becomes the norm, operators are turning to value-added services such as high definition television (HDTV), digital video recorders (DVR) and on-demand services, in order to ensure their propositions remain distinctive.
The UK has one of the highest proportions of TV homes with high definition among the countries included in our research. At 41%, take-up of HDTV in the UK is higher than France (18%), Germany (28%) and Japan (31%), but behind the US (49%).
12%
14%
18%
24%
28%
1% 2%3%
4%
1%
3%4%
6%7%
4% 4%5% 5%
6%3% 3%
4% 5%
11%
8% 8%9% 10%
11%
1% 1% 2% 3%
5%
0%
5%
10%
15%
20%
25%
30%
2006 2007 2008 2009 2010 2011
FRA
GER
USA
ESP
NED
SWE
CAN
Take-up (% of TV homes)

136
Figure 3.8 Take up of High Definition TV
Source: Ofcom Consumer Research October 2012 Base: Total sample size UK=1065, France=1016, Germany=1024, Italy=1015, US=1010, Japan=1004, Australia=1007, Spain=1001, China=1010 Q: Which of the following devices do you own and personally use?
Among European nations, DTT is now the most popular way of receiving high definition content in the home, accounting for 16.4 million homes. Sattelite was the second most popular platform, with a further 15.6 million households; digital cable and IPTV commanded a further 11.2 million between them.
In the US, cable was the most popular platform for HD services (accounting for 24.6 million homes), followed by satellite and DTT. In Japan, cable’s contribution to the total number of HD homes remained very small in 2011, at 0.6 million homes. Of the 23 million HD homes in Japan, 11.9 million are accounted for by the satellite platform, with DTT making up a further 10.8 million.
41%
18%
28% 28%
49%
31%
46%
30%35%
0%
10%
20%
30%
40%
50%
60%
70%
UK FRA GER ITA USA JPN AUS ESP CHN
Take-up (%)

137
Figure 3.9 Number of HD homes, by platform and country: end 2011
Source: IDATE / industry data / Ofcom. Notes: Paying and FTA HD homes; no data available for IPTV take-up in Japan.
Digital video recorders are available in nearly four in ten homes across the UK
Digital video recorders (that enable TV programmes to be recorded, paused and rewound) are now widely available in the UK, with 39% of adults aged 18+ claiming to own a DVR device. Of the nine countries that we surveyed, people in the UK were the most likely to say they had a DVR at home. In the US, Australia and China, more than one in four people say they own a DVR (32%, 29% and 27% respectively). Italy and France had the lowest take-up at 19% and 18% penetration respectively.
Figure 3.10 Claimed DVR take-up
Source: Ofcom consumer research October 2012 Base: Total sample size: UK=1065, France=1016, Germany=1024, Italy=1015, USA=1010, Japan=1004, Australia=1007, Spain=1001, China=1010, Q: Which of the following devices do you own and personally use?
20.315.6 11.9
24.6
4.7
0.6
2.0
6.5
13.0
16.4
10.8
59.9
43.2
23.3
0
10
20
30
40
50
60
70
US UK, FRA, GER, ITA JPN
DTT
IPTV
Cable
Satellite
Sub
scrib
ers (
m)
39%
18%21%
19%
32%
24%
29%
22%
27%
0%
10%
20%
30%
40%
50%
UK FRA GER ITA USA JPN AUS ESP CHN
Take
-up
(%)

138
Take-up of connected TVs beginning to gather momentum
With the exception of China, people in the UK and France have the highest ownership of connected TVs, among the countries included in our research. In both cases, 15% of respondents claimed to have a television that connects to the internet, providing access to features such as catch-up services, social networking, customised electronic programming guides (EPG) and gaming.
Twenty-eight per cent of respondents in China claim to have a connected TV set. As broadband penetration in China is much lower than in the other countries, the respondents responding to our internet-based research are more likely to be early adopters of new technology.
Our research indicates that connected TVs have proved more popular with consumers than televisions with 3D capability (with or without special glasses), with claimed ownership of the former consistently higher than the latter in every country in our research. However, many connected TVs come with built-in 3D capabilities, so the actual penetration of 3DTV may be higher than indicated below.
Figure 3.11 Claimed take-up of connected televisions and 3D-ready TVs
Source: Ofcom consumer research October 2012. Base: Total sample size UK=1065, France=1016, Germany=1024, Italy=1015, US=1010, Japan=1004, Australia=1007, Spain=1001, China=1010. Q: Which of the following devices do you own and personally use?
15% 15%
10%9%
10%
5%
10%12%
28%
8%9%
12%13%
8%
3%
9%11%
18%
0%
5%
10%
15%
20%
25%
UK FRA GER ITA USA JPN AUS ESP CHN
Connected or smart TV 3D-ready TVTake-up (%)

139
Three key factors for connected TV For connected TV take-up to continue to grow, three areas need to develop: connectivity, content and functionality. In terms of connectivity, connected TVs will deliver high-definition video alongside the benefits of web functionality in a TV broadcast environment. This is akin to marrying the interconnectivity of short-form video services like YouTube and Dailymotion with the quality of existing broadcast coverage and HD. In terms of content, , programmes which invite engagement and drive viewing will become more widely available across various platforms. So far, examples of content enhancers on Smart TVs are catch-up and social applications. Finally, extra functionality will provide additional services and enable new modes of content discovery. For example, the EPG will become more contextual (suggesting appropriate content based on the user’s observed behaviour), and the connected TV will communicate with other devices, including second screens and their applications.
3.1.5 UK consumers most likely to use online TV services Figure 3.12 shows the proportion of internet users who use their home internet connection to watch TV online. With the exception of China (where broadband penetration is much lower than the other countries in our research), UK consumers are the most likely to access TV content over the internet. Almost a quarter (23%) of internet users claimed to do this every week – a figure which increases to 42% when asked whether they had ever accessed TV content over the web.
This is probably driven by the popularity in the UK of internet TV catch-up services from the free-to-air broadcasters, such as BBC iPlayer, 4oD and ITV Player. According to data from the BBC, BBC iPlayer continues to grow in popularity, with 151 million requests for TV programmes in August 2012 (driven by high demand for Olympics coverage), up from 115 million in 2010 and 91 million in August 2009.
Figure 3.12 Accessing TV content over the internet
Source: Ofcom consumer research October 2012. Base: Total sample size UK=1065, France=1016, Germany=1024, Italy=1015, US=1010, Japan=1004, Australia=1007, Spain=1001, China=1010 Q. Which of the following activities do you use your home internet connection for?
In the UK, internet users aged 18-24 are the most likely to access TV content online (31% claiming to do so), while 45-54 year olds are the least likely (19%). This pattern is generally
42%
31%
19%
26%31%
11%
27%
34%
68%
23%
13%9%
12%17%
3%
12%16%
44%
0%
10%
20%
30%
40%
50%
60%
70%
UK FRA GER ITA USA JPN AUS ESP CHI
Ever WeeklyProportion of respondents that access online TV (%)

140
consistent across the countries surveyed, although in some countries, such as the US, 25-35 year olds have a higher propensity than 18-24 year olds to watch TV over the internet.
Figure 3.13 Accessing TV content over the internet, by age
Source: Ofcom consumer research October 2012. Base: UK=1065, France=1016, Germany=1024, Italy=1015, US=1010, Japan=1004, Australia=1007, Spain=1001, China=1010. Q: Which, if any, of the following activities do you use your home internet connection for?
Figure 3.14 shows the proportion of internet users who watch TV content online (on a weekly basis) and own a connected TV. In all countries, the research indicates that consumers who own a connected TV are more likely to watch TV via the web. In the UK, 39% of respondents who own a connected TV watch content online on a weekly basis, compared to 23% of all respondents in our survey. For further detail on connected TVs see Figure 3.11.
Figure 3.14 Accessing TV content over the internet, by connected TV ownership
Source: Ofcom consumer research October 2012. Base: Total sample size UK=1065, France=1016, Germany=1024, Italy=1015, US=1010, Japan=1004, Australia=1007, Spain=1001, China=1010. Q. Which of the following activities do you use your home internet connection for?
31%
15%
10% 13
%
22%
4%
16%
15%
42%
24%
14%
12% 14
%
26%
7%
16% 18
%
48%
22%
17%
8%
12%
22%
2%
9%
15%
41%
19%
10%
9% 8%
11%
1%
10%
17%
44%
23%
19%
7%
13% 17
%
4%
9%
11%
39%
0%
10%
20%
30%
40%
50%
UK FRA GER ITA USA JPN AUS ESP CHI
18-24 25-34 35-44 45-54 55-64
Proportion of respondents accessing online TV weekly(%)
39%
21%15%
27%
37%
11%
24%
31%
57%
23%
13%9%
12%17%
3%
12%16%
44%
0%
10%
20%
30%
40%
50%
60%
70%
UK FRA GER ITA USA JPN AUS ESP CHI
Those who own a connected TV All respondents
Proportion of respondents that access online TV (%)

141
3.2 The TV and audio-visual industries 3.2.1 Summary This section focuses on the TV and audio-visual industries, looking at the key revenue trends among our comparator countries, and the financial results of major pay-TV and free-to-air broadcasters.
• Revenues among the 17 countries analysed by Ofcom increased by 5.8% in 2011 to £228bn. Growth was driven largely by the BRIC countries – Brazil, Russia, India and China – whose joint revenues increased by 14% (or £4bn) in 2011 to £34bn – the largest year-on-year growth of all the regions in our analysis.
• The combined revenues of Europe and Canada experienced the lowest year-on-year growth of all the regions in our analysis, increasing by 2.0% in 2011 to £58bn.
• The UK experienced moderate growth in television revenues in 2011, up by 2.7% or £0.3bn, while revenues for Spain and Italy both declined. Spain experienced the largest year-on-year decline, falling 4.9% in 2011 to £4.8bn, while Italy fell by 2.7% to £7.8bn.
• Among the major European television markets of Germany, the UK and France, pay-TV was the fastest-growing source of revenue over the five-year period between 2006 and 2011. The TV advertising market remained relatively flat over the corresponding period, for each country, driven by difficult trading conditions during the economic downturn.
• Pay-TV companies continue to outperform their free-to-air counterparts, with revenues up for all but one operator in our analysis. BSkyB in the UK reported one of the largest increases in revenue, up 17.3% to £6.2bn, a figure surpassed only by Sky Deutschland’s performance (in Germany) where income rose by 18.1% on 2010 to £1.0bn.
• Pay-TV operators continue to drive up average revenue per user (ARPU) as more subscribers trade up to premium products such as digital video recorders (DVRs) and high-definition TV. Over the past five years, ARPU for the UK pay-TV market has increased by £35 (10.7%); from £327 in 2006 to £362 in 2011.
3.2.2 Television revenues among comparator countries Global television revenues driven by strong growth in BRIC countries in 2011
Revenues among the 17 countries analysed by Ofcom increased by 5.8% in 2011, to £229bn. As in 2010, the BRIC countries – Brazil, Russia, India and China – experienced the largest year-on-year growth, with their joint revenues increasing by nearly a fifth (14.0%) in 2011, up £4bn to £34bn. This growth was driven by both rising TV advertising and subscription income.
The gap between the BRIC countries (accounting for the smallest proportion of revenue among the 17 countries in our report) and the combined revenues of Japan and Australia (the second smallest) has diminished over the past five years, with the two regions now almost equal in terms of TV revenue. While the combined revenues of Japan and Australia increased by 3.0% in 2011 to £36bn, compound annual growth over the five-year period was relatively small, at just 1.4%.

142
The combined revenues of Europe and Canada67 experienced the lowest year-on-year growth of all the regions in our analysis, increasing by only 2.0% in 2011, to £58bn. In contrast, the US, which is the largest television market globally, increased by 6.5% in 2011, up £6bn to £100bn. Over the five-year period since 2006, US television revenues have increased on average by 5.7% per annum, compared to 2.9% for Europe and Canada combined.
Figure 3.15 TV industry revenues among comparator countries
Source: IDATE / industry data / Ofcom. Notes: Ofcom has used an exchange rate of $1.604 to the GBP, representing the IMF average for 2011. Revenues include advertising, subscriptions and sources of public funding only. Europe includes the European countries in this analysis – UK, France, Germany, Italy, Spain, Netherlands, Sweden, Republic of Ireland and Poland. BRIC is Brazil, Russia, India and China.
Compared to the other eight European countries in our analysis, the UK experienced moderate growth in television revenues in 2011, increasing by 2.7% (£0.3bn). However, at £11.3bn, the UK remains on a par with Germany (at £11.6bn) as the two largest TV markets in Europe in terms of monetary value in 2011.
Spain and Italy both recorded declines in television revenue in 2011. Spain experienced the largest year-on-year decline, falling 4.9% in 2011 to £4.8bn, while Italy declined by 2.7% to £7.8bn. Over the five-year period since 2006, TV revenues for Spain declined by 0.1%, compared to growth of 1.7% for Italy over the same time period.
67 Canada categorised with Europe, not the US, due to the market being similar in scale to European economies.
£66 £70£76
£83 £86 £85£94
£100
£45 £48 £50 £53 £54 £53 £57 £58
£33 £34 £34 £35 £35 £33 £35 £36
£14 £16 £18 £20 £23 £25 £30£34
£0bn£10bn£20bn£30bn£40bn£50bn£60bn£70bn£80bn£90bn
£100bn£110bn
2004 2005 2006 2007 2008 2009 2010 2011
USA
Europe / Canada
Japan / Australia
BRIC
3.0%
2.0%
6.5%
1.4%
2.9%
5.7%
14.0% 13.8%
Total revenues (£bn)£158bn £168bn £178bn £191bn £197bn £197bn
CAGR (5 yr)YOY
Growth (%)
5.8% 5.1%£216bn £228bn

143
Figure 3.16 TV industry revenues among European countries and Canada
Source: IDATE / industry data / Ofcom. Notes: Ofcom has used an exchange rate of $1.604 to the GBP, representing the IMF average for 2011. Revenues include advertising, subscriptions and sources of public funding only. Europe includes the European countries in this analysis – UK, France, Germany, Italy, Spain, Netherlands, Sweden, Republic of Ireland and Poland.
TV revenues increased in 2011 for all four BRIC countries. Russia saw the highest proportional growth in revenue, up by almost a fifth (16.6%) to £3.6bn. China and Brazil also recorded significant growth, up 14.4% year on year and 12.7% respectively, making them by far the largest television markets among the BRIC countries in terms of revenue, at £12.4bn.
£10.4£10.8 £10.9 £11.0 £11.0 £10.9
£11.2£11.6
£9.3£9.8 £9.8
£10.3 £10.4 £10.4£11.0
£11.3
£7.9 £8.0 £8.2
£9.1 £8.9 £9.2
£9.9 £10.2
£6.2£6.8
£7.1£7.5
£7.9 £7.7£8.0 £7.8
£3.8 £4.1£4.8 £5.0 £5.0
£4.5£5.0 £4.8
£3.2 £3.3 £3.6 £3.7 £3.7 £4.0 £4.1 £4.4
£2.0 £2.1 £2.1 £2.3 £2.4 £2.4 £2.5 £2.6
£0.8 £1.4 £1.5 £1.7 £2.0 £2.0 £2.2 £2.4£1.2 £1.3 £1.4 £1.4 £1.5 £1.5 £1.5 £1.8
£0.5 £0.6 £0.7 £0.8 £0.9 £0.8 £0.9 £0.9£0bn
£2bn
£4bn
£6bn
£8bn
£10bn
£12bn
2004 2005 2006 2007 2008 2009 2010 2011
GER
UK
FRA
ITA
ESP
CAN
NED
POL
SWE
IRE
3.1%
2.6%
2.7%
-2.7%
5.4%
10.4%
5.1%
5.7%
1.6%
-4.9%
YOY CAGR (5 yr)Growth (%)
£45bn £48bn £50bn £53bn £54bn £53bn
Total revenues (£bn)
4.0%
4.4%
1.2%
2.9%
4.6%
1.7%
-0.1%
4.2%
4.6%
9.8%
£57bn £58bn

144
Figure 3.17 Total TV industry revenues among BRIC countries
Source: IDATE / industry data / Ofcom. Notes: Ofcom has used an exchange rate of $1.604 to the GBP, representing the IMF average for 2011. Revenues include advertising, subscriptions and sources of public funding only. BRIC is Brazil, Russia, India and China.
Figure 3.18 illustrates the changing composition of TV industry revenues, by country, between 2006 and 2011.
Among the major European television markets of Germany, the UK and France, pay-TV was the fastest-growing source of revenue over the five-year period between 2006 and 2011 and represents the largest source of TV income for these countries.
Spain is the only country out of the 17 included in our analysis not to have experienced growth in TV revenues between 2006 and 2011. As part of the current austerity cuts, the Spanish government has reduced the state subsidy provided to the national public audio-visual company, Corporación RTVE.
The US and Japan, the two largest countries by revenue (£100bn and £31.1bn respectively), are included at the bottom of the chart to accommodate the higher scale. The US experienced relatively flat TV advertising revenues over the five-year period, with the vast majority of growth coming from pay-TV subscriptions (up from £40.5bn in 2006 to £63.7bn in 2011), resulting in an increase in total revenues over the period of almost £25bn to £100bn in 2011. In contrast, total TV revenue for Japan remained relatively constant over the five-year period, at around £30bn.
The television markets of the BRIC countries all recorded increases in total revenue between 2006 and 2011, driven by an increase in both net advertising revenue and subscriptions. However, the BRIC countries are notable for a lack of public funding, with only Brazil and India having any public funds attributed to TV in 2011 – although the value of public funding in these countries was minimal, at £0.2bn.
£4.7£5.4
£6.1£6.9
£8.3
£9.2
£11.0£12.4
£1.2 £1.6£2.1
£2.8 £3.0 £2.6£3.1 £3.6£2.3 £2.5 £2.6 £3.0 £3.5
£4.2£4.8
£5.5£5.5£6.3
£7.0 £7.4£8.3
£9.0
£10.9
£12.4
£0bn
£2bn
£4bn
£6bn
£8bn
£10bn
£12bn
£14bn
2004 2005 2006 2007 2008 2009 2010 2011
BRA
RUS
IND
CHI
12.7%
16.6%
14.2%
14.4%
YOY CAGR (5 yr)Growth (%)
£14bn £16bn £18bn £20bn £23bn £25bnTotal revenues (£bn)
12.3%
15.3%
11.5%
15.8%
14% 13.8%£30bn £34bn

145
Figure 3.18 TV revenues among comparator countries, by source: 2006 and 2011
Source: IDATE / industry data / Ofcom. Notes: Ofcom has used an exchange rate of $1.604 to the GBP, representing the IMF average for 2011. Revenues include advertising, subscriptions and sources of public funding only. Different scale used for USA and Japan due to larger size of those markets.
3.2.3 TV revenue per head among comparator countries Revenue per head in the UK increased by almost 4% in 2011 to £180
Per head, revenue in the US continued to lead the 17 comparator countries, generating £320 per head in 2011, an increase of 16.6% - the largest year-on-year increase of the 17 comparator countries. This is some way ahead of the second highest, Japan, which increased by 6.8% since 2010 to £244 per head.
Among the major European markets, Spain and Italy both recorded declines in per-capita revenues in 2011 – with Spain down 5.8% to £102 and Italy down 4.1% to £155. In contrast the UK, France and Germany all recorded increases, with Germany up 4.5%, France up 3.2% and the UK up 3.7% to £180 per head.
3.553.46
3.032.93
3.533.573.883.99
2.252.04
2.512.20
1.672.63
0.820.700.550.44
0.790.63
7.154.06
2.781.82
1.470.86
7.433.90
2.712.53
2.161.59
4.143.96
1.461.29
0.610.52
0.750.611.84
1.010.68
0.27
5.063.80
5.023.64
3.93
2.441.86
1.511.00
2.08
1.251.15
1.110.84
0.870.66
1.560.75
5.012.05
0.84
3.831.78
5.003.06
0 2 4 6 8 10 12 14
201120062011200620112006201120062011200620112006201120062011200620112006201120062011200620112006201120062011200620112006
UK
FRA
GER
ITA
CAN
AUS
ESP
NED
SWE
IRE
POL
BRA
RU
SIN
DC
HI
Advertising
Public funding
Subs
£12.4bn£2.6bn
£5.5bn£2.1bn
£6.1bn
£1.5bn
£0.7bn£0.9bn
£1.5bn
£2.4bn
£12.4bn
£1.8bn
Revenues (£bn)
£7.0bn
£2.1bn
£3.6bn
£4.8bn£4.1bn
14.1615.75
36.0134.93
5.414.80
11.559.44
63.6940.47
0 10 20 30 40 50 60 70 80 90 100 110
2011200620112006
JPN
USA
£2.6bn£4.8bn
£5.3bn£3.6bn
£4.4bn
£7.8bn£10.9bn
£8.2bn£11.6bn
£10.2bn£10.2bn
£7.1bn
£11.3bn
£30.0bn£100bn
£75.8bn
£31.1bn

146
Despite posting significant increases in overall television revenues year on year, TV income per capita for the BRIC countries remains well below the other comparator countries in our analysis, driven by larger populations and lower penetration of digital TV. For example, India has the lowest TV revenue per head of all 17 countries, at just £5 per person.
Figure 3.19 TV revenue per head, by source: 2011
Source: IDATE / industry data / Ofcom. Notes: Ofcom has used an exchange rate of $1.604 to the GBP, representing the IMF average for 2011. Revenues include advertising, subscriptions and sources of public funding only; figures inside the bars represent industry revenue per head by source.
Subscription income continues to drive growth in TV revenue per head
Figure 3.20 details the changes, by country, in revenue per head, split by the three component parts. For the majority of countries, including the UK, increases in revenue per head in 2011 were driven primarily by growth in income generated from subscription fees. In the UK, £3.02 (82%) of the total year-on-year increase of £3.70 was attributable to subscription fees. The US saw the largest increase in subscription revenue per capita, up £15.17, while Italy was the only country to record a decline in subscription revenue per capita, down £1.81 in 2011.
For the majority of countries, advertising revenues per head have remained relatively flat, or in some instances declined in 2011. In the UK, advertising revenues per head remained relatively stable, increasing a marginal 15p, while in Spain and Ireland, advertising revenues per head declined, by £4.93 and £3.57 respectively.
Only a few countries experienced significant growth in public funding per head in 2011, with the most notable being the Netherlands, where public funding increased by £2 per head against the previous year.
£56 £46 £43
£63£115
£66 £111 £115£36 £49 £61
£37£20
£36
£20
£1
£6
£80 £76£48
£40 £204 £44£91 £95
£27£66 £96
£111
£41
£25
£6
£3
£4
£44 £33£51
£24
£1£18 £42 £34
£39£40 £41 £34
£1 £1 £0.2
0%
20%
40%
60%
80%
100%
UK FRA GER ITA USA CAN JPN AUS ESP NED SWE IRL POL BRA RUS IND CHN
Public funding
Subscription
Advertising
5
0.5
Revs per cap (£)Change YOY (£)
26
3.7
9
1.1
180
3.7
155
3.2
142
4.5
127
-4.1
128
6.0
62
5.9
244
6.8
320
16.6
155
7.3
102
-5.8
63
6.5
244
7.6
182
1.0
198
9.2

147
Figure 3.20 Changes in components of TV revenues per head: 2010 to 2011
Source: IDATE / industry data / Ofcom. Notes: Ofcom has used an exchange rate of $1.604 to the GBP, representing the IMF average for 2011. Revenues include advertising, subscriptions and sources of public funding only; the bars represent changes in industry revenue per head, by source.
3.2.4 TV licence fees most common in Europe Public funding, in the form of TV licence fees paid for by viewers, remains an important element of TV finance in most of the major European markets included in this analysis. Figure 3.21 illustrates the cost of a TV licence fee in each of the comparator countries where it is available.
As in 2010, the cost of the UK’s licence fee in 2011 was the fourth most expensive, at £146 (no change since 2010), behind Germany (£187), Sweden (£199) and Japan (£200 for a satellite TV licence).
Figure 3.21 Cost of a TV licence fee
Source: IDATE / industry data / Ofcom. Notes: Ofcom has used an exchange rate of $1.604 to the GBP, representing the IMF average for 2011; Prices as at end 2011. Note: The Japanese licence fee costs £117 in terrestrial households or £200 (rounded) to receive a larger number of channels via satellite
0.600.151.33
-2.301.64
2.87
-0.87-4.93
4.005.94
-3.570.33
2.832.76
0.65
3.022.672.50
-1.8115.17
2.595.65
7.881.22
0.922.91
7.195.65
3.840.96
0.45
0.47
0.500.89
0.58-2.13
2.360.39
-2.67
-0.13
-£6.00 -£4.00 -£2.00 £0.00 £2.00 £4.00 £6.00 £8.00 £10.00 £12.00 £14.00 £16.00 £18.00
UKFRAGER
ITAUS
CANJAPAUSESPNEDSWE
IREPOLBRARUSINDCHI
Advertising Subscription Public funding
£0.52£3.72£6.54£5.88£0.96
-£5.84£7.59£6.77£5.96
£7.27£9.24
£16.61
Change (£)£1.13
-£4.14£4.53£3.22£3.70
Cos
t per
ann
um
£146£107
£187
£97 £117
£199
£139
£42
£83
£0
£40
£80
£120
£160
£200
£240
UK FRA GER ITA USA CAN JPN AUS ESP NED SWE IRL POL BRA RUS IND CHN
Cost of standard TV licence fee (£) Increment for DTH TV licence (£)
No
fee
No
fee
No
fee
No
fee
No
fee
No
fee
No
fee
No
fee
No
fee

148
3.2.5 Revenues up marginally for most free-to-air broadcasters Figure 3.22 shows the reported revenues for selected free-to-view TV operators. Although the majority of free-to-view broadcasters experienced increases in revenue in 2011, growth remains restricted compared to pre-recession figures, as the advertising market remains challenging and public funding is either flat or declining.
In the UK, the proportion of income allocated to TV by the BBC increased by 2.2% in 2011 to £2.7bn, while ITV reported an increase in revenue of 3.7% to £2.1bn.
Figure 3.22 Latest reported revenues for selected free-to-view TV operators: 2011
Source: IDATE / industry data / Ofcom. Notes: Ofcom has used an exchange rate of $1.604 to the GBP, representing the IMF average for 2011; Comparisons should be regarded as indicative only due to the possibility of differences in financial reporting between broadcasters. RTL figure includes its key European markets; Mediaset includes Italian FTA and pay-TV business (year ending Dec 31). BBC represents its income allocated to TV; RAI figures include licence fee (split between radio and TV unknown), TV advertising and sponsorship; ProSieben, group revenues (years ended Dec 31); France Televisions is licence fee and advertising; TF1 includes French channels (years ended Dec 31); PBS and the ABC are total revenue to year ending June 30; Fuji TV is broadcasting and production, year ending March 31; RTVE is advertising and public funding (as of year ending Dec 31).
3.2.6 Pay-TV revenues up despite difficult trading conditions Revenues for pay-TV broadcasters increased in 2011 for all but one of the operators in our analysis. BSkyB, in the UK, reported one of the largest increases in revenue, up 17.3% to £6.2bn (this also includes revenues from its telecommunications services), and was surpassed only by Sky Deutschland in Germany, whose revenue increased 18.1% on 2010 to £1.0bn. Virgin Media in the UK also recorded a rise in revenue, up 3.2% to £3.9bn in 2011.
Revenues for the main pay-TV operators in the US grew year on year, despite increased competition from online TV companies such as Netflix, which reported around 23.9 million domestic streaming subscribers at the end of June 2012. Revenues for Comcast in the US increased by 1.3% to 13.5bn in 2011, although this figure excludes revenues from the integration of NBC Universal; when NBC is included the combined revenue rises to £25.6bn. Revenues for Direct TV and Dish in the US increased to £13.6bn (up 7.9%) and £8.8bn (up 11.1%) respectively in 2011.
£5.3bn £5.0bn
£3.1bn £2.7bn £2.6bn £2.6bn £2.4bn £2.3bn £2.1bn £1.8bn£1.0bn £0.7bn £0.3bn£0bn
£0.5bn£1bn
£1.5bn£2bn
£2.5bn£3bn
£3.5bn£4bn
£4.5bn£5bn
£5.5bn
NHK RTL Fuji BBC Mediaset FT P7S1 RAI ITV TF1 RTVE ABC PBS
Annual revenue for latest available period (£bn)
Rev
enue
s (£
bn)
YoY changeJPN UK FRA GER AUSFRAITA UKITAJPN
1.3% 2.0% 2.2% -5.3% 6.0%-2.9% 3.4%-1.4% 1.2%3.7%
EUR
4.2%
ESP
5.2%
USA
-16.8%
Territory

149
Figure 3.23 Latest reported revenues from selected pay-TV operators: 2011
Source: IDATE / industry data / Ofcom. Notes: Ofcom has used an exchange rate of $1.604 to the GBP, representing the IMF average for 2011; where possible we have reported revenues related to the TV services only (including advertising). Comcast includes video and advertising revenues (but excludes integration of NBC Universal). Time Warner Cable includes video and advertising revenues; BSkyB include retail, wholesale and advertising revenues; KDG includes cable access and TV/radio revenues; Virgin Media includes consumer and content revenues; Sky Italia revenue based on IDATE's estimate from News Corporation's annual report; Canal+ represents Canal Plus Group pay-TV revenues; Sogecable’s platform is Digital Plus.
Pay-TV ARPU up in the UK as consumers take more products and services
Average revenue per user (ARPU) can provide insights into the relative performance of different pay-TV operators by country.
In the majority of countries in our analysis, including the UK, pay-TV operators have increased ARPU over the five-year period since 2006. The UK was among the countries with higher ARPU, at £362 at the end of 2011, from £327 since 2006. Figures from BSkyB, the UK’s largest pay-TV operator, for the financial year ending June 2012, indicate that on average Sky customers take 2.7 products each, up from 2.5 products the previous year. In addition, almost a third of Sky customers (32%) are triple-play customers – bundling TV, broadband and fixed-line services into a single package.
The US and Australia continue to be the highest-ranking markets in terms of ARPU, as pay-TV operators continue to encourage consumers to purchase more value-added services, such as high definition and PVR services. ARPU in the US at the end of 2011 stood at £621 (up from £421 in 2006), while in Australia the equivalent figure was £750 (up from £647 in 2006).
In line with the year-on-year reductions in revenue, highlighted earlier in this section (see Figure 3.16 ) pa- TV operators in Spain and Italy both experienced declines in ARPU between 2006 and 2011, with those in Italy declining the most: from £432 in 2006 to £284 in 2011. Average revenue per user for Spain declined by £21 over the five-year period, to £285 in 2011.
Rev
enue
s (£
bn)
YoY change
Territory
£13.6bn £13.5bn
£8.8bn
£6.2bn
£4.0bn £3.9bn£3.3bn
£1.2bn £1.1bn £1.0bn £0.7bn£0bn
£2bn
£4bn
£6bn
£8bn
£10bn
£12bn
£14bn
DirectTV Comcast Dish BSkyB Canal+ Virgin Media Sky Italia Sky Perfect Sogecable Sky Deutschland
Austar
USA USA FRA UK ITA AUSESPUKUSA GER
7.9% 1.3% 11.1% 17.3% 3.1% 3.2% 1.1% 9.4% -3.8% 0.2%
Cable
Satellite
JPN
18.1%

150
Figure 3.24 Pay-TV ARPU, by country: 2006-2011
Source: IDATE / industry data / Ofcom. Notes: Ofcom has used an exchange rate of $1.604 to the GBP, representing the IMF average for 2011. ARPU is average revenue per user, representing the average revenue generated per pay-TV subscriber.
362327
299289
157134
284432
621421
12894
356387
750647
285306
155121
203168
470255
140116
401448
2520
28252322
0 100 200 300 400 500 600 700 800
2011200620112006201120062011200620112006201120062011200620112006201120062011200620112006201120062011200620112006201120062011200620112006
UK
FRA
GE
RIT
AU
SC
AN
JAP
AU
SE
SP
NE
DS
WE
IRE
PO
LB
RA
RU
SIN
DC
HI
2006
2011
ARPU (£)

151
3.3 The TV and audio-visual consumers 3.3.1 Summary This is the final chapter of the audio-visual section. In Section 3.3.2 we examine patterns of digital television take-up, before considering the adoption of high definition television, digital video recorders and connected televisions (Section 3.3.3). Section 3.3.4 analyses the number of pay-TV homes in each country, before examining how viewers in different countries consume broadcast television (Section 3.3.5).
• By the end of 2011, the majority of homes had digital television in the UK, France and Spain. DTV take-up reached 100% in Spain, 97% in France and 99% in the UK, where the digital switchover programme was completed in October 2012.
• In the UK, satellite TV (including Freesat) was the largest platform (44% of TV homes) while terrestrial TV was the main platform in 38% of TV homes. Digital satellite was also the most popular platform in Germany, Ireland, Poland and Brazil. While digital satellite may not be the top technology choice in many countries, it is often the second most popular platform, taking second place in ten of the 17 countries in our report.
• Homes in BRIC countries experienced the biggest reductions in analogue terrestrial take-up, while simultaneously seeing the biggest increases in digital satellite take-up.
• The UK also has one of the highest proportions of TV homes with high definition among the countries included in our research – at 41%, higher than France (18%), Germany (28%) and Japan (31%), but behind the US (49%).
• Digital video recorders (DVRs) and connected TVs continue to grow in popularity in UK TV households, with the highest levels of take-up of all the countries included in our research. In 2011, 39% of UK TV homes had a DVR, while 15% claimed to own a connected TV.
• Over half (55%) of TV homes in the UK had a pay-TV service in 2011. By country, pay-TV take-up at the end of 2011 was highest in the Netherlands (99%), India (94%), Canada (93%), Sweden (92%) and the US (89%). Growth in pay-TV take-up was most substantial in Brazil (up by 22% on a compound annual growth basis since 2006) and stood at 23% of TV households in 2011.
• The UK has the third highest level of scheduled linear TV viewing, of the comparator countries, at four hours per person per day. Despite the increase in online TV, scheduled linear television remains popular, with minutes of viewing per person increasing among most comparator countries. Only Italy (253 minutes per person per day) and the US (293 minutes) watch more television than the UK.
3.3.2 Digital television take-up on main sets The majority of homes in the UK, France and Spain have digital television
Figure 3.25 and Figure 3.26 illustrate the growing take-up of digital television across the 17 comparator countries; for ease of interpretation, the countries are illustrated in two charts68.
68 Note that the UK digital television figures in this report are compiled using a different source to Ofcom’s CMR report, as a result the two sets of data are not directly comparable. Data in Ofcom’s

152
Homes in Spain benefited from 100% take-up on main sets, as the digital switchover (DSO) programme was completed in 2010. In the UK, take-up had reached 99% by the end of 2011 as DSO entered the final stages; set for completion in October 2012. The Republic of Ireland, where penetration reached 90%, is also set for DSO completion by the end of 2012. In France, where terrestrial switchover was completed in November 2011, 97% of homes had digital television. In the US, where the analogue terrestrial signal was switched off in 2009, digital television take-up reached 89% in 2011.
At the opposite end of the spectrum, digital television take-up in China, Russia and India remained well below the average of 75% among comparator countries for 2011, at 43%, 40% and 40% respectively. But in each case the rates of DTV adoption ran well ahead of the comparator country averages. Year-on-year increases averaged 32% and the rate of growth over the five-year period averaged 57% in China, Russia and India.
In Japan year-on-year DTV growth was comparatively slow despite DTV take-up of 77%. This might be explained by the comparatively slow migration to digital among analogue cable viewers.
Figure 3.25 Take-up of digital television – top nine comparator countries
Source: IDATE / industry data / Ofcom
CMR is based on BARB’s Establishment Survey, whereas this report is based on data from IDATE – a single source is used for this report to enable comparisons across comparator countries.
20%
40%
60%
80%
100%
2006 2007 2008 2009 2010 2011
Prop
ortio
n of
hom
es (%
)
UK
FRA
ITA
USA
CAN
AUS
ESP
NED
IRE
99% 1% 5%
97% 6% 15%
93% 1% 16%
89% 2% 8%
86% 12% 13%
83% 18% 18%
100% 2% 21%
77% 15% 28%
90% 10% 14%
Take-up 2011
1 yr 5 yr CAGR
Growth

153
Figure 3.26 Take-up of digital television – the next eight comparator countries
Source: IDATE / industry data / Ofcom
Cable is the most popular television platform in the majority of comparator countries
Taking both analogue and digital technologies together, cable was the most popular television platform for eight of the 17 comparator countries, comprising the US, Canada, Japan, the Netherlands, Sweden, Russia, India and China.
For the first time in the UK, satellite TV (including Freesat) was the largest platform (44%) as terrestrial TV fell to second place at 38%. Digital satellite TV was also the most popular platform in Germany, Ireland, Poland and Brazil. While digital satellite may not be the top technology choice in many countries, it is often the second most popular platform, taking second place in ten of the 17 countries analysed in our report.
Digital terrestrial was the most popular platform in four countries, including France, Italy, Australia and Spain.
0%
20%
40%
60%
80%
100%
2006 2007 2008 2009 2010 2011
Prop
ortio
n of
hom
es (%
)
GER
JPN
SWE
POL
BRA
RUS
IND
CHI
Take-up 2011
1 yr 5 yr CAGR
Growth
66% 9% 23%
77% 5% 11%
67% 7% 12%
62% 13% 31%
69% 19% 23%
40% 31% 52%
40% 35% 54%
43% 29% 64%

154
Figure 3.27 The two most popular DTV platforms, by country: 2011
Source: IDATE / industry data / Ofcom
Splitting the platforms into their analogue and digital components, the digital terrestrial television platform continued to be the largest by market share in Spain (69% of main sets) and Australia (49%). It was also a substantial player in the UK (with a 38% share), ranking second to satellite (44%). Digital satellite was the leading platform in the Republic of Ireland with a 53% market share, the highest proportional take-up of the platform across the comparator countries.
Despite the progress made in many countries in migrating homes to digital television platforms, analogue technologies are still widely used. The analogue cable network is still popular in India, and is the largest platform across the comparator countries with a 58% share of main television sets, followed by Sweden at 33% and Russia at 34%.
Figure 3.28 Take-up of DTV, by platform and country: 2011
Source: IDATE / industry data / Ofcom
Terre
stria
l
Terre
stria
l
Cab
le
Terre
stria
l
Cab
le Cab
le
Cab
le
Terre
stria
l
Terre
stria
l
Cab
le
Cab
le Sat
ellit
e
Sat
ellit
e
Terre
stria
l
Cab
le
Cab
le
Cab
le
Sat
ellit
e
IPTV
Sat
ellit
e
Sat
ellit
e
Sat
ellit
e
Sat
ellit
e
Sat
ellit
e
Sat
ellit
e
Sat
ellit
e
Sat
ellit
e
Cab
le
Terre
stria
l
Sat
ellit
e
Sat
ellit
e
Sat
ellit
e
Terre
stria
l
0%
20%
40%
60%
80%
100%
UK FRA GER ITA USA CAN JPN AUS ESP NED SWE IRE POL BRA RUS IND CHI
Second largest platformLargest platform
Sate
llite
Proportion of TV households (%)
15%8%
21%
40%
53%
27%
13% 8%
47%
21% 26%
14%3% 7% 5%
28%3%
28%
11%
14%
23%
23%
33%
6%
19%
7%
34%
58%24%
44%
24%
35%
35%
31%
26%
23%
18%15%
13%
15%
53%45%
45%
27%
33%
6%0%
0%
3%
1%
0%
0%
0%
0%
0%
0%
0%0%
1%
0%
6%
38%
30%
6%
43%
11%
4%
21%
49%69%
0%6%
8%
2%
21%3%
5%
1%
0%
0% 7% 0%0% 0%
17%
0%
0% 0%
5%
19% 23%26%
2%
27%28%
4% 2% 7% 4% 5% 4% 6%11% 11%
2% 1% 3% 4%
0%
20%
40%
60%
80%
100%
UK FRA GER ITA USA CAN JPN AUS ESP NED SWE IRE POL BRA RUS IND CHI
IPTV
Analogue Terrestrial
Digital terrestrial
Analogue Satellite
Digital satellite
Analogue cable
Digital cable
Proportion of TV homes (%)
155
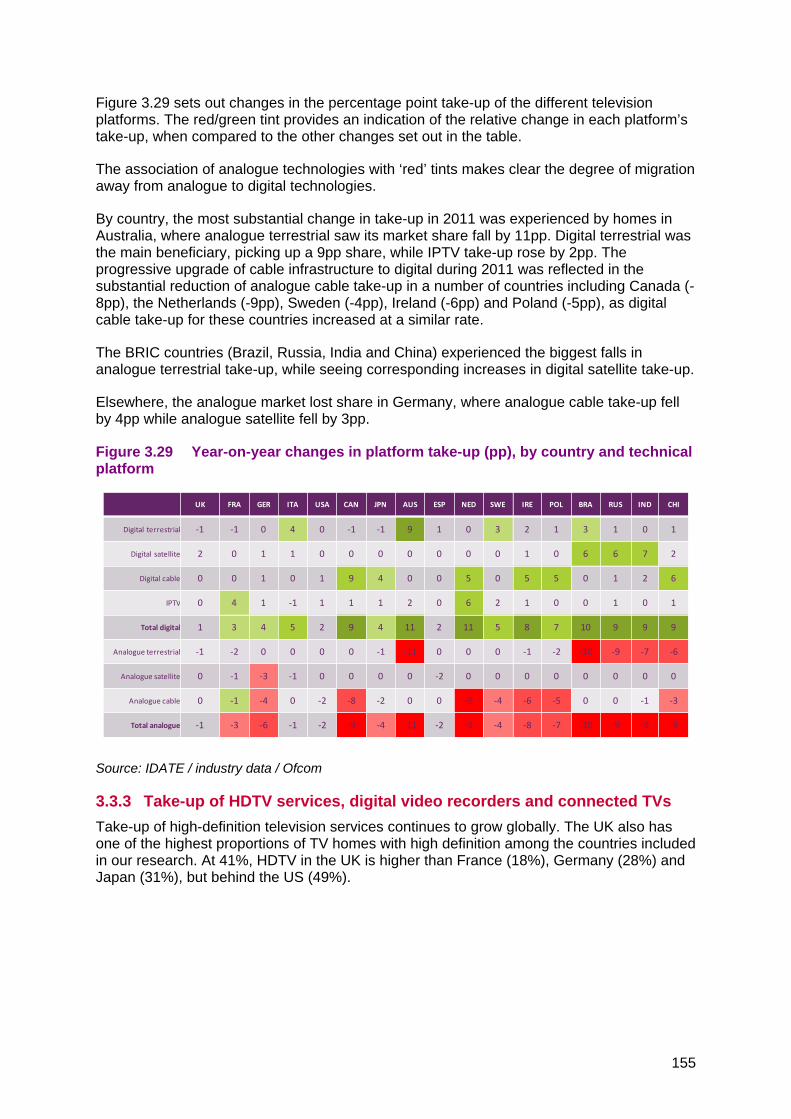
Figure 3.29 sets out changes in the percentage point take-up of the different television platforms. The red/green tint provides an indication of the relative change in each platform’s take-up, when compared to the other changes set out in the table.
The association of analogue technologies with ‘red’ tints makes clear the degree of migration away from analogue to digital technologies.
By country, the most substantial change in take-up in 2011 was experienced by homes in Australia, where analogue terrestrial saw its market share fall by 11pp. Digital terrestrial was the main beneficiary, picking up a 9pp share, while IPTV take-up rose by 2pp. The progressive upgrade of cable infrastructure to digital during 2011 was reflected in the substantial reduction of analogue cable take-up in a number of countries including Canada (-8pp), the Netherlands (-9pp), Sweden (-4pp), Ireland (-6pp) and Poland (-5pp), as digital cable take-up for these countries increased at a similar rate.
The BRIC countries (Brazil, Russia, India and China) experienced the biggest falls in analogue terrestrial take-up, while seeing corresponding increases in digital satellite take-up.
Elsewhere, the analogue market lost share in Germany, where analogue cable take-up fell by 4pp while analogue satellite fell by 3pp.
Figure 3.29 Year-on-year changes in platform take-up (pp), by country and technical platform
Source: IDATE / industry data / Ofcom
3.3.3 Take-up of HDTV services, digital video recorders and connected TVs Take-up of high-definition television services continues to grow globally. The UK also has one of the highest proportions of TV homes with high definition among the countries included in our research. At 41%, HDTV in the UK is higher than France (18%), Germany (28%) and Japan (31%), but behind the US (49%).
UK FRA GER ITA USA CAN JPN AUS ESP NED SWE IRE POL BRA RUS IND CHI
Digital terrestrial -1 -1 0 4 0 -1 -1 9 1 0 3 2 1 3 1 0 1
Digital satellite 2 0 1 1 0 0 0 0 0 0 0 1 0 6 6 7 2
Digital cable 0 0 1 0 1 9 4 0 0 5 0 5 5 0 1 2 6
IPTV 0 4 1 -1 1 1 1 2 0 6 2 1 0 0 1 0 1
Total digital 1 3 4 5 2 9 4 11 2 11 5 8 7 10 9 9 9
Analogue terrestrial -1 -2 0 0 0 0 -1 -11 0 0 0 -1 -2 -10 -9 -7 -6
Analogue satellite 0 -1 -3 -1 0 0 0 0 -2 0 0 0 0 0 0 0 0
Analogue cable 0 -1 -4 0 -2 -8 -2 0 0 -9 -4 -6 -5 0 0 -1 -3
Total analogue -1 -3 -6 -1 -2 -9 -4 -11 -2 -9 -4 -8 -7 -10 -9 -9 -9

156
Figure 3.30 Take-up of High Definition TV
Source: Ofcom Consumer Research October 2012 Base: Total sample size UK=1065, France=1016, Germany=1024, Italy=1015, US=1010, Japan=1004, Australia=1007, Spain=1001, China=1010 Q: Which of the following devices do you own and personally use?
In the US, pay-TV providers provide the highest number of HD channels of all our the comparator countries. The cable platform in the US now offers 202 channels as opposed to 177 channels on satellite and 170 via IPTV.
In the UK, Germany and Japan, the majority of HD channels are provided by satellite. France has a different profile, with 43 HD channels provided by IPTV operators and 25 HD channels on satellite.
Figure 3.31 Number of HDTV channels: end 2011
Source: IDATE / industry data / Ofcom.
41%
18%
28% 28%
49%
31%
46%
30%35%
0%
10%
20%
30%
40%
50%
60%
70%
UK FRA GER ITA USA JPN AUS ESP CHN
Take-up (%)
51
25
54 50
177
85
23 20
40
0
202
37
0
43
17
0
170
60
4 50
5 6 6
0
50
100
150
200
UK FRA GER ITA USA JPN
Satellite Cable IPTV DTT
Num
ber o
f HD
cha
nnel
s

157
DVRs, connected TVs and 3D-ready TVs continue to grow in popularity
A range of other digital technologies are available to TV households, alongside high definition television.
Digital video recorders (allowing viewers to pause and rewind live television and to store content), were available in 39% of UK homes in 2011 – the highest take-up of all the countries included in our research. In the US and Australia, DVRs were installed in 32% and 29% of homes respectively. The country with the lowest take-up in 2011 was France, with 18% penetration.
France and the UK reported the highest take-up of connected televisions, with 15% of respondents in our research claiming to own one. In Germany and Italy the comparable figures were 10% and 9%. In China, take-up of connected televisions reached 28% in 2011. However, internet penetration is much lower in China (around 38%, and centred in the cities) and those responding to our survey are therefore more likely to be early adopters of new technology and not a true representation of China’s 1.3 billion inhabitants.
In Europe, 13% of people in Italy reported having a 3D-ready TV set at home. In the UK and France, 3D television has reached 8% and 9% respectively. However, many connected TVs come with built-in 3D capabilities, so the actual penetration of 3DTVs may be higher than indicated below.
Thus far, only pay-TV operators seem to be backing initiatives to create sustained 3D content, and carrying platforms. The long-term appeal of dedicated 3D channels is open to question; in France, the Canal+ Group, the French film and television distributor, closed down its permanent 3D television channel in January 2012.
The four main categories of connected TV There are four main - and divergent - models in the UK. Each model has been adopted by a range of competitors and all are intended to deliver a similar set of interactive, broadcast and video services to customers.
The traditional platform model, usually using set-top boxes (STBs) and subscriptions, is used by companies including Sky, Virgin, BT Vision and YouView. This model uses existing libraries of long-form content.
Electronics manufacturers lsuch as Samsung, LG and Sony offer stand-alone connected TVs that directly connect to the internet via home broadband.
Dedicated IPTV companies like Boxee, Vudu, Roku and Sainsbury/Rovi provide on-demand and streaming services via an internet-connected device.
Finally, OS players like Apple, Google and Microsoft also hope to offer TV services and establish a cross-device eco-system using their ‘walled-garden’ software and systems which restrict non-approved applications and content.

158
Figure 3.32 Take-up of digital video records, connected TVs and 3D-ready TVs
Source: Ofcom consumer research October 2012 Base: Total sample size UK=1065, France=1016, Germany=1024, Italy=1015, US=1010, Japan=1004, Australia=1007, Spain=1001, China=1010 Q: Which of the following devices do you own and personally use?
3.3.4 Pay-TV take-up The popularity of pay TV across comparator countries is influenced by a range of factors, including (i) the availability of free-to-view channels; (ii) the exclusive rights that pay-TV operators may have to particular programmes or types of content; and (iii) the presence of publicly-funded television channels.
At least three patterns of pay-TV adoption have emerged among the comparator countries:
• High and stable levels of take-up. In North America, consumers have always been willing to pay for access to additional television channels, and take-up remained at 89% in 2011 – stable year on year, and up by 3pp since 2006.
• Moderate and stable penetration. Among European comparator countries, take-up of pay-TV has increased by 7pp since 2006, although the proportion paying for additional channels remained at around 58% of all homes in 2011. Within this figure, take-up varies substantially between the comparator European nations (see Figure 3.33).
• Low adoption levels, but rising. In the developing economies of BRIC, pay-TV continues to grow in popularity (although it varies substantially by country, see Figure 3.33). Take-up of pay-TV rose by 6pp year on year, and by 22pp since 2006.
39%
18%21%
19%
32%
24%
29%
22%
27%
15% 15%
10% 9% 10%
5%
10%12%
28%
8% 9%12% 13%
8%
3%
9%11%
18%
0%
10%
20%
30%
40%
50%
UK FRA GER ITA USA JPN AUS ESP CHN
DVR Connected or smart TV 3D-ready TV
Take-up (%)

159
Figure 3.33 Take-up of pay-TV among groups of comparator countries
Source: IDATE / industry data / Ofcom.Note: ‘Europe’ in this context means those European countries within our comparator set. ‘Total’ in this context means the 17 countries in this report’s comparator set.
In 2011, the majority of homes in 13 of the 17 comparator countries paid for additional television channels.
By country, pay-TV take-up at the end of 2011 was highest in the Netherlands (99%), India (94%), Canada (93%), Sweden (92%) and the US (89%). However, the characteristics of pay-TV services differ from country to country. In the US and Canada, pay-TV services are similar to those in the UK (providing access to a large number of additional TV channels in exchange for payment). By contrast, the pay-TV fee for some cable packages in the Netherlands and Sweden is more akin to an 'access charge'; in return for which consumers receive a limited number of television channels.
In Italy, Australia, Spain and Brazil, the free-to-view television model remains more popular than pay-TV.
49%61% 65%
46% 53% 55% 51% 57% 58%41%
57% 63%
86% 89% 89%
51%39% 35%
54% 47% 45% 49% 43% 42%59%
43% 37%
14% 11% 11%
0
20
40
60
80
100
2006 2010 2011 2006 2010 2011 2006 2010 2011 2006 2010 2011 2006 2010 2011
Total UK Europe BRIC N.America
Free
Pay
Proportion of TV households (%)

160
Figure 3.34 Take-up of pay and free-to-air television: end 2011
Source: IDATE / industry data / Ofcom
Over the five-year time period, the most substantial increase in the take-up of pay-TV were in Brazil (where the five-year annualised average growth rate stood at 22%). In the UK, pay-TV take-up rose on average by 4%, from 11.6 million homes in 2006 to 14 million in 2011.
55%62% 64%
35%
89% 93%
63%
34%27%
92%
76% 78%
23%
64%
94%
57%
45%38% 36%
65%
11% 7%
37%
66%73%
1%8%
24% 22%
77%
36%
6%
43%
0%
20%
40%
60%
80%
100%
UK FRA GER ITA USA CAN JPN AUS ESP NED SWE IRE POL BRA RUS IND CHI
Free TV
Pay TV
Proportion of TV households (%)

161
Figure 3.35 Pay-TV take-up in 2006 and 2011, millions of homes
Source: IDATE / industry data / Ofcom
3.3.5 Consumption of broadcast television services Viewers in the UK tend to consume more TV than those in many comparator countries
Linear television remains popular among viewers across all the comparator countries, with minutes of viewing per head per day increasing in most countries. The biggest increase in minutes of TV viewing per head was for France; up by 7.1% to 227 minutes per day. With no change in viewing minutes (242 minutes per person per day) the UK has the third highest level of TV viewing of all the comparator countries (joint third with Poland).
Only Italy and the US watch more linear television than the UK. Viewing per head in the US continued to increase, rising by 3.5% to 293 minutes a day in 2011, and in Italy, viewing also increased, growing by 2.8% to 253 minutes per day in 2011. Viewing in almost all other
14.0
16.8
25.0
8.6
11.9
32.5
2.8
4.4
7.2
4.3
1.1
11.2
11.6
12.6
25.5
4.3
10.5
24.4
2.0
3.7
7.0
3.9
1.0
6.5
0 10 20 30
UK
FRA
GER
ITA
CAN
JPN
AUS
ESP
NED
SWE
IRE
POL
2011
2006
96.2
4.6
13.7
72.4
140.6
102.6
12.5
33.1
139.0
214.9
0 40 80 120 160 200
USA
BRA
RUS
IND
CHI
Homes (millions)
Lower than averageHigher than average
5yr CAGR
4%
6%
0%
15%
2%
6%
7%
3%
1%
2%
2%
11%
9%
14%
19%
22%
1%

162
European countries grew, with the exception of Sweden, where it decreased by 2.4%. This reinforces Sweden’s position as the country whose viewers consume the fewest minutes of television of all our European comparator countries, at 162 minutes per person.
Among the BRIC countries, China experienced the largest year-on-year growth, with its viewers now watching 163 minutes of TV per day per head, an increase of 3.1%. Viewing in Brazil also grew - increasing 1.4% to 225 minutes per head.
Figure 3.36 Daily TV viewing, per head: 2010-2011
Source: Médiamétrie, Eurodata TV Worldwide. The figure for Canada relates to the viewing in non-Quebec households.
As the number of television channels available to viewers increases, patterns of consumption are changing. Audiences have become more diverse and dispersed among the increased channel choice, resulting in audience shares for the most popular channels eroding over time. Figure 3.41 illustrates this phenomenon: Brazil, with the fewest channels available to mass audiences, has the highest concentration of TV audience, and the top-rated channel, Globo, comands 40% share of viewing. Brazil’s top five channels capture 77% of the country’s TV audience. The US is at the the oppositie end of the spectrum. With over 500 channels in high defintion and many more in standard defintion, the top channel, CBS, has just 7% of viewer hours. Together, the top five channels account for slighly more than a quarter (27%) of the US television audience.
The UK falls somwhere between these two extremes; the top 5 channels account for slightly more than half (54%) of all viewers. BBC One is the most-watched channel, with ITV1, Channel 4, BBC Two and Channel 5 following, in that order.
The general trend in almost all the markets is a sustained reduction in the collective share of the top five channels, as audiences turn to new channels and new ways of watching content. The biggest reductions have been experienced by TV channels in Australia, where the top five channels shown in the major cities now account for less than half (49%) of audiences. Three years ago, the top five channels in Australia had 75% of share.
242227 225
253
293
240
189
239
191162
205
242225 220
119
163
0
50
100
150
200
250
300
UK FRA GER ITA USA CAN AUS ESP NED SWE IRL POL BRA RUS IND CHN
Change in minutes of viewing per person per day, 2010 - 20110.0% 7.1% 0.9% 2.8% 3.5% 4.3% 0.5% 2.1% 0.0% -2.4% 4.6% -1.2% 1.4% -2.7% 0.0% 3.2%
Min
utes
per
per
son
per d
ay
2011 average214 mins

163
Figure 3.37 Patterns of viewing among the top five TV channels: 2009 - 2011
Source: Médiamétrie, Eurodata TV Worldwide. The figure for Canada relates to the viewing in non-Quebec households.
Channels drawing on public funding experience declining share, in the main, during 2011
Viewing of publicly-funded channels is most popular in the UK, where it accounts for 44% of audience share (although down by 4pp year on year). The largest increase in viewing share to publicly-funded channels (3pp) was experienced by Canada, where the French-language television network, SRC, saw its audience share rise substantially. The largest declines outside the UK were in Spain (with a 4pp fall to 32%), the Netherlands (down 3pp to 34%) and Poland (down 3pp to 37%).
77
099
14171718
404243
1719212323242323
211922
2015161615
1822
913
11777
192121
141413
242526
212121
88
01111
9303030
292929
3030
312223222727
2825
2425
2626
3022
3137
1114
12121313
2528
312526
252627
29232425
66
088
8151515
788
1819
198
810
1314
1513
1314
1214
1511
1316
88
7898
1718
181616
1713
1414
1011
12
21n.a.
02828
31628063
777980
6468
7152
5456
637564
5759
5852
5661
4962
7528
3429
272828
6166
705556
5563
6569
5455
580 20 40 60 80
201120102009201120102009201120102009201120102009201120102009201120102009201120102009201120102009201120102009201120102009201120102009201120102009201120102009201120102009201120102009201120102009
CH
NIN
DR
US
BRA
POL
IRL
SWE
NED
ESP
AUS
CAN
USA
ITA
GER
FRA
UK
Top channel Second and third most popular Fourth and fifth most popular
-2.4%
-1.2%
-1.0%
-5.6%
-1.5%
-5.75%
-13.8%
-3.9%
-2.6%
-1.1%
-1.8%
-3.4%
-2.0%
-1.1%
n.a
+0.1%
Change in share of top
five channels 2009 - 2011

164
Figure 3.38 Viewing of publicly-funded channels
Source: Médiamétrie, Eurodata TV Worldwide. The figure for Canada relates to the viewing in non-Quebec households.
Multi-channel viewing homes continued to grow in 2011
Terrestrial channels still command the majority of share of viewing for some countries. In the UK, the terrestrial channels BBC One, BBC Two, ITV1, Channel 4 and Channel 5 together command a share of 54% - down by one percentage point during 2011. In France, the collective share of TF1, France 2, France 3, France 5, Canal+ and M6 together was down to 65%, a three percentage point decrease on their 2011 share.
Figure 3.39 Terrestrial versus multichannel share
Source: Médiamétrie, Eurodata TV Worldwide. The figure for Canada relates to the viewing in non-Quebec households.
47
36
44
41
17
16
3836
31
45 42
1
45
15
48
35
43 41
1
9
17
3637
35
4240
2
42
11
44
33
42 40
1
12
17
32 3436 41
37
1
41
00
20
40
60
UK FRA GER ITA USA CAN AUS ESP NED SWE IRL POL BRA RUS IND
2009 2010 2011
Vie
win
g sh
are
(%) 2
009
-201
1
Change in viewing share between 2010 and 2011 (percentage points)-4 -2 -1 -1 0 +4 0 -4 -3 +1 -2 -3 0 -1 n.a.
54 65 67 71
46 35 33 29
0%
20%
40%
60%
80%
100%
UK FRA GER ITA
Multi - channel
Terrestrial
- 2.4% - 4.1% - 5.2% - 7.3% Proportional change in terrestrial share, 2010 – 2011 (%)


![[2012] Ofcom - International Communications Market Report 2012](https://img.pdfslide.net/doc/110x75/554dd076b4c905c70e8b4755/2012-ofcom-international-communications-market-report-2012.jpg)
