Embed Size (px)
Citation preview
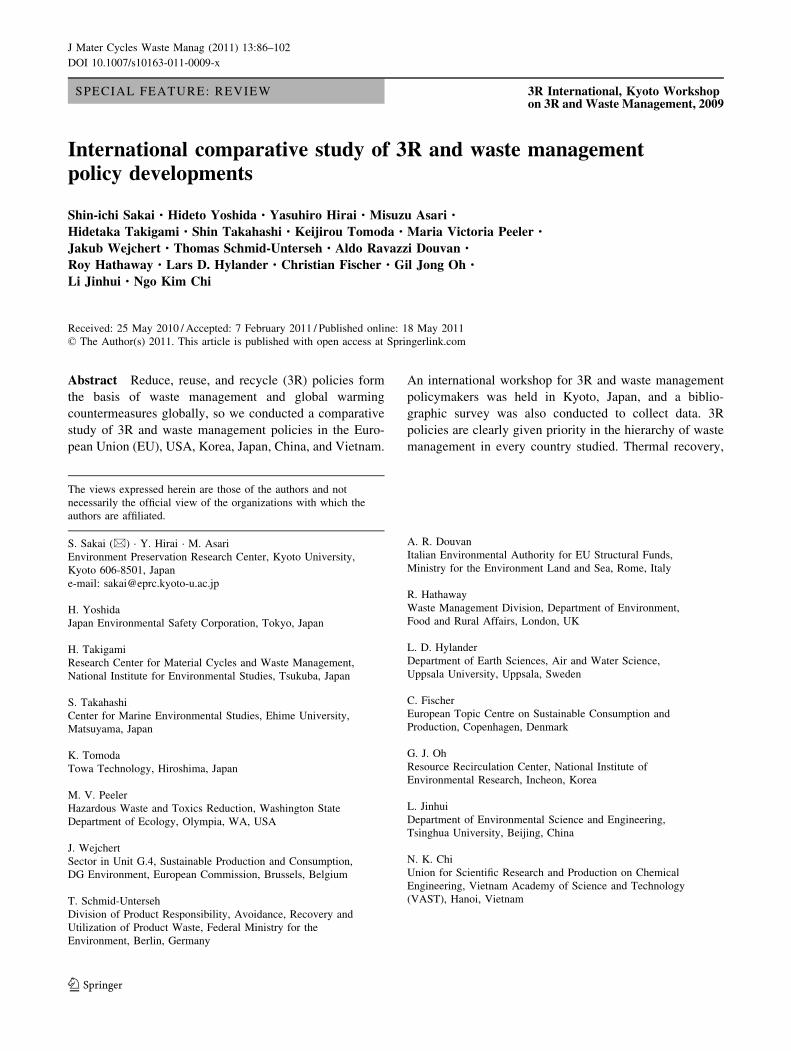
SPECIAL FEATURE: REVIEW 3R International, Kyoto Workshopon 3R and Waste Management, 2009
International comparative study of 3R and waste managementpolicy developments
Shin-ichi Sakai · Hideto Yoshida · Yasuhiro Hirai · Misuzu Asari ·Hidetaka Takigami · Shin Takahashi · Keijirou Tomoda · Maria Victoria Peeler ·Jakub Wejchert · Thomas Schmid-Unterseh · Aldo Ravazzi Douvan ·Roy Hathaway · Lars D. Hylander · Christian Fischer · Gil Jong Oh ·Li Jinhui · Ngo Kim Chi
Received: 25 May 2010 / Accepted: 7 February 2011 / Published online: 18 May 2011
© The Author(s) 2011. This article is published with open access at Springerlink.com
Abstract Reduce, reuse, and recycle (3R) policies form
the basis of waste management and global warming
countermeasures globally, so we conducted a comparative
study of 3R and waste management policies in the Euro-
pean Union (EU), USA, Korea, Japan, China, and Vietnam.
An international workshop for 3R and waste management
policymakers was held in Kyoto, Japan, and a biblio-
graphic survey was also conducted to collect data. 3R
policies are clearly given priority in the hierarchy of waste
management in every country studied. Thermal recovery,
The views expressed herein are those of the authors and not
necessarily the official view of the organizations with which the
authors are affiliated.
S. Sakai (&) · Y. Hirai · M. Asari
Environment Preservation Research Center, Kyoto University,
Kyoto 606-8501, Japan
e-mail: [email protected]
H. Yoshida
Japan Environmental Safety Corporation, Tokyo, Japan
H. Takigami
Research Center for Material Cycles and Waste Management,
National Institute for Environmental Studies, Tsukuba, Japan
S. Takahashi
Center for Marine Environmental Studies, Ehime University,
Matsuyama, Japan
K. Tomoda
Towa Technology, Hiroshima, Japan
M. V. Peeler
Hazardous Waste and Toxics Reduction, Washington State
Department of Ecology, Olympia, WA, USA
J. Wejchert
Sector in Unit G.4, Sustainable Production and Consumption,
DG Environment, European Commission, Brussels, Belgium
T. Schmid-Unterseh
Division of Product Responsibility, Avoidance, Recovery and
Utilization of Product Waste, Federal Ministry for the
Environment, Berlin, Germany
A. R. Douvan
Italian Environmental Authority for EU Structural Funds,
Ministry for the Environment Land and Sea, Rome, Italy
R. Hathaway
Waste Management Division, Department of Environment,
Food and Rural Affairs, London, UK
L. D. Hylander
Department of Earth Sciences, Air and Water Science,
Uppsala University, Uppsala, Sweden
C. Fischer
European Topic Centre on Sustainable Consumption and
Production, Copenhagen, Denmark
G. J. Oh
Resource Recirculation Center, National Institute of
Environmental Research, Incheon, Korea
L. Jinhui
Department of Environmental Science and Engineering,
Tsinghua University, Beijing, China
N. K. Chi
Union for Scientific Research and Production on Chemical
Engineering, Vietnam Academy of Science and Technology
(VAST), Hanoi, Vietnam
123
J Mater Cycles Waste Manag (2011) 13:86–102
DOI 10.1007/s10163-011-0009-x
which includes power generation from waste heat and
methane gas collected from organic waste, is also a prior-
ity; this is consistent with the increased use of
countermeasures to reduce greenhouse gas (GHG) emis-
sions. In the EU, waste management is characterized by
practical and effective 3R policies through the develop-
ment of realistic regulations and by the policymakers’
desire to simplify management systems. The policy ideal in
China, however, is the development of a circular economy
that targets reductions in the amount and hazardousness of
waste. Limits on the number of final disposal sites, strat-
egies for procuring resources, and GHG emission
countermeasures are closely linked with 3R policies, and
further development of 3R policies in parallel with such
issues is expected.
Keywords 3R · Recycling · Waste management ·
International comparison · Policy developments
Introduction
It is generally recognized that reduce, reuse, and recycle
(3R) and waste management policies form the basis of
developing a material cycles society. However, 3R and
waste management policies differ among countries owing
to each country’s particular circumstances or political
strategies. In this study, therefore, our aim was to compare
the current situation, historical background, and effective-
ness of 3R policies within one region [the European Union
(EU)] and five countries (USA, Korea, Japan, China, and
Vietnam). The characteristics and effectiveness of 3R
policies in each country and within the EU are examined,
and the future directions of developments for a material
cycles society are discussed.
Methods
The Kyoto workshop on 3R and waste management was
held in Kyoto, Japan, on 29–30 October 2009. The aim was
to collect comparative data on institutional schemes of 3R
and waste management. The participants were policymak-
ers and researchers from the European Commission,
Germany, England, Italy, Denmark, Sweden, USA, Korea,
China, Vietnam, and Japan. EU Member States are gener-
ally considered to have developed integrated and advanced
waste management systems, whereas Asian countries have
been importing recyclable resources in recent years,
essentially playing the role of global recycling facilities.
Given these circumstances, the purpose of the workshop
was to compare and discuss 3R and waste management
policies in these different regions and to clarify their char-
acteristics and effectiveness. As a means of collecting more
information, copies of Japan’s national report on 3R and
waste management were distributed to participants in
advance and similar reports were obtained from partici-
pating countries. In addition, a field survey was carried out
in several countries to confirm the condition of treatment
facilities and waste management systems and to better
understand the countries’ policies and their effectiveness.
Results and discussion
Trends in 3R and waste management policies
Characteristics and constitution of waste managementpolicies
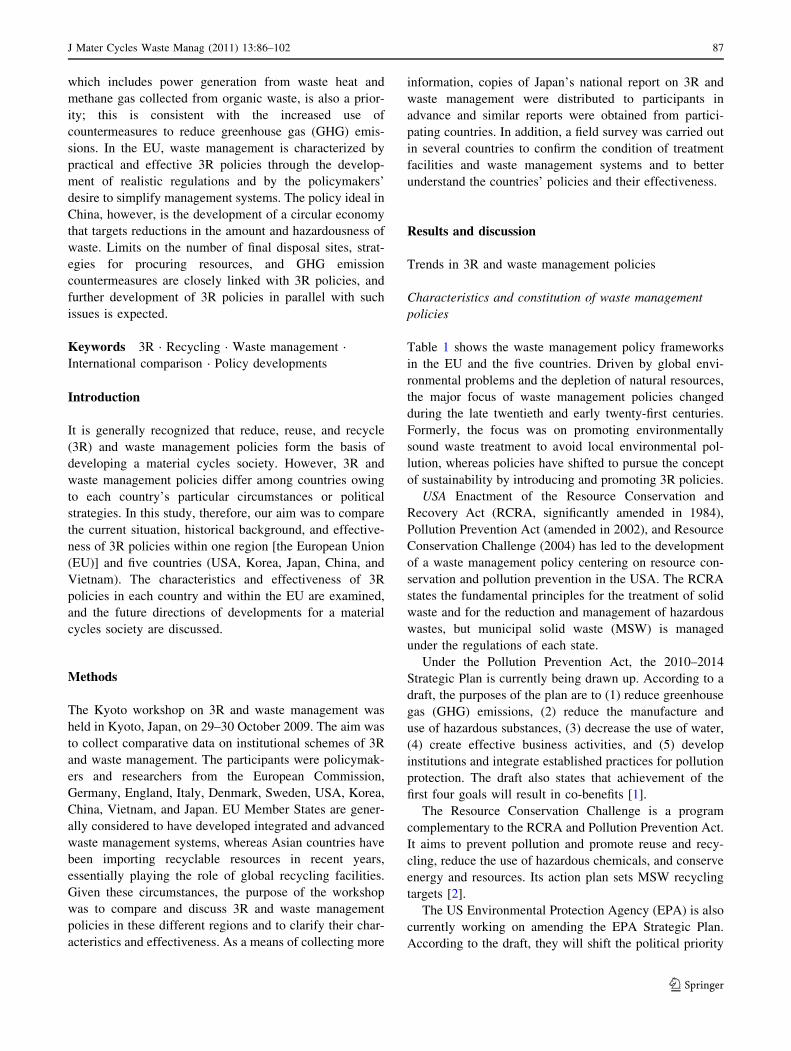
Table 1 shows the waste management policy frameworks
in the EU and the five countries. Driven by global envi-
ronmental problems and the depletion of natural resources,
the major focus of waste management policies changed
during the late twentieth and early twenty-first centuries.
Formerly, the focus was on promoting environmentally
sound waste treatment to avoid local environmental pol-
lution, whereas policies have shifted to pursue the concept
of sustainability by introducing and promoting 3R policies.
USA Enactment of the Resource Conservation and
Recovery Act (RCRA, significantly amended in 1984),
Pollution Prevention Act (amended in 2002), and Resource
Conservation Challenge (2004) has led to the development
of a waste management policy centering on resource con-
servation and pollution prevention in the USA. The RCRA
states the fundamental principles for the treatment of solid
waste and for the reduction and management of hazardous
wastes, but municipal solid waste (MSW) is managed
under the regulations of each state.
Under the Pollution Prevention Act, the 2010–2014
Strategic Plan is currently being drawn up. According to a
draft, the purposes of the plan are to (1) reduce greenhouse
gas (GHG) emissions, (2) reduce the manufacture and
use of hazardous substances, (3) decrease the use of water,
(4) create effective business activities, and (5) develop
institutions and integrate established practices for pollution
protection. The draft also states that achievement of the
first four goals will result in co-benefits [1].
The Resource Conservation Challenge is a program
complementary to the RCRA and Pollution Prevention Act.
It aims to prevent pollution and promote reuse and recy-
cling, reduce the use of hazardous chemicals, and conserve
energy and resources. Its action plan sets MSW recycling
targets [2].
The US Environmental Protection Agency (EPA) is also
currently working on amending the EPA Strategic Plan.
According to the draft, they will shift the political priority
J Mater Cycles Waste Manag (2011) 13:86–102 87
123
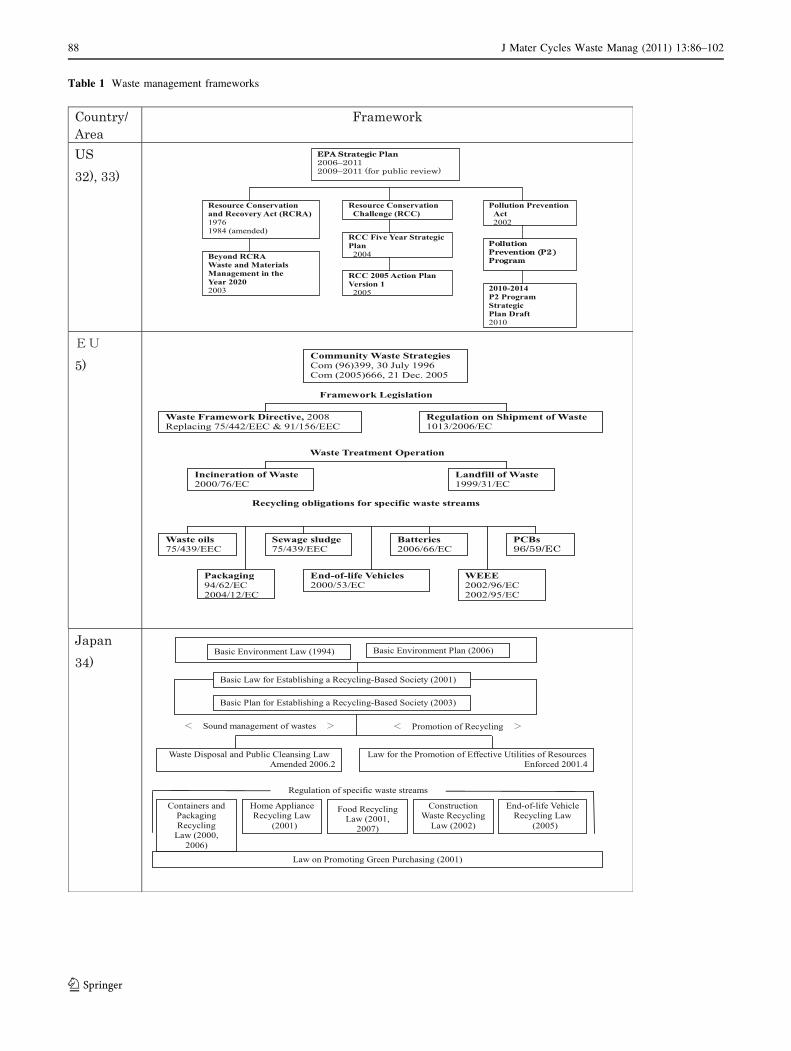
Table 1 Waste management frameworks
88 J Mater Cycles Waste Manag (2011) 13:86–102
123
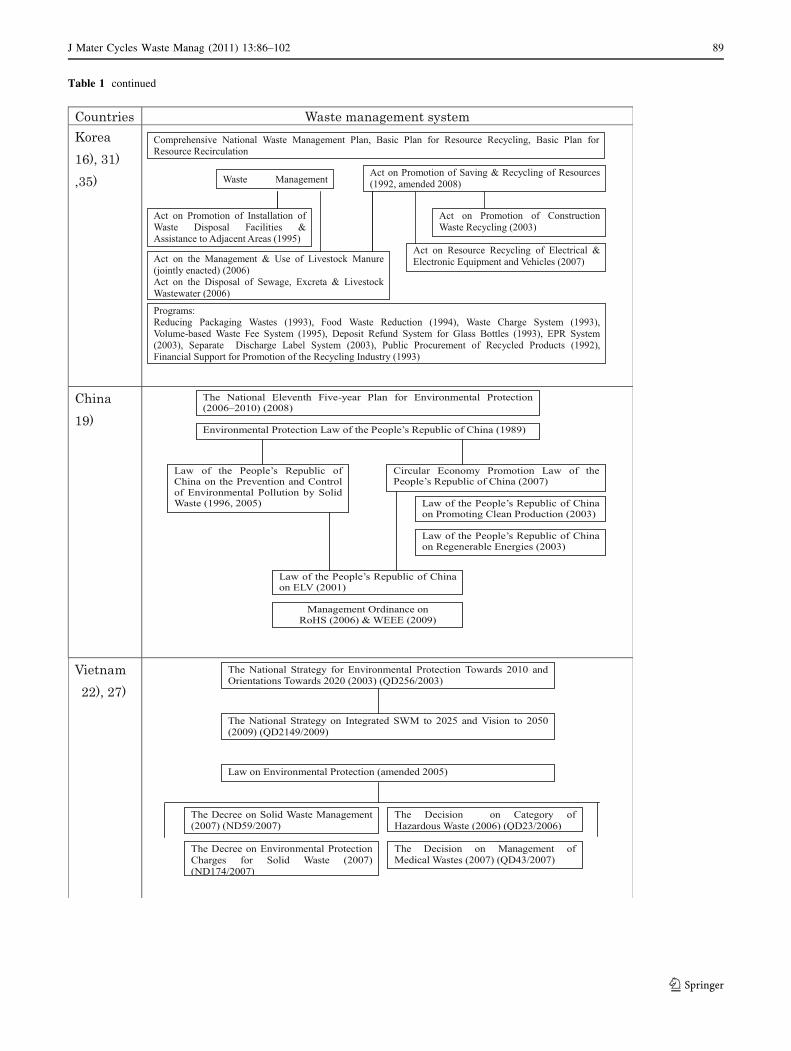
Table 1 continued
J Mater Cycles Waste Manag (2011) 13:86–102 89
123

from waste management to resource management as a
strategy to reduce GHG emissions [3].
Waste management policy in the USA is currently
integrated and includes measures to reduce GHG emis-
sions, manage hazardous chemicals, and conserve natural
resources.
EU In the EU, the Waste Framework Directive (2008)
[4] has been established as the basic waste management
legislation, and EU Member States have implemented
domestic laws on waste management under this directive.
The most notable characteristic of the EU’s waste man-
agement system is the promotion of 3R policies in parallel
with waste management regulations. The Directive on the
Incineration of Waste (2000) and the Directive on the
Landfill of Waste (1999) concern waste management. The
Directive on the Incineration of Waste primarily sets
standards for the application of best available techniques/
best environmental practice (BAT/BEP) for environmental
conservation, and it has had a notable effect in reducing
dioxin emissions. The Directive on the Landfill of Waste
sets standards for a tiered reduction of the disposal of
wastes containing organic materials at final disposal sites
(i.e., landfills). To reduce the amount of wastes for final
disposal, the directive has promoted the introduction of 3R
policies [5, 6]. The Directive on Waste Electrical and
Electronic Equipment (WEEE) and the Directive on
Restriction of Hazardous Substances (RoHS) were estab-
lished in 2002 for the purpose of promoting sound material
recycling and preventing pollution from the hazardous
chemicals contained in such wastes. WEEE recycling has
been promoted through the introduction and use of WEEE
collection points. The extended producer responsibility
(EPR), which requires that a producer of products manages
them through reuse, recycling, and disposal even after their
useful life and must develop and produce products that are
easy to reuse and recycle, was applied to the basic concepts
for the development of 3R policies for WEEE and pack-
aging. Germany was the first country within the EU to
apply EPR to packaging waste, in 1992 [7], and that was
followed by legislation on collecting and recycling of end-
of-life vehicles (ELV) and waste batteries.
Although EPR is recognized as an important concept in
the UK, its waste management policy is based on the
principle of shared responsibility which presupposes that
the responsibility for production of a product, circulation,
consumption, disposal, and recycling is shared by everyone
[8]. The government has signed a voluntary agreement with
industry to reduce wastes and promote recycling of pack-
aging materials, food, and paper. The UK introduced a
landfill tax, which is currently 40 GBP/t and will increase
by 8 GBP annually to 72 GBP/t in 2013. Italy has intro-
duced economic measures through a unit-based fee system
whereby a management fee in paid according to the
quantity of waste to discharge to encourage better waste
management, and about 15% of municipalities, or 29% of
Italy’s population, currently are covered by this type of
system [9].
Japan The basic law for establishing a Material Cycles
Society (2000) defines recyclable resources and states the
principles for their utilization [10]. The law has the goal of
a society wherein the consumption of natural resources is
restrained and the environmental load is reduced as far as
possible, through promotion of the 3R as well as the
environmentally sound waste management. The law set
quantitative targets for three indicators: resource produc-
tivity, cyclical use rate, and final disposal amount. These
goals have also been pursued on a global scale through the
Group of Eight (G8) process known as the 3R initiative.
The basic legislation concerning waste management in
Japan consists of the Waste Disposal and Public Cleansing
Law (amended in 2010), which is the basic law of waste
management, and the Law for the Promotion of Effective
Utilities of Resources (2001), which is the basic law for
recycling of used resources. The laws for recycling specific
items such as containers and packaging, WEEE, food
waste, construction waste, and ELV were established in
these laws. In addition, the Law on Promoting Green
Purchasing was enacted in 2001, with the purpose of pro-
moting government procurement of recycled products.
Japan’s waste management system is characterized by the
existence of two independent basic acts on waste man-
agement as well as on material recycling, under which the
laws concerning recycling of specific items are laid down.
The legislative framework is similar to those of the EU and
Korea.
Korea The basic legislative framework on waste
management in Korea consists of the Waste Management
Act (amended in 2007) and the Act on Promotion of
Resources Saving and Recycling (amended in 2008) [11].
The full-text amendment of the Waste Management Act
was implemented in 1991 to introduce waste recycling, a
deposit system, and standards for incineration and landfill
[12]. The Act on Promotion of Resources Saving and
Recycling is a revision of the Act on Promotion of
Resource Recycling enacted in 2002, and it lays out the
basic plan for material reuse, the fee system for waste
treatment, regulations on the use of one-way packaging and
goods, and EPR [13]. EPR was also included in the Act on
Resource Recycling of Electrical and Electronic Equip-
ment and Vehicles, which was enacted in 2008 [14].
The initial driving force for the promotion of 3R policies
in Korea was a strong campaign by neighborhoods against
the construction of waste treatment facilities [14]. The
Promotion of Installation of Waste Disposal Facilities and
Assistance to Adjacent Areas Act [15] was enacted in 1995
to ensure that facilities were adequately established. At the
90 J Mater Cycles Waste Manag (2011) 13:86–102
123
same time, a fee system for waste generation was intro-
duced as a strict economic measure against increases in the
amount of waste, in addition to other measures such as
separated collection and regulations on the use of one-way
packaging. From 2005, organic wastes were no longer
accepted at landfills and had to be recycled [16].
China The basic environmental legislation in China is
the Environmental Protection Law of the People’s
Republic of China (1989), under which other laws were
established. The Environmental Pollution Prevention and
Control Law by Solid Waste was enacted in 1996 and
amended in 2005. It introduced the application of 3R
policies for solid municipal, industrial, and hazardous
wastes and required not only a reduction in the amount of
waste but also in its hazardousness [17]. Treatment consists
mainly of detoxification of wastes, but the law does not
establish a priority in terms of treatment methods (e.g.,
incineration or landfill). The inventory on hazardous wastes
was also established in this act.
The Circular Economy Promotion Law, enacted in 2008,
is the basic law concerning material cycles and waste
management in China [18]. Several factors are said to be
behind the enactment of the Circular Economy Promotion
Law, including a lack of resources, insufficient use of
recycled materials, and a national strategy of tackling the
problem of resource depletion, accompanied by the desire
for sustainable economic growth. In other words, the sub-
stantial lack of resources in the face of a rapidly growing
economy caused China to expand its use of recycled
materials. At the same time, China’s economic growth was
accompanied by a massive increase in the amount of waste
generated; this produced serious social and environmental
problems and an urgent need to improve China’s waste
management systems. Consequently, the integrated use of
recycled resources and the promotion of zero emissions at
production facilities were considered to be essential,
especially in the circular economic zone where many
industrial facilities are located. The Circular Economy
Promotion Law thus emphasizes the promotion and man-
agement of 3R activities in the industrial sector and
includes economic incentives, such as a reduction in, or
exemption from, the value-added tax, for the integrated and
circulative use of resources [19].
In order for the Circular Economy Promotion Law to
have substantive effects, WEEE and MSW management
systems needed to be enhanced through improving recy-
cling and waste treatment techniques and strengthening the
financial base of companies utilizing recycled resources.
Although the focus of waste management policies in China
has been on the problem of resource depletion and main-
taining rapid economic growth, the environmental
protection system with regard to imported recycling mate-
rials also needed improvements. Furthermore, measures
also had to be taken against increased MSW caused by
population expansion and economic development in urban
areas. To this end, the ELV Recycling Law (2001) and
Management Ordinance on WEEE (2009) were established
[19]. The production of automobiles is increasing dramat-
ically in China and is predicted to result in a massive
increase in ELV in the near future. Nevertheless, rather than
ensuring sound waste management of ELV, the ELV
Recycling Law emphasizes the prevention of illegal
remodeling, ensures car safety, and promotes the purchase
of new models with environmentally friendly features.
Furthermore, existing recycling facilities lack the capacity
to meet the predicted demand for ELV recycling [20, 21].
Vietnam The basic legislation for environmental man-
agement in Vietnam is the Environmental Protection Law
(amended in 2005), which takes precedence over other laws
concerning waste management. The waste management
system was established under the Decree on Solid Waste
Management (2007), which establishes environmental
protection measures for solid waste treatment [22]. The
Decree covers the overall waste management policy and
prioritizes recycling, reutilization, and treatment and
recovery, to prevent land consumption by landfills [23]. The
collection, transport, and treatment of waste are subject to
fees of 40,000 VND/t for MSW and as much as
6,000,000 VND/t for hazardous wastes [24]. Hazardous and
medical waste categories are defined under the decision [25,
26]. The former regulation on the control of hazardous
wastes (decision no. 155/1999/QD) was incorporated in the
Decree regulations on solid waste management as articles
70–75 at the time of its amendment.
The targets for waste management in Vietnam are
determined under The National Strategy on Integrated
SWM for the years of 2025 and 2050 (2009) [27]. The mid-
term strategic targets for 2025 are to have separated MSW.
Solid wastes from business activities in urban areas and
hazardous and non-hazardous wastes from industrial sec-
tors are to be managed completely (100%) in an
environmentally sound manner, and 90% of all construc-
tion wastes in urban areas and municipal solid wastes in the
suburbs are to be collected. In addition, the strategy calls
for minimizing the amount of final disposal by 2050
through the collection of all solid wastes, promotion of 3R
policies, and employment of advanced and environmen-
tally sound techniques. In Vietnam’s case, the incentive for
the promotion of 3R activities in urban areas seems to arise
from a sense of crisis about the upcoming depletion of land
available for use as landfills [28].
Waste management targets
The EU and other countries employ a common hierar-
chical approach in their 3R and waste management
J Mater Cycles Waste Manag (2011) 13:86–102 91
123
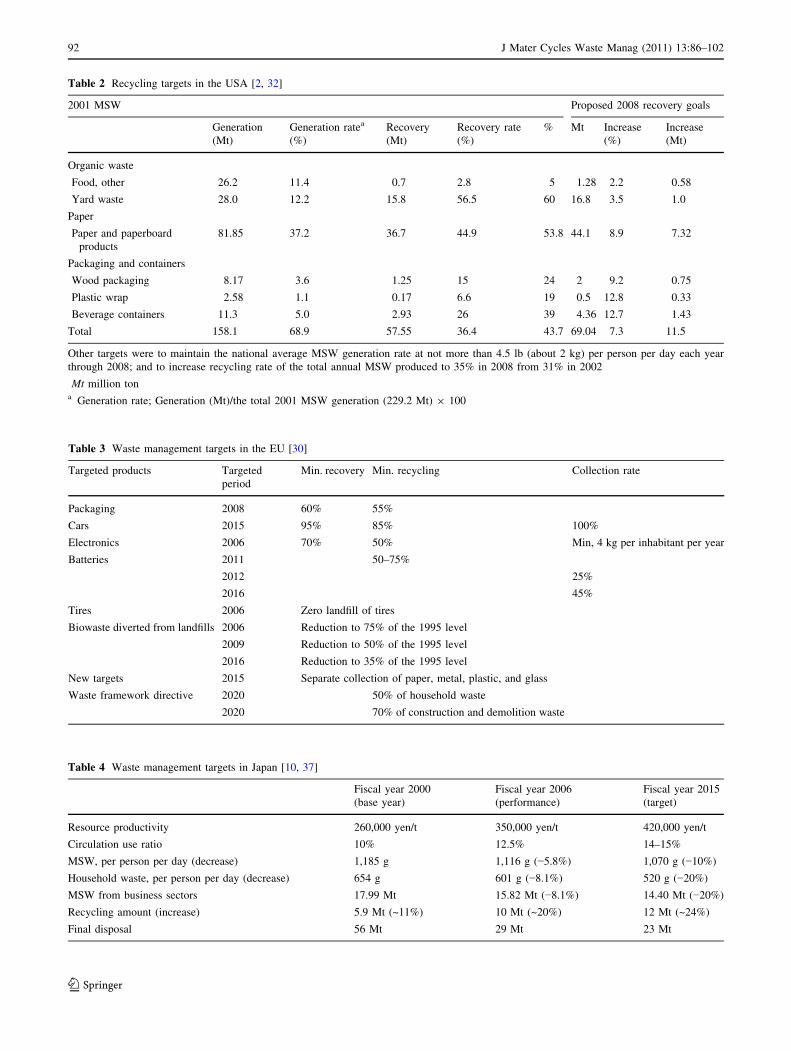
Table 2 Recycling targets in the USA [2, 32]
2001 MSW Proposed 2008 recovery goals
Generation
(Mt)
Generation ratea
(%)
Recovery
(Mt)
Recovery rate
(%)
% Mt Increase
(%)
Increase
(Mt)
Organic waste
Food, other 26.2 11.4 0.7 2.8 5 1.28 2.2 0.58
Yard waste 28.0 12.2 15.8 56.5 60 16.8 3.5 1.0
Paper
Paper and paperboard
products
81.85 37.2 36.7 44.9 53.8 44.1 8.9 7.32
Packaging and containers
Wood packaging 8.17 3.6 1.25 15 24 2 9.2 0.75
Plastic wrap 2.58 1.1 0.17 6.6 19 0.5 12.8 0.33
Beverage containers 11.3 5.0 2.93 26 39 4.36 12.7 1.43
Total 158.1 68.9 57.55 36.4 43.7 69.04 7.3 11.5
Other targets were to maintain the national average MSW generation rate at not more than 4.5 lb (about 2 kg) per person per day each year
through 2008; and to increase recycling rate of the total annual MSW produced to 35% in 2008 from 31% in 2002
Mt million tona Generation rate; Generation (Mt)/the total 2001 MSW generation (229.2 Mt) 9 100
Table 3 Waste management targets in the EU [30]
Targeted products Targeted
period
Min. recovery Min. recycling Collection rate
Packaging 2008 60% 55%
Cars 2015 95% 85% 100%
Electronics 2006 70% 50% Min, 4 kg per inhabitant per year
Batteries 2011 50–75%
2012 25%
2016 45%
Tires 2006 Zero landfill of tires
Biowaste diverted from landfills 2006 Reduction to 75% of the 1995 level
2009 Reduction to 50% of the 1995 level
2016 Reduction to 35% of the 1995 level
New targets 2015 Separate collection of paper, metal, plastic, and glass
Waste framework directive 2020 50% of household waste
2020 70% of construction and demolition waste
Table 4 Waste management targets in Japan [10, 37]
Fiscal year 2000
(base year)
Fiscal year 2006
(performance)
Fiscal year 2015
(target)
Resource productivity 260,000 yen/t 350,000 yen/t 420,000 yen/t
Circulation use ratio 10% 12.5% 14–15%
MSW, per person per day (decrease) 1,185 g 1,116 g (−5.8%) 1,070 g (−10%)
Household waste, per person per day (decrease) 654 g 601 g (−8.1%) 520 g (−20%)
MSW from business sectors 17.99 Mt 15.82 Mt (−8.1%) 14.40 Mt (−20%)
Recycling amount (increase) 5.9 Mt (~11%) 10 Mt (~20%) 12 Mt (~24%)
Final disposal 56 Mt 29 Mt 23 Mt
92 J Mater Cycles Waste Manag (2011) 13:86–102
123

policies. However, there are also unique approaches
within the various countries. For example, in China,
where the concept of the circular economy is promoted as
a policy ideal, Article 3 of the Solid Waste Pollution
Prevention and Control Law clearly states that reduction
(the first priority in the 3R management hierarchy) should
be achieved not only in the amount of wastes but also in
the waste’s level of hazardousness [29]. The EU’s waste
management system is characterized by concerns about
the practicality and effectiveness of its 3R policies, the
development of a realistic legal framework, and the
underlying attitude of policymakers toward simplifying
the bewildering expansion of waste management systems
[30].
Table 5 Recycling targets for individual items in Japan [10]
Classification Item Target rate
(%)
Definition of target Target fiscal
year
Containers and packaging Glass bottles 91 Percentage of cullet use relative to the amount of
glass bottles manufactured in Japan
2010
PET bottles – – –
Plastics containers and
packaging
– – –
Paper containers and
packaging
– – –
Steel cans – – –
Aluminum cans – – –
Paper cartons – – –
Cardboard – – –
Paper 62 Percentage of recycled paper use relative to the
amount of paper manufactured in Japan
2010
Home appliances Air conditioners 70 Recycling/disposal –
Cathode-ray tube TVs 55 Same as above –
Refrigerators and freezers 60 Same as above –
Washing machines 65 Same as above –
Liquid-crystal TVs,
plasma TVs
50 Same as above
Construction waste Asphalt and concrete
lumps
98 Percentage of recycled material weight relative to
the weight of specific construction waste
2012
Concrete lumps 98 Same as above 2012
Construction waste
timber
95 Same as above 2012
Food waste Food manufacturers 85 [(Generating prevention amount) + (recycling
amount) + (heat recovery
amount) 9 0.95 + (treatment amount)]/
[(generating prevention amount) + (generating
amount)]
–
Food retailers 45 Same as above –
Food wholesale business 70 Same as above –
Food service industry 40 Same as above –
Personal computers and
peripherals devices
Desktop computers 50 Resource recycling/recovered –
Notebook personal
computers
20 Same as above –
Cathode-ray tube displays 55 Same as above –
Liquid crystal displays 55 Same as above –
Small, secondary batteries Nickel-cadmium batteries 60 Recycling/disposal –
Nickel-hydride batteries 55 Same as above –
Lithium batteries 30 Same as above –
Sealed lead acid batteries 50 Same as above –
PET poly(ethylene terephthalate)
J Mater Cycles Waste Manag (2011) 13:86–102 93
123
Most of the countries are also setting concrete quanti-
tative targets. The waste management targets are
summarized in Table 2 (for the USA), Table 3 (the EU),
Tables 4 and 5 (Japan), and Table 6 (Korea). A new waste
management strategy is currently being drawn up in the
USA, so the targets in Table 2 may soon be subject to
revision.
Waste management targets serve as the progress
benchmarks of 3R policies, and the targets are determined
at the same time as the waste management hierarchy. The
targets for reduction of overall wastes have the highest
priority, followed by the targets for specific recycled items
and targets for specific waste management measures.
The USA, Japan, and Korea all set targets for waste
generation. In the USA, the maximum target for waste
generation, which was to be achieved by 2008, is
4.5 lb person−1 day−1 or approximately 2 kg person−1 day−1
[2]. The target is under revision and discussion. In Japan,
the target for non-industrial waste generation in 2015 is
1,070, or 520 g person−1 day−1 for household solid waste
[10]. If achieved, these targets would bring about a 10%
(total MSW) and 20% (household waste) reduction relative
to the base year of 2000 for the USA and Japan, respec-
tively. In Korea, however, the reduction rate relative to the
estimated MSW amount in the target year is applied as a
target index. The MSW amount of waste for 2012 is esti-
mated to be 47,975 t/day, and the reduction target is
45,177 t/day or 5.8% [31].
Targets for waste management measures are also used in
the USA, EU, Japan, and Korea. In the USA, the target
recycling rate in 2008 was 35 wt%, relative to 31 wt% in
2002 [2]. In terms of the amount of material recovery, this
Table 6 3R policy targets in Korea [16, 31]
Municipal waste management goals
Category 2005 2008 2010 2012
Expected generation (t/day) 48,003 47,989 47,975
Reduction rate relative to 2005 2.5% 4.2% 5.8%
Waste generation (t/day) 48,398 46,083 45,990 45,177
Recycling amount (t/day) 27,243 26,678 27,134 27,558
Recycling rate (wt%) 56.3 57.0 59.0 61.0
Regulations on packaging methods
Category Ratio of total packing size (%) Number of packing layers
Food stuffs 10–20 ≤2
Cosmetics \10 ≤2
Detergents \10 ≤2
Sundries 30–35 ≤2
Quasi-drugs \10 ≤2
Miscellaneous products \20 ≤2
Annual reduction targets for synthetic resin packaging materials
Item Ratio of synthetic resin packages (%)
Egg holders \40
Apple and pear holders \65
Instant noodle containers \85
Agricultural, livestock, and fishery products \90
Electrical appliances ESP packaging for items under 20,000 cm3 in volume is prohibited
Target recycling rates
Item Target rate (%)
Used paper 72
Used glass 71
Used glass bottles 50
Used steel cans 65
94 J Mater Cycles Waste Manag (2011) 13:86–102
123

represents an increase from 57.55 million ton (Mt) in 2001
to 69.04 Mt in 2008. In the 2010–2014 Strategic Plan,
which is currently being revised, the target amount of 3R
materials increases by approximately 58 Mt by 2014 [1].
The EU determined that separation and collection should
be deployed by 2015 for paper, metals, plastics, and glass,
and it set the long-term recycling target at 50 wt% of
household waste to be recycled by 2020. The EU also aims
to gradually reduce the amount of total household-gener-
ated waste containing organic material in landfills (75% in
2006, 50% in 2009, and 35% in 2016) [30]. In Japan, the
recycling target is 12 Mt (24 wt% of waste generation), and
the target for final disposal is 23 Mt (41% relative to the
base year of 2000) [10]. In Korea, the recycling target for
2012 is 27,558 t/day (10 Mt/year), or 61.0 wt% of total
waste generated [31].
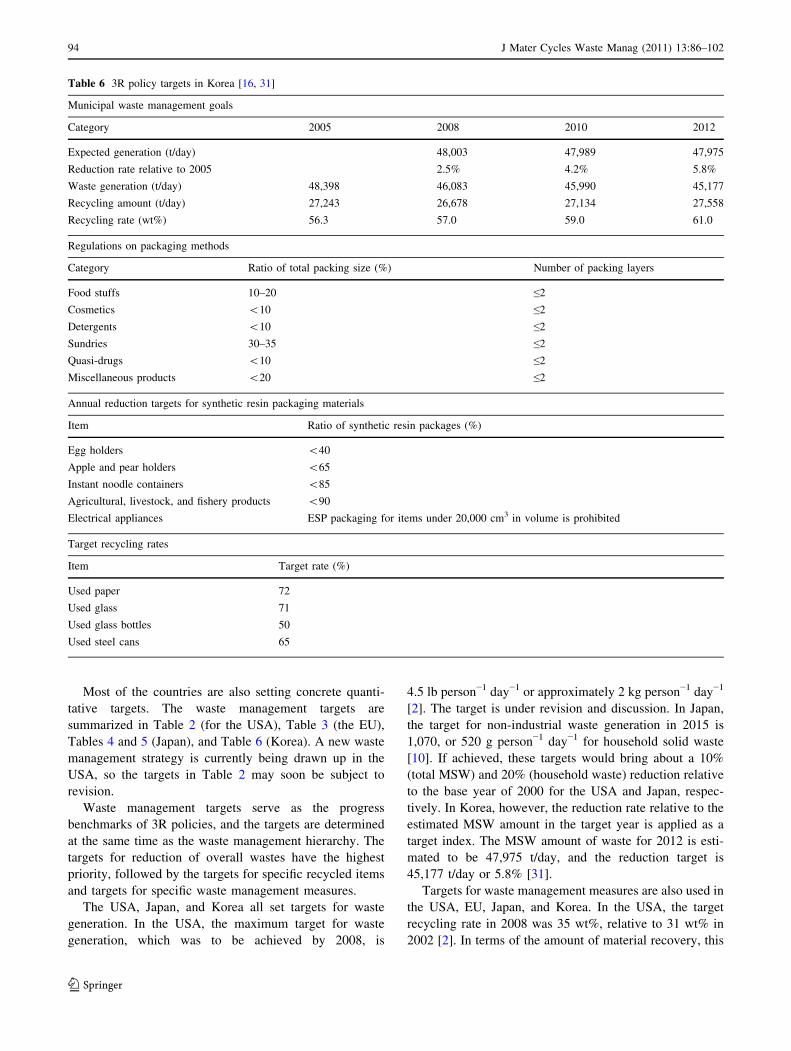
The USA, EU, and Korea also set recycling targets for
packaging materials. In the USA, the target recovery
amount for each material is defined, and the rate of
recovery is calculated relative to the amount of each
material as waste in the base year 2001 [2]. The target rates
of recovery are 24.2% (+9.2%) for wooden packaging,
19.4% (+12.8%) for plastics, and 38.7% (+12.7%) for
drinks packaging. It is likely that thermal methods are not
regarded during the calculation of recovery rates in the
USA. In the EU, the targets for material recycling and the
targets for recovery, including heat utilization, are defined
relative to the waste amount generated in the base year
[30]. The material recycling target is 55 wt%, whereas the
target rate of recovery is 60%. In Korea, the recycling
target for each material is set yearly; in 2008 it was 50 wt%
for glass and 65 wt% for steel cans [16]. The Korean
performance report shows that the recycling rates for glass
bottles, aluminum cans, and steel cans exceed 75 wt% [31];
thus, the target recycling rates may be subject to amend-
ment. In addition, quantitative targets have also been set for
reducing the use of packaging materials, and the selection
of materials is also regulated [16].
Comparison of the effectiveness of 3R and waste
management policies
Waste generation and treatment measures
Tables 7 and 8 show the amounts of waste generated and
the methods (recycling, incineration, and landfill) used to
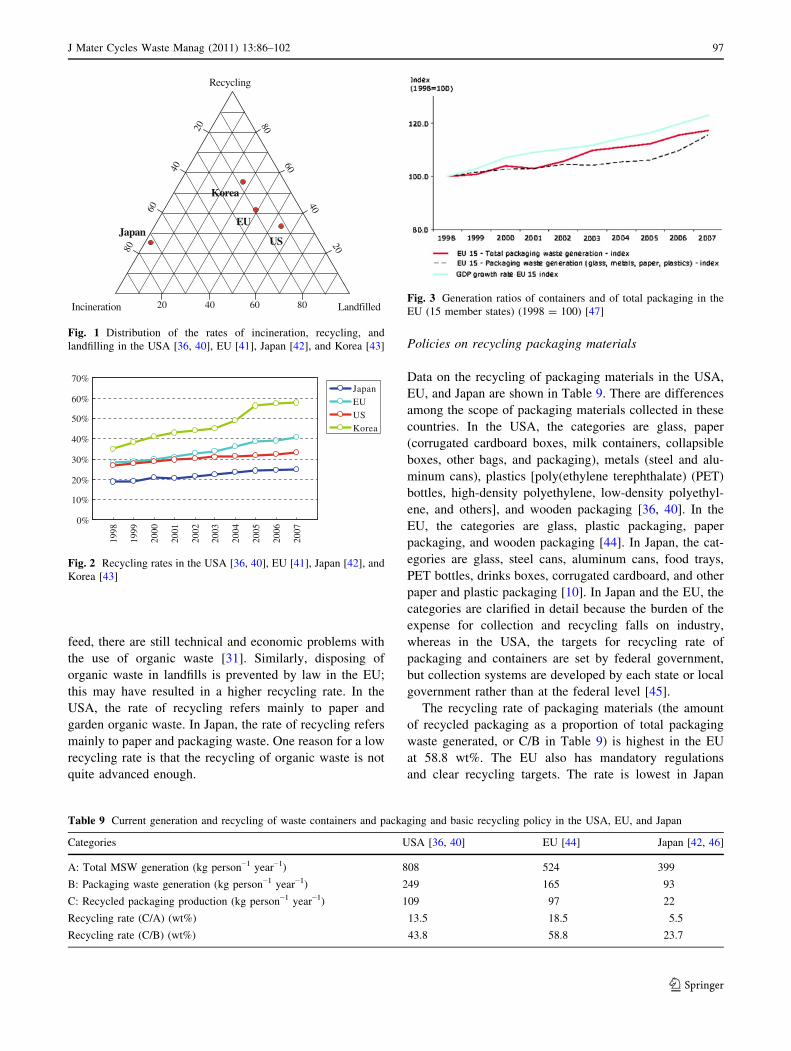
treat MSW in the EU, USA, Japan, and Korea. Figure 1
shows the distribution of the management methods. In
Japan, the total amount of landfilled materials includes
incinerated materials that have gone through shredding and
sorting processes at treatment facilities, recycled materials,
and final disposal materials, including incinerated residues.
Thus, for comparison, the amount recycled in Japan was
calculated as (amount of waste generated) − (directly
incinerated amount + direct landfilled amount); this was
also done for data from the EU, although the calculated
quantities are greater than the amounts in published data.
Furthermore, although thermal recovery is not included in
recycling in the USA, EU, and Korea, it is included in
recycling in Japan.
The USA has the highest rate of waste generation
(800 kg person−1 year−1), followed by Japan and Korea
(both around 400 kg person−1 year−1). In terms of MSW
composition in the USA, the most dominant component is
packaging, which accounts for 30%, followed by waste
containing organic materials (27%), paper (24%), and steel
and plastics (18%; percentage by weight in 2008) [38].
Waste management methods are quite different in Japan
from in the EU and the other countries. Waste incineration
predominates in Japan and the rate of final disposal in
landfills is extremely low, whereas the rate of incineration
is usually low elsewhere (Table 7; Fig. 1). There are also
differences among the EU, USA, and Korea. The landfill
rate in the USA and the EU reaches about 40–50% of the
total amount of waste generated, but it is only about 20% in
Korea. Korea also has a much higher recycling rate (almost
60 wt%) than the EU and USA (about 30–40 wt%). The
yearly changes in management methods shown in Table 8
indicate that changes have been relatively gradual in the
USA, whereas the landfill rates have drastically decreased
as the recycling rates have increased in the EU, Japan, and
especially in Korea.
Recycling rates in 2007 were highest in Korea (58 wt%),
followed by the EU (41 wt%), USA (33 wt%), and Japan
(25 wt%) (Fig. 2). The rate of recycling in Korea increased
rapidly since restrictions were imposed on disposing of
organic waste in 2005. In Korean statistics, separated and
collected organic waste is counted as recycled waste [39].
The ratio of organic waste to total recycled waste was
45 wt% in 2008, indicating that almost half of recycling
material is organic waste. However, although the organic
waste is currently subject to composting and utilization as
Table 7 Breakdown of MSW management methods in each country
Countries Recycling Incineration Landfill Total
USAa 268 (33.2) 102 (12.7) 438 (54.1) 808 (100.0)
EUb 215 (41.0) 102 (19.5) 207 (39.5) 524 (100.0)
Japanc 100 (25.1) 290 (72.6) 9 (2.3) 399 (100.0)
Koread 221 (57.8) 71 (18.6) 90 (23.6) 382 (100.0)
Data are presented as in kg person−1 year−1 (%)a 2008 data; incineration, only with energy recovery [36, 40]b 2008 data [41]c 2007 data; landfill, not including residue [42]d 2007 data [43]
J Mater Cycles Waste Manag (2011) 13:86–102 95
123

Table 8 Amount and ratio of MSW generated (per person per year) by waste treatment method in the USA [36, 40], EU [41], Japan [42], and
Korea [43]
96 J Mater Cycles Waste Manag (2011) 13:86–102
123
feed, there are still technical and economic problems with
the use of organic waste [31]. Similarly, disposing of
organic waste in landfills is prevented by law in the EU;
this may have resulted in a higher recycling rate. In the
USA, the rate of recycling refers mainly to paper and
garden organic waste. In Japan, the rate of recycling refers
mainly to paper and packaging waste. One reason for a low
recycling rate is that the recycling of organic waste is not
quite advanced enough.
Policies on recycling packaging materials
Data on the recycling of packaging materials in the USA,
EU, and Japan are shown in Table 9. There are differences
among the scope of packaging materials collected in these
countries. In the USA, the categories are glass, paper
(corrugated cardboard boxes, milk containers, collapsible
boxes, other bags, and packaging), metals (steel and alu-
minum cans), plastics [poly(ethylene terephthalate) (PET)
bottles, high-density polyethylene, low-density polyethyl-
ene, and others], and wooden packaging [36, 40]. In the
EU, the categories are glass, plastic packaging, paper
packaging, and wooden packaging [44]. In Japan, the cat-
egories are glass, steel cans, aluminum cans, food trays,
PET bottles, drinks boxes, corrugated cardboard, and other
paper and plastic packaging [10]. In Japan and the EU, the
categories are clarified in detail because the burden of the
expense for collection and recycling falls on industry,
whereas in the USA, the targets for recycling rate of
packaging and containers are set by federal government,
but collection systems are developed by each state or local
government rather than at the federal level [45].
The recycling rate of packaging materials (the amount
of recycled packaging as a proportion of total packaging
waste generated, or C/B in Table 9) is highest in the EU
at 58.8 wt%. The EU also has mandatory regulations
and clear recycling targets. The rate is lowest in Japan
Recycling
Incineration Landfilled20 40 60 80
08
60
40
20
20
40
60
80
USJapan
EU
Korea
Fig. 1 Distribution of the rates of incineration, recycling, and
landfilling in the USA [36, 40], EU [41], Japan [42], and Korea [43]
0%
10%
20%
30%
40%
50%
60%
70%
1998
1999
2000
2001
2002
2003
2004
2005
2006
2007
JapanEUUSKorea
Fig. 2 Recycling rates in the USA [36, 40], EU [41], Japan [42], and
Korea [43]
Fig. 3 Generation ratios of containers and of total packaging in the
EU (15 member states) (1998 = 100) [47]
Table 9 Current generation and recycling of waste containers and packaging and basic recycling policy in the USA, EU, and Japan
Categories USA [36, 40] EU [44] Japan [42, 46]
A: Total MSW generation (kg person−1 year−1) 808 524 399
B: Packaging waste generation (kg person−1 year−1) 249 165 93
C: Recycled packaging production (kg person−1 year−1) 109 97 22
Recycling rate (C/A) (wt%) 13.5 18.5 5.5
Recycling rate (C/B) (wt%) 43.8 58.8 23.7
J Mater Cycles Waste Manag (2011) 13:86–102 97
123
(23.7 wt%), which has a legal recycling system but no clear
targets for recycling. The US rate (43.8 wt%) is closer to
that of the EU.
The USA generates the greatest amount of packaging
waste per person (249 kg person−1 year−1), 1.5–2 times the
amounts in the EU (165 kg person−1 year−1) and Japan
(93 kg person−1 year−1). In the EU, despite the early
development of recycling specifically aimed at reducing
packaging waste, the generation of packaging waste has
increased (Fig. 3). There are also great differences among
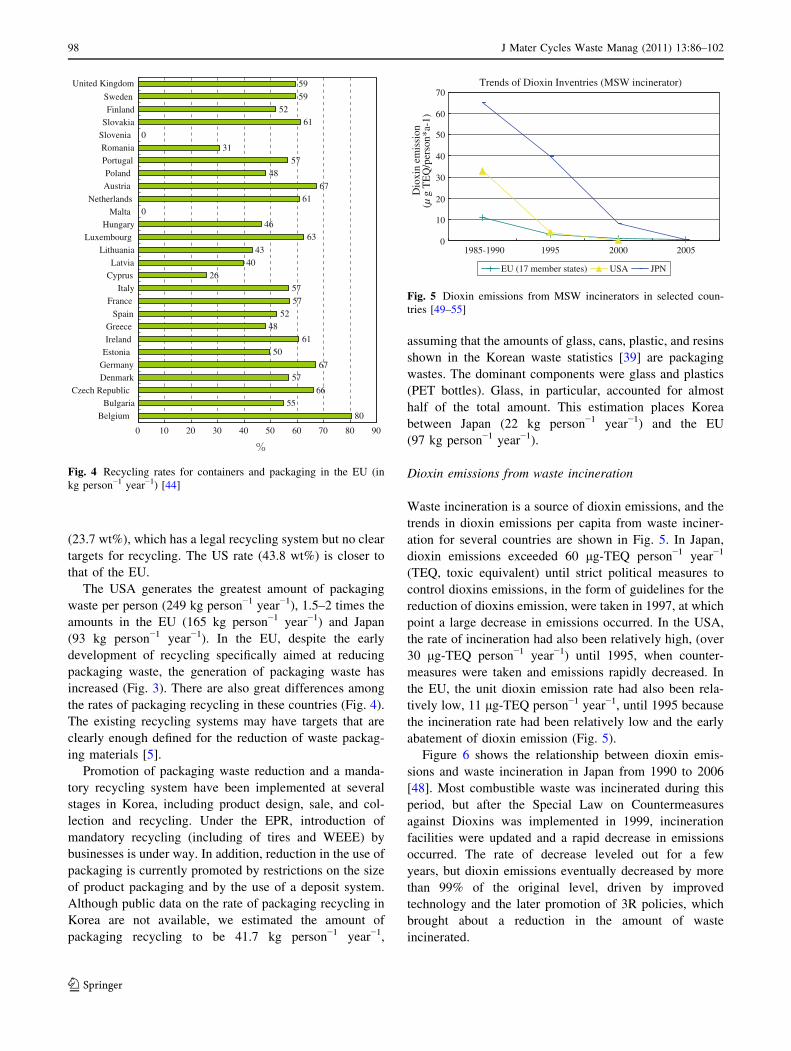
the rates of packaging recycling in these countries (Fig. 4).
The existing recycling systems may have targets that are
clearly enough defined for the reduction of waste packag-
ing materials [5].
Promotion of packaging waste reduction and a manda-
tory recycling system have been implemented at several
stages in Korea, including product design, sale, and col-
lection and recycling. Under the EPR, introduction of
mandatory recycling (including of tires and WEEE) by
businesses is under way. In addition, reduction in the use of
packaging is currently promoted by restrictions on the size
of product packaging and by the use of a deposit system.
Although public data on the rate of packaging recycling in
Korea are not available, we estimated the amount of
packaging recycling to be 41.7 kg person−1 year−1,
assuming that the amounts of glass, cans, plastic, and resins
shown in the Korean waste statistics [39] are packaging
wastes. The dominant components were glass and plastics
(PET bottles). Glass, in particular, accounted for almost
half of the total amount. This estimation places Korea
between Japan (22 kg person−1 year−1) and the EU
(97 kg person−1 year−1).
Dioxin emissions from waste incineration
Waste incineration is a source of dioxin emissions, and the
trends in dioxin emissions per capita from waste inciner-
ation for several countries are shown in Fig. 5. In Japan,
dioxin emissions exceeded 60 μg-TEQ person−1 year−1
(TEQ, toxic equivalent) until strict political measures to
control dioxins emissions, in the form of guidelines for the
reduction of dioxins emission, were taken in 1997, at which
point a large decrease in emissions occurred. In the USA,
the rate of incineration had also been relatively high, (over
30 μg-TEQ person−1 year−1) until 1995, when counter-
measures were taken and emissions rapidly decreased. In
the EU, the unit dioxin emission rate had also been rela-
tively low, 11 μg-TEQ person−1 year−1, until 1995 because
the incineration rate had been relatively low and the early
abatement of dioxin emission (Fig. 5).
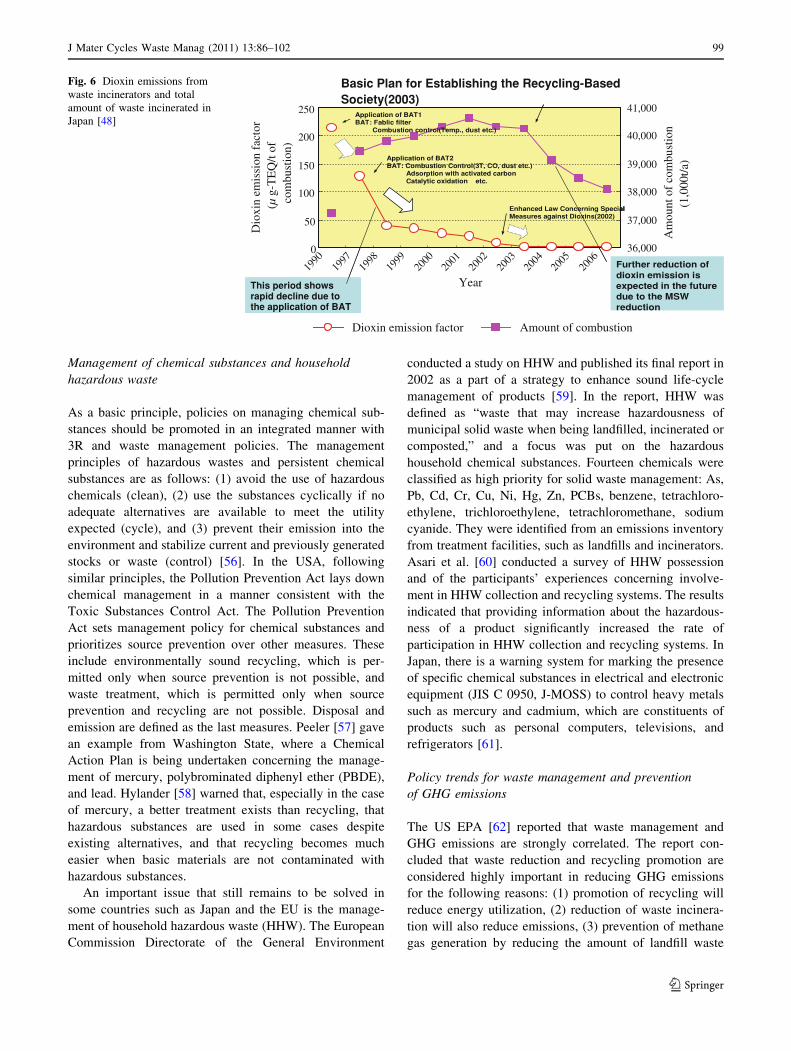
Figure 6 shows the relationship between dioxin emis-
sions and waste incineration in Japan from 1990 to 2006
[48]. Most combustible waste was incinerated during this
period, but after the Special Law on Countermeasures
against Dioxins was implemented in 1999, incineration
facilities were updated and a rapid decrease in emissions
occurred. The rate of decrease leveled out for a few
years, but dioxin emissions eventually decreased by more
than 99% of the original level, driven by improved
technology and the later promotion of 3R policies, which
brought about a reduction in the amount of waste
incinerated.
80
55
66
5767
50
61
4852
57
57
2640
43
63
460
61
67
4857
31
0
6152
59
59
0 10 20 30 40 50 60 70 80 90
Belgium
Bulgaria
Czech Republic
DenmarkGermany
Estonia
Ireland
GreeceSpain
France
Italy
CyprusLatvia
Lithuania
Luxembourg
HungaryMalta
Netherlands
Austria
Poland Portugal
Romania
Slovenia
SlovakiaFinland
Sweden
United Kingdom
Fig. 4 Recycling rates for containers and packaging in the EU (in
kg person−1 year−1) [44]
Trends of Dioxin Inventries (MSW incinerator)
0
10
20
30
40
50
60
70
1985-1990 1995 2000 2005
Dio
xin
emis
sion
(µ g
TE
Q/p
erso
n*a-
1)
EU (17 member states) USA JPN
Fig. 5 Dioxin emissions from MSW incinerators in selected coun-
tries [49–55]
98 J Mater Cycles Waste Manag (2011) 13:86–102
123
Management of chemical substances and householdhazardous waste
As a basic principle, policies on managing chemical sub-
stances should be promoted in an integrated manner with
3R and waste management policies. The management
principles of hazardous wastes and persistent chemical
substances are as follows: (1) avoid the use of hazardous
chemicals (clean), (2) use the substances cyclically if no
adequate alternatives are available to meet the utility
expected (cycle), and (3) prevent their emission into the
environment and stabilize current and previously generated
stocks or waste (control) [56]. In the USA, following
similar principles, the Pollution Prevention Act lays down
chemical management in a manner consistent with the
Toxic Substances Control Act. The Pollution Prevention
Act sets management policy for chemical substances and
prioritizes source prevention over other measures. These
include environmentally sound recycling, which is per-
mitted only when source prevention is not possible, and
waste treatment, which is permitted only when source
prevention and recycling are not possible. Disposal and
emission are defined as the last measures. Peeler [57] gave
an example from Washington State, where a Chemical
Action Plan is being undertaken concerning the manage-
ment of mercury, polybrominated diphenyl ether (PBDE),
and lead. Hylander [58] warned that, especially in the case
of mercury, a better treatment exists than recycling, that
hazardous substances are used in some cases despite
existing alternatives, and that recycling becomes much
easier when basic materials are not contaminated with
hazardous substances.
An important issue that still remains to be solved in
some countries such as Japan and the EU is the manage-
ment of household hazardous waste (HHW). The European
Commission Directorate of the General Environment
conducted a study on HHW and published its final report in
2002 as a part of a strategy to enhance sound life-cycle
management of products [59]. In the report, HHW was
defined as “waste that may increase hazardousness of
municipal solid waste when being landfilled, incinerated or
composted,” and a focus was put on the hazardous
household chemical substances. Fourteen chemicals were
classified as high priority for solid waste management: As,
Pb, Cd, Cr, Cu, Ni, Hg, Zn, PCBs, benzene, tetrachloro-
ethylene, trichloroethylene, tetrachloromethane, sodium
cyanide. They were identified from an emissions inventory
from treatment facilities, such as landfills and incinerators.
Asari et al. [60] conducted a survey of HHW possession
and of the participants’ experiences concerning involve-
ment in HHW collection and recycling systems. The results
indicated that providing information about the hazardous-
ness of a product significantly increased the rate of
participation in HHW collection and recycling systems. In
Japan, there is a warning system for marking the presence
of specific chemical substances in electrical and electronic
equipment (JIS C 0950, J-MOSS) to control heavy metals
such as mercury and cadmium, which are constituents of
products such as personal computers, televisions, and
refrigerators [61].
Policy trends for waste management and preventionof GHG emissions
The US EPA [62] reported that waste management and
GHG emissions are strongly correlated. The report con-
cluded that waste reduction and recycling promotion are
considered highly important in reducing GHG emissions
for the following reasons: (1) promotion of recycling will
reduce energy utilization, (2) reduction of waste incinera-
tion will also reduce emissions, (3) prevention of methane
gas generation by reducing the amount of landfill waste
0
50
100
150
200
250
1990
1997
1998
1999
2000
2001
2002
2003
2004
2005
2006
Year
Dio
xin
emis
sion
fac
tor
(µ g
-TE
Q/t
ofco
mbu
stio
n)
36,000
37,000
38,000
39,000
40,000
41,000
Am
ount
of
com
bust
ion
(1,0
00t/a
)
Amount of combustion
Application of BAT2BAT: Combustion Control(3T, CO, dust etc.)
Adsorption with activated carbonCatalytic oxidation etc.
Application of BAT1BAT: Fablic filter
Combustion control(Temp., dust etc.)
Basic Plan for Establishing the Recycling-Based Society(2003)
Enhanced Law Concerning Special Measures against Dioxins(2002)
This period shows rapid decline due to the application of BAT
Further reduction of dioxin emission is expected in the future due to the MSW reduction
Dioxin emission factor
Application of BAT2BAT: Combustion Control(3T, CO, dust etc.)
Adsorption with activated carbonCatalytic oxidation etc.
Application of BAT1BAT: Fablic filter
Combustion control(Temp., dust etc.)
Enhanced Law Concerning Special Measures against Dioxins(2002)
This period shows rapid decline due to the application of BAT
Fig. 6 Dioxin emissions from
waste incinerators and total
amount of waste incinerated in
Japan [48]
J Mater Cycles Waste Manag (2011) 13:86–102 99
123
will also contribute to emissions reduction, and (4) pro-
tection of forests through paper recycling will help to
maintain their carbon dioxide absorption function.
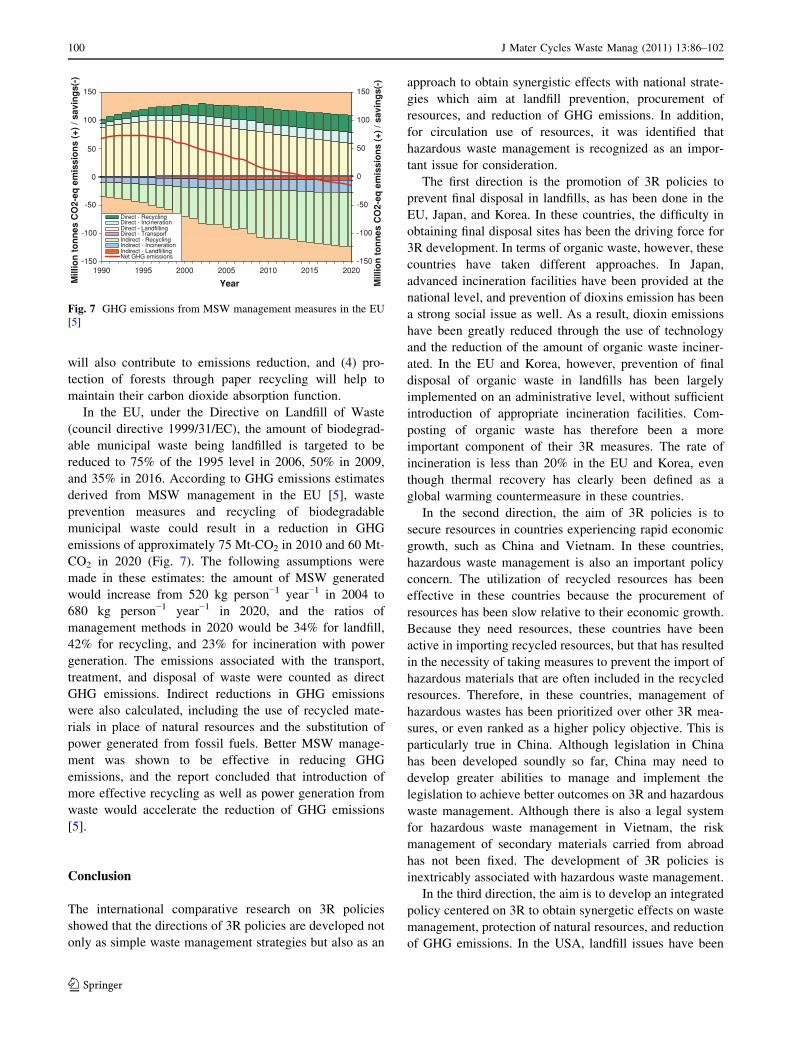
In the EU, under the Directive on Landfill of Waste
(council directive 1999/31/EC), the amount of biodegrad-
able municipal waste being landfilled is targeted to be
reduced to 75% of the 1995 level in 2006, 50% in 2009,
and 35% in 2016. According to GHG emissions estimates
derived from MSW management in the EU [5], waste
prevention measures and recycling of biodegradable
municipal waste could result in a reduction in GHG
emissions of approximately 75 Mt-CO2 in 2010 and 60 Mt-
CO2 in 2020 (Fig. 7). The following assumptions were
made in these estimates: the amount of MSW generated
would increase from 520 kg person−1 year−1 in 2004 to
680 kg person−1 year−1 in 2020, and the ratios of
management methods in 2020 would be 34% for landfill,
42% for recycling, and 23% for incineration with power
generation. The emissions associated with the transport,
treatment, and disposal of waste were counted as direct
GHG emissions. Indirect reductions in GHG emissions
were also calculated, including the use of recycled mate-
rials in place of natural resources and the substitution of
power generated from fossil fuels. Better MSW manage-
ment was shown to be effective in reducing GHG
emissions, and the report concluded that introduction of
more effective recycling as well as power generation from
waste would accelerate the reduction of GHG emissions
[5].
Conclusion
The international comparative research on 3R policies
showed that the directions of 3R policies are developed not
only as simple waste management strategies but also as an
approach to obtain synergistic effects with national strate-
gies which aim at landfill prevention, procurement of
resources, and reduction of GHG emissions. In addition,
for circulation use of resources, it was identified that
hazardous waste management is recognized as an impor-
tant issue for consideration.
The first direction is the promotion of 3R policies to
prevent final disposal in landfills, as has been done in the
EU, Japan, and Korea. In these countries, the difficulty in
obtaining final disposal sites has been the driving force for
3R development. In terms of organic waste, however, these
countries have taken different approaches. In Japan,
advanced incineration facilities have been provided at the
national level, and prevention of dioxins emission has been
a strong social issue as well. As a result, dioxin emissions
have been greatly reduced through the use of technology
and the reduction of the amount of organic waste inciner-
ated. In the EU and Korea, however, prevention of final
disposal of organic waste in landfills has been largely
implemented on an administrative level, without sufficient
introduction of appropriate incineration facilities. Com-
posting of organic waste has therefore been a more
important component of their 3R measures. The rate of
incineration is less than 20% in the EU and Korea, even
though thermal recovery has clearly been defined as a
global warming countermeasure in these countries.
In the second direction, the aim of 3R policies is to
secure resources in countries experiencing rapid economic
growth, such as China and Vietnam. In these countries,
hazardous waste management is also an important policy
concern. The utilization of recycled resources has been
effective in these countries because the procurement of
resources has been slow relative to their economic growth.
Because they need resources, these countries have been
active in importing recycled resources, but that has resulted
in the necessity of taking measures to prevent the import of
hazardous materials that are often included in the recycled
resources. Therefore, in these countries, management of
hazardous wastes has been prioritized over other 3R mea-
sures, or even ranked as a higher policy objective. This is
particularly true in China. Although legislation in China
has been developed soundly so far, China may need to
develop greater abilities to manage and implement the
legislation to achieve better outcomes on 3R and hazardous
waste management. Although there is also a legal system
for hazardous waste management in Vietnam, the risk
management of secondary materials carried from abroad
has not been fixed. The development of 3R policies is
inextricably associated with hazardous waste management.
In the third direction, the aim is to develop an integrated
policy centered on 3R to obtain synergetic effects on waste
management, protection of natural resources, and reduction
of GHG emissions. In the USA, landfill issues have been
-150
-100
-50
0
50
100
150
1990 1995 2000 2005 2010 2015 2020
YearMill
ion
to
nn
es C
O2-
eq e
mis
sio
ns
(+)
/ sav
ing
s(-)
-150
-100
-50
0
50
100
150
Mill
ion
to
nn
es C
O2-
eq e
mis
sio
ns
(+)
/ sav
ing
s(-)
Direct - RecyclingDirect - IncinerationDirect - LandfillingDirect - TransportIndirect - RecyclingIndirect - IncinerationIndirect - LandfillingNet GHG emissions
Fig. 7 GHG emissions from MSW management measures in the EU
[5]
100 J Mater Cycles Waste Manag (2011) 13:86–102
123
relatively less urgent as compared to other countries. Even
so, the USA have developed pollution restrictions for land
and groundwater, as seen in the Comprehensive Environ-
mental Response Compensation and Liability Act. The US
policy currently under discussion is intended to bring about
a shift in focus from waste management to an integrated
and synergetic approach. This challenge is revolutionary in
the sense that 3R as a code of conduct on waste manage-
ment is given a higher policy position as part of total
environmental management, although how such a para-
digm shift will be accomplished is still uncertain.
Open Access This article is distributed under the terms of the
Creative Commons Attribution Noncommercial License which per-
mits any noncommercial use, distribution, and reproduction in any
medium, provided the original author(s) and source are credited.
References
1. US EPA (2010) US Environmental Protection Agency 2010–
2014 pollution prevention (P2) program strategic plan. http://
www.epa.gov/p2/pubs/docs/P2StrategicPlan2010-14.pdf. Acces-
sed 10 Feb 2010
2. US EPA (2005) Resource conservation challenge (RCC) 2005
action plan version 1. http://www.epa.gov/epawaste/rcc/resources/
act-plan.pdf. Accessed 10 Feb 2010
3. US EPA (2008) 2009–2014 EPA strategic plan change document,
for public review. http://epa.gov/ocfo/plan/pdfs/strategic_plan_
change_document_9-30-08.pdf. Accessed 10 Feb 2010
4. Directive 2008/98/EC of the European Parliament and of the
Council on Waste and Repealing Certain Directives (2008) 19
November 2008. http://eur-lex.europa.eu/LexUriServ/LexUriServ.
do?uri=OJ:L:2008:312:0003:0003:EN:PDF (En). Accessed 10 Feb
2010
5. Fischer C (2009) EU waste policy: development and achieve-
ments. In: International workshop on 3R and waste management,
Kyoto City, 2009
6. European Environment Agency (2009) Diverting waste from
landfill—effectiveness of waste-management policies in the
European Union. http://www.eea.europa.eu/publications/diverting-
waste-from-landfill-effectiveness-of-waste-management-policies-
in-the-european-union/at_download/file (En).Accessed 10Feb 2010
7. Unterseh TS (2009) Extended producer responsibility—The
German experience. In: International workshop on 3R and waste
management, Kyoto City, 2009
8. Hathaway R (2009) UK policy developments in support of 3R.
In: International workshop on 3R and waste management, Kyoto
City, 2009
9. Douvan AR (2009) Italian approaches on 3R developments. In:
International workshop on 3R and waste management, 2009,
Kyoto City
10. Ministry of the Environment, Japan (2009) White paper on the
environment
11. Ministry of Environment, Japan HP, Enactment and Amendment.
http://eng.me.go.kr/content.do?method=moveContent&menuCode
=law_law_his_amendment (En). Accessed 10 Feb 2010
12. Ministry of Environment (2007) Wastes control act. http://
eng.me.go.kr/file.do?method=fileDownloader&attachSeq=984 (En).
Accessed 10 Feb 2010
13. Ministry of Environment (2008) Act on the promotion of saving
and recycling of resources. http://eng.me.go.kr/file.do?method=
fileDownloader&attachSeq=1608 (En). Accessed 10 Feb 2010
14. Park JW (2009) 3R policies of Korea. Ministry of Environment
HP. http://eng.me.go.kr/board.do?method=view&docSeq=195&
bbsCode=res_mat_policy (En). Accessed 10 Feb 2010
15. Ministry of Environment (2008) Promotion of installation of
waste disposal facilities and assistance, etc. to adjacent areas act.
http://eng.me.go.kr/file.do?method=fileDownloader&attachSeq=
1611 (En). Accessed 10 Feb 2010
16. Ministry of Environment (2008) Korea’s 3R policy. http://search.
korea.net:8080/intro_korea2008/society/02_re.html (En). Acces-
sed 10 Feb 2010
17. Choate A (2008) Landfill analysis overview. In: EPA organics
workshop, 13 May 2008. http://epa.gov/climatechange/wycd/
waste/downloads/Landfill_Briefing_final.pdf. Accessed 10 Feb
2010
18. The Sino-Japan Friendship Centre for Environmental Protection
(2008) The Recycling Economy Promotion Law. http://www.zhb.
gov.cn/japan/CNE/CNE04_78.htm (Jpn). Accessed 15 Feb 2010
19. Li J (2009) Summary policy and legislative tools in promoting
waste management under circular economic model in China. In:
International workshop on 3R and waste management, Kyoto
City, 2009
20. Chen M (2005) End-of-life vehicle recycling in china now and
the future. JOM October 2005. http://www.springerlink.com/
content/58543mn7682747g7/fulltext.pdf?page=1 (En). Accessed
15 Feb 2010
21. Wang Z, Obata N, Zhou W (2007) The current status and prob-
lem of automobile recycling project in China on comparison of a
China-Japan. Seisaku Kagaku 15-1:83–97. http://www.ps.ritsu
mei.ac.jp/assoc/policy_science/151/15107ou.pdf (in Japanese).
Accessed 15 Feb 2010
22. Chi NK (2009) 3R policy development and solid waste man-
agement status in Vietnam. In: International workshop on 3R and
waste management, Kyoto City, 2009
23. 59/2007/ND-CP. http://vea.gov.vn/VN/vanbanphapquy/quyp-
happhapluat/Pages/Nghi˙đi˙nhcủachınhphủso59.aspx (Vn). Accessed
15 Feb 2010
24. 174/2007/NÐ-CP. http://vea.gov.vn/VN/vanbanphapquy/quyp-
happhapluat/Pages/Nghi˙đi˙nh1742007củachınhphủvephıBVMTđ
oivớiCTR.aspx (Vn). Accessed 15 Feb 2010
25. 43/2007/QÐ-BYT. http://vea.gov.vn/VN/vanbanphapquy/quyp-
happhapluat/Pages/Quyetđi˙nhcủabo
˙ˆtrưởngbo
˙ˆyteso43.aspx (Vn).
Accessed 15 Feb 2010
26. 23/2006/QÐ-BTNMT. http://vea.gov.vn/VN/vanbanphapquy/
quyphapphapluat/Pages/Quyetđi˙nh.aspx. Accessed 15 Feb 2010
27. Vietnam Government (2009) National strategy on integrated
SWM to 2025 and vision to 2050 Vietnam (2149/QD-TTg). http://
vea.gov.vn/VN/vanbanphapquy/Pages/ChienlượcQuocgiave-quảnlytổnghợpchatthảiranđennam2025,tamnhınđennam2050.
aspx (Vn). Accessed 15 Feb 2010
28. Vietnam Environment Administration HP. http://vea.gov.vn/
VN/Pages/trangchu.aspx (Vn). Accessed 15 Feb 2010
29. The Sino-Japan Friendship Centre for Environmental Protection
(2005) Law of the People’s Republic of China on the Prevention
and Control of Environmental Pollution by Solid Waste. http://www.
zhb.gov.cn/japan/CNE/CNE04_14.htm (Jpn). Accessed 15 Feb 2010
30. Wejchert J (2009) EU policies on the sustainable management of
resources. In: International workshop on 3R and waste manage-
ment, Kyoto City, 2009
31. Oh GJ (2009) 3R and waste management policy and outcome in
Korea. In: International workshop on 3R and waste management,
Kyoto City, 2009
32. US EPA (2006) 2006–2011 EPA strategic plan. http://www.
epa.gov/ocfo/plan/2006/entire_report.pdf. Accessed 10 Feb 2010
J Mater Cycles Waste Manag (2011) 13:86–102 101
123
33. US EPA (2004) Resource conservation challenge strategic plan—
what can you save tomorrow? Five year plan. http://www.epa.
gov/osw/rcc/resources/strat-plan.pdf. Accessed 10 Feb 2010
34. Yoshida H (2009) Japan’s experiences of policy developments on
3R and waste management. In: International workshop on 3R and
waste management, Kyoto City, 2009
35. Ministry of Environment (2007) Resource recirculation policy of
Korea. http://search.korea.net:8080/intro_korea2008/society/02_re.
html (En). Accessed 10 Feb 2010
36. US EPA (2008) MSW characterization methodology, municipal
solid waste (MSW) in the United States. US EPA HP. http://
www.epa.gov/epawaste/nonhaz/municipal/pubs/06numbers.pdf.
Accessed 10 Feb 2010
37. Ministry of the Environment (2009) Basic plan for establishing a
Material Cycles Society (2008 version)
38. US EPA (2009) Municipal solid waste generation, recycling, and
disposal in the United States: facts and figures for 2008, muni-
cipal solid waste (MSW) in the United States. US EPA HP.
http://www.epa.gov/waste/nonhaz/municipal/pubs/msw2008rpt.
pdf. Accessed 10 Feb 2010
39. Ministry of Environment (2009) 2008 Waste generation and
treatment. http://library.me.go.kr/dliwebme/components/searchir/
detail/popup.aspx?cid=199849 (Ko). Accessed 15 Feb 2010
40. US EPA (2009) Municipal solid waste generation, recycling, and
disposal in the United States: detailed tables and figures for 2008,
municipal solid waste (MSW) in the United States. US EPA HP.
http://www.epa.gov/waste/nonhaz/municipal/pubs/msw2008data.
pdf. Accessed 10 Feb 2010
41. European Commission (2009) Eurostat, Municipal waste by type
of treatment. http://epp.eurostat.ec.europa.eu/portal/page/portal/
product_details/dataset?p_product_code=TSIEN130. Accessed
20 Mar 2010
42. Ministry of the Environment Japan (2009) Field survey on
municipal waste management
43. Ministry of the Environment, Korea (2009) 2009 Environmental
statistics yearbook. http://library.me.go.kr/dliwebme/components/
searchir/detail/popup.aspx?cid=198771 (Ko, En). Accessed 15
Feb 2010
44. European Commission (2009) Eurostat Data Centre onwaste. http://
epp.eurostat.ec.europa.eu/portal/page/portal/waste/documents/
Packaging_2009_11_26_publication.xls; http://ec.europa.eu/
environment/waste/packaging/data.htm. Accessed 20Mar 2010
45. Department of Resources Recycling and Recovery (2010) Cal-
Recycle. http://www.calrecycle.ca.gov/. Accessed 10 Feb 2010
46. Ministry of the Environment (2008) Summary of field survey on
use and emission of containers and packaging waste. http://www.
env.go.jp/recycle/yoki/c_2_research/research_03.html. Accessed
10 Feb 2010
47. EEA (2010) CSI 017—generation and recycling of packaging
waste—assessment. http://themes.eea.europa.eu/IMS/IMS/ISpecs/
ISpecification20041007131825/IAssessment1234521865625/view_
content. Accessed 20 Mar 2010
48. Sakai S, Ota S, Kondo Y (2009) Unintentional POPs inventories
in East Asian countries. In: 3rd workshop on reduction of unin-
tentional POPs in East Asian countries, 1st–2nd October 2009
49. Quass U, Fermann M, Broker G (2000) EU dioxin emission
inventory stage II, vol 1
50. Quass U, Fermann M, Broker G (2000) EU dioxin emission
inventory stage II, vol 3
51. DEFRA (2007) United Kingdom of Great Britain and Northern
Ireland, National Implementation Plan for the Stockholm Con-
vention on Persistent Organic Pollutants. http://www.pops.int/
documents/implementation/nips/submissions/UKNational%20
Implementation%20Plan_Defra_UKNIP_V5.pdf. Accessed 20
Mar 2010
52. US EPA (2006) An inventory of sources and environmental
releases of dioxin-like compounds in the US for the years 1987,
1995, and 2000 (EPA/600/P-03/002f, final report, November
2006)
53. Ministry of the Environment (2008) Waste treatment in Japan
(fiscal year 2006)
54. Ministry of the Environment (2008) Emission inventories of
dioxins
55. Population Division of the Department of Economic and Social
Affairs of the United Nations Secretariat (2010) World popula-
tion prospects: the 2008 revision. http://esa.un.org/unpp.
Accessed 23 Feb 2010
56. Sakai S (2000) Material cycles science concept. Environ Sci
Pollut Res 7(4):225–232
57. Peeler MV (2009) Reducing toxic threats and waste management
control. In: International workshop on 3R and waste manage-
ment, Kyoto City, 2009
58. Hylander LD (2009) Swedish approaches on 3R developments.
In: International workshop on 3R and waste management, Kyoto
City, 2009
59. European Commission Directorate-General Environment (2002)
Study on hazardous household waste (HHW) with a main
emphasis on hazardous household chemicals (HHC)–final report,
WRc: CO 5089-2 (2002)
60. Asari M (2009) Perspectives on household hazardous waste
management. In: International workshop on 3R and waste man-
agement, Kyoto City, 2009
61. Central Environmental Council, Division of Recycling-Based
Society Planning (50th) (2009) Concept arrangement of gener-
ating control and result of estimate on the effect by cyclic use
62. US EPA (2003) Wastewise: climate benefits from reducing waste
(program snapshot). http://www.epa.gov/waste/nonhaz/municipal/
pubs/ghg/clim-ww.pdf
102 J Mater Cycles Waste Manag (2011) 13:86–102
123