Embed Size (px)
Citation preview
Ž .Energy Economics 21 1999 273]293
International comparisons of productivityand its determinants in the natural gas
industry
Tai-Yoo Kima, Jeong-Dong Leea,U, Yearn H. Parkb,Boyoung Kimb
aTechno-Economics and Policy Program, Seoul National Uni ersity, San 56-1, Shinrim-Dong,Kwanak-Gu, Seoul 151-742, South Korea
bEconomic and Managerial Research Di ision, Korea Gas Corporation, 215 Jeongja-Dong,Pundang-Gu, Seongnam, Kyunggi 463-010, South Korea
Abstract
The objective of this paper was to evaluate the performance of the natural gas industryusing an inter-country comparison of productivity level and its determinants. Three method-ologies: multilateral Tornqvist productivity analysis; managerial index system analysis; and¨non-parametric efficiency analysis, are employed to make a methodological cross-checkingand to perform diversified analysis. From the empirical results, we identified the level andgrowth rate of productivity of individual firms. The results also indicated that the Koreangas industry has shown a relatively low level of productivity. From the results of managerialperformance index analysis, we found that during the recent years of regulatory changes, thefinal price of gas has decreased dramatically while the productivity growth has not beenenough to offset the effect of decreased output price, which has resulted in decreased profit.We also examine the extent of the allocative, scale, and managerial efficiency as sourcecomponents of the overall efficiency based on the performance of best-practiced. With theresults of this study, an effective policy measure could be established to improve theproductivity and the overall managerial performance in the natural gas industry. Q 1999Elsevier Science B.V. All rights reserved.
JEL classification: Q43
Keywords: Productivity; International comparison; Natural gas industry
U Corresponding author. Tel.: q82-2-873-7229; fax: q82-2-880-8389; e-mail: [email protected]
0140-9883r99r$ - see front matter Q 1999 Elsevier Science B.V. All rights reserved.Ž .PII: S 0 1 4 0 - 9 8 8 3 9 9 0 0 0 0 7 - 9
( )T.-Y. Kim et al. r Energy Economics 21 1999 273]293274
1. Introduction
Considerable economic deregulations and other reforms in public utilities haveoccurred, especially since the early 1980s. The motivation behind these regulatorychanges comes from the consensus that productivity advancement in public utilitiesis an important contributing factor to economic growth. The natural gas industrypresents an excellent case of regulatory reform. For example, in the US the naturalgas market place has been opened up to competition since the latter half of the
Ž .1980s. In the UK the monopoly public enterprise, British Gas BG was privatizedin the mid-1980s. In addition, regulatory changes have been under consideration inother countries in Europe and Asia including Korea.1 It should be realised that notonly is the productivity enhancement the target for public policy, but has importantimplications for managers in companies to gain a productive edge in an uncertainenvironment for utility management. But, for productivity growth, an individualfirm cannot earn a long-run economic profit to survive in the market. Thus,productivity analysis is the starting point in a comprehensive policy prescriptionand management strategy to guarantee the company’s existence and to sustain itsgrowth.
The main purpose of this paper is the international comparison of the productiv-ity and efficiency of natural gas transmission and distribution companies.2 Therehave been several studies concerning the productivity analysis in the natural gas
Ž . Žindustry within one country; for example, Aivazian et al. 1987 transmission. Ž . Žcompanies in the US , Price and Weyman-Jones 1996 distribution companies in
. Ž . Ž . Ž .the UK , Rushdi 1994 gas utility in Australia , and Kim and Lee 1995Ž .distribution companies in Korea . Meanwhile, there are very few studies whichcompare performance of natural gas companies across countries so far. Consider-ing the international nature of the current interest in regulatory reforms andstructural changes, it would be vital to make an international performance compar-ison.3
In this study, we analyze the performance of 28 firms operating in eightcountries. In general, the firms which are mainly engaged in the transmission of
Ž .natural gas transmission companies are greatly different from those which are
1For the review of recent regulatory reforms and their motivations in the natural gas industry, seeŽ . Ž . Ž .Foster 1992 , Amstrong et al. 1994 , Price and Weyman-Jones 1996 , and American Gas Association
Ž .1996 .2 The productivity of a production unit measures the ratio of its output to its input. Thereby, the mainfocus lies in the inter-company differences of cross-sectional data or productivity growth of time seriesdata. Meanwhile, the efficiency of a production unit refers to the comparison between observed andoptimal values of its input and output combination. The optimum is defined in terms of productionpossibilities or the behavioral goals of the production unit. Even though there are vast differences indefinitions and measuring techniques, the two concepts share a common goal in representing a firm’sperformance. In this paper, we use the productivity and efficiency interchangeably. The ‘efficiency’ willbe used, however, instead of ‘productivity’ in non-parametric methodology according to the tradition.3 Ž .For examples of inter-country productivity comparisons in other industries, see Encaoua 1991 ,
Ž . Ž .Thompson et al. 1994 and Yunos and Hawdon 1997 .

( )T.-Y. Kim et al. r Energy Economics 21 1999 273]293 275
Ž .engaged in the distribution as well as transmission integrated companies in termsof the input level, average cost, unit revenue, etc. Thus, under the assumption thatthe major technological difference comes from the difference in the coverage ofoperation, we divide the whole sample into two distinctive sub-groups; one repre-senting the transmission companies, and the other representing the integratedcompanies to maintain the technological homogeneity,
Despite a simple definition of productivity, there could be wide variations in theresulting estimates depending on the methodologies employed. This can be aparticularly acute problem when we use the productivity measure as a yardstick toestablish industrial policy andror management strategy. Thus, to get a robust andreliable measure of productivity regardless of the methodological differences it is
Žlegitimate to rest on extensive methodological cross-checking Charnes et al., 1988;.Perelman, 1995 . In this study, we adopt three distinctive approaches; multilateral
Tornqvist productivity analysis, managerial index system analysis, and non-para-¨metric efficiency analysis, to provide an overall picture of productivity of naturalgas industry and to verify the robustness of the resulting estimates of productivitylevel.
Multilateral Tornqvist productivity index has been widely applied in various¨fields to analyze the productivity level of panel observations consisting of time-seriesand cross-sectional data. In addition to the empirical tractability, multilateralTornqvist productivity index retains theoretical consistency as proved by Caves et¨
Ž .al. 1982 . The results of Multilateral Tornqvist productivity analysis will serve as a¨guideline for other productivity analysis. The second methodology is the multilat-eral Edgeworth managerial index system developed in this study. While themultilateral Tornqvist productivity index focuses on the productivity itself, this¨managerial index system considers the profit, input and output price as well asproductivity, to describe the overall managerial performance. The non-parametricapproach is employed to measure the efficiency of each firm based on theperformance of best-practiced firms. The best-practiced firms are identified by thesolution of non-parametric linear programming. In this method we analyze thescale efficiency and allocative efficiency as well as the technical efficiency. Thenon-parametric approach has been frequently employed to analyze the perfor-mance of public entities in recent years.
Each methodology has its own theoretical foundation and tradition. Even so,they provide the same information about the productivity level, so that methodo-logical cross-checking can be made among them.
To save space, in this paper we provide the summary results focusing on theŽ .policy implications. Specifically, the following themes are the main subjects: i
Ž .productivity level and its growth rate of natural gas companies; ii the effect ofderegulation and restructuring on performance change in the average natural gas
Ž .companies; iii the extent of efficiency based on the performance of best-practicedŽ .firms; and iv methodological cross-checking between the results of productivity
and efficiency analysis. While the interpretations of the results focus on theKorean gas industry, the same logic can be applied to other companies.
The paper is divided into four further sections. In Section 2, we briefly present

( )T.-Y. Kim et al. r Energy Economics 21 1999 273]293276
some characteristic features of three methodologies adopted in this study, we alsodescribe the theoretical foundations, empirical procedure for implementation ofthe models, and expected implications we can draw from the results. Section 3 isdevoted to representing the definitions of data and their sources. Section 4presents a summary of the primary results, and Section 5 provides policy implica-tions followed by concluding remarks.
2. Models for productivity analysis
2.1. Multilateral Tornq¨ist producti ity index¨
The calculation of productivity index starts with definitions of reasonable aggre-gated input and aggregated output quantity index. The productivity index of anindividual firm is defined as the ratio of output to input quantity index. Therefore,a higher productivity index implies that more output can be obtained with a giveninput or less input is required to produce a given output. The characteristic featurein this productivity index lies in the fact that it need not pre-suppose a functionalform or any statistical assumptions, which implies empirical tractability.
The productivity measurement based on the input and output index is clear in itsconcept and convenient in empirical implementation. Thus, it has been widely usedin various fields from national accounting to plant level management. Examples ofproductivity index analysis in the natural gas industry can be found in RushdiŽ .1994 . While the above simple definition of productivity index has been applied
Ž .mainly to time-series or cross-sectional data only, Caves et al. 1982 extended thesimple productivity index into the case of multilateral comparison, especially forpanel data analysis consisting of time-series and cross-section data, which has beencalled the multilateral Tornqvist productivity index. Multilateral Tornqvist produc-¨ ¨tivity index can be said to be theoretically superior to other productivity indexes inthe sense that it is exact to the flexible second-order approximation of productionfunctions. It also retains a higher degree of characteristics than any other multilat-
Ž .eral index Caves et al., 1982; Diewert, 1992 .This study applies the multilateral Tornqvist productivity index to an internatio-¨
nal panel of data of natural gas companies. It should be noted that the productivitydifferential obtained from this Tornqvist productivity index comparison can be¨accrued from numerous factors, while the methodology itself does not provide anyinformation about the exact contribution of potential sources. However, the resultsfrom this multilateral Tornqvist productivity index can serve at least as a basis to¨compare the productivity levels among other methodologies.
The mathematical equation of multilateral Tornqvist productivity index is pre-¨sented in Appendix A.
2.2. Managerial index system
Let us turn to another issue of evaluating the overall managerial performance.
( )T.-Y. Kim et al. r Energy Economics 21 1999 273]293 277
Even if a firm has a physical productivity advantage compared to other firms, itdoes not guarantee that the firm will earn an economic profit.4 This is particularlytrue when the firm faces a relatively low output price andror high input price. Inthe long-run, the firm without a long-run economic profit cannot survive in thecompetitive market. Thus, to appraise the overall managerial performance, a newframework incorporating profit, input and output price as well as the productivity,is needed, which will be known as the managerial index system hereinafter. In thisstudy, for inter-company comparisons in the natural gas industry, this managerialperformance system expresses the profit differences as the sum of productivity
Ž .difference, input price difference, and output natural gas price difference, asfollows;
Ž .DProfit s DProductivity q DOutput Price y DInput Price
Ž . Ž .Important studies have been done by Kurosawa 1991 and Banker et al. 1996concerning the managerial performance system. They analyzed the managerialperformance of the Japanese wood industry and the US telecommunication indus-try, respectively.
For international comparisons between the natural gas companies, we developeda multilateral Edgeworth managerial index system which permits us to overcometwo major shortcomings of previous studies: first, while most of the existingmanagerial index studies adopted the ratio form, the Edgeworth index systemdeveloped in this study expresses the inter-company difference in absolute termsŽ .million US dollars . The absolute representation allows the decision makers tounderstand the comparative advantage and disadvantage more intuitively. Second,the developed system can be applied to panel data analysis, which facilitates
Ž .so-called multilateral comparison in terms of Caves et al. 1982 .From the results of the multilateral Edgeworth managerial index system, it is
expected to be able to evaluate how the natural gas industry has responded to thechanging environment caused by regulatory reforms in a recent decade. Openingup the monopolized market to competition, for example, generally brings aboutprice decreases. If firms are not to respond to this state of affairs by improving theproductivity andror by reducing the input price, the profit margin will narrowdown along with the output price decreases.
The mathematical equations of the multilateral Edgeworth managerial indexsystem are presented in Appendix B.
2.3. Non-parametric approach
A non-parametric approach uses a mathematical programming technique toestimate the efficient frontier and to identify the performance of best-practicedfirm. The efficiency of an individual firm is measured by comparing the firm’s
4 Economic profit means the level of profit enough to compensate the manager’s incentive and toreinvest for future production.
( )T.-Y. Kim et al. r Energy Economics 21 1999 273]293278
observed performance with that of a best-practiced firm. The estimated productionrelationship constitutes an extreme frontier in that it contrasts with the traditionaleconometric approach which estimates an average production function. Further-more, the individual efficiency indicator is calculated for each firm in this non-parametric approach, while a single average performance indicator among industryis obtained in a traditional econometric approach. The non-parametric approachhas been widely applied since the 1980s to the efficiency analysis of public utilities;
Ž . Ž .for example, see Fare et al. 1990 , Golany et al. 1994 , Taylor and Thompson¨Ž . Ž .1995 , and Lee and Kim 1997 .
Several definitions of efficiency have been suggested in the existing literature.5
Ž .In this study for the natural gas industry, we focus on the overall efficiency OE ,Ž . Ž . Ž .allocative efficiency AE , technical efficiency TE , scale efficiency SE , andŽ .managerial efficiency ME . The relationship among them can be summarized in
the following equation.
Ž .OE s AE = TE s AE = SE = ME
From the above equation, it is evident that the overall efficiency can bedecomposed into allocative and technical efficiency, and further the technicalefficiency can be broken down into scale and managerial efficiency. Therefore, theultimate components of overall efficiency are allocative, scale, and the remainingmanagerial efficiency. Unlike other non-parametric applications which have con-centrated on the technical efficiency only, this study analyzes the allocativeefficiency which requires the input price information. Technical efficiency andallocative efficiency are different from each other in that the former focuses on thephysical side, while the latter highlights the non-physical side of overall efficiency.
Allocative inefficiency measures the extent of the deviation of the observedinput mix from the optimal mix. The potential sources of allocative inefficienciesinclude the requirement of large capital investment, time lag to turn the investedcapital into a productive one, the existence of external regulation probably tocreate bias in input mix,6 and early stages of project with a large portion ofundepreciated capital, etc. As the case of other capital intensive industry, thenatural gas industry possesses the possibility of allocative inefficiency due to itscapital intensive characteristics.
Scale efficiency measures the extent of deviation of existing scale of operationŽ .from the most productive scale size MPSS . Managerial efficiency refers to the
residual efficiency in technical efficiency after considering the scale efficiency. Thedeterminants of managerial inefficiency ranges from operational inefficiency at theshop floor to environmental conditions exogenously given to the company.
5For mathematical representations and implications of different types of efficiencies, see Fare et al.¨Ž .1994 .6 Ž .The Averch]Johnson effect associated with the rate-of-return ROR regulation can be referred to asa typical example of allocative inefficiency.
( )T.-Y. Kim et al. r Energy Economics 21 1999 273]293 279
The mathematical equations to calculate efficiencies with non-parametric linearprogramming formulations are presented in Appendix C.
3. Data
The data for this inter-company comparison comprises information on a sampleof 28 natural gas companies operating in eight countries. There are nine transmis-sion companies and 19 integrated companies, respectively. We provide the name ofthe company and country as well as their corresponding indexes that will be usedthroughout the ensuing sections in Appendix D. In the case of Korea, there is onemonopoly public enterprise in the transmission sector, Kogas, and 26 privatedistributors which are regional monopolies.7 Considering these structural charac-teristics, we assume Korea Gas System as a hypothetical integrated companyoperating in Korea whose data are made of information about Kogas and distribu-tors, and include it in the sample of integrated companies. The sample period inthis study extends from 1987 to 1995.8
We assume that the natural gas industry uses three inputs } labor, capital andadministration } to transport natural gas to customers.9 Output is defined as the
Ž 9 .total volume of supplied gas measured by thermal unit 10 kcal . The revenue isrestricted to the one accrued from the gas transportation only.
Labor input is indispensable in the process of natural gas transportation. Thus,we consider labor as one of the input factors, although the labor cost share isrelatively small. We measure the labor input as an average full-time equivalent ofemployee numbers, and labor cost as the sum of total salary and wages in incomestatement. Labor price is derived by dividing the labor cost by the number ofemployees.
The natural gas industry has been classified as capital intensive because therehas to be a lot of capital invested in pipeline network and other physical facilities.Capital stock and the value of capital services are by far the most difficult toestimate. The conventional methodology for measuring the level of capital stockutilizes the perpetual inventory method based on the yearly investment series.While this approach seems to have theoretical consistency, practical implementa-tion requires assumptions which often contradict accounting practices.10 In thisstudy, the tangible assets reported in the balance sheet are employed as proxy tocapital stock, considering the data availability and comparability. Capital service isassumed to be proportional to the capital stock. Capital cost is defined as sum of
7Kogas started its business in 1987, while some distributors started their businesses in the early 1970s.8All the information concerning the variables defined above were obtained from each organization’sfinancial and operating statistics. The complied data is obtainable from the authors for any academicpurposes.9 We assume that the three methodologies use the same input and output variables.10 Ž .See Morrison 1993 for more detailed discussion on the measurement of capital stock.
( )T.-Y. Kim et al. r Energy Economics 21 1999 273]293280
expenditures needed to acquire and maintain the existing capital. Capital price iscalculated as the ratio of capital cost to capital service.
The natural gas industry needs a large amount of cost associated with operationand administration which is required in customer maintenance, monitoring, billing,network planning and operating, etc. These items are indispensable in networkindustries, such as electricity transmission and distribution, truck, air carrier, andso forth. Therefore, we include the administration input as one of input factors.11
Since administration does not have any physical unit, we have to devise separateprocedures to derive proxy to represent the level of administration input. The
Ž .procedure adopted in this study is as follows: 1 the residual administration cost isŽ .obtained by subtracting labor and capital cost from total cost; 2 the administra-
Ž .tion cost is regressed against the level of pipeline length and number of labor; 3Ž .using the inverse function, unit administration cost is calculated; and 4 the
administration input is obtained by dividing the total administration cost by unitcost. The rationale behind this approach can be found from the observation that
Žthe administration in the natural gas industry is generally related to labor over-. Ž .head costs and physical network maintenance costs .
To make inter-country comparisons meaningful, all of the cost items are con-Ž .verted into 1991 US constant dollars using the purchasing power parity PPP
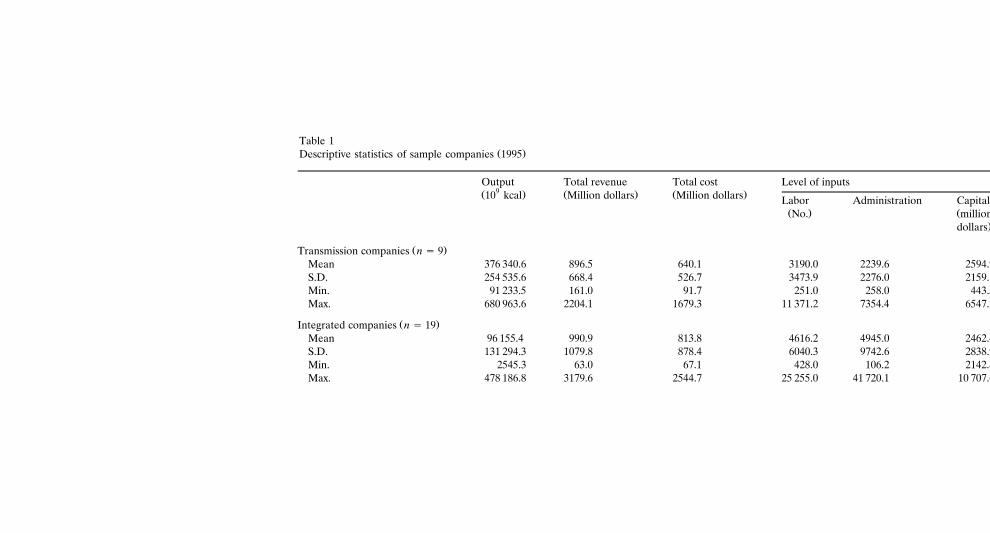
Ž .published in Penn World Trade Mark 5.6 1994.1.20 .The descriptive statistics for two groups; transmission and integrated companies
Ž .group, are presented in Table 1, focusing on the end of sample period 1995 .
4. Empirical results
4.1. Multilateral Tornq¨ist producti ity index comparison¨
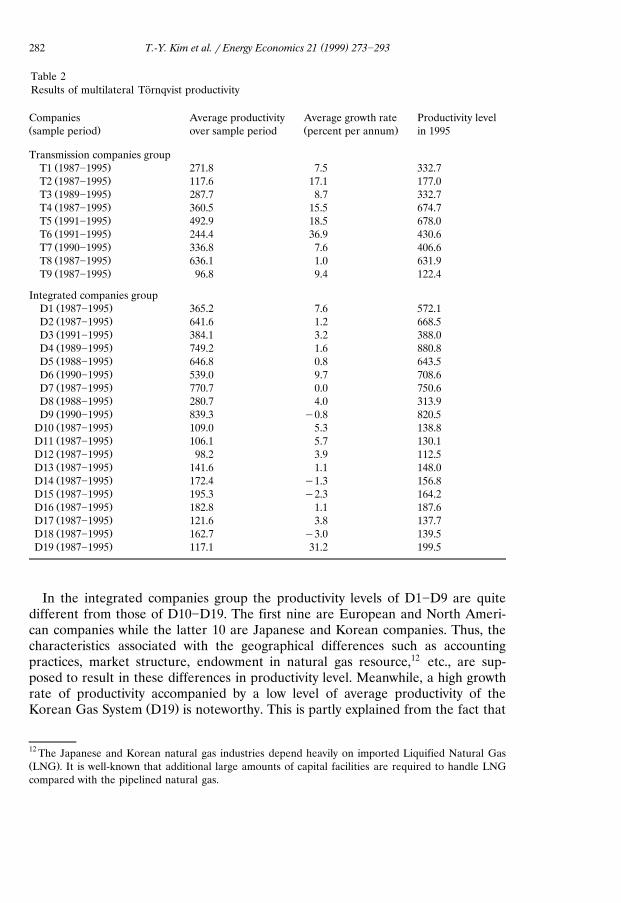
The analysis of multilateral Tornqvist productivity comparison is performed on¨each group separately. Unbalanced panel data are utilized with a total of 68observations in the transmission group and 158 observations in the integratedgroup. Note that the productivity level of Kogas and the Korea Gas System are setto be 100 for normalization. Table 2 provides the summary results for eachcompany.
Ž . Ž .From Table 2, we know that Ruhrgas T8 and Transwestern Pipeline Co. T5 inthe transmission companies group have the highest level of average productivity.
Ž .At the same time, Western Gas Resources T6 provides the highest growth rateover the sample period. The notable features that can be found in these highly
Ž .productive companies are a high level of output per unit pipeline distance for T8 ,decreasing capital stock attributable to continuing rationalization of physical facili-
Ž . Ž .ties for T5 , phenomenal growth rate of gas output for T6 , etc.
11 Ž .For example, in Banker et al. 1996 , the inputs accrued from selling, general, and administrationŽ .SG & A are separated as one of the independent variable inputs in the telecommunication industry.
()
T.-Y
.Kim
etal.rE
nergyE
conomics
211999
273]293
281
Table 1Ž .Descriptive statistics of sample companies 1995
Output Total revenue Total cost Level of inputs9Ž . Ž . Ž .10 kcal Million dollars Million dollars Labor Administration Capital
Ž . ŽNo. million.dollars
Ž .Transmission companies n s 9Mean 376 340.6 896.5 640.1 3190.0 2239.6 2594.9S.D. 254 535.6 668.4 526.7 3473.9 2276.0 2159.1Min. 91 233.5 161.0 91.7 251.0 258.0 443.5Max. 680 963.6 2204.1 1679.3 11 371.2 7354.4 6547.2
Ž .Integrated companies n s 19Mean 96 155.4 990.9 813.8 4616.2 4945.0 2462.4S.D. 131 294.3 1079.8 878.4 6040.3 9742.6 2838.9Min. 2545.3 63.0 67.1 428.0 106.2 2142.8Max. 478 186.8 3179.6 2544.7 25 255.0 41 720.1 10 707.6
( )T.-Y. Kim et al. r Energy Economics 21 1999 273]293282
Table 2Results of multilateral Tornqvist productivity¨
Companies Average productivity Average growth rate Productivity levelŽ . Ž .sample period over sample period percent per annum in 1995
Transmission companies groupŽ .T1 1987]1995 271.8 7.5 332.7Ž .T2 1987]1995 117.6 17.1 177.0Ž .T3 1989]1995 287.7 8.7 332.7Ž .T4 1987]1995 360.5 15.5 674.7Ž .T5 1991]1995 492.9 18.5 678.0Ž .T6 1991]1995 244.4 36.9 430.6Ž .T7 1990]1995 336.8 7.6 406.6Ž .T8 1987]1995 636.1 1.0 631.9Ž .T9 1987]1995 96.8 9.4 122.4
Integrated companies groupŽ .D1 1987]1995 365.2 7.6 572.1Ž .D2 1987]1995 641.6 1.2 668.5Ž .D3 1991]1995 384.1 3.2 388.0Ž .D4 1989]1995 749.2 1.6 880.8Ž .D5 1988]1995 646.8 0.8 643.5Ž .D6 1990]1995 539.0 9.7 708.6Ž .D7 1987]1995 770.7 0.0 750.6Ž .D8 1988]1995 280.7 4.0 313.9Ž .D9 1990]1995 839.3 y0.8 820.5Ž .D10 1987]1995 109.0 5.3 138.8Ž .D11 1987]1995 106.1 5.7 130.1Ž .D12 1987]1995 98.2 3.9 112.5Ž .D13 1987]1995 141.6 1.1 148.0Ž .D14 1987]1995 172.4 y1.3 156.8Ž .D15 1987]1995 195.3 y2.3 164.2Ž .D16 1987]1995 182.8 1.1 187.6Ž .D17 1987]1995 121.6 3.8 137.7Ž .D18 1987]1995 162.7 y3.0 139.5Ž .D19 1987]1995 117.1 31.2 199.5
In the integrated companies group the productivity levels of D1]D9 are quitedifferent from those of D10]D19. The first nine are European and North Ameri-can companies while the latter 10 are Japanese and Korean companies. Thus, thecharacteristics associated with the geographical differences such as accountingpractices, market structure, endowment in natural gas resource,12 etc., are sup-posed to result in these differences in productivity level. Meanwhile, a high growthrate of productivity accompanied by a low level of average productivity of the
Ž .Korean Gas System D19 is noteworthy. This is partly explained from the fact that
12 The Japanese and Korean natural gas industries depend heavily on imported Liquified Natural GasŽ .LNG . It is well-known that additional large amounts of capital facilities are required to handle LNGcompared with the pipelined natural gas.
( )T.-Y. Kim et al. r Energy Economics 21 1999 273]293 283
there remains lots of undepreciated capital due to the early history of the industryand that the growth rate of gas demand is high due to governmental support fordemand promotion. The high productivity level combined with low productivity
Ž .growth in Snam D9 results from the fact that during the study period its outputgrowth has been stagnated although it has higher level of gas output than any othercompanies.
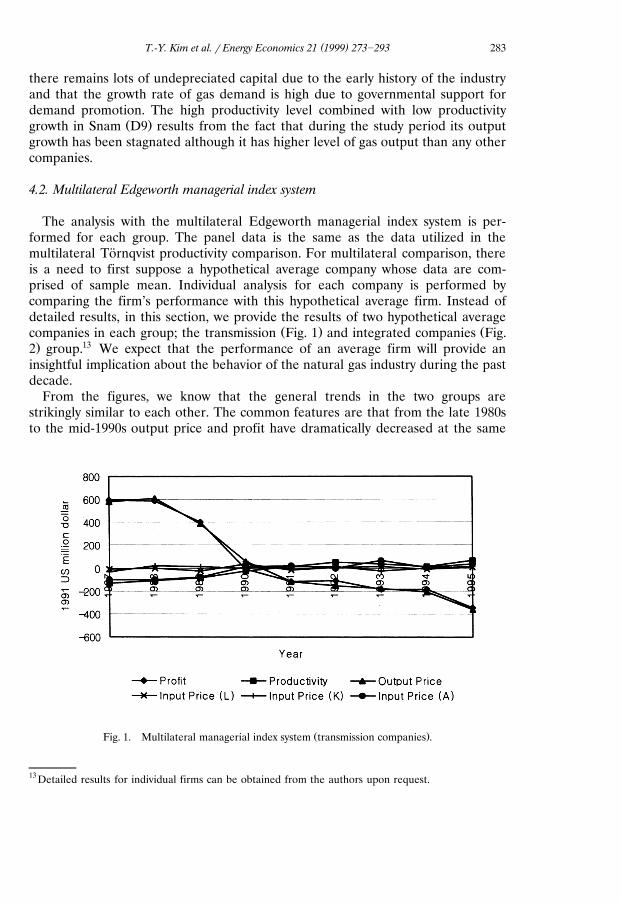
4.2. Multilateral Edgeworth managerial index system
The analysis with the multilateral Edgeworth managerial index system is per-formed for each group. The panel data is the same as the data utilized in themultilateral Tornqvist productivity comparison. For multilateral comparison, there¨is a need to first suppose a hypothetical average company whose data are com-prised of sample mean. Individual analysis for each company is performed bycomparing the firm’s performance with this hypothetical average firm. Instead ofdetailed results, in this section, we provide the results of two hypothetical average
Ž . Žcompanies in each group; the transmission Fig. 1 and integrated companies Fig.. 132 group. We expect that the performance of an average firm will provide an
insightful implication about the behavior of the natural gas industry during the pastdecade.
From the figures, we know that the general trends in the two groups arestrikingly similar to each other. The common features are that from the late 1980sto the mid-1990s output price and profit have dramatically decreased at the same
Ž .Fig. 1. Multilateral managerial index system transmission companies .
13 Detailed results for individual firms can be obtained from the authors upon request.

( )T.-Y. Kim et al. r Energy Economics 21 1999 273]293284
Ž .Fig. 2. Multilateral managerial index system integrated companies .
time. Meanwhile the input price does not have a particular time trend andproductivity has not grown significantly. The above results dramatize the responseof average natural gas companies to the deregulation over the last decade whichcan be characterized by various kinds of regulatory reforms. Under negligiblevariations of input prices, the regulatory changes toward more competition haveresulted in a decrease of output price, while the productivity growth has not beennoticeable enough to offset the reduction in output price. Therefore, the substan-tial decreases in profit would be a natural outcome.
The above observations seem to be consistent with several existing studies whichŽreported the decreases in price and profit during this period American Gas
.Association, 1996 . However, it seems to be contradictory to some studies whoseresults indicated that the productivity improved significantly.14 In fact, however,there is no contradiction between the present results and previous reports aboutthe productivity growth. This study suggests that even though productivity hasimproved, but its absolute size has been too small to offset the output pricereduction and to sustain the profit margin.
4.3. Non-parametric efficiency comparison
Non-parametric efficiency analyses were performed separately to the panel dataof nine transmission and 19 integrated companies. To obtain a balanced panel, we
14 Ž .Price and Weyman-Jones 1996 reports a substantial productivity growth in the British natural gasŽ .industry after privatization in the mid-1980s. The American Gas Association 1996 also indicated that
regulatory reform and opening up the market in the US stimulated productivity improvement.
( )T.-Y. Kim et al. r Energy Economics 21 1999 273]293 285
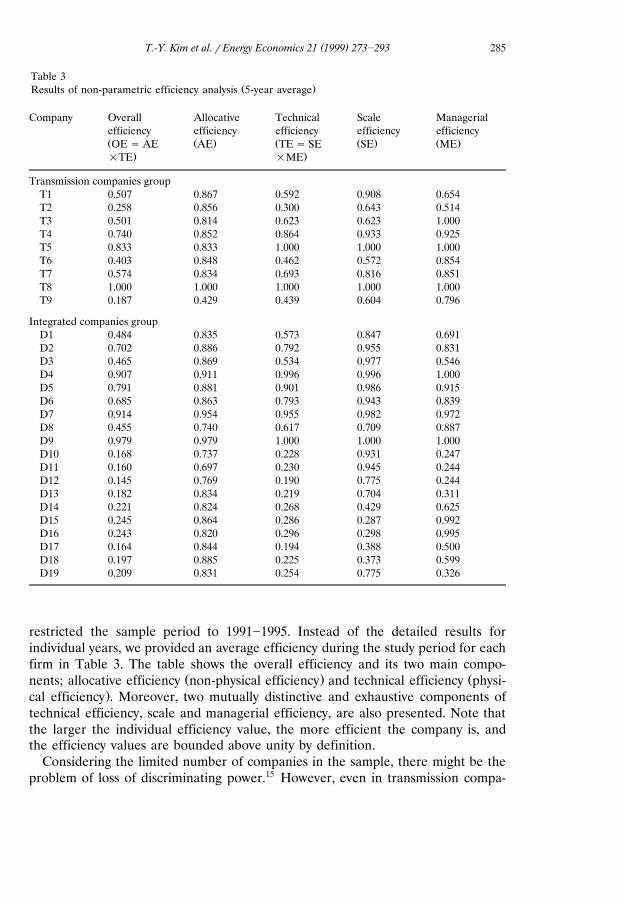
Table 3Ž .Results of non-parametric efficiency analysis 5-year average
Company Overall Allocative Technical Scale Managerialefficiency efficiency efficiency efficiency efficiencyŽ Ž . Ž Ž . Ž .OE s AE AE TE s SE SE ME
. .=TE =ME
Transmission companies groupT1 0.507 0.867 0.592 0.908 0.654T2 0.258 0.856 0.300 0.643 0.514T3 0.501 0.814 0.623 0.623 1.000T4 0.740 0.852 0.864 0.933 0.925T5 0.833 0.833 1.000 1.000 1.000T6 0.403 0.848 0.462 0.572 0.854T7 0.574 0.834 0.693 0.816 0.851T8 1.000 1.000 1.000 1.000 1.000T9 0.187 0.429 0.439 0.604 0.796
Integrated companies groupD1 0.484 0.835 0.573 0.847 0.691D2 0.702 0.886 0.792 0.955 0.831D3 0.465 0.869 0.534 0.977 0.546D4 0.907 0.911 0.996 0.996 1.000D5 0.791 0.881 0.901 0.986 0.915D6 0.685 0.863 0.793 0.943 0.839D7 0.914 0.954 0.955 0.982 0.972D8 0.455 0.740 0.617 0.709 0.887D9 0.979 0.979 1.000 1.000 1.000D10 0.168 0.737 0.228 0.931 0.247D11 0.160 0.697 0.230 0.945 0.244D12 0.145 0.769 0.190 0.775 0.244D13 0.182 0.834 0.219 0.704 0.311D14 0.221 0.824 0.268 0.429 0.625D15 0.245 0.864 0.286 0.287 0.992D16 0.243 0.820 0.296 0.298 0.995D17 0.164 0.844 0.194 0.388 0.500D18 0.197 0.885 0.225 0.373 0.599D19 0.209 0.831 0.254 0.775 0.326
restricted the sample period to 1991]1995. Instead of the detailed results forindividual years, we provided an average efficiency during the study period for eachfirm in Table 3. The table shows the overall efficiency and its two main compo-
Ž . Žnents; allocative efficiency non-physical efficiency and technical efficiency physi-.cal efficiency . Moreover, two mutually distinctive and exhaustive components of
technical efficiency, scale and managerial efficiency, are also presented. Note thatthe larger the individual efficiency value, the more efficient the company is, andthe efficiency values are bounded above unity by definition.
Considering the limited number of companies in the sample, there might be theproblem of loss of discriminating power.15 However, even in transmission compa-
( )T.-Y. Kim et al. r Energy Economics 21 1999 273]293286
nies groups, the number of firms showing efficiency of unity are only six in terms ofoverall efficiency and 11 in terms of technical efficiency out of 45 observations.Thus, we can safely conclude that the results from this non-parametric analysis canbe used to discriminate companies in terms of efficiency.
Ž . Ž .Ruhrgas T8 and Transwestern Pipeline Co. T5 in the transmission companiesŽ .group, and Snam D9 in the integrated companies group provide the highest
overall efficiency, which are consistent with the results from the multilateralTornqvist index analysis. From the table, we can also observe that the inefficient¨firms have quite different inefficiency sources, such as allocative inefficiency, scaleinefficiency or mismanagement. The indication of the sources of inefficiency canbe a particularly critical piece of information for policy makers andror managersin choosing appropriate policy options.
In particular, the main source of inefficiency of Kogas turns out to be allocativerather than technical inefficiency. The allocative inefficiency in Kogas probablyresults from the additional capital investment in LNG, bias in input mix due tosevere government regulation, unfinished depreciation, etc. Further decompositionof technical inefficiency in Kogas suggests that the main source of technicalinefficiency of Kogas comes from scale inefficiency.
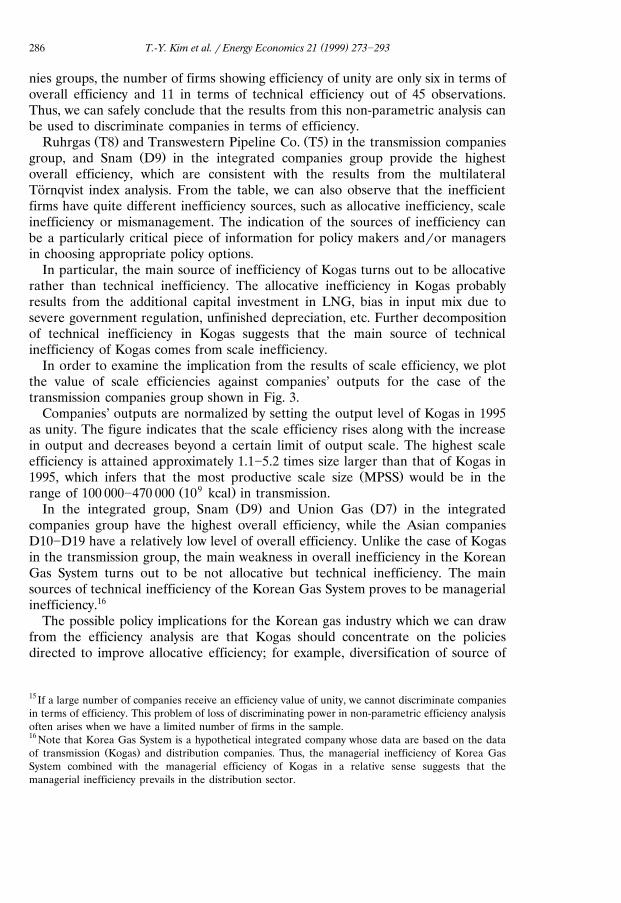
In order to examine the implication from the results of scale efficiency, we plotthe value of scale efficiencies against companies’ outputs for the case of thetransmission companies group shown in Fig. 3.
Companies’ outputs are normalized by setting the output level of Kogas in 1995as unity. The figure indicates that the scale efficiency rises along with the increasein output and decreases beyond a certain limit of output scale. The highest scaleefficiency is attained approximately 1.1]5.2 times size larger than that of Kogas in
Ž .1995, which infers that the most productive scale size MPSS would be in theŽ 9 .range of 100 000]470 000 10 kcal in transmission.
Ž . Ž .In the integrated group, Snam D9 and Union Gas D7 in the integratedcompanies group have the highest overall efficiency, while the Asian companiesD10]D19 have a relatively low level of overall efficiency. Unlike the case of Kogasin the transmission group, the main weakness in overall inefficiency in the KoreanGas System turns out to be not allocative but technical inefficiency. The mainsources of technical inefficiency of the Korean Gas System proves to be managerialinefficiency.16
The possible policy implications for the Korean gas industry which we can drawfrom the efficiency analysis are that Kogas should concentrate on the policiesdirected to improve allocative efficiency; for example, diversification of source of
15 If a large number of companies receive an efficiency value of unity, we cannot discriminate companiesin terms of efficiency. This problem of loss of discriminating power in non-parametric efficiency analysisoften arises when we have a limited number of firms in the sample.16 Note that Korea Gas System is a hypothetical integrated company whose data are based on the data
Ž .of transmission Kogas and distribution companies. Thus, the managerial inefficiency of Korea GasSystem combined with the managerial efficiency of Kogas in a relative sense suggests that themanagerial inefficiency prevails in the distribution sector.
( )T.-Y. Kim et al. r Energy Economics 21 1999 273]293 287
Ž .Fig. 3. Scale efficiency vs. output size transmission companies .
gas from LNG, shortening the time lag to make the invested capital productive,and optimal operation of existing capital facilities. There is also a need to expandits scale to exploit the static and dynamic economies of scale. In the mean time, inthe case of Korea Gas System the policy measures to enhance the managerialefficiency are urgent in order to improve the overall efficiency. A representativepolicy example to improve managerial efficiency would be the introduction ofyardstick competition among franchised regional monopolies in the distributionsector.
4.4. Methodological cross-checking about producti ity le¨el
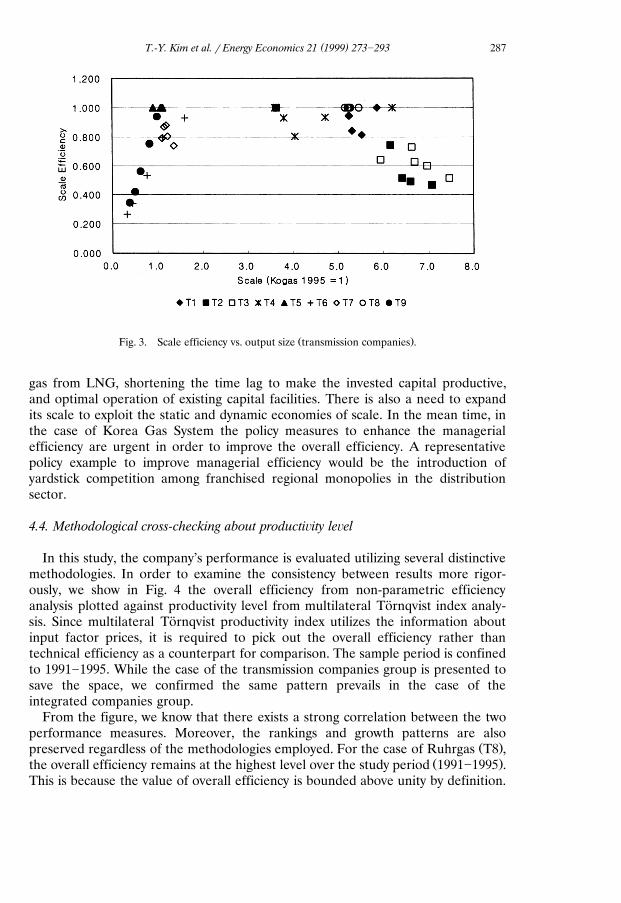
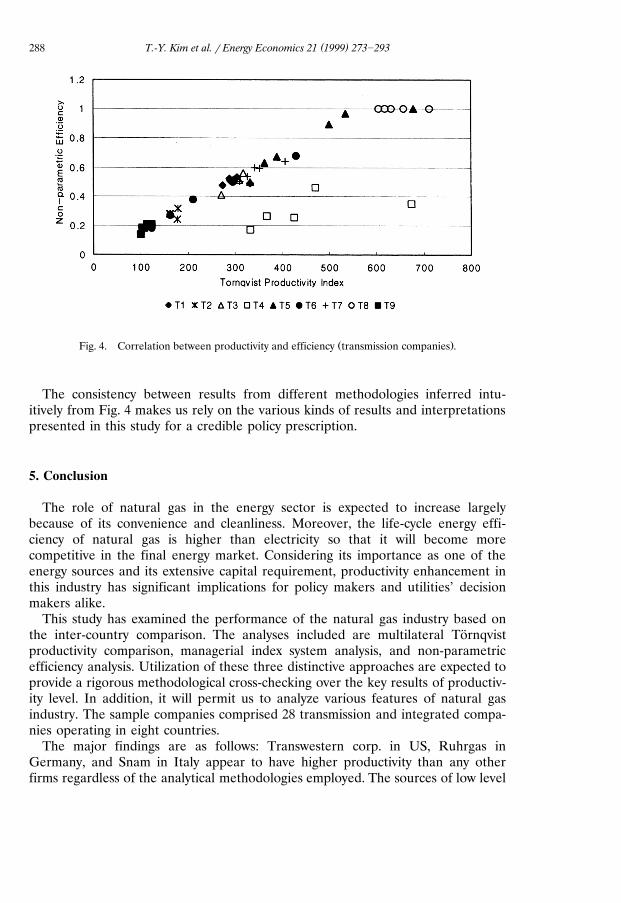
In this study, the company’s performance is evaluated utilizing several distinctivemethodologies. In order to examine the consistency between results more rigor-ously, we show in Fig. 4 the overall efficiency from non-parametric efficiencyanalysis plotted against productivity level from multilateral Tornqvist index analy-¨sis. Since multilateral Tornqvist productivity index utilizes the information about¨input factor prices, it is required to pick out the overall efficiency rather thantechnical efficiency as a counterpart for comparison. The sample period is confinedto 1991]1995. While the case of the transmission companies group is presented tosave the space, we confirmed the same pattern prevails in the case of theintegrated companies group.
From the figure, we know that there exists a strong correlation between the twoperformance measures. Moreover, the rankings and growth patterns are also
Ž .preserved regardless of the methodologies employed. For the case of Ruhrgas T8 ,Ž .the overall efficiency remains at the highest level over the study period 1991]1995 .
This is because the value of overall efficiency is bounded above unity by definition.
( )T.-Y. Kim et al. r Energy Economics 21 1999 273]293288
Ž .Fig. 4. Correlation between productivity and efficiency transmission companies .
The consistency between results from different methodologies inferred intu-itively from Fig. 4 makes us rely on the various kinds of results and interpretationspresented in this study for a credible policy prescription.
5. Conclusion
The role of natural gas in the energy sector is expected to increase largelybecause of its convenience and cleanliness. Moreover, the life-cycle energy effi-ciency of natural gas is higher than electricity so that it will become morecompetitive in the final energy market. Considering its importance as one of theenergy sources and its extensive capital requirement, productivity enhancement inthis industry has significant implications for policy makers and utilities’ decisionmakers alike.
This study has examined the performance of the natural gas industry based onthe inter-country comparison. The analyses included are multilateral Tornqvist¨productivity comparison, managerial index system analysis, and non-parametricefficiency analysis. Utilization of these three distinctive approaches are expected toprovide a rigorous methodological cross-checking over the key results of productiv-ity level. In addition, it will permit us to analyze various features of natural gasindustry. The sample companies comprised 28 transmission and integrated compa-nies operating in eight countries.
The major findings are as follows: Transwestern corp. in US, Ruhrgas inGermany, and Snam in Italy appear to have higher productivity than any otherfirms regardless of the analytical methodologies employed. The sources of low level
( )T.-Y. Kim et al. r Energy Economics 21 1999 273]293 289
of productivity and inefficiency are quite different from company-to-companydepending on the situation in which each company operates. The Korean naturalgas industry, transmission and distribution sectors alike, shows lower levels ofproductivity than other foreign natural gas companies. Specifically the transmissionsector has disadvantages with respect to insufficient exploitation of scale economiesand allocative inefficiency, while the distribution sector has problems due tomanagerial inefficiency. During the past decade, substantial deregulation in thenatural gas industry has led to significant decreases in output price along with aminor increase in productivity, which made the profit decrease at a phenomenalrate. The regulatory change which only produces a destructive profit decrease for along period may not be appropriate, since a sustainable profit should be retainedby the gas company to provide a qualified public service.
We believe that a detailed comparison of productivity and analysis on itsdeterminants would be helpful for policy makers and managers to make policyprescription, although the companies considered in this study started their businessat widely different times and the environmental conditions surrounding the firmsare also quite different.
Appendix A: Multilateral Tornqvist productivity index¨
Ž .Let us assume that each firm j s 1, 2, . . . , n consumes a varying amount of iŽ .inputs X , i s 1, 2, . . . , I to produce a single output Y . The mathematicali j j
formulation of multilateral Tornqvist productivity index between company k and m¨is represented in the following equation;
Y Y S q S Xk k k h iklnTFP y lnTFP s ln y ln y lnÝk m ž /ž / ž / ž /Y Y 2 Xh h ihi
S q S Xk h ik Ž .y ln A1Ý ž / ž /2 Xihi
Ž .where W denotes the price of X , and S s W X rÝ W X denotes the costi j i j i j i j i j i i j i jshare of input i for firm j. The index h in the above equation represents ahypothetical firm whose data are comprised of sample mean.
Appendix B: Multilateral Edgeworth managerial index system
The multilateral Edgeworth managerial index system incorporating the compo-nents of profit, productivity, input price, and output price is summarized simultane-ously in the following equation. The system measures performance differencebetween company k and m. It should be noted that we introduce a hypotheticalcompany index by h whose data are derived from the sample mean to maintain the
Ž .transitivity Caves et al., 1982; Diewert, 1992 .
( )T.-Y. Kim et al. r Energy Economics 21 1999 273]293290
wŽ . Ž .xP Y y Ý W X y P Y y Ý W Xk k i ik ik m m i im im
P q P W q W P q P W q Wk h ik ih k h ik ihs Y y Ý X y Y y Ý Xk i ik h i ihž / ž /2 2 2 2
P q P W q W P q P W q Wm h im ih k h im ihy Y y Ý X y Y y Ý Xm i im h i ihž / ž /2 2 2 2
Y q Y Y q Y Y q Y Y q Yk h m h m h m hq P y P y P y Pk h m hž / ž /2 2 2 2
X q X X q Xik ih ik ihy Ý W y Ý Wii ik iž /2 2
X q X X q Xim ih im ih Ž .y Ý W y Ý W A2i im i ihž /2 2
The term in the left hand side represents the inter-company profit differencebetween company k and m. The right hand side terms in the brackets denote the
Ž .productivity difference P , output price difference, and input price difference,k mrespectively.
Ž .We have to adjust the productivity difference P in the above equationk maccording to the operating scale. Without this adjustment, there may be productiv-ity difference even though the ratios of output to input are exactly the same. Thisadjustment may be the price to retain the advantage of absolute value system.
To derive a scale-adjusted index system, let us define the following variablesrepresenting output to input ratios of company k, m, and hypothetical company h,as T , T , and T , respectively.k m h
P q P W q Wk h ik ihT s Y r XÝk k ikž / ž /2 2i
P q P W q Wm h im ihT s Y r XÝm m imž / ž /2 2i
P q P W q Wh h ih ihT s Y r XÝh h ihž / ž /2 2i
Utilizing the above definitions, we can redefine the productivity differenceŽ .P between company k and m with some algebraic manipulations as follows:k m
W q W W q Wik ih im ihŽ . Ž .P s T y T X y T y T XÝ Ýk m k h ih m h ih2 2i i
W q W W q Wik ih ik ihŽ .q T y 1 Ý X y XÝk i ik ihž /2 2i
W q W W q Wim ih im ihŽ . Ž .y T y 1 X y X A3Ý Ým m ihž /2 2i i

( )T.-Y. Kim et al. r Energy Economics 21 1999 273]293 291
where the first term in the right hand side denotes the productivity difference afterbeing adjusted by the scale difference and the second term denotes the residualdue to scale adjustment. In empirical applications, we used the definition of scaleadjusted productivity difference in the managerial index system. At the same time,we can define the scale-adjusted profit difference by subtracting the scale adjust-
Ž . Ž .ment term in the above Eq. A3 from the profit difference discussed in Eq. A2 .
Appendix C: Mathematical formulations of non-parametric efficiency
We assume K companies indexed by k s 1, 2, . . . , K. Let X g Rq andk mq Ž . Ž .W g R be 1 = m and m = 1 vectors of input factors and their prices. Let usk m
also assume that input matrix of all the firms as M and output vector of all theŽ . Ž .firms as Q. Note that the M and N have m = k and 1 = K as their dimensions,
Ž .respectively, since we assume single output producers. l will represent the 1 = Kintensity vector.
Using the variables defined above, the linear program to calculate the minimumcost for firm k based on the observed input, output data of sample companies as:
min Ž .C k s min P Xk
s.t . Y F Qlk
u X G Mlq Ž .l g R A4K
Ž U . Ž .With the solution from the above problem X , the overall efficiency OE isdefined as the ratio of achievable minimum cost to observed cost.
min Ž .C k P X )kŽ . Ž .OE k s s A5Ž .C k P Xk k
Ž .Technical efficiency TE measures the distance of observation from the isoquant.Under the assumption of constant returns to scale, the linear program to calculatethe input-based technical efficiency can be described as
TE s minuk
s.t . Y F Qlk
u X G Mlk
q Ž .l g R A6K
To account for the possibility of sub-optimality in scale, it is needed to factor outthe scale effect from the efficiency calculation. To do this, we calculate the
( )T.-Y. Kim et al. r Energy Economics 21 1999 273]293292
Ž .managerial efficiency ME allowing for the possibility of variable returns to scaleas follows;
ME s minuk
s.t .Y k F Ql
u X k G MlK i Ž .Ý l s 1 A7js1
Ž . Ž .Allocative efficiency AE is defined as the ratio of technical efficiency TE toŽ . Ž .overall efficiency OE , and scale efficiency SE is analogously defined as the ratio
Ž . Ž .of technical efficiency TE to managerial efficiency ME .
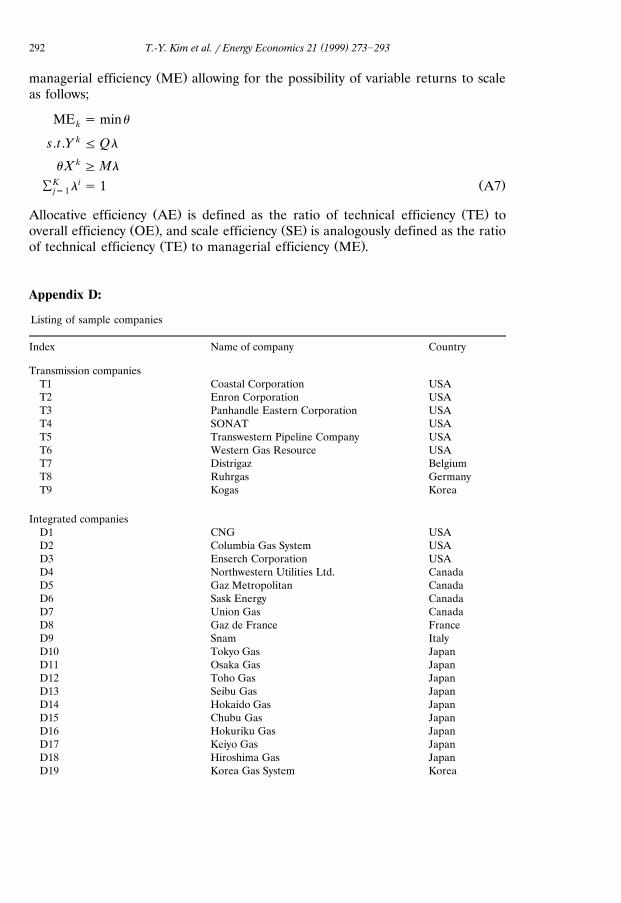
Appendix D:
Listing of sample companies
Index Name of company Country
Transmission companiesT1 Coastal Corporation USAT2 Enron Corporation USAT3 Panhandle Eastern Corporation USAT4 SONAT USAT5 Transwestern Pipeline Company USAT6 Western Gas Resource USAT7 Distrigaz BelgiumT8 Ruhrgas GermanyT9 Kogas Korea
Integrated companiesD1 CNG USAD2 Columbia Gas System USAD3 Enserch Corporation USAD4 Northwestern Utilities Ltd. CanadaD5 Gaz Metropolitan CanadaD6 Sask Energy CanadaD7 Union Gas CanadaD8 Gaz de France FranceD9 Snam ItalyD10 Tokyo Gas JapanD11 Osaka Gas JapanD12 Toho Gas JapanD13 Seibu Gas JapanD14 Hokaido Gas JapanD15 Chubu Gas JapanD16 Hokuriku Gas JapanD17 Keiyo Gas JapanD18 Hiroshima Gas JapanD19 Korea Gas System Korea
( )T.-Y. Kim et al. r Energy Economics 21 1999 273]293 293
References
Aivazian, V.J., Callen, J.L., Chan, M.W.L., Mountain, D.C., 1987. Economics of scale versus technologi-cal change in the natural gas transmission industry. Rev. Econ. Stat. 69, 556]561.
American Gas Association, 1996. Efficiency Gains in Natural Gas Transmission and Distribution.Energy analysis 1996-02.
Amstrong, A., Cowan, S., Vickers, J., 1994. Regulatory Reform: Economic Analysis and BritishExperience. MIT Press, Cambridge MA.
Banker, R.D., Chang, H.H., Majumdar, S.K., 1996. Profitability, productivity and price recovery patternsin the U.S. telecommunications industry. Rev. Ind. Org. 11, 1]17.
Charnes, A., Cooper, W.W., Sueyoshi, T., 1988. A goal programmingrconstrained regression review ofthe Bell System breakup. Manage. Sci. 34, 1]26.
Caves, D.W., Christensen, L.R., Diewert, W.E., 1982. Multilateral comparison of output, input andproductivity using superlative index number. Econ. J. 92, 73]86.
Diewert, W.E., 1992. Fisher ideal output, input and productivity indexes revisited. J. Productivity Anal.3, 211]248.
Encaoua, D., 1991. Liberalizing European airlines: Cost and factor productivity evidence. Int. J. Ind.Org. 9, 109]124.
Fare, R., Grosskopf, S., Lovell, C.A.K., 1994. Production Frontiers. Cambridge University Press,¨Cambridge MA.
Fare, R., Grosskopf, S., Yaisawarng, S., Li, S.K., Wang, Z., 1990. Productivity growth in Illinois electric¨utilities. Resources Energy 12, 383]398.
Foster, C.D., 1992. Privatization, Public Ownership and The Regulation of Natural Monopoly. Black-well, Oxford.
Golany, B., Roll, Y., Rybak, D., 1994. Measuring efficiency of power plants in Israel by DataEnvelopment Analysis. IEEE Trans. Eng. Manage. 41, 291]301.
Kim, T.Y., Lee, J.D., 1995. Cost analysis of gas distribution industry with spatial variables. J. EnergyDev. 10, 247]265.
Kurosawa, K., 1991. Productivity Measurement and Management at the Company Level: The JapaneseExperience. Elsevier, Amsterdam.
Lee, J.D., Kim, T.Y., 1997. Measuring network effect in energy distribution industry: With policyimplications for industrywide regulation. 18th Annual North American Conference. USAEErIAEE,San Francisco.
Morrison, C.J., 1993. A Microeconomic Approach to The Measurement of Economic Performance:Productivity Growth, Capacity Utilization, and Related Performance Indicators. Springer-Verlag,New York.
Perelman, S., 1995. R & D, technological progress and efficiency change in industrial activities. Rev.Income Wealth 41, 349]366.
Price, C.W., Weyman-Jones, T., 1996. Malmquist indices of productivity change in the U.K. gas industrybefore and after privatization. Appl. Econ. 28, 29]39.
Rushdi, A., 1994. Productivity changes in the gas and fuel corporation of Victoria. Energy Econ. 16,36]45.
Taylor, D.T., Thompson, R.G., 1995. The Efficient Utility: Labor, Capital and Profit. Public UtilitiesFortnightly, Sep. 1, 1995, pp. 25]29.
Thompson, R.G., Dharmapala, P.S., Rothenberg, L.J., 1994. DEA ARs and CRs applied to worldwidemajor oil companies. J. Productivity Anal. 5, 181]204.
Yunos, J.M., Hawdon, D., 1997. The efficiency of the National Electricity Board in Malaysia: Aninter-country comparison using DEA. Energy Econ. 19, 255]269.