Embed Size (px)
Citation preview
*The author thanks Sabrina Montes for editorial assistance and economic advice, both of which greatlyenhanced the quality and readability of the paper.
INTERNATIONAL COMPETITIVENESSLABOR PRODUCTIVITY LEADERSHIP AND
CONVERGENCE AMONG 14 OECD COUNTRIES
Morton Schnabel*
Office of Business and Industrial AnalysisOffice of Policy Development
Economics and Statistics Administration
June 1997
ESA/OPD 97-4

International Competitiveness
International Competitiveness
SUMMARY
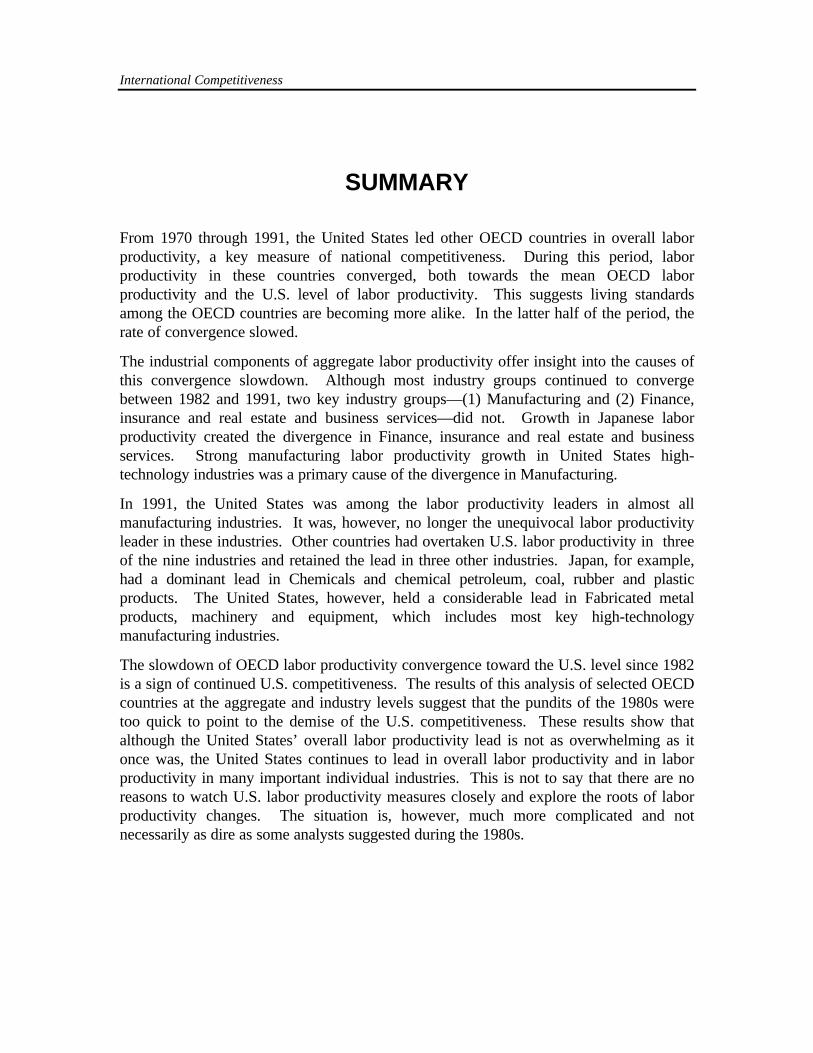
From 1970 through 1991, the United States led other OECD countries in overall laborproductivity, a key measure of national competitiveness. During this period, laborproductivity in these countries converged, both towards the mean OECD laborproductivity and the U.S. level of labor productivity. This suggests living standardsamong the OECD countries are becoming more alike. In the latter half of the period, therate of convergence slowed.
The industrial components of aggregate labor productivity offer insight into the causes ofthis convergence slowdown. Although most industry groups continued to convergebetween 1982 and 1991, two key industry groups—(1) Manufacturing and (2) Finance,insurance and real estate and business services—did not. Growth in Japanese laborproductivity created the divergence in Finance, insurance and real estate and businessservices. Strong manufacturing labor productivity growth in United States high-technology industries was a primary cause of the divergence in Manufacturing.
In 1991, the United States was among the labor productivity leaders in almost allmanufacturing industries. It was, however, no longer the unequivocal labor productivityleader in these industries. Other countries had overtaken U.S. labor productivity in threeof the nine industries and retained the lead in three other industries. Japan, for example,had a dominant lead in Chemicals and chemical petroleum, coal, rubber and plasticproducts. The United States, however, held a considerable lead in Fabricated metalproducts, machinery and equipment, which includes most key high-technologymanufacturing industries.
The slowdown of OECD labor productivity convergence toward the U.S. level since 1982is a sign of continued U.S. competitiveness. The results of this analysis of selected OECDcountries at the aggregate and industry levels suggest that the pundits of the 1980s weretoo quick to point to the demise of the U.S. competitiveness. These results show thatalthough the United States’ overall labor productivity lead is not as overwhelming as itonce was, the United States continues to lead in overall labor productivity and in laborproductivity in many important individual industries. This is not to say that there are noreasons to watch U.S. labor productivity measures closely and explore the roots of laborproductivity changes. The situation is, however, much more complicated and notnecessarily as dire as some analysts suggested during the 1980s.

International Competitiveness
International Competitiveness
TABLE OF CONTENTS
INTRODUCTION...................................................................................................1
DATA.....................................................................................................................4
LABOR PRODUCTIVITY LEADERSHIP AND CONVERGENCE..........................5
CONVERGENCE AMONG MANUFACTURING INDUSTRIES...........................11
CONCLUSION ....................................................................................................17
REFERENCES....................................................................................................19

International Competitiveness
LIST OF TABLES
TABLE 1: TOP THREE OECD COUNTRIES IN LABOR PRODUCTIVITY BYINDUSTRY ..........................................................................................6
TABLE 2: CONVERGENCE ON OECD AVERAGE LABOR PRODUCTIVITY BYINDUSTRY ..........................................................................................7
TABLE 3: CONVERGENCE ON LABOR PRODUCTIVITY LEADER BYINDUSTRY ..........................................................................................9
TABLE 4: TOP THREE OECD COUNTRIES IN LABOR PRODUCTIVITY:MANUFACTURING ...........................................................................12
TABLE 5: CONVERGENCE ON OECD AVERAGE LABOR PRODUCTIVITY:MANUFACTURING ...........................................................................13
TABLE 6: CONVERGENCE ON LABOR PRODUCTIVITY LEADER:MANUFACTURING ...........................................................................13
LIST OF FIGURES
FIGURE 1: CONVERGENCE ON TOTAL AVERAGE LABOR PRODUCTIVITYAMONG 14 OECD COUNTRIES........................................................7
FIGURE 2: LABOR PRODUCTIVITY, 1970-1991FINANCE, INSURANCE ANDREAL ESTATE AND BUSINESS SERVICES...................................10
FIGURE 3: LABOR PRODUCTIVITY, 1970-1991MANUFACTURING............10
FIGURE 4 : LABOR PRODUCTIVITY, 1970-1991CHEMICALS ANDCHEMICAL PETROLEUM, COAL, RUBBER AND PLASTICPRODUCTS .....................................................................................15
FIGURE 5: LABOR PRODUCTIVITY, 1970-1991FABRICATED METALPRODUCTS, MACHINERY AND EQUIPMENT ...............................16

International CompetitivenessLabor Productivity Leadership and
Convergence Among 14 OECD Countries

International Competitiveness
International Competitiveness Page 1
INTRODUCTION
After World War II, the United States had a substantial advantage in labor productivityover other industrialized countries. This advantage translated into much higher livingstandards for the average American citizen than for citizens in any other country. Duringthe 1970s, this sizable lead over other countries began to narrow. Both U.S. output andproductivity growth rates slowed. At the same time, growth rates sped up in othercountries, particularly in Japan. By the early 1980s, Japan was experiencing robustgrowth, while the United States was experiencing slower growth and running persistentfiscal and trade deficits. Pundits speculated that the United States was on a downwardcourse that would allow other countries to surpass it. In academic circles, thesepredictions brought forth considerable research into the extent and possible causes of therelative U.S. decline. One branch of this research took a detailed look at factors that givea nation’s firms a competitive advantage in global markets. Another sought moreaggregate measures of a nation’s competitiveness relative to other countries. Thefollowing analysis outlines the main issues of this research and adopts an alternativeapproach that combines the two previous approaches by exploring the industrialcomponents of the aggregate measures.
Some economists consider the idea of national competitiveness a vague, if not ameaningless concept. Ultimately, competitive advantage rests at the industry level.Rather than looking at aggregate measures of national competitiveness, many researchersexamine firms and industries to determine what gives certain countries advantages incertain industries and what policies government can pursue or change to give theirdomestic industries a competitive edge.
Much of this research emphasizes manufacturing industries, in part because manufacturingoutput is more often traded in international markets than services output.1 Manufacturingfirms are more likely to be in direct competition with foreign firms—vying to develop thesame technology, using similar processes, and selling to the same customers. Data formanufacturing industries are also more comprehensive and of better quality than data onother sectors of the economy, particularly services. Furthermore, many industries that fallinto the services category have been, or are, heavily regulated (for example, health care,communications, and utilities). Additionally, the United States has recently deregulated orpartially deregulated services such as airline transportation and communications. Somecountries have also deregulated, but many have not. Thus, comparisons across countrieshave an even greater degree of ambiguity.
1 The classic example is the inability to export haircuts. However, many services—such as financial services, computerservices—are increasingly traded internationally. Despite large and growing surpluses in the nation’s services account,service industries generated about the same share (roughly 23 percent) of overall U.S. trade activity in 1994 as they did in1987. See U.S. Department of Commerce, Service Industries And Economic Performance, March, 1996, 26-27.
Page 2 International Competitiveness
Relating analysis of specific industries back to the concept of overall nationalcompetitiveness is not necessarily straightforward. Some researchers have soughtapproaches aimed at more aggregate comparisons of the competitive performance ofdifferent economies. The first step in this process is to arrive at a definition of whatcompetitiveness in this context means. Although definitions vary, the general consensus isthat a competitive nation is one that succeeds in international trade via high-technologyand productivity, with accompanying high income and high wages (Dollar and Wolff,1993).
An often cited measure of these elements is a country’s trade balance, the differencebetween a country’s imports and exports. Trade balances are, however, heavily influencedby macroeconomic factors, such as changes in the exchange rate and business cycles. Adepreciation of the dollar can improve the U.S. trade balance by making U.S. exports lessexpensive in foreign markets and making imports more expensive in U.S. markets. Thecost of this policy, however, is to lower U.S. living standards by reducing the value ofU.S. work in terms of foreign goods. Similarly, a recession in the United States wouldimprove the trade balance, but only by reducing the incomes (and thus living standards) inthe United States (Dertouzos, Lester, and Solow, 1989).
Achieving a rising standard of living depends on maintaining an increasing level ofproductivity. Observers who have compared labor productivity across countries in recentdecades have been especially interested in labor productivity convergence.2 Convergencetheory suggests that over time the economies of the world will become more alike in termsof productivity and living standards. Since the United States has been, and continues tobe, the productivity leader, convergence theory suggests that U.S. labor productivity mustdecrease relative to that in other countries by either a slowdown of U.S. growth orrelatively faster growth in other countries.
Empirical evidence of all economies converging is mixed. Early research found littleevidence of convergence. More recent studies find evidence of convergence across alleconomies when analysts control for factors such as investment, trade orientation, andeducation (Dollar and Wolff, 1993). Although the evidence of convergence across alleconomies is mixed, there is evidence that labor productivity levels of a group ofindustrialized economies are converging.3
Researchers are, of course, not limited to looking at either industry or aggregate measuresof national competitiveness. Most combine the two approaches to some extent. One
2 See Abramovitz (1986) and Baumol (1986) for early analyses of productivity convergence.3 The mechanics of convergence are not entirely clear. One key theory is that technological backwardness is an advantage thatmay fuel catch up and eventual convergence of labor productivity. Specifically, the advanced industrialized countries spend aconsiderable amount of money creating technological advances. Backward countries invest in the technologies at a much laterstage in the process—after the technologies are well advanced. Thus, the backward countries catch up to the technologicalleader in one big leap without spending money on R&D, interim technology, or interim technological infrastructure(Abramovitz, 1986). There are, of course, many potential impediments to this process. The technology development effortitself generates certain advantages in implementing the technology. Furthermore, backward countries may not have thenecessary infrastructure (for example, an educated labor force, financial markets) to take advantage fully of the newtechnologies. In any event, in examining national competitiveness most researchers focus on convergence amongindustrialized countries where infrastructure is less of an issue.
International Competitiveness Page 3
recent study (Dollar & Wolff, 1993) took a close look at the relationship between industryand the aggregate measures by examining the industrial components of labor productivityconvergence. The present analysis uses updated data to take a second look at thesemeasures to examine how the industry level labor productivity convergence trends of the1970s and early 80s developed through the early 1990s.
The analysis is divided into three sections. The first describes the data. The secondexamines the trends in labor productivity leadership and convergence across industrygroups for selected OECD countries. The third takes a detailed look at leadership andlabor productivity convergence in manufacturing industries.
Page 4 International Competitiveness
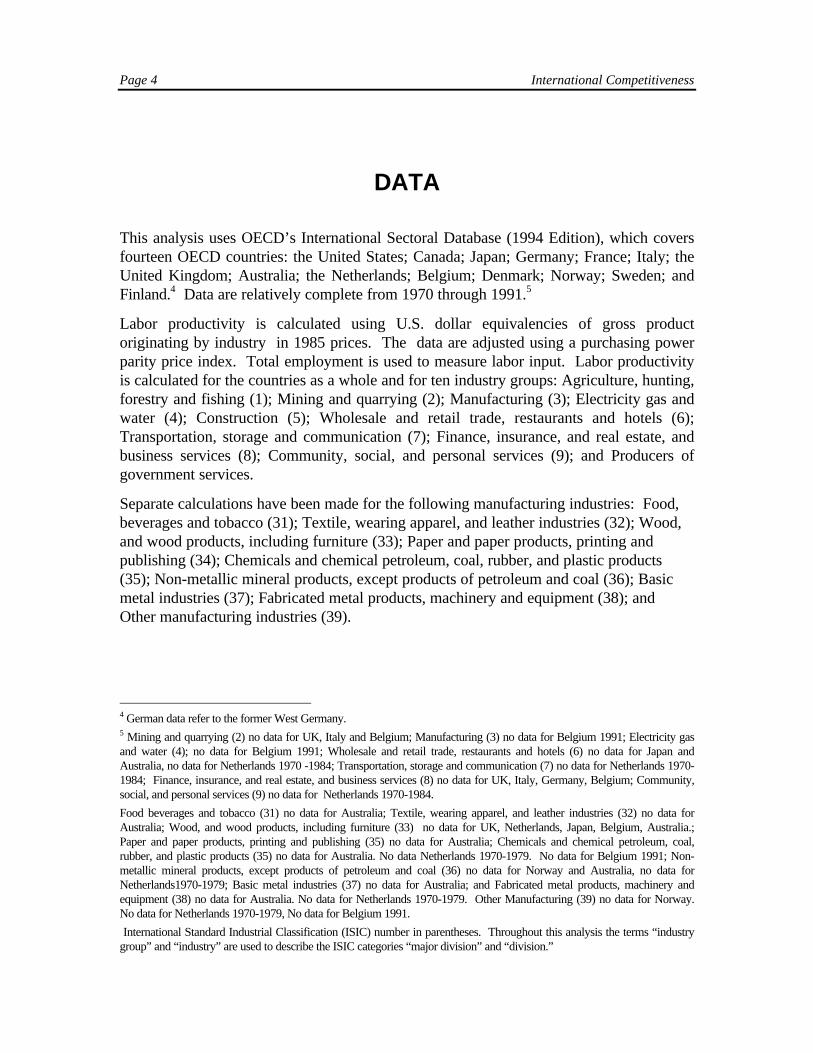
DATA
This analysis uses OECD’s International Sectoral Database (1994 Edition), which coversfourteen OECD countries: the United States; Canada; Japan; Germany; France; Italy; theUnited Kingdom; Australia; the Netherlands; Belgium; Denmark; Norway; Sweden; andFinland.4 Data are relatively complete from 1970 through 1991.5
Labor productivity is calculated using U.S. dollar equivalencies of gross productoriginating by industry in 1985 prices. The data are adjusted using a purchasing powerparity price index. Total employment is used to measure labor input. Labor productivityis calculated for the countries as a whole and for ten industry groups: Agriculture, hunting,forestry and fishing (1); Mining and quarrying (2); Manufacturing (3); Electricity gas andwater (4); Construction (5); Wholesale and retail trade, restaurants and hotels (6);Transportation, storage and communication (7); Finance, insurance, and real estate, andbusiness services (8); Community, social, and personal services (9); and Producers ofgovernment services.
Separate calculations have been made for the following manufacturing industries: Food,beverages and tobacco (31); Textile, wearing apparel, and leather industries (32); Wood,and wood products, including furniture (33); Paper and paper products, printing andpublishing (34); Chemicals and chemical petroleum, coal, rubber, and plastic products(35); Non-metallic mineral products, except products of petroleum and coal (36); Basicmetal industries (37); Fabricated metal products, machinery and equipment (38); andOther manufacturing industries (39).
4 German data refer to the former West Germany.5 Mining and quarrying (2) no data for UK, Italy and Belgium; Manufacturing (3) no data for Belgium 1991; Electricity gasand water (4); no data for Belgium 1991; Wholesale and retail trade, restaurants and hotels (6) no data for Japan andAustralia, no data for Netherlands 1970 -1984; Transportation, storage and communication (7) no data for Netherlands 1970-1984; Finance, insurance, and real estate, and business services (8) no data for UK, Italy, Germany, Belgium; Community,social, and personal services (9) no data for Netherlands 1970-1984.
Food beverages and tobacco (31) no data for Australia; Textile, wearing apparel, and leather industries (32) no data forAustralia; Wood, and wood products, including furniture (33) no data for UK, Netherlands, Japan, Belgium, Australia.;Paper and paper products, printing and publishing (35) no data for Australia; Chemicals and chemical petroleum, coal,rubber, and plastic products (35) no data for Australia. No data Netherlands 1970-1979. No data for Belgium 1991; Non-metallic mineral products, except products of petroleum and coal (36) no data for Norway and Australia, no data forNetherlands1970-1979; Basic metal industries (37) no data for Australia; and Fabricated metal products, machinery andequipment (38) no data for Australia. No data for Netherlands 1970-1979. Other Manufacturing (39) no data for Norway.No data for Netherlands 1970-1979, No data for Belgium 1991.
International Standard Industrial Classification (ISIC) number in parentheses. Throughout this analysis the terms “industrygroup” and “industry” are used to describe the ISIC categories “major division” and “division.”

International Competitiveness Page 5
LABOR PRODUCTIVITY LEADERSHIP ANDCONVERGENCE
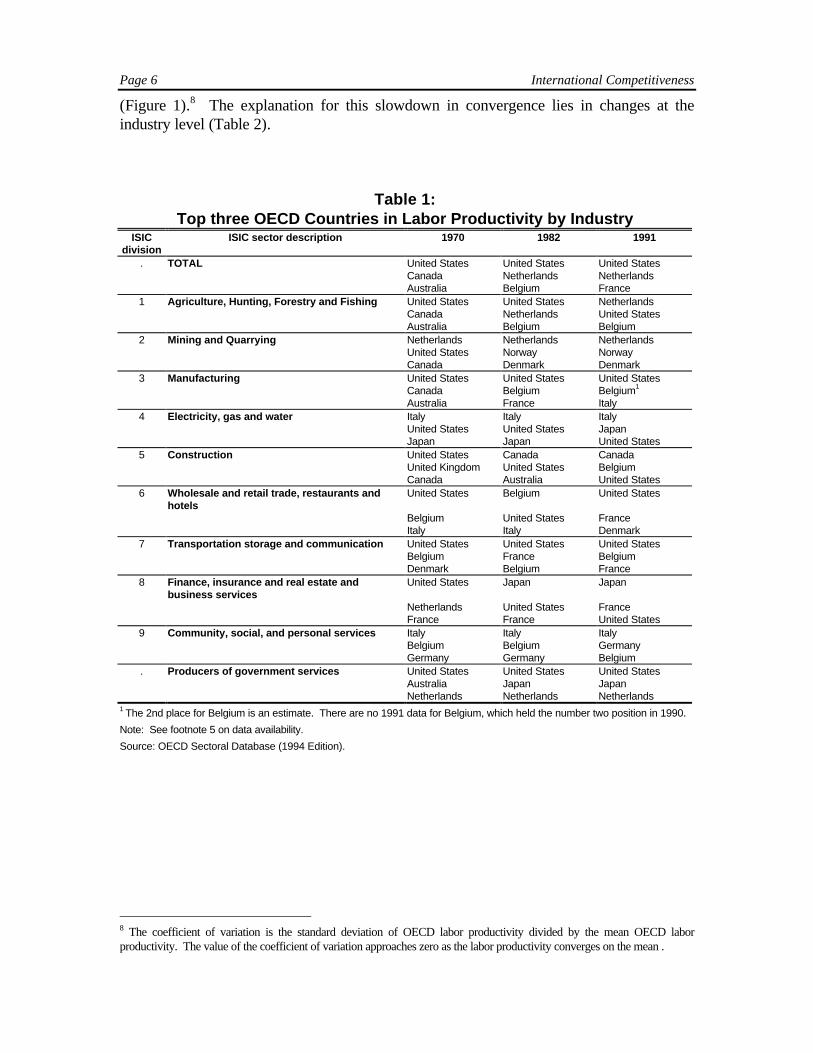
From 1970 to 1991, the United States had the highest labor productivity of the fourteenOECD countries in this study (Table 1). U.S. leadership, however, declined somewhatover the period. In 1970, the United States had a dominating labor productivity lead overthe other OECD countries. The United States led in all industry groups except Miningand quarrying (1); Electricity gas and water (4); and Community, social, and personalservices (9), and was among the top three in all industry groups, except Community,social, and personal services (9).
By 1991, there had been a fall-off in U.S. labor productivity performance relative to theother OECD countries. Although the United States still led in aggregate laborproductivity, by 1991 the United States held the lead position in only four of the industrygroups: Manufacturing (3); Wholesale and retail trade, restaurants and hotels (6);Transportation storage and communication (7); and Producers of government services.The United States, however, remained in the top three in all but two of the industrygroups: Mining and quarrying (2) and Community, social, and personal services (9).
Table 1 shows that no single country replaced the United States in the cases where we lostour leadership position. The Netherlands moved into the top slot in Agriculture, hunting,forestry, and fishing (1). Japan moved to the lead in Finance, insurance and real estate andbusiness services (8). Canada took the top spot in Construction (5).6 Italy retained firstplace in Electricity, gas and water (4)7 as did the Netherlands in Mining and quarrying (2).
These leadership changes occurred during a period of general convergence of aggregatelabor productivity among OECD countries. Dollar and Wolff (1993), using OECD datathrough 1985 found labor productivity convergence in the aggregate and across industrygroups. Similarly, the present study, using an updated version of the same data set, findsaggregate convergence of the 14 countries through 1991 (the last year of relativelycomplete data) (Figure 1). For the total of all industries plus government services, thecoefficient of variation, which measures variation of national labor productivity from theOECD average, decreased at a faster rate from 1970 to 1982 than from 1982 to 1991
6 Ultimately, it is firms and not countries that are in direct competition. Although countries are clearly different in their sizeand resources, an internationally competitive company may be based in a small country.7 Italian data for electricity, gas and water also includes petroleum refining. It is not clear that Italy would retain productivityleadership in this industry without this addition because labor productivity in petroleum refining tends to exceed that inelectricity, gas and water.
Page 6 International Competitiveness
(Figure 1).8 The explanation for this slowdown in convergence lies in changes at theindustry level (Table 2).
Table 1:Top three OECD Countries in Labor Productivity by Industry
ISICdivision
ISIC sector description 1970 1982 1991
. TOTAL United States United States United StatesCanada Netherlands NetherlandsAustralia Belgium France
1 Agriculture, Hunting, Forestry and Fishing United States United States NetherlandsCanada Netherlands United StatesAustralia Belgium Belgium
2 Mining and Quarrying Netherlands Netherlands NetherlandsUnited States Norway NorwayCanada Denmark Denmark
3 Manufacturing United States United States United StatesCanada Belgium Belgium1
Australia France Italy4 Electricity, gas and water Italy Italy Italy
United States United States JapanJapan Japan United States
5 Construction United States Canada CanadaUnited Kingdom United States BelgiumCanada Australia United States
6 Wholesale and retail trade, restaurants andhotels
United States Belgium United States
Belgium United States FranceItaly Italy Denmark
7 Transportation storage and communication United States United States United StatesBelgium France BelgiumDenmark Belgium France
8 Finance, insurance and real estate andbusiness services
United States Japan Japan
Netherlands United States FranceFrance France United States
9 Community, social, and personal services Italy Italy ItalyBelgium Belgium GermanyGermany Germany Belgium
. Producers of government services United States United States United StatesAustralia Japan JapanNetherlands Netherlands Netherlands
1 The 2nd place for Belgium is an estimate. There are no 1991 data for Belgium, which held the number two position in 1990.
Note: See footnote 5 on data availability.
Source: OECD Sectoral Database (1994 Edition).
8 The coefficient of variation is the standard deviation of OECD labor productivity divided by the mean OECD laborproductivity. The value of the coefficient of variation approaches zero as the labor productivity converges on the mean .

International Competitiveness Page 7
Figure 1:Convergence on Total Average Labor Productivity
Among 14 OECD Countries
0
0.05
0.1
0.15
0.2
0.25
0.3
1970
1971
1972
1973
1974
1975
1976
1977
1978
1979
1980
1981
1982
1983
1984
1985
1986
1987
1988
1989
1990
1991
Time
Sta
nd
ard
dev
iati
on
/mea
n
Coefficient of variation
Source: OECD Sectoral Database (1994 Edition).
Table 2:Convergence on OECD Average Labor Productivity by Industry
Coefficient of VariationISIC
divisionISIC sector description 1970 1982 1991
. TOTAL 0.250 0.183 0.1521 Agriculture, hunting, forestry
and fishing0.455 0.350 0.344
2 Mining and quarrying 2.247 1.866 1.3183 Manufacturing 0.212 0.182 0.2084 Electricity, gas and water 0.633 0.464 0.3825 Construction 0.363 0.220 0.1706 Wholesale and retail trade,
restaurants and hotels0.246 0.260 0.235
7 Transportation storage andcommunication
0.359 0.302 0.257
8 Finance, insurance and realestate and business services
0.184 0.198 0.269
9 Community, social, and personalservices
0.539 0.462 0.399
. Producers of governmentservices
0.229 0.233 0.251
Note: Calculations made for all countries for which data are available; see footnote 5.Divergence from one period to the next shown in bold.
Source: OECD Sectoral Database (1994 Edition).
Page 8 International Competitiveness
Although, the majority of the industrial groups also showed convergence toward theOECD average, a number of industry groups diverged. Wholesale and retail trade,restaurants and hotels (6) diverged from 1970 to 1982.9 Manufacturing (3) diverged from1982 to 1991. Finance, insurance and real estate and business services (8) and Producersof government services diverged over the whole period.10
Government services are not subject to market forces and these services are not traded inthe same sense that other goods and services are traded, thus there is no reliable means ofinterpreting labor productivity divergence in this category.11 The results in Manufacturing(3) and Finance, insurance and real estate, and business services (8) are, however,particularly interesting. The coefficient of variation suggests that after 1982 laborproductivity among the OECD countries diverged in these industries, rather thancontinuing along a convergence trend. The measure does not, however, offer anyinformation about the relative position of the United States among the OECD countries.
An alternative measure of convergence, the relative productivity of the follower countriesto the labor productivity leader, offers some insight into the relative position of the UnitedStates in a number of key industry groups (Table 3).12 Table 3, Row 1, shows aggregateconvergence on the U.S. labor productivity among OECD countries. At the industrialgroup level, the relative labor productivity measure also shows divergence inManufacturing (3), and in Finance, insurance and real estate and business services (7)since 1982. 13
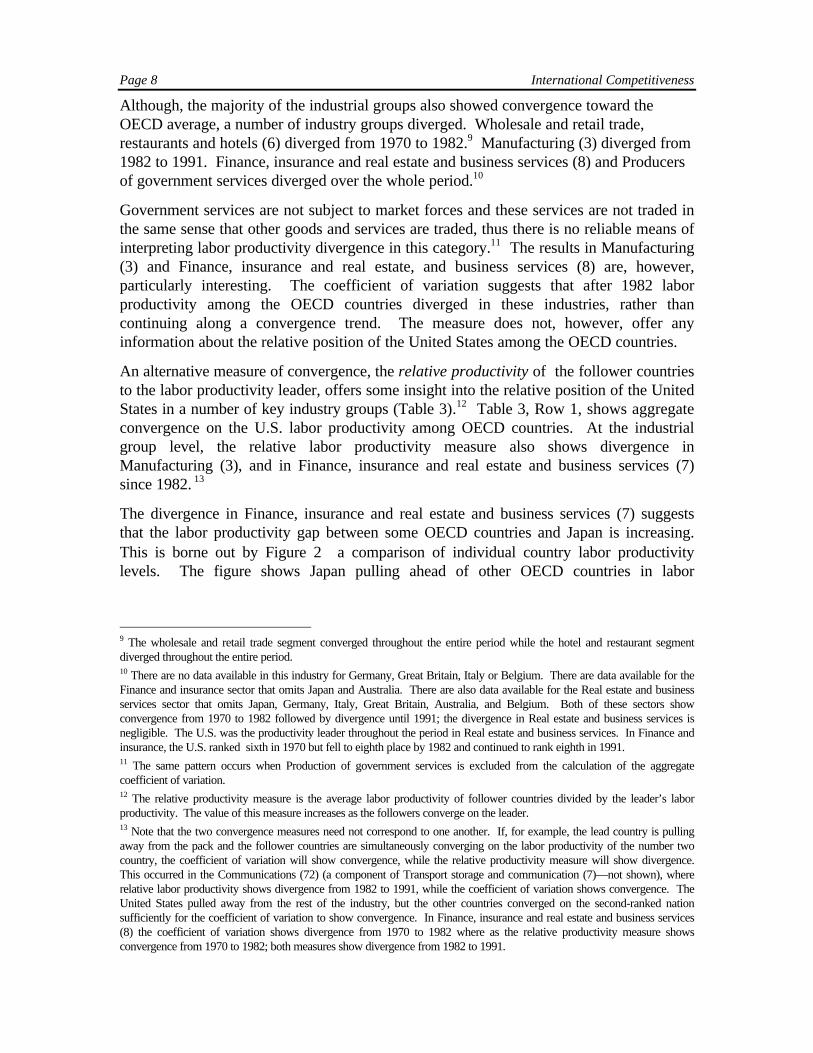
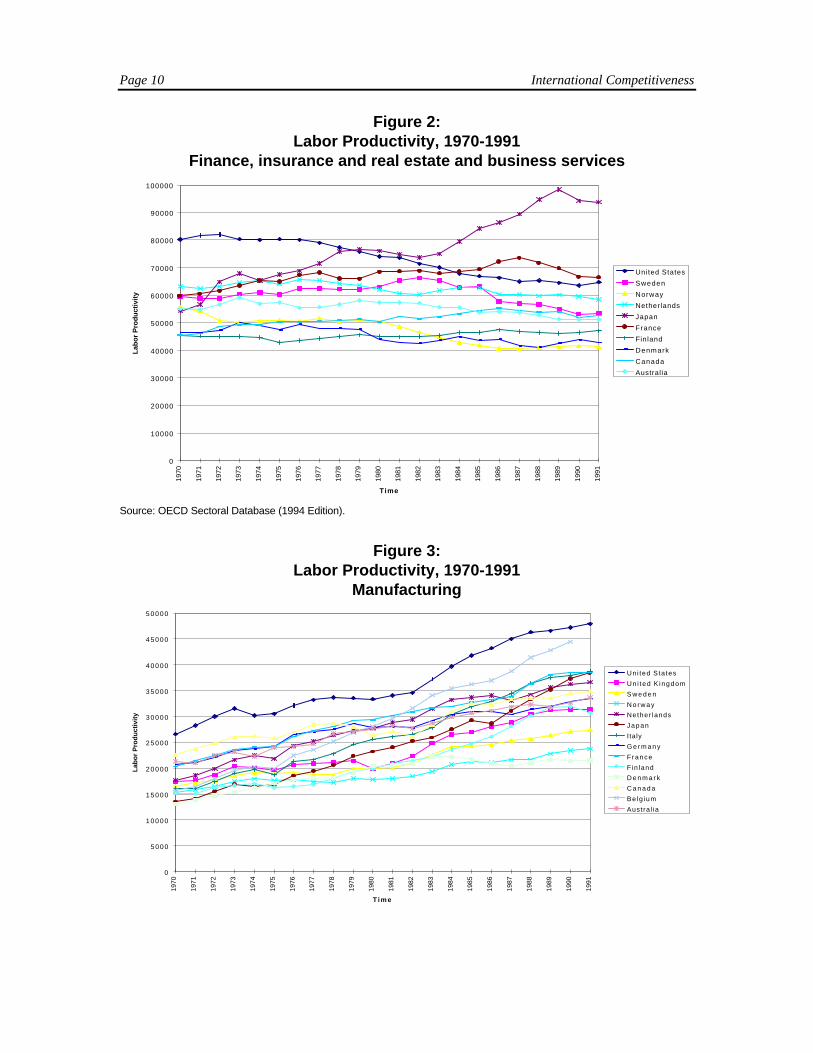
The divergence in Finance, insurance and real estate and business services (7) suggeststhat the labor productivity gap between some OECD countries and Japan is increasing.This is borne out by Figure 2a comparison of individual country labor productivitylevels. The figure shows Japan pulling ahead of other OECD countries in labor
9 The wholesale and retail trade segment converged throughout the entire period while the hotel and restaurant segmentdiverged throughout the entire period.10 There are no data available in this industry for Germany, Great Britain, Italy or Belgium. There are data available for theFinance and insurance sector that omits Japan and Australia. There are also data available for the Real estate and businessservices sector that omits Japan, Germany, Italy, Great Britain, Australia, and Belgium. Both of these sectors showconvergence from 1970 to 1982 followed by divergence until 1991; the divergence in Real estate and business services isnegligible. The U.S. was the productivity leader throughout the period in Real estate and business services. In Finance andinsurance, the U.S. ranked sixth in 1970 but fell to eighth place by 1982 and continued to rank eighth in 1991.11 The same pattern occurs when Production of government services is excluded from the calculation of the aggregatecoefficient of variation.12 The relative productivity measure is the average labor productivity of follower countries divided by the leader’s laborproductivity. The value of this measure increases as the followers converge on the leader.13 Note that the two convergence measures need not correspond to one another. If, for example, the lead country is pullingaway from the pack and the follower countries are simultaneously converging on the labor productivity of the number twocountry, the coefficient of variation will show convergence, while the relative productivity measure will show divergence.This occurred in the Communications (72) (a component of Transport storage and communication (7)—not shown), whererelative labor productivity shows divergence from 1982 to 1991, while the coefficient of variation shows convergence. TheUnited States pulled away from the rest of the industry, but the other countries converged on the second-ranked nationsufficiently for the coefficient of variation to show convergence. In Finance, insurance and real estate and business services(8) the coefficient of variation shows divergence from 1970 to 1982 where as the relative productivity measure showsconvergence from 1970 to 1982; both measures show divergence from 1982 to 1991.

International Competitiveness Page 9
productivity. The United States, which had the highest labor productivity in 1970, hasdrifted downward toward the mean.
Table 3:Convergence on Labor Productivity Leader by Industry
1970 1982 1991ISIC
divisionISIC sector description Leader Relative
Prod.Leader Relative
Prod.Leader Relative
Prod.. TOTAL United States 0.568 United States 0.695 United States 0.7471 Agriculture, Hunting, Forestry
and FishingUnited States 0.428 United States 0.596 Netherlands 0.604
2 Mining and Quarrying Netherlands 0.043 Netherlands 0.072 Netherlands 0.1883 Manufacturing United States 0.652 United States 0.733 United States 0.6774 Electricity, gas and water Italy 0.332 Italy 0.440 Italy 0.5545 Construction United States 0.439 Canada 0.671 Canada 0.7646 Wholesale and retail trade,
restaurants and hotelsUnited States 0.666 Belgium 0.721 United States 0.769
7 Transportation storage andcommunication
United States 0.473 United States 0.492 United States 0.547
8 Finance, insurance and realestate and business services
United States 0.671 Japan 0.768 Japan 0.566
9 Community, social, and personalservices
Italy 0.379 Italy 0.438 Italy 0.543
. Producers of governmentservices
United States 0.684 United States 0.678 United States 0.705
Note: Calculations made for all countries for which data are available; see footnote 5.Divergence from one period to the next shown in bold.
Source: OECD Sectoral Database (1994 Edition).
Both convergence measures indicate that from 1982 to 1991 Manufacturing (3) was notconverging. The labor productivity leader, the United States, pulled further ahead of theOECD average. Figure 3, which shows manufacturing labor productivity levels for theindividual OECD countries indicates that this is indeed what occurred.
Figure 3, however, also shows that manufacturing labor productivity in a number ofcountries is growing faster than in the United States. Thus, although, the United Statesleads in Manufacturing (3) labor productivity and has solid labor productivity growth,other countries have very strong manufacturing sectors as well.14 The next sectionexamines the industry components of manufacturing to gain a more complete picture ofthe roots of manufacturing labor productivity divergence.
14 Bureau of Labor Statistics (1996) data indicate that this trend has continued through 1995. Japan had the highest percentincrease in manufacturing labor productivity between 1994 and 1995. Italy was second. United States tied with Sweden forthird. Germany and Italy followed closely.
Page 10 International Competitiveness
Figure 2:Labor Productivity, 1970-1991
Finance, insurance and real estate and business services
0
10000
20000
30000
40000
50000
60000
70000
80000
90000
10000019
70
1971
1972
1973
1974
1975
1976
1977
1978
1979
1980
1981
1982
1983
1984
1985
1986
1987
1988
1989
1990
1991
Time
Lab
or
Pro
du
ctiv
ity
United States
Sweden
Norway
Netherlands
Japan
France
Finland
Denmark
Canada
Australia
Source: OECD Sectoral Database (1994 Edition).
Figure 3:Labor Productivity, 1970-1991
Manufacturing
0
5000
1 0 0 0 0
1 5 0 0 0
2 0 0 0 0
2 5 0 0 0
3 0 0 0 0
3 5 0 0 0
4 0 0 0 0
4 5 0 0 0
5 0 0 0 0
1970
1971
1972
1973
1974
1975
1976
1977
1978
1979
1980
1981
1982
1983
1984
1985
1986
1987
1988
1989
1990
1991
T i m e
Lab
or
Pro
du
ctiv
ity
Uni ted Sta tes
Un i ted K ingdom
S w e d e n
N o r w a y
Nether lands
Japan
Italy
G e r m a n y
France
Fin land
D e n m a r k
C a n a d a
Be lg ium
Austra l ia

International Competitiveness Page 11
CONVERGENCE AMONG MANUFACTURINGINDUSTRIES
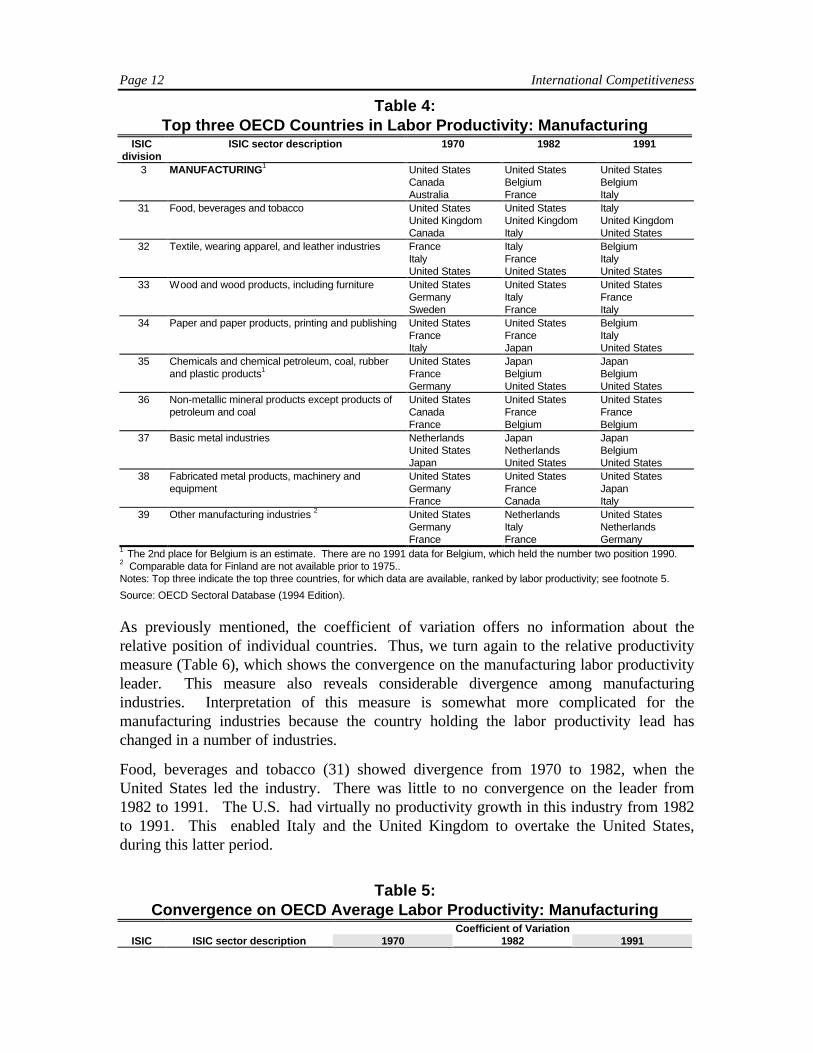
Table 4 shows labor productivity leadership in nine Manufacturing (3) industries. U.S.labor productivity was among the top three in all nine industries in both 1970 and in 1991.In 1970, the United States led labor productivity rankings in seven of nine manufacturingindustries. By 1991, the United States’ ranking had fallen in the following four industries:Food, beverages and tobacco (31); Paper and paper products, printing and publishing(34); Chemicals and chemical petroleum, coal, rubber and plastic products (35); and Basicmetal industries (37).15 In 1991, the United States continued to lead Fabricated metalproducts, machinery and equipment (38), Non-metallic mineral products except productsof petroleum and coal (36), Wood and wood products, including furniture (33), and Othermanufacturing industries (39).
France ranked among the top three productivity leaders in six manufacturing sectors in1970, but in 1991 was only among the top three in two industries. In contrast, Belgium,in 1970, was not among the top three in any manufacturing industries. By 1991, Belgiumhad moved into top three positions in five industriesChemicals and chemical petroleum,coal, rubber and plastic products (35), Paper and paper products, printing and publishing(34), Basic metal industries (37), Textile, wearing apparel, and leather industries (32), andNon-metallic mineral products except products of petroleum and coal (36).
Japan was among the top three in labor productivity in two manufacturing industries in1970. By 1991, Japan had also moved into a top three position in Fabricated metalproducts, machinery and equipment (38). In 1970, Germany was among the top threecountries in labor productivity in four manufacturing industries, but by 1991 dropped outof the top three group in all but Other manufacturing industries (39).
Table 5 shows the coefficient of variation for nine manufacturing industries. By thismeasure, between 1970 and 1982, there was divergence in three industries: Food,beverages and tobacco (31), Textile, wearing apparel, and leather industries (32) andChemicals and chemical petroleum, coal, rubber and plastic products (35). Between 1982and 1991 divergence from the OECD average occurred in five of the nine sectors ofmanufacturing: Textile, wearing apparel, and leather industries (32); Wood and woodproducts, including furniture (33); Paper and paper products, printing and publishing (34);Non-metallic mineral products except products of petroleum and coal (36); and Fabricatedmetal products, machinery and equipment (38).
15 There was a sustained period of negative or near zero productivity growth in all of these U.S. industries except Chemicalsand chemical petroleum, coal rubber and plastic products.
Page 12 International Competitiveness
Table 4:Top three OECD Countries in Labor Productivity: Manufacturing
ISICdivision
ISIC sector description 1970 1982 1991
3 MANUFACTURING1 United States United States United StatesCanada Belgium BelgiumAustralia France Italy
31 Food, beverages and tobacco United States United States ItalyUnited Kingdom United Kingdom United KingdomCanada Italy United States
32 Textile, wearing apparel, and leather industries France Italy BelgiumItaly France ItalyUnited States United States United States
33 Wood and wood products, including furniture United States United States United StatesGermany Italy FranceSweden France Italy
34 Paper and paper products, printing and publishing United StatesFrance
United StatesFrance
BelgiumItaly
Italy Japan United States35 Chemicals and chemical petroleum, coal, rubber
and plastic products1United StatesFrance
JapanBelgium
JapanBelgium
Germany United States United States36 Non-metallic mineral products except products of
petroleum and coalUnited StatesCanada
United StatesFrance
United StatesFrance
France Belgium Belgium37 Basic metal industries Netherlands Japan Japan
United States Netherlands BelgiumJapan United States United States
38 Fabricated metal products, machinery andequipment
United StatesGermany
United StatesFrance
United StatesJapan
France Canada Italy39 Other manufacturing industries 2 United States Netherlands United States
Germany Italy NetherlandsFrance France Germany
1 The 2nd place for Belgium is an estimate. There are no 1991 data for Belgium, which held the number two position 1990.2 Comparable data for Finland are not available prior to 1975..Notes: Top three indicate the top three countries, for which data are available, ranked by labor productivity; see footnote 5.
Source: OECD Sectoral Database (1994 Edition).
As previously mentioned, the coefficient of variation offers no information about therelative position of individual countries. Thus, we turn again to the relative productivitymeasure (Table 6), which shows the convergence on the manufacturing labor productivityleader. This measure also reveals considerable divergence among manufacturingindustries. Interpretation of this measure is somewhat more complicated for themanufacturing industries because the country holding the labor productivity lead haschanged in a number of industries.
Food, beverages and tobacco (31) showed divergence from 1970 to 1982, when theUnited States led the industry. There was little to no convergence on the leader from1982 to 1991. The U.S. had virtually no productivity growth in this industry from 1982to 1991. This enabled Italy and the United Kingdom to overtake the United States,during this latter period.
Table 5:Convergence on OECD Average Labor Productivity: Manufacturing
Coefficient of VariationISIC ISIC sector description 1970 1982 1991

International Competitiveness Page 13
division3 Manufacturing 0.212 0.182 0.20831 Food, Beverages and Tobacco 0.264 0.282 0.28132 Textile, wearing apparel, and leather
industries0.231 0.244 0.295
33 Wood and wood products, includingfurniture
0.295 0.208 0.210
34 Paper and paper products, printingand publishing
0.211 0.194 0.210
35 Chemicals and chemical petroleum,coal, rubber and plastic products
0.378 0.421 0.402
36 Non-metallic mineral productsexcept products of petroleum andcoal
0.242 0.174 0.238
37 Basic metal industries 0.397 0.358 0.20138 Fabricated metal products,
machinery and equipment0.235 0.170 0.285
39 Other manufacturing industries1 0.429 0.385 0.3491 Comparable data for Finland are not available prior to 1975..
Note: Calculations made for all countries for which data are available; see footnote 5. Divergence from one period to the nextshown in bold.
Source: OECD Sectoral Database (1994 Edition).
Table 6:Convergence on Labor Productivity Leader: Manufacturing
1970 1982 1991ISIC
divisionISIC sector description Leader Relative
Prod.Leader Relative
Prod.Leader Relative
Prod.3 MANUFACTURING United States 0.652 United States 0.733 United States 0.67731 Food, beverages and tobacco United States 0.660 United States 0.629 Italy 0.64832 Textile, wearing apparel, and leather
industriesFrance 0.772 Italy 0.717 Belgium 0.680
33 Wood and wood products, includingfurniture
United States 0.590 United States 0.674 United States 0.801
34 Paper and paper products, printingand publishing
United States 0.627 United States 0.662 Belgium 0.780
35 Chemicals and chemical petroleum,coal, rubber and plastic products
United States 0.540 Japan 0.509 Japan 0.463
36 Non-metallic mineral productsexcept products of petroleum andcoal
United States 0.631 United States 0.741 United States 0.706
37 Basic metal industries Netherlands 0.559 Japan 0.551 Japan 0.64938 Fabricated metal products,
machinery and equipmentUnited States 0.643 United States 0.786 United States 0.624
39 Other manufacturing industries1 United States 0.622 Netherlands 0.728 United States 0.6281 Comparable data for Finland are not available prior to 1975..Note: Calculations made for all countries for which data are available; see footnote 5. Divergence from one period to the next
shown in bold.
Source: OECD Sectoral Database (1994 Edition).
Textile, wearing apparel, and leather industries (32) shows divergence by both measuresfrom 1982 to 1991. In textiles industries, the United States had steady productivitygrowth during this latter period and continued to rank third. The United States has not,however matched the rapid productivity growth in other countries, particularly laborproductivity growth in Belgium from 1985 onward.
Both Wood and wood products, including furniture (33) and Paper and paper products,printing and publishing (34) show divergence from 1982 to 1991 as measured by thecoefficient of variation, but not by the relative productivity measure. The divergence in
Page 14 International Competitiveness
the wood industries was caused by increasing convergence on the large 1982 UnitedStates lead by a few countries while other countries were experiencing little productivitygrowth. The divergence in the coefficient of variation for Paper and paper products,printing and publishing (34) industries was caused by slow labor productivity in Denmarkand Norway. These countries did not keep up with the growth in the other OECDcountries, causing divergence from the OECD mean. Labor productivity in the majority ofOECD countries converged due to strong labor productivity growth in the majority ofthem. The United States, which had a strong lead in 1983, had virtually no productivitygrowth from 1983 through 1991. This enabled Belgium and Italy to overtake the UnitedStates in the late 1980s.
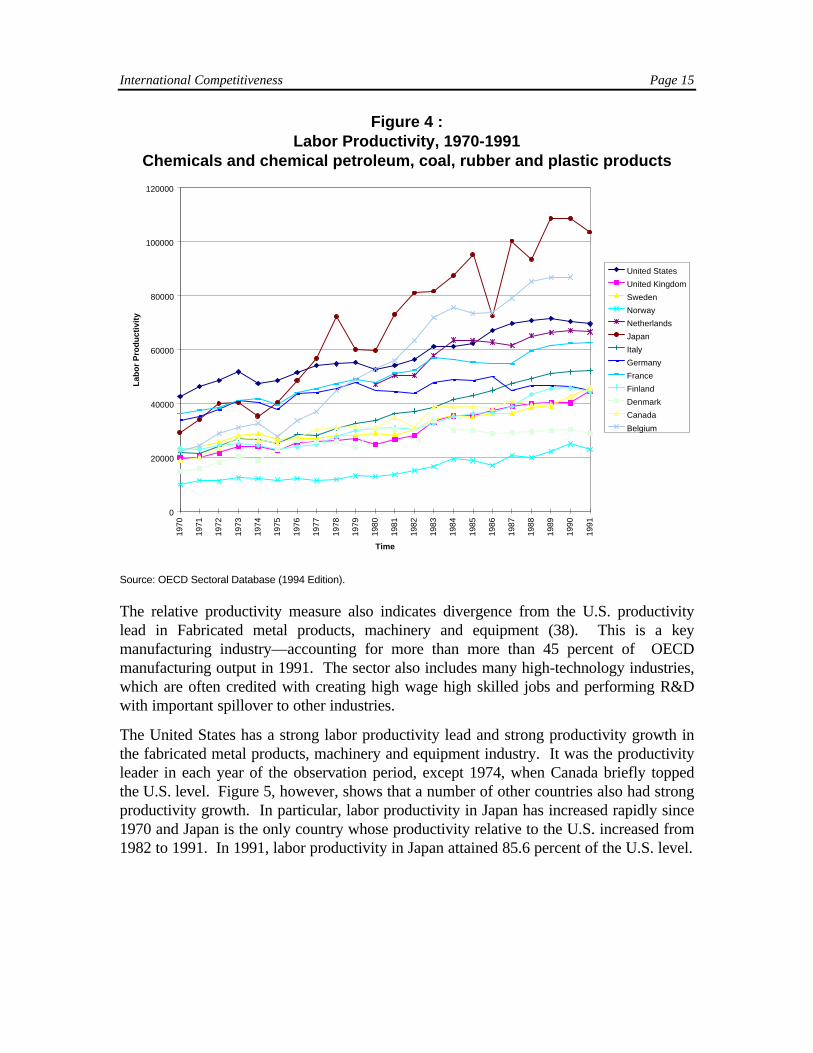
Chemicals and chemical petroleum, coal, rubber and plastic products (35), showsdivergence from the average from 1970 to 1982. Chemicals also show divergence fromthe leader, Japan, from 1970 to 1991. (Japan took the labor productivity lead from theUnited States in 1978.) (Figure 4). Both Japan and Belgium have had stronger laborproductivity growth than the United States, since the mid-1970s. Japan has also taken astrong lead in Basic metal industries (37) and pulled far ahead of the other OECDcountries.
From 1982 to 1991, there was also divergence from the U.S. lead in three industries: Non-metallic mineral products except products of petroleum and coal (36), Fabricated metalproducts, machinery and equipment (38), and Other manufacturing industries (39). InNon-metallic mineral products except products of petroleum and coal (36) the UnitedStates, France, and Belgium, together, led other OECD countries. In Other manufacturingindustries (39), the divergence from the U.S. lead, from 1983 to 1991 has been minor.
International Competitiveness Page 15
Figure 4 :Labor Productivity, 1970-1991
Chemicals and chemical petroleum, coal, rubber and plastic products
0
20000
40000
60000
80000
100000
12000019
70
1971
1972
1973
1974
1975
1976
1977
1978
1979
1980
1981
1982
1983
1984
1985
1986
1987
1988
1989
1990
1991
Time
Lab
or
Pro
du
ctiv
ity
United States
United Kingdom
Sweden
Norway
Netherlands
Japan
Italy
Germany
France
Finland
Denmark
Canada
Belgium
Source: OECD Sectoral Database (1994 Edition).
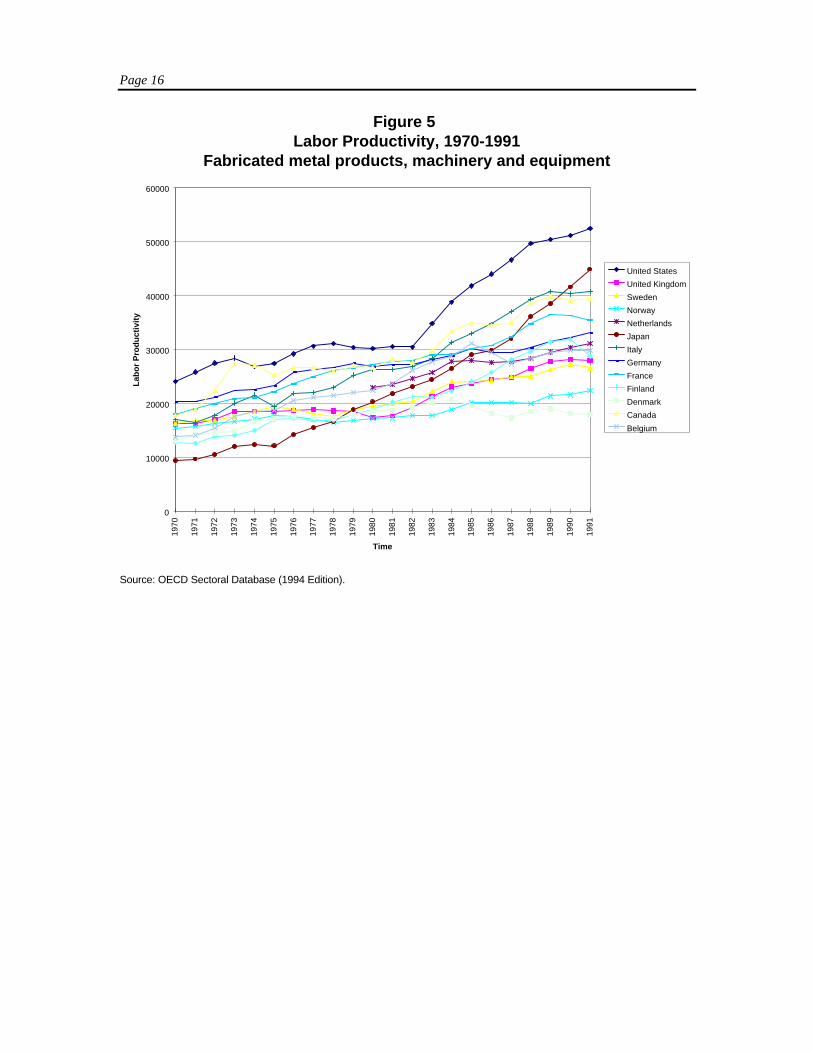
The relative productivity measure also indicates divergence from the U.S. productivitylead in Fabricated metal products, machinery and equipment (38). This is a keymanufacturing industry—accounting for more than more than 45 percent of OECDmanufacturing output in 1991. The sector also includes many high-technology industries,which are often credited with creating high wage high skilled jobs and performing R&Dwith important spillover to other industries.
The United States has a strong labor productivity lead and strong productivity growth inthe fabricated metal products, machinery and equipment industry. It was the productivityleader in each year of the observation period, except 1974, when Canada briefly toppedthe U.S. level. Figure 5, however, shows that a number of other countries also had strongproductivity growth. In particular, labor productivity in Japan has increased rapidly since1970 and Japan is the only country whose productivity relative to the U.S. increased from1982 to 1991. In 1991, labor productivity in Japan attained 85.6 percent of the U.S. level.
Page 16
Figure 5Labor Productivity, 1970-1991
Fabricated metal products, machinery and equipment
0
10000
20000
30000
40000
50000
60000
1970
1971
1972
1973
1974
1975
1976
1977
1978
1979
1980
1981
1982
1983
1984
1985
1986
1987
1988
1989
1990
1991
Time
Lab
or
Pro
du
ctiv
ity
United States
United Kingdom
Sweden
Norway
Netherlands
Japan
Italy
Germany
France
Finland
Denmark
Canada
Belgium
Source: OECD Sectoral Database (1994 Edition).

Page 17
CONCLUSION
The United States led other major OECD countries in overall labor productivity from
converged both towards the mean OECD labor productivity and on the U.S. level of laborproductivity. This suggests living standards among the OECD countries are indeed
of convergence slowed after 1982. The industrial components of aggregate laborproductivity offer insight into the causes of this convergence slowdown. Although most
groups—Manufacturing (3) and Finance, insurance and real estate and business services(8)—did not. Rapid growth in Japanese labor productivity created the divergence inFinance, insurance and real estate and business services (8). High initial labor productivityin the United States combined with strong productivity growth, especially in the fabricatedmetal products, machinery and equipment (38) industry, together with divergence in a fewother, smaller, industries, was sufficient to create divergence in Manufacturing (3), as awhole. ISIC 38 includes most of the key high-technology manufacturing industries.
In 1991, the United States was among the labor productivity leaders in almost all of themanufacturing industries. It was, however, no longer the unequivocal labor productivityleader in all manufacturing industries. Other countries had overtaken U.S. laborproductivity in four of the nine industries. Japan, for example, had a dominant laborproductivity lead in Chemicals and chemical petroleum, coal, rubber and plastic products(35). The United States widened its lead in Fabricated metal products, machinery andequipment (38). The United States’ labor productivity performance in this industry waslargely responsible for its continued leadership in overall manufacturing productivity.
Labor productivity is a key measure of national competitiveness. The slow down ofOECD convergence on the overall U.S. level of labor productivity since 1982 is a sign ofcontinued U.S. competitiveness. These results suggest that the pundits of the 1980s weretoo quick to point to the demise of the U.S. competitiveness. This analysis shows thatalthough the United States’ overall labor productivity lead is not as overwhelming as itonce was, it is still significant. The United States continues to lead in labor productivityoverall and in many individual industries.

18 International Competitiveness

International Competitiveness Page 19
REFERENCES
Abramovitz, Moses. “Catching Up, Forging Ahead, and Falling Behind.” Journal of Economic History.
Baumol, William J. “Productivity Growth, Convergence, and Welfare: What the LongRun Data Show.” 76 (December 1986): 1072-1084.
Bureau of Labor Statistics, “International Comparisons of Manufacturing Productivity and
Cohen, Stephen S., John Zysman, Manufacturing Matters: The Myth of the Post Industrial Economy. New York: BasicBooks Inc. Publishers, 1987.
Dertouzos, Michael L., Richard K. Lester, Robert M. Solow. Made in America: Regaining the Productive Edge.Cambridge, MA: The MIT Press, 1989.
Dollar, David, Edward N. Wolff. “Convergence of Industry Labor Productivity AmongAdvanced Economies, 1963-1982.” The Review of Economics and Statistics. LXX (November 1988):549-558.
Dollar, David, Edward N. Wolff. Competitiveness, Convergence, and International Specialization. Cambridge, MA: TheMIT Press, 1993.
Nelson, Richard R., Gavin Wright. “The Rise and Fall of American Leadership: ThePostwar Era in Historical Perspective.” Journal of Economic Literature. XXX (December 1992):1931-1964.
Nelson, Richard. “Recent Writings on Competitiveness: Boxing the Compass.” CaliforniaManagement Review. (Winter 1992): 127-137.
Organization for Economic Co-Operation and Development. The International SectoralDatabase (1994 Edition). Paris: OECD, 1994.
Porter, Michael E. The Competitive Advantage of Nations. New York: The Free Press, 1990.
U.S. Department of Commerce. “Service Industries and Economic Performance.” Studies ofIndustrial Performance and Economic Growth. Office of Policy Development, Economics and StatisticsAdministration (March 1996).