Embed Size (px)
Citation preview
Abstract—The paper presents surface integrity analysis in high
speed machined titanium alloy. The experiments were conducted in dry environment. Response surface method based CCD was used to analyse the effect of machining parameters on surface roughness, degree of work hardening and the induced residual stresses after machining. The analysis of results shows a micro deformation layer up to a depth of 200 µm influencing the microhardness and residual stresses. The degree of work hardening in this layer is found to influence by the machining conditions up to a depth of 100 µm beneath the machined surface. Predominant thermal softening effect at higher cutting speed causes the restructuring of the micro deformation layer. Thus the machined surface shows less alterations and correspondingly lower surface roughness. Higher cutting speed also favours induction of higher compressive residual stresses.
Keywords— Titanium alloy, Surface roughness, Degree of work hardening, Residual stress, RSM.
I. INTRODUCTION
IGH speed turning is a recent technology growing rapidly in the industries manufacturing aerospace, defense, and
missile components. The definition of high speed machining is complex and differs from material to material, viz. the range of high speed machining for aluminum begins above 500-1000 m/min, whereas it is 10-50 m/min for titanium and Inconel alloys. The behaviour of work material changes with the change in cutting speed and therefore the transition of chips from continuous to shear localized is also different for different materials [1]. One of the major benefits of cutting at higher speed is the reduction of cutting forces leading to improvement in surface integrity in terms of lower cutting force magnitude, fine surface finish, and lower depth of deformation in the machined subsurface [1]. It is evident from the past studies that the conventional flood coolant applied during high speed machining is less efficient and could not penetrate to the chip-tool interface and does not fulfill the intention of cooling the work material and cutting tool. Further, the stringent regulations led by the government on the use of coolant in machining also compel manufacturers to carry out machining without coolant [2]. Keeping this in mind, dry machining experiments is planned for the present work.
Raju Pawade is with Dr. Babasaheb Ambedkar Technological University,
Lonere, Raigad MS India 402 103 (phone: 91-2140-275028; fax: 91-2140-275142; e-mail: [email protected]).
Rajendra Pawar was with Dr. Babasaheb Ambedkar Technological University, Lonere for PG studies. He is now with the G. H. Acharya College of Engineering, Selu, Karjat, Mumbai MS India (e-mail: rajpawar2302 @yahoo.co.in).
Surface integrity of the machined component is a critical parameter deciding the component performance, reliability, and service life. Surface integrity represents the nature of surface condition of a workpiece after manufacturing processes. There are two aspects to surface integrity i.e. surface topography characteristics and subsurface layer characteristics. The surface topography comprises of surface roughness, waviness, form errors, and flaws [3]. The subsurface layer characteristics that can change due to processing include plastic deformation, residual stresses, cracks, hardness, overaging, phase changes, recrystalization, and inter-granular attack. All these microstructural related events further cause residual stresses and the changes in microhardness.
It is known that the titanium alloys have poor machinability due to generation of high cutting temperature, short chip tool contact length and low elastic modulus. During machining of titanium alloy, very high cutting temperatures are generated. This acts close to the cutting edge of the tool. A large proportion (about 80%) of the heat generated is conducted into the tool because it cannot be removed with the fast flowing chip or into the workpiece due to low thermal conductivity of these materials. Other problems that encountered is the smaller heat affected zone acting closer to the cutting edge while machining due to thinner chips which are produced on account of short chip-tool contact length, besides the presence of a very thin flow zone between the chip and the tool. Further low modulus of elasticity of these alloys proves to chatter formation during finish machining [4]. The research has been started in and is continued till date to explore the various aspects of titanium alloy (Ti-6Al-4V) during and after machining. These studies were focused on the various issues such as machining mechanisms (Chip formation), machining mechanics (cutting force generated, temperature measurement and prediction) and surface and sub- surface integrity that covers the assessment of surface roughness, examining the surface alterations, evaluation of microhardness and deformation of the surface and subsurface and assessment of the residual stresses induced due to machining [5],[6],[7],[8], [9],[10],[11],[12].
As far as the open literature is concerned, studies on surface integrity assessment on this alloy are relatively less than that of mechanism and mechanics of the machining. Very few studies are dealt with the evaluation of surface roughness. These studies are insufficient to understand in detail the mechanism of surface generation and the resultant surface integrity. The following paragraph highlight some investigations on surface integrity.
Rajendra Pawar and Raju Pawade
Surface Integrity Analysis in Dry High Speed Turning of Titanium Alloy Ti-6Al-4V
H
International Conference on Trends in Industrial and Mechanical Engineering (ICTIME'2012) March 24-25, 2012 Dubai
190

Che-Haron [8] performed the experimental study on machining of titanium alloy using plain tungsten carbide tools. While assessing the effect of cutting speed on surface roughness, it is found that the higher surface roughness was produced at a lower cutting speed of 60 m/min. However, as the cutting speed increased to 90 m/min, the roughness decreases. The chemical reactivity of the work material increases further with higher speed of 110 m/min and thus the rapid deterioration of the cutting tool occur. As a result the surface roughness increases.
Fig. 1 Surface integrity measurable parameters
Zoya and Krishnamurthy [7] during turning noted that the surface finish improved with a cutting speed of 185 m/min with tool. But above this cutting speed, the surface roughness increases exponentially. Ezugwu [13] during their experimental studies on titanium machining with different CBN tools found that the surface roughness increases with an increase in the cutting speed. Ribeiro et al. [10] during machining with conventional uncoated carbides found that the surface roughness decreases when cutting speed increases from 55 m/min to 90 m/min. However they found the sudden increase in surface roughness at 110 m/min. Nabhani [14] investigated the effect of type of cutting tool on surface roughness during series of single-point turning of rolled and annealed TA48 titanium alloy with PCBN and PCD tools .They found that the surface finish of the workpiece achieved by PCD is better than CBN and coated carbide tools. Few authors have demonstrated the application of different machining environments during machining of titanium alloys. Ibrahim et al. [15] found that the surface roughness is higher at the beginning and then regularly decreases thereafter it remains stable follwed by reduction at the final stage when machining Ti6Al4V-EL1 alloy with coated carbide tools in dry machining.
Among the studies reported on surface integrity, very few studies are dealt with the assessment of surface alterations. Ezugwu [16] studied the effect of process parameters on the surface damage produced in machining of titanium alloy with
PCD tools. They found that the surface generated consists of well-defined uniform feed marks running perpendicular to the tool feed direction. The major surface damages observed after machining were feed marks, micro pits and the re-deposited chip fragments on the machined surfaces. They observed that the deformation of feedmarks is seen at higher coolant pressure, 20.3 MPa. On the other hand, reduction in coolant pressure to 11MPa reduces the feed mark intensity and few micropits. It is observed that the surfaces show light feed marks, when machining was performed at 175 m/min. But the deep feedmarks are seen at 200 m/min.
There are very few studies that reported the work hardening behaviour after machining of titanium alloys. Che-Haron [8] have conducted turning of titanium Ti 64 alloy using two different types of carbide inserts. As far as the magnitude of microhardness is concerned the highest value of microhardness was recorded 420 HV as compared to the bulk material hardness of 340 HV. They varied the feed rate from 0.25 mm /rev to 0.35 mm/rev during the experiments. It is observed that higher feedrate values produce the highest microhardness of the surface and sub-surface.
Further the effect of cutting time on microhardness variation at constant cutting speed (100 m/min) is examined by Che-Haron and Jawaid [16] during machining of Ti-64 titanium alloy. It is observed that when the cutting continues up to10 sec, the increase in microhardness value was relatively less (360 HV) as compared to the higher values of microhardness (390 HV) when the machining is prolonged up to 30 sec. They found that increasing the cutting speed created higher microhardness values, while increasing the feed rate had a minimal effect on the microhardness. Ibrahim et al. [15] during machining of Titanium alloy with coated carbide tool reported that as the cutting speed increases from 55 m/min to 75 m/min and further to 95 m/min, the rate of work hardening increases.
It is seen from the literature that very few authors have demonstrated the effect of machining parameters on machining induced residual stresses. As far as the work material is concerned, hardly there are investigations on residual stress analysis in turning of titanium alloy Ti-6Al-4V. However, studies on induction of machining residual stresses found on the similar material like Superalloy Inconel 718. Pawade et al. [17] studied the effect of cutting speed on induction of residual stresses in machining of Inconel 718. As the cutting speed changes from 125 to 300 m/min, the residual stresses increase in the tensile direction, whereas when the cutting speed increases from 300 to 475 m/min, the residual stresses change direction from tensile to compressive. Sharman et al. [18] reported the behaviour of residual stress induction in surface and subsurface during turning of Inconel 718. As far as the pattern of residual stress is concerned tensile residual stresses were produced on the machined surface whereas the stress changes to compressive in nature around 30 to 40 µm beneath the machined surface. It’s magnitude increases in compressive direction till 50 to 60 micron beneath the machined surface further it starts decreasing in compressive direction and changes to tensile in nature around
Surface and subsurface integrity
Surface roughness
Surface damage
Work hardening
Residual stresses
International Conference on Trends in Industrial and Mechanical Engineering (ICTIME'2012) March 24-25, 2012 Dubai
191

125 micron beneath the surface. In the case of effect of cutting speed on residual stresses, it is observed that the surface tensile residual stresses decrease from 600 MPa to 200 MPa, when the cutting speed increases from 40 to 120 m/min for the similar cutting condition. Pawade et al. [17] during machining of Inconel 718 observed that there is a reversal of residual stress from compressive to tensile direction when the feedrate changes from 0.05 to 0.1 mm/rev. But, further increase in the feedrate to 0.15 mm/rev shows a small increase in the residual stresses in tensile direction. Sharman et al. [18] has conducted turning on Inconel 718TM. They observed that the lower feedrate resulted in lower tensile surface residual stresses. As the feed rate was increased, tensile stress at the surface and the depth of the compressive layer both increased slightly. Further increase in feedrate resulted in an increase in both the depth of deformation of the microstructure and the cutting forces, which led to the increased residual stress levels. Effect of depth of cut on residual stress induction has been explained by Pawade et al. [17] in machining of Inconel 718. They reported that when the depth of cut changes from 0.50 to 0.75 mm, the residual stress changes from tensile to compressive. With further increase in the depth of cut to 1 mm, it results into higher values of compressive residual stresses.
It is thus revealed that the surface topography in terms of surface roughness and surface damage has been a topic of very few research investigations. Further limited information is available on surface and sub-surface integrity in terms of microhardness changes and residual stress variations in machining of titanium alloy. Therefore the objective of the present research is to understand the effect of processing parameters on surface roughness, surface alterations, work hardening behavior and the induction of residual stresses after machining.
II. EXPERIMENTAL WORK
The machined surface integrity is measured in terms of post machining characteristics which includes the measurement of surface roughness, surface alterations, microhardness changes and surface residual stresses induced in the machined surfaces. In this work, central composite design (CCD) of response surface method is chosen to analyse the effect of process parameters and optimizing the response variables that induce higher surface integrity.
A. Experimental Strategy
Response surface method (RSM) were originally developed to analyze experimental data and to create empirical models of the observed response values [19]. RSM is a collection of mathematical and statistical procedures and is good for the modelling and analysis of problems in which the desired response is affected by several variables. In this study, the approximation of the mathematical model will be proposed using the fitted second-order polynomial regression model, which is called the quadratic model. The necessary data for building the response model are generally collected by the experimental design [19]. In this study, the experimental design adopts the centred central composite design (CCD) in
order to fit the quadratic model of the RSM. The factorial portion of CCD is a full factorial design with all combinations of the factors at two levels (high, +1.168 and low, −1.168).
This type of design is commonly called the rotatable CCD. The success of RSM design depends upon one’s ability to develop a suitable approximation to the true response function. Polynomials are usually good choices when such approximations are needed and the most common forms used for response surface designs are linear and quadratic regressions. With the consideration of higher-order terms and interactions between factors, quadratic models usually fit the responses better than linear models do. Because of the curvature in the system, a quadratic model employed and takes the form as (1):
iijxixjbiixiy
i
k
i
k
ixi
1
2
1 (1) where β represents coefficients for control variables x and i
denotes the random error. In this research three process related parameters i.e. cutting
speed, feedrate and depth of cut were identified that have significant effect on the machining mechanism and consequently on the generation of machined surface. The maximum and minimum values of these factors are selected from the earlier experimental results that produce better surface finish while machining of titanium alloy. Further to determine the intermediate levels of the selected factors a parameter ‘α’ were calculated and using a CCD rotatable design the levels of the input parameter were determined. In this case we have 3 parameters and 2 levels each, thus a 23 factorial design (CCD) can be possible. Hence, the parameter ‘α’ can be calculated as 1.682.
TABLE I PARAMETERS WITH CODED VALUES
Parameters Cutting speed Depth of cut Feedrate
Coded value
1.682 190 0.8 0.1
1 180 0.7 0.0875
0 170 0.6 0075
-1 160 0.5 0.0625
-1.682 150 0.4 0.05
In the present work, the focus is on surface roughness,
degree of work hardening, and the residual stresses induced due to machining. Therefore these output indicators were selected as response variables for the quantitative analysis of surface integrity. The arithmetic average (centre line average of peak to valley)
surface roughness (Ra) was selected as a response variable and is measured in µm. An empirical formula shown (2) proposed in the fundamental metal cutting for turning operation is [20].
r
fRa 32
2
(2)
International Conference on Trends in Industrial and Mechanical Engineering (ICTIME'2012) March 24-25, 2012 Dubai
192
where f is the feedrate in mm/rev, and r is the corner radius of the cutting tool.
Degree of work hardening represents the amount of severity that the material gets work hardened due to machining. The microhardness of the machined surface can be used to determine the work hardening behaviour of the machined surface and subsurface. In this study the degree of work hardening (DWH) was selected as a response variable for quantitative measurement of surface integrity of the machined surface.It is expressed by (3) in the following formula [21].
100(%) ×−
=b
bs
MHMHMHDWH (3)
whereMHs is microhardness of surface and MHb is the microhardness of bulk material.
In this study, the surface residual stresses in biaxial direction were considered to be important response variables that quantify the surface integrity. A residual stress induced along circumferential direction (Hoop) as well as axial direction was taken for measurement using X- ray diffraction technique. These are the stresses that remain in material or body even after the external load is removed. It is the arithmetic average stress in a volume of material defined by the irradiated area and depth of penetration of the X-ray beam.
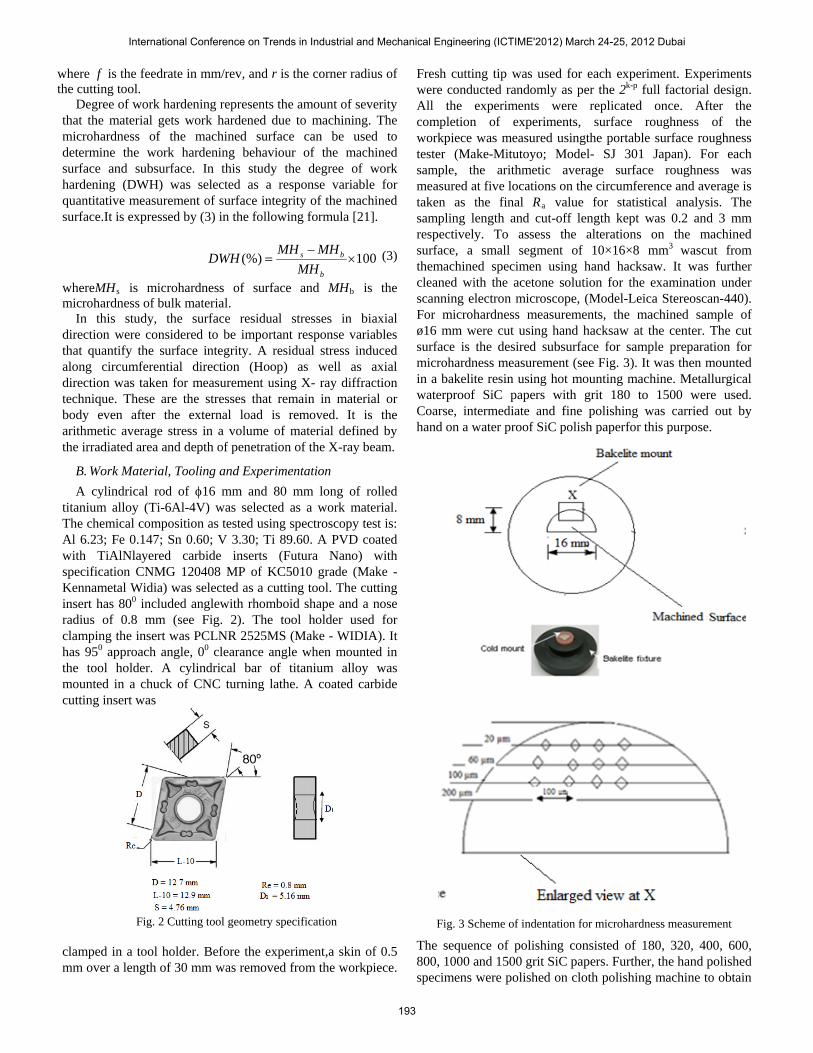
B. Work Material, Tooling and Experimentation A cylindrical rod of φ16 mm and 80 mm long of rolled
titanium alloy (Ti-6Al-4V) was selected as a work material. The chemical composition as tested using spectroscopy test is: Al 6.23; Fe 0.147; Sn 0.60; V 3.30; Ti 89.60. A PVD coated with TiAlNlayered carbide inserts (Futura Nano) with specification CNMG 120408 MP of KC5010 grade (Make - Kennametal Widia) was selected as a cutting tool. The cutting insert has 800 included anglewith rhomboid shape and a nose radius of 0.8 mm (see Fig. 2). The tool holder used for clamping the insert was PCLNR 2525MS (Make - WIDIA). It has 950 approach angle, 00 clearance angle when mounted in the tool holder. A cylindrical bar of titanium alloy was mounted in a chuck of CNC turning lathe. A coated carbide cutting insert was
Fig. 2 Cutting tool geometry specification
clamped in a tool holder. Before the experiment,a skin of 0.5 mm over a length of 30 mm was removed from the workpiece.
Fresh cutting tip was used for each experiment. Experiments were conducted randomly as per the 2k-p full factorial design. All the experiments were replicated once. After the completion of experiments, surface roughness of the workpiece was measured usingthe portable surface roughness tester (Make-Mitutoyo; Model- SJ 301 Japan). For each sample, the arithmetic average surface roughness was measured at five locations on the circumference and average is taken as the final Ra value for statistical analysis. The sampling length and cut-off length kept was 0.2 and 3 mm respectively. To assess the alterations on the machined surface, a small segment of 10×16×8 mm3 wascut from themachined specimen using hand hacksaw. It was further cleaned with the acetone solution for the examination under scanning electron microscope, (Model-Leica Stereoscan-440). For microhardness measurements, the machined sample of ø16 mm were cut using hand hacksaw at the center. The cut surface is the desired subsurface for sample preparation for microhardness measurement (see Fig. 3). It was then mounted in a bakelite resin using hot mounting machine. Metallurgical waterproof SiC papers with grit 180 to 1500 were used. Coarse, intermediate and fine polishing was carried out by hand on a water proof SiC polish paperfor this purpose.
(b)
Fig. 3 Scheme of indentation for microhardness measurement
The sequence of polishing consisted of 180, 320, 400, 600, 800, 1000 and 1500 grit SiC papers. Further, the hand polished specimens were polished on cloth polishing machine to obtain
International Conference on Trends in Industrial and Mechanical Engineering (ICTIME'2012) March 24-25, 2012 Dubai
193
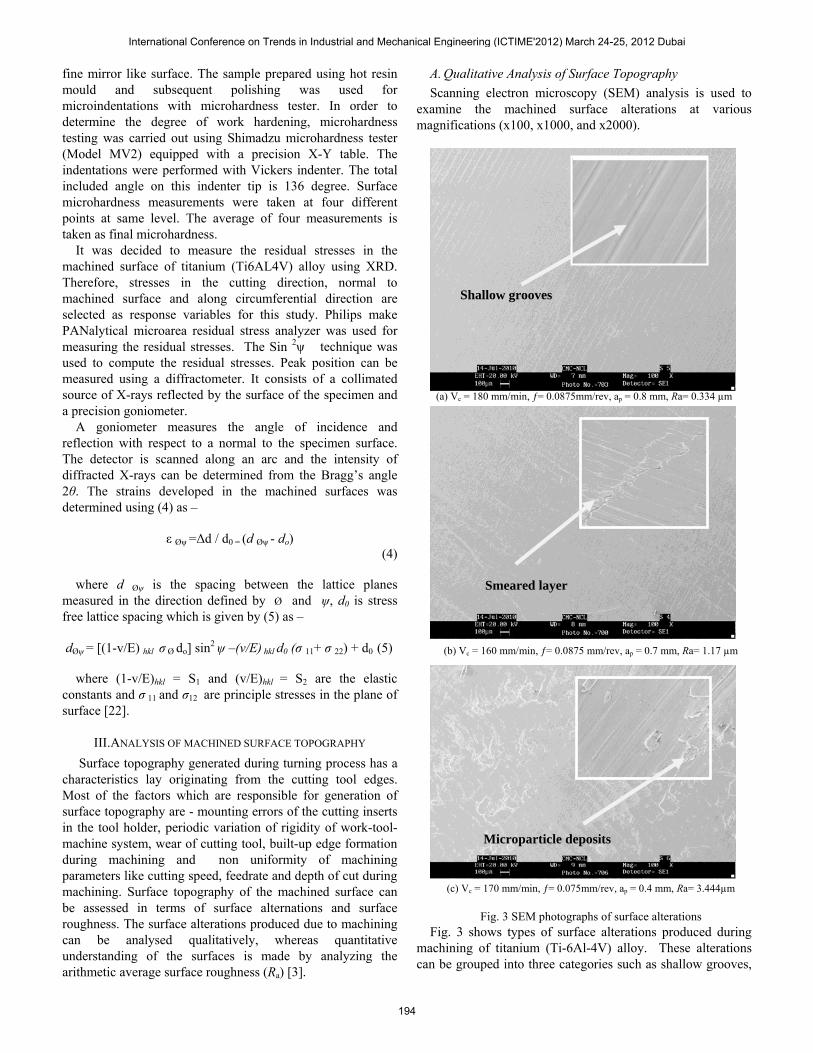
fine mirror like surface. The sample prepared using hot resin mould and subsequent polishing was used for microindentations with microhardness tester. In order to determine the degree of work hardening, microhardness testing was carried out using Shimadzu microhardness tester (Model MV2) equipped with a precision X-Y table. The indentations were performed with Vickers indenter. The total included angle on this indenter tip is 136 degree. Surface microhardness measurements were taken at four different points at same level. The average of four measurements is taken as final microhardness.
It was decided to measure the residual stresses in the machined surface of titanium (Ti6AL4V) alloy using XRD. Therefore, stresses in the cutting direction, normal to machined surface and along circumferential direction are selected as response variables for this study. Philips make PANalytical microarea residual stress analyzer was used for measuring the residual stresses. The Sin 2ψ technique was used to compute the residual stresses. Peak position can be measured using a diffractometer. It consists of a collimated source of X-rays reflected by the surface of the specimen and a precision goniometer.
A goniometer measures the angle of incidence and reflection with respect to a normal to the specimen surface. The detector is scanned along an arc and the intensity of diffracted X-rays can be determined from the Bragg’s angle 2θ. The strains developed in the machined surfaces was determined using (4) as –
ε Øψ =Δd / d0 = (d Øψ - do)
(4)
where d Øψ is the spacing between the lattice planes measured in the direction defined by Ø and ψ, d0 is stress free lattice spacing which is given by (5) as – dØψ = [(1-v/E) hkl σ Ø do] sin2 ψ –(v/E) hkl d0 (σ 11+ σ 22) + d0 (5) where (1-v/E)hkl = S1 and (v/E)hkl = S2 are the elastic constants and σ 11 and σ12 are principle stresses in the plane of surface [22].
III.ANALYSIS OF MACHINED SURFACE TOPOGRAPHY
Surface topography generated during turning process has a characteristics lay originating from the cutting tool edges. Most of the factors which are responsible for generation of surface topography are - mounting errors of the cutting inserts in the tool holder, periodic variation of rigidity of work-tool-machine system, wear of cutting tool, built-up edge formation during machining and non uniformity of machining parameters like cutting speed, feedrate and depth of cut during machining. Surface topography of the machined surface can be assessed in terms of surface alternations and surface roughness. The surface alterations produced due to machining can be analysed qualitatively, whereas quantitative understanding of the surfaces is made by analyzing the arithmetic average surface roughness (Ra) [3].
A. Qualitative Analysis of Surface Topography
Scanning electron microscopy (SEM) analysis is used to examine the machined surface alterations at various magnifications (x100, x1000, and x2000).
(a) Vc = 180 mm/min, ƒ= 0.0875mm/rev, ap = 0.8 mm, Ra= 0.334 µm
(b) Vc = 160 mm/min, ƒ= 0.0875 mm/rev, ap = 0.7 mm, Ra= 1.17 µm
(c) Vc = 170 mm/min, ƒ= 0.075mm/rev, ap = 0.4 mm, Ra= 3.444µm
Fig. 3 SEM photographs of surface alterations Fig. 3 shows types of surface alterations produced during
machining of titanium (Ti-6Al-4V) alloy. These alterations can be grouped into three categories such as shallow grooves,
Shallow grooves
Smeared layer
Microparticle deposits
International Conference on Trends in Industrial and Mechanical Engineering (ICTIME'2012) March 24-25, 2012 Dubai
194
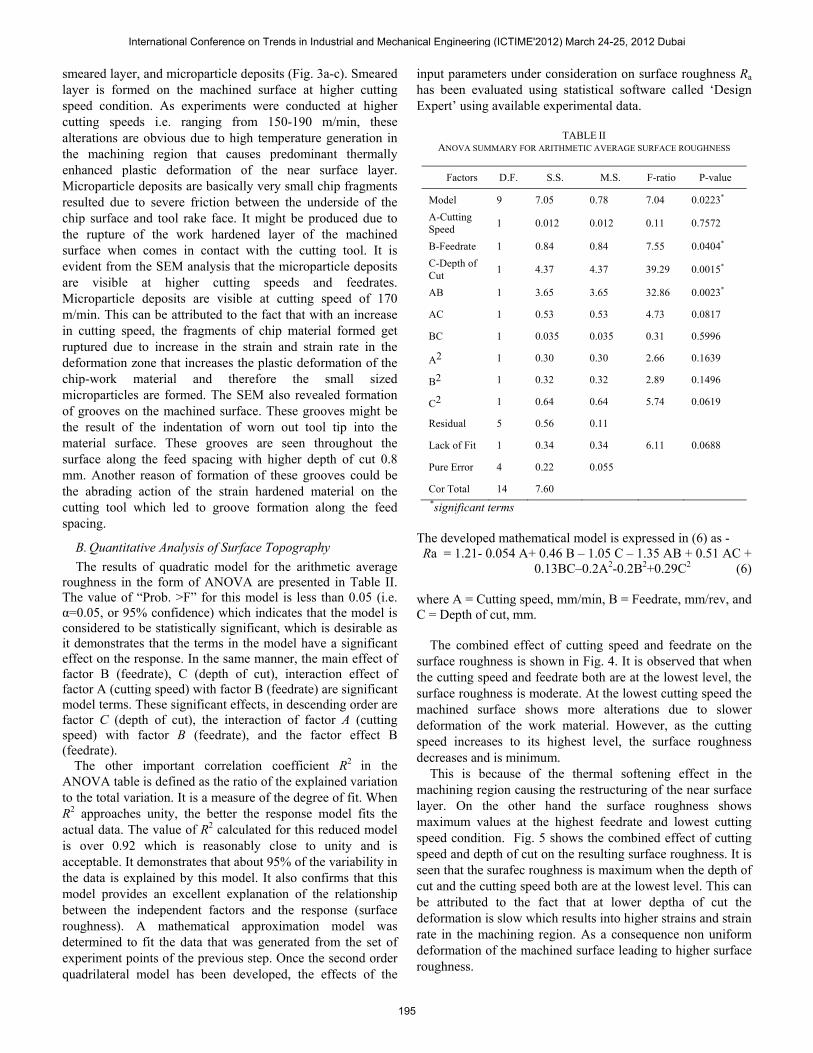
smeared layer, and microparticle deposits (Fig. 3a-c). Smeared layer is formed on the machined surface at higher cutting speed condition. As experiments were conducted at higher cutting speeds i.e. ranging from 150-190 m/min, these alterations are obvious due to high temperature generation in the machining region that causes predominant thermally enhanced plastic deformation of the near surface layer. Microparticle deposits are basically very small chip fragments resulted due to severe friction between the underside of the chip surface and tool rake face. It might be produced due to the rupture of the work hardened layer of the machined surface when comes in contact with the cutting tool. It is evident from the SEM analysis that the microparticle deposits are visible at higher cutting speeds and feedrates. Microparticle deposits are visible at cutting speed of 170 m/min. This can be attributed to the fact that with an increase in cutting speed, the fragments of chip material formed get ruptured due to increase in the strain and strain rate in the deformation zone that increases the plastic deformation of the chip-work material and therefore the small sized microparticles are formed. The SEM also revealed formation of grooves on the machined surface. These grooves might be the result of the indentation of worn out tool tip into the material surface. These grooves are seen throughout the surface along the feed spacing with higher depth of cut 0.8 mm. Another reason of formation of these grooves could be the abrading action of the strain hardened material on the cutting tool which led to groove formation along the feed spacing.
B. Quantitative Analysis of Surface Topography
The results of quadratic model for the arithmetic average roughness in the form of ANOVA are presented in Table II. The value of “Prob. >F” for this model is less than 0.05 (i.e. α=0.05, or 95% confidence) which indicates that the model is considered to be statistically significant, which is desirable as it demonstrates that the terms in the model have a significant effect on the response. In the same manner, the main effect of factor B (feedrate), C (depth of cut), interaction effect of factor A (cutting speed) with factor B (feedrate) are significant model terms. These significant effects, in descending order are factor C (depth of cut), the interaction of factor A (cutting speed) with factor B (feedrate), and the factor effect B (feedrate). The other important correlation coefficient R2 in the ANOVA table is defined as the ratio of the explained variation to the total variation. It is a measure of the degree of fit. When R2 approaches unity, the better the response model fits the actual data. The value of R2 calculated for this reduced model is over 0.92 which is reasonably close to unity and is acceptable. It demonstrates that about 95% of the variability in the data is explained by this model. It also confirms that this model provides an excellent explanation of the relationship between the independent factors and the response (surface roughness). A mathematical approximation model was determined to fit the data that was generated from the set of experiment points of the previous step. Once the second order quadrilateral model has been developed, the effects of the
input parameters under consideration on surface roughness Ra has been evaluated using statistical software called ‘Design Expert’ using available experimental data.
TABLE II
ANOVA SUMMARY FOR ARITHMETIC AVERAGE SURFACE ROUGHNESS
Factors D.F. S.S. M.S. F-ratio P-value
Model 9 7.05 0.78 7.04 0.0223*
A-Cutting Speed
1 0.012 0.012 0.11 0.7572
B-Feedrate 1 0.84 0.84 7.55 0.0404*
C-Depth of Cut
1 4.37 4.37 39.29 0.0015*
AB 1 3.65 3.65 32.86 0.0023*
AC 1 0.53 0.53 4.73 0.0817
BC 1 0.035 0.035 0.31 0.5996
A2 1 0.30 0.30 2.66 0.1639
B2 1 0.32 0.32 2.89 0.1496
C2 1 0.64 0.64 5.74 0.0619
Residual 5 0.56 0.11
Lack of Fit 1 0.34 0.34 6.11 0.0688
Pure Error 4 0.22 0.055
Cor Total 14 7.60 *significant terms
The developed mathematical model is expressed in (6) as - Ra = 1.21- 0.054 A+ 0.46 B – 1.05 C – 1.35 AB + 0.51 AC +
0.13BC–0.2A2-0.2B2+0.29C2 (6)
where A = Cutting speed, mm/min, B = Feedrate, mm/rev, and C = Depth of cut, mm.
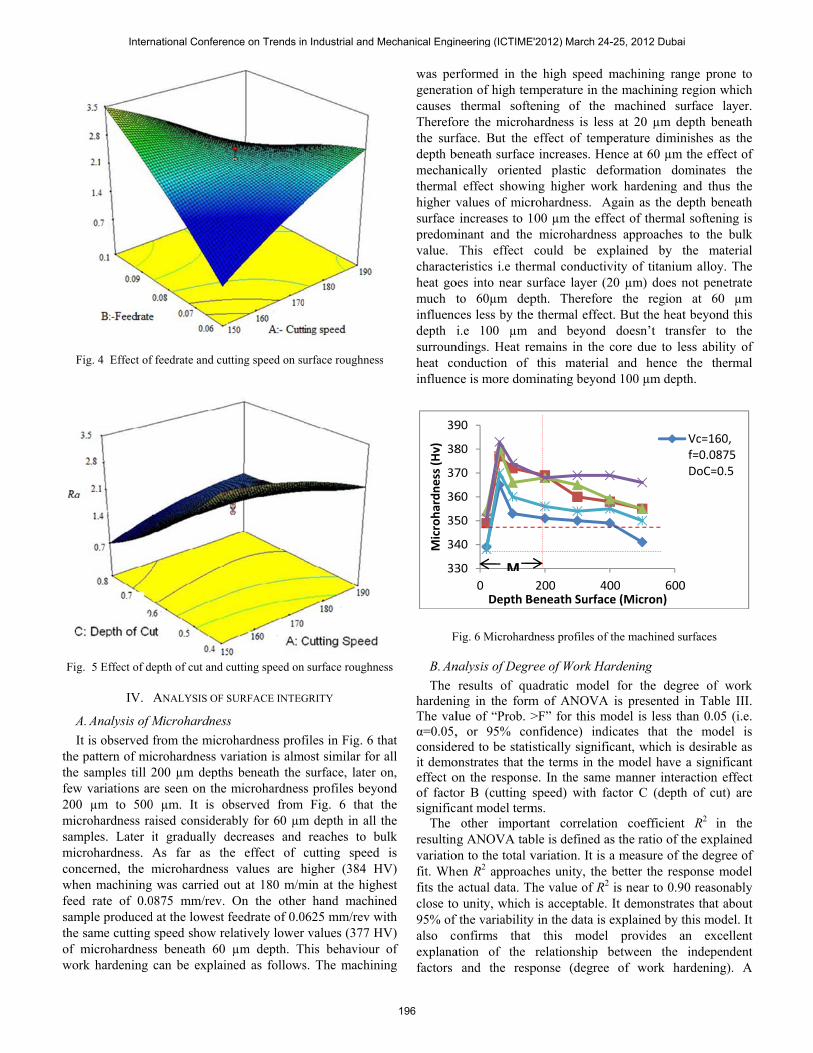
The combined effect of cutting speed and feedrate on the surface roughness is shown in Fig. 4. It is observed that when the cutting speed and feedrate both are at the lowest level, the surface roughness is moderate. At the lowest cutting speed the machined surface shows more alterations due to slower deformation of the work material. However, as the cutting speed increases to its highest level, the surface roughness decreases and is minimum.
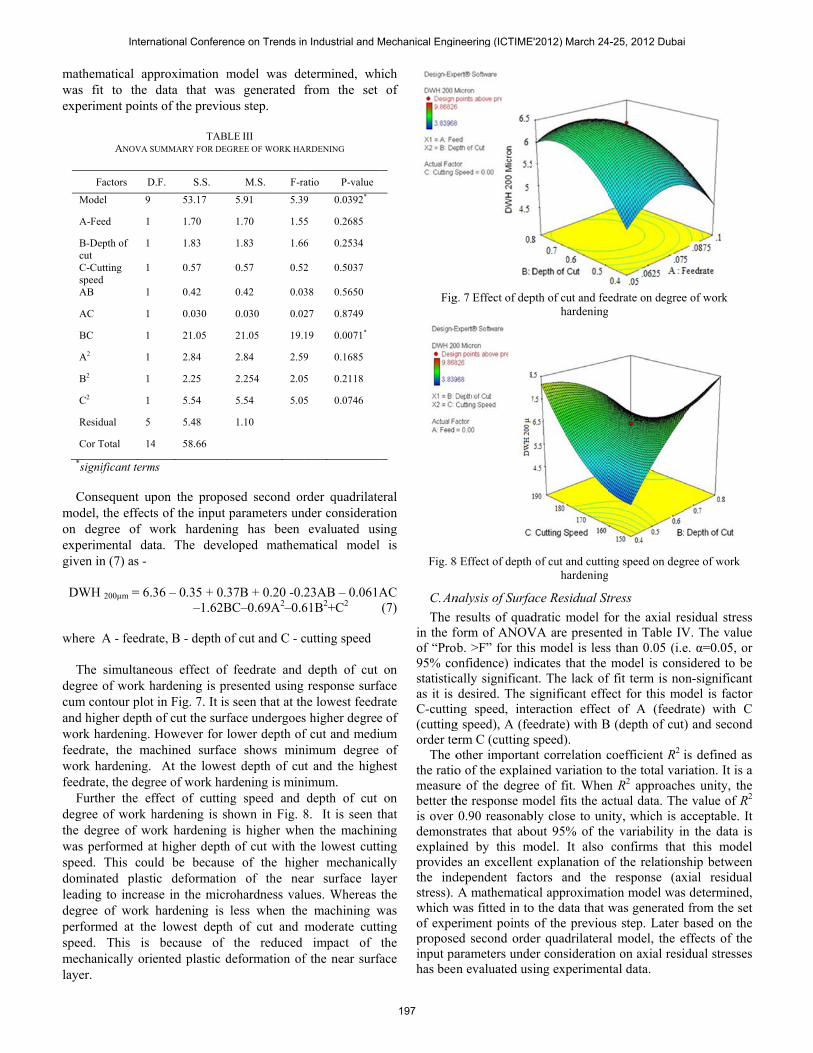
This is because of the thermal softening effect in the machining region causing the restructuring of the near surface layer. On the other hand the surface roughness shows maximum values at the highest feedrate and lowest cutting speed condition. Fig. 5 shows the combined effect of cutting speed and depth of cut on the resulting surface roughness. It is seen that the surafec roughness is maximum when the depth of cut and the cutting speed both are at the lowest level. This can be attributed to the fact that at lower deptha of cut the deformation is slow which results into higher strains and strain rate in the machining region. As a consequence non uniform deformation of the machined surface leading to higher surface roughness.
International Conference on Trends in Industrial and Mechanical Engineering (ICTIME'2012) March 24-25, 2012 Dubai
195
F
Fi
A
thethefew20misammiconwhfeesamtheof wo
Fig. 4 Effect of
ig. 5 Effect of de
IV.
A. Analysis of M
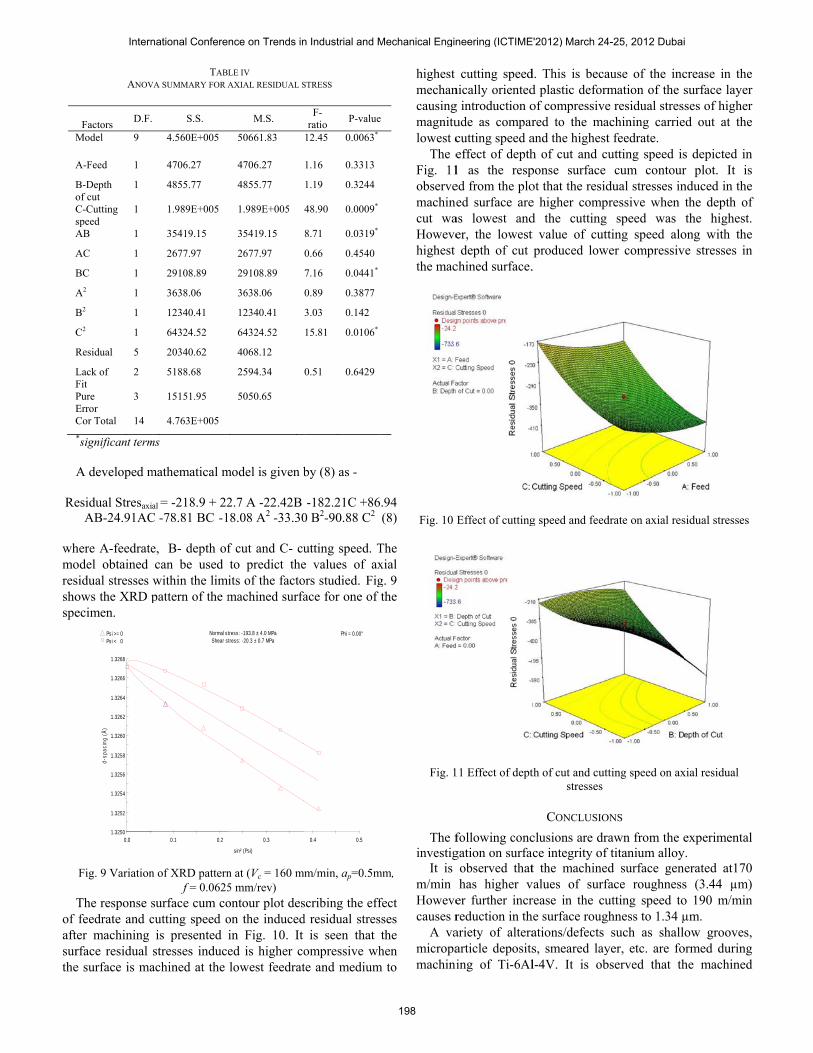
It is observed e pattern of mie samples till 2w variations ar0 µm to 500icrohardness ramples. Later iicrohardness. ncerned, the mhen machininged rate of 0.0mple producede same cutting
microhardnesork hardening
f feedrate and cut
epth of cut and c
ANALYSIS OF S
Microhardness
from the microicrohardness va200 µm depthre seen on the 0 µm. It is oaised considerait gradually dAs far as thmicrohardnesswas carried o
0875 mm/rev. d at the lowest f
speed show res beneath 60 can be explain
tting speed on su
cutting speed on
SURFACE INTEG
s
ohardness profariation is alms beneath the microhardnessbserved from ably for 60 µmdecreases and he effect of c values are h
out at 180 m/mOn the other
feedrate of 0.0elatively lower
µm depth. Tned as follows
urface roughness
surface roughne
GRITY
files in Fig. 6 tost similar for surface, later s profiles beyo
Fig. 6 that m depth in all
reaches to bucutting speed higher (384 Hmin at the highr hand machin0625 mm/rev w
values (377 Hhis behaviour s. The machin
s
ess
that all
on, ond the the ulk
is HV) hest ned
with HV)
of ing
was pergeneraticauses Therefothe surfdepth bmechanthermalhigher vsurface predomvalue. characteheat gomuch tinfluencdepth isurrounheat coinfluenc
F
B. An
The hardeninThe valα=0.05,consideit demoeffect oof factosignific
The resultinvariatiofit. Whefits the close to95% of also cexplanafactors
33
34
35
36
37
38
39Microhardness (Hv)
rformed in theion of high temthermal softe
ore the microhface. But the
beneath surfacenically orientel effect showinvalues of micrincreases to 1
minant and the This effect
eristics i.e theroes into near suto 60µm depces less by thei.e 100 µm
ndings. Heat reonduction of ce is more dom
Fig. 6 Microhard
nalysis of Degr
results of quing in the formlue of “Prob. >, or 95% conered to be stationstrates that thon the responsor B (cutting ant model termother import
ng ANOVA tabon to the total ven R2 approacactual data. Th
o unity, which f the variabilityonfirms that
ation of the and the resp
30
40
50
60
70
80
90
0Depth B
M
e high speed mperature in thening of the hardness is leseffect of temp
e increases. Heed plastic deng higher worrohardness. A100 µm the eff microhardnescould be exrmal conductivurface layer (2pth. Thereforee thermal effec
and beyond emains in the
this materialminating beyon
dness profiles of
ree of Work Ha
uadratic modelm of ANOVA>F” for this mnfidence) indstically signifihe terms in the. In the samespeed) with fa
ms. tant correlatioble is defined avariation. It is hes unity, the he value of R2
is acceptable. y in the data is
this model relationship b
ponse (degree
200 40Beneath Surfac
machining ranhe machining r
machined sus at 20 µm deperature diminence at 60 µm eformation dork hardening a
Again as the defect of thermalss approaches
xplained by tvity of titanium20 µm) does ne the region
ct. But the heatdoesn’t tran
core due to lel and hence nd 100 µm dept
f the machined su
ardening
l for the degr is presented
model is less thdicates that thicant, which ise model have
e manner interactor C (depth
on coefficientas the ratio of ta measure of tbetter the resp
2 is near to 0.9It demonstrateexplained by t
provides abetween the
e of work ha
00 600ce (Micron)
nge prone to region which urface layer. epth beneath nishes as the the effect of minates the and thus the epth beneath l softening is
to the bulk the material m alloy. The not penetrate
at 60 µm t beyond this nsfer to the ess ability of the thermal
th.
urfaces
ree of work in Table III.
han 0.05 (i.e. he model is desirable as a significant
raction effect h of cut) are
t R2 in the the explained the degree of ponse model 0 reasonably es that about this model. It an excellent
independent ardening). A
0
Vc=160,f=0.0875DoC=0.5
International Conference on Trends in Industrial and Mechanical Engineering (ICTIME'2012) March 24-25, 2012 Dubai
196
mawaexp
moon expgiv D
wh
degcumandwofeewofee
Fdegthewaspedomleadegperspemelay
athematical apas fit to the periment point
ANOVA S
Factors D
Model 9
A-Feed 1
B-Depth of cut
1
C-Cutting speed
1
AB 1
AC 1
BC 1
A2 1
B2 1
C2 1
Residual 5
Cor Total 14
*significant term
Consequent upodel, the effect
degree of wperimental daven in (7) as -
DWH 200µm = 6.
here A - feedra
The simultanegree of work hm contour plotd higher depthork hardening. edrate, the maork hardening. edrate, the degrFurther the efgree of work he degree of woas performed aeed. This couminated plast
ading to increagree of work rformed at theeed. This is echanically oriyer.
pproximation mdata that wa
ts of the previo
TABLSUMMARY FOR DEG
D.F. S.S.
53.17
1.70
1.83
0.57
0.42
0.030
21.05
2.84
2.25
5.54
5.48
4 58.66
ms
pon the propots of the input work hardeninata. The deve
36 – 0.35 + 0.3–1.62B
ate, B - depth o
eous effect of hardening is prt in Fig. 7. It is of cut the surfHowever for l
achined surfac At the lowes
ree of work harffect of cuttinhardening is shork hardening at higher depthuld be becaustic deformatioase in the micr
hardening is e lowest depth
because of iented plastic d
model was deas generated ous step.
LE III GREE OF WORK HA
M.S. F-ra
5.91 5.39
1.70 1.55
1.83 1.66
0.57 0.52
0.42 0.03
0.030 0.02
21.05 19.
2.84 2.59
2.254 2.05
5.54 5.05
1.10
osed second orparameters un
ng has been loped mathem
37B + 0.20 -0.2BC–0.69A2–0.6
of cut and C - c
f feedrate and resented using s seen that at thface undergoeslower depth ofce shows minst depth of curdening is min
ng speed and hown in Fig. 8is higher whe
h of cut with the of the high
on of the nearohardness valuless when the
h of cut and the reduced
deformation of
etermined, whfrom the set
ARDENING
atio P-value
9 0.0392*
5 0.2685
6 0.2534
2 0.5037
38 0.5650
27 0.8749
19 0.0071*
9 0.1685
5 0.2118
5 0.0746
rder quadrilatender considerat
evaluated usmatical model
23AB – 0.061A61B2+C2
cutting speed
depth of cut response surfa
he lowest feedrs higher degreef cut and mediunimum degree ut and the highimum. depth of cut
8. It is seen ten the machinhe lowest cutther mechanicaar surface layues. Whereas e machining wmoderate cutt
impact of f the near surfa
hich of
eral ion ing
is
AC (7)
on face rate e of um of
hest
on that ing ing ally yer the
was ing the
face
Fig
Fig. 8
C. An
The rin the fof “Prob95% costatisticas it is C-cuttin(cuttingorder te
The othe ratiomeasurebetter this over demonsexplaineprovidethe indstress). which wof expeproposeinput pahas been
g. 7 Effect of dep
8 Effect of depth
nalysis of Surfa
results of quadform of ANOVb. >F” for this
onfidence) indically significandesired. The s
ng speed, integ speed), A (feerm C (cutting other importano of the explaine of the degrehe response m0.90 reasonab
strates that aboed by this m
es an excellent dependent facA mathematic
was fitted in toeriment points ed second ordearameters unden evaluated us
pth of cut and feehardening
of cut and cuttinhardening
ace Residual St
dratic model fVA are presents model is lessicates that the nt. The lack ofsignificant effeeraction effecteedrate) with Bspeed).
nt correlation cned variation t
ee of fit. Whenmodel fits the acbly close to unout 95% of th
model. It also t explanation otors and the
cal approximatio the data that w
of the previouer quadrilateraer consideratioing experimen
edrate on degreeg
ng speed on degg
tress
for the axial reted in Table IVs than 0.05 (i.emodel is cons
f fit term is noect for this mot of A (feedr
B (depth of cut)
coefficient R2 ito the total varn R2 approachctual data. Theity, which is ae variability inconfirms that
of the relationsresponse (ax
ion model waswas generated us step. Later bal model, the eon on axial resintal data.
e of work
gree of work
esidual stress V. The value e. α=0.05, or sidered to be
on-significant odel is factor rate) with C ) and second
is defined as riation. It is a es unity, the e value of R2 acceptable. It n the data is t this model ship between xial residual s determined,
from the set based on the
effects of the idual stresses
International Conference on Trends in Industrial and Mechanical Engineering (ICTIME'2012) March 24-25, 2012 Dubai
197
M
A
BoCsA
A
B
A
B
C
R
LFPEC
A
Re
whmoresshospe
of aftsurthe
ANOV
Factors
D.F.
Model 9
A-Feed 1
B-Depth of cut
1
C-Cutting speed
1
AB 1
AC 1
BC 1
A2 1
B2 1
C2 1
Residual 5
Lack of Fit
2
Pure Error
3
Cor Total 14
*significant term
A developed m
esidual Stresaxi
AB-24.91AC
here A-feedrateodel obtained sidual stresses ows the XRD pecimen.
Fig. 9 Variation
The response sfeedrate and c
ter machining rface residual e surface is ma
1.3250
1.3252
1.3254
1.3256
1.3258
1.3260
1.3262
1.3264
1.3266
1.3268
0.0
d-sp
acin
g (Å
)
Psi >= 0Psi < 0
TAB
VA SUMMARY FOR A
S.S.
4.560E+005
4706.27
4855.77
1.989E+005
35419.15
2677.97
29108.89
3638.06
12340.41
64324.52
20340.62
5188.68
15151.95
4.763E+005
ms
mathematical m
al = -218.9 + 22C -78.81 BC -1
e, B- depth ofcan be used within the limpattern of the m
n of XRD patternf = 0.0625
surface cum cocutting speed o
is presented stresses induceachined at the
0.1 0.2
Normal stShear s
LE IV AXIAL RESIDUAL S
M.S.
50661.83
4706.27
4855.77
1.989E+005
35419.15
2677.97
29108.89
3638.06
12340.41
64324.52
4068.12
2594.34
5050.65
model is given b
2.7 A -22.42B 8.08 A2 -33.30
f cut and C- cuto predict theits of the factomachined surfa
n at (Vc = 160 m5 mm/rev) ontour plot deson the inducedin Fig. 10. It ed is higher colowest feedrat
0.3
sin² (Psi)
tress: -193.8 ± 4.0 MPatress: -20.3 ± 0.7 MPa
STRESS
F-ratio
P-value
12.45 0.0063*
1.16 0.3313
1.19 0.3244
48.90 0.0009*
8.71 0.0319*
0.66 0.4540
7.16 0.0441*
0.89 0.3877
3.03 0.142
15.81 0.0106*
0.51 0.6429
by (8) as -
-182.21C +860 B2-90.88 C2
utting speed. Te values of axors studied. Figace for one of
m/min, ap=0.5m
scribing the effd residual stres
is seen that ompressive whte and medium
0.4 0.5
Phi = 0.00°
e
.94(8)
The xial g. 9 the
mm,
fect sses the hen
m to
highest mechancausingmagnitulowest c
The eFig. 11observemachinecut waHowevehighest the mac
Fig. 10
Fig. 1
The finvestig
It is m/min Howevecauses r
A vamicropamachini
cutting speednically orientedg introduction oude as comparcutting speed aeffect of depth1 as the resped from the ploed surface are
as lowest ander, the lowest depth of cut
chined surface.
Effect of cutting
11 Effect of dept
following concgation on surfa
observed thathas higher v
er further incrreduction in thariety of alteraarticle depositsing of Ti-6Al
d. This is becad plastic deformof compressivered to the maand the highesth of cut and cuponse surface ot that the reside higher comprd the cutting t value of cuttproduced low
.
g speed and feed
th of cut and cutt
stresses
CONCLUSIO
clusions are drace integrity of t the machined
values of surfarease in the cuhe surface roughations/defects s, smeared layl-4V. It is ob
ause of the incmation of the se residual stresachining carriet feedrate. utting speed iscum contour
dual stresses inressive when
speed was ting speed aloer compressiv
drate on axial res
ting speed on ax
ONS
awn from the etitanium alloyd surface gen
face roughnessutting speed tohness to 1.34 µsuch as shall
yer, etc. are fobserved that th
crease in the surface layer ses of higher
ed out at the
s depicted in r plot. It is nduced in the the depth of the highest.
ong with the ve stresses in
sidual stresses
xial residual
experimental y. erated at170 s (3.44 µm) o 190 m/min µm. ow grooves,
ormed during he machined
International Conference on Trends in Industrial and Mechanical Engineering (ICTIME'2012) March 24-25, 2012 Dubai
198
surface shows lower roughness due to less flaws/alterations on the surface at higher cutting speed.
Higher compressive residual stresses are induced when the highest cutting speed (Vc = 190 m/min), and lowest feedrate (f = 0.05 mm/rev) and moderate depth of cut (ap = 0.7 mm). These machining conditions promote mechanically dominated deformation during machining.
Based on the microhardness measurements, a significant increase in the work hardening within the machined subsurfaces was observed. The microhardness of machined subsurface at a depth of 60 m varies between 365 to 395 HV as compared to its bulk counterpart (338 to 360). Further, it is possible to arrive at the depth of machining deformed layer. In this case, a significant machining affected zone (MAZ) of about 200 m is observed.
The statistical analysis of degree of work hardening 200 m beneath the machined surface shows that the depth of cut and the interaction between feedrate and depth of cut have the most significant effects on the degree of work hardening.
ACKNOWLEDGMENT
The authors would thank Incharge OIM-Texture lab, IIT Bombay for their assistance in performing the XRD analysis. Also thanks are due to support of MHRD Government of India for the MODROBS and TEQIP grant under which the Micro Hardness Tester and CNC machines were purchased.
REFERENCES [1] H. Schulz, T. Moriwaki, “High-speed machining”, Ann of CIRP, vol.
41, pp.637-643, 1992. [2] P.S. Sreejith, B.K.A. Ngoi, “Dry machining: machining of the future”, J.
Mater Process Technol, vol. 101, pp. 287–291, 2000. [3] Brian Griffith, “Manufacturing Surface Technology-Surface Integrity
and Functional Performance, London, Penton Press, 2001 p.120. [4] E.O. Ezugwu, Z.M. Wang, “Titanium alloys and their machinability: a
review”, J of Mater Process Technol, vol. 68, pp. 262-274, 1997. [5] R. Komanduri, W.R. Reed Jr., “Evaluation of carbide grades and a new
cutting geometry for machining titanium alloys”, Wear, vol. 92 (1), pp. 113-123,1983.
[6] A. E. Bayoumi, J. Q. Xie, “Some metallurgical aspects of chip formation in cutting Ti-6wt.%Al- 4wt.%V alloy”, Mater Sci and Eng A, vol. 190 (1-2), pp.173-180,1995.
[7] Z.A. Zoya, R. Krishnamurthy, “The performance of CBN tools in the machining of titanium alloys”, J Mater Process Technol, vol. 100, pp. 80-86, 2000.
[8] C.H. Che-Haron, “Tool life and surface integrity in turning of titanium alloy”, J Mater Process Technol, vol.118, pp. 231-237, 2001.
[9] J. Barry, G. Byrne, D. Lennon, “Observations on chip formation and acoustic emission in machining Ti–6Al–4V alloy”, Int J of Mach Tools and Manuf, vol. 41(7), pp.1055-1070, 2001.
[10] M.V. Ribeiro, M.R.V. Moreira, J.R. Ferreira, “Optimization of titanium alloy (6Al–4V) machining”, J Mater Process Technol, vol. 143–144, pp. 458–463, 2003.
[11] Jiang Hua, Rajiv Shivpuri, “Prediction of chip morphology and segmentation during machining of titanium alloys”, J Mater Process Technol, vol.150(1-2),pp.124-133,2004.
[12] Emmanuel O. Ezugwu, John Bonney, Rosemar B. Da Silva, O. Çakir, “Surface integrity of finished turned Ti–6Al–4V alloy with PCD tools using conventional and high pressure coolant supplies”, Int J of Mach Tools and Manuf, vol. 47 (6), pp. 884-891, 2007.
[13] E.O. Ezugwu, “Key improvements in the machining of difficult-to-cut aerospace superalloys”, Int J of Mach Tools and Manuf, vol. 45, pp.1353–1367, 2005.
[14] Farhad Nabhani, “Machining of aerospace titanium alloys”, Robot and Comp Inte Manuf, vol. 17, pp. 99-106, 2001.
[15] G.A. Ibrahim, C. H. Che Haron and J. A. Ghani, “The effect of dry machining on surface integrity of titanium alloy Ti-6Al-4 ELI”, J of app sci, vol. 9 (1), pp. 121-127, 2009.
[16] E.O. Ezugwu, “Improvements in the machining of aero-engine alloys using self-propelled rotary tooling technique” J Mater Process Technol, vol. 185, pp. 60–71, 2007.
[17] R.S. Pawade, S.S. Joshi, P.K. Brahmankar, “Effect of machining parameters and cutting edge geometry on surface integrity of high speed turned Inconel 718”, Int J of Mach Tools and Manuf, vol. 48, pp. 15-28, 2008.
[18] A.R.C. Sharman, J.I. Hughes, K. Ridgway. An analysis of the residual stresses generated in Inconel 718 TM when turning. J Mater Process Technol, vol. 173, pp. 359–367, 2006.
[19] R.H. Myers and D.C. Montgomery, Response surface methodology: process and product optimization using designed experiments, Wiley, New York, pp. 120-250, 1995.
[20] Geoffery Boothroyd, and W.A. Knight, Fundamentals of Machining and Machine Tools, Second ed., Mercel Dekker, New York, pp. 82–85, 1989.
[21] C.R. Liu, M.M. Barash, “The mechanical state of the sub layer of a surface generated by chip-removal process Part 1: Cutting with a sharp tool”, Trans of the ASME, J of Eng for Indus, pp. 1192-1201, 1976.
[22] C. Noyan and J. B. Cohen, Residual Stress Measurement by Diffraction and Interpretation, Springer-verlag, New York, pp.20-55, 1987.
Raju Pawade: Date of Birth 2.11.1967 at Wanjri Dist. Yavatmal of Maharashtra state in India. B. E. (Mechanical Engineering) from College of Engineering, Karad MS in 1989. M. Tech. degree is in Machine Tools Engineering from P. S. G. College of Technology, Coimbatore TN in 1997. PhD (Mechanical Engineering) from Indian Institute of Technology, Bombay, India in 2008. He has 19 years of teaching experience and 6 years of research experience. His area of interest include the machining of difficult-to-cut materials, machining process optimization, non-conventional machining. He is presently working as ASSOCIATE PROFESSOR in the university. He has about 57 publications to his credit that includes 9 international journals, 25 international conferences and 23 national conferences.
Dr. Pawade, MISTE, MIE, MTSI
Rajendra Pawar: Date of Birth 1.06.1968 at Pandharpur Dist. Solapur of Maharashtra state in India. B. E. (Mechanical Engineering) from College of Engineering, Osmanabad MS in 1991. M. Tech. degree is in Manufacturing Engineering from Dr. Babasaheb Ambedkar Technological University, Lonere MS in 2010. He has 20 years of teaching experience. His area of interest includes the surface integrity studies in machining of titanium alloys. He is presently working as PRINCIPAL in G. V. Acharya Polytechnic ,Shelu , Karjat, MS. He has two publications to his credit in national conference.
International Conference on Trends in Industrial and Mechanical Engineering (ICTIME'2012) March 24-25, 2012 Dubai
199


![Evaluation of Hypolipidemic Activity of Ionidium ...psrcentre.org/images/extraimages/20 314022.pdf · nations [2]. Since synthetic drugs are shown more side effects, clinical importance](https://img.pdfslide.net/doc/110x75/5fa58a62ce04ef74dd4bc0be/evaluation-of-hypolipidemic-activity-of-ionidium-314022pdf-nations-2-since.jpg)