Embed Size (px)
Citation preview

International Conference‘Population Ageing. Towards an Improvement of the Quality of Life?’
Organised by the Belgian Platform on Population and DevelopmentBrussels, 1 March 2007
Under the auspices of the Directorate-General for Development Cooperation (DGDC), the Institute of Tropical Medicine (ITG) in Antwerp,
and the Research Centre of the Flemish Government (SVR)
Population Ageing.Population Ageing.A global phenomenon with many A global phenomenon with many
facesfaces
Ronald C. Schoenmaeckers
SVR – Studiedienst Vlaamse Regering (Research Centre Flemish Government)

Parts/ purposes of the presentation
• To show that ‘population ageing’ is indeed a global phenomenon.– Increases in the proportions of people aged 60 and more in all major regions and
continents– Identification of the two extreme groups of countries: former EU15 and SSA (countries
of Sub-Saharan Africa)
• That (at least for the time being) the major ‘motor’ of the increase in older people is different for the EU15 and the SSA countries.– This will be shown with the results of a simple simulation exercise.
• That in addition to ‘population ageing’ the SSA countries continue to be confronted with the issue of rapid population growth.
• Finally, that for the Less Developed Regions (LDR) the changes will occur at a (much) more rapid pace than what the MDR have ever experienced.
SVR

Evolution of the percentage of
persons aged 60 and over,
1950-2050
World, More Developed (MDR), and Less
Developed Regions (LDR)
SVR
0%
5%
10%
15%
20%
25%
30%
35%
1950 1960 1970 1980 1990 2000 2010 2020 2030 2040 2050
MDR
LDRWorld
12%
33%
6%
20%

Evolution of the percentage of
persons aged 60 and over,
1950-2050
World, More Developed (MDR), and Less
Developed Regions (LDR)
SVR
0%
5%
10%
15%
20%
25%
30%
35%
1950 1960 1970 1980 1990 2000 2010 2020 2030 2040 2050

SVR
Evolution of the percentage of
persons aged 60 and over, 1950-
2050
World and Continents
0%
5%
10%
15%
20%
25%
30%
35%
1950 1960 1970 1980 1990 2000 2010 2020 2030 2040 2050
N. America
Oceania
Europe
Asia
L. America &
Caribbean
Africa
+/-12%
+/-6%
34.5%
10%

SVR
Evolution of the percentage of
persons aged 60 and over, 1950-
2050
World and Continents
0%
5%
10%
15%
20%
25%
30%
35%
1950 1960 1970 1980 1990 2000 2010 2020 2030 2040 2050
Europe
Africa

SVR
Evolution of the percentage of
persons aged 60 and over, 1950-
2050
World and Continents
0%
5%
10%
15%
20%
25%
30%
35%
1950 1960 1970 1980 1990 2000 2010 2020 2030 2040 2050
Europe
Africa
EU15
Sub-Sahara Africa
The most extreme situations appear to be found among the member states of the former
EU15 and the countries constituting SSA (Sub-Saharan
Africa).
We therefore limit the presentation to these 2 groups of countries. It can be assumed that the other countries (or groups of
countries) occupy an ‘intermediate’ position and/or follow an ‘intermediate’ path.

The simulation exercise
• As known, changes in the age structure are the result of changes in fertility and/or mortality (we disregard the possible effects of migration).
• The purpose of the simulation exercise is to assess the relative share of the changes in mortality and fertility on the increase in the proportion (or number) of persons age 60 and more.
• The simulation is made separately for the EU15 member states and the SSA countries. In both cases the ‘base line’ population are the observed numbers for the year 1950.
In a first step these numbers are projected (until the year 2100), assuming the observed/ expected changes in mortality, but while keeping fertility fixed at the level for 1950.
In a second step the projections will be made assuming the observed/ expected changes in both mortality and fertility.
SVR

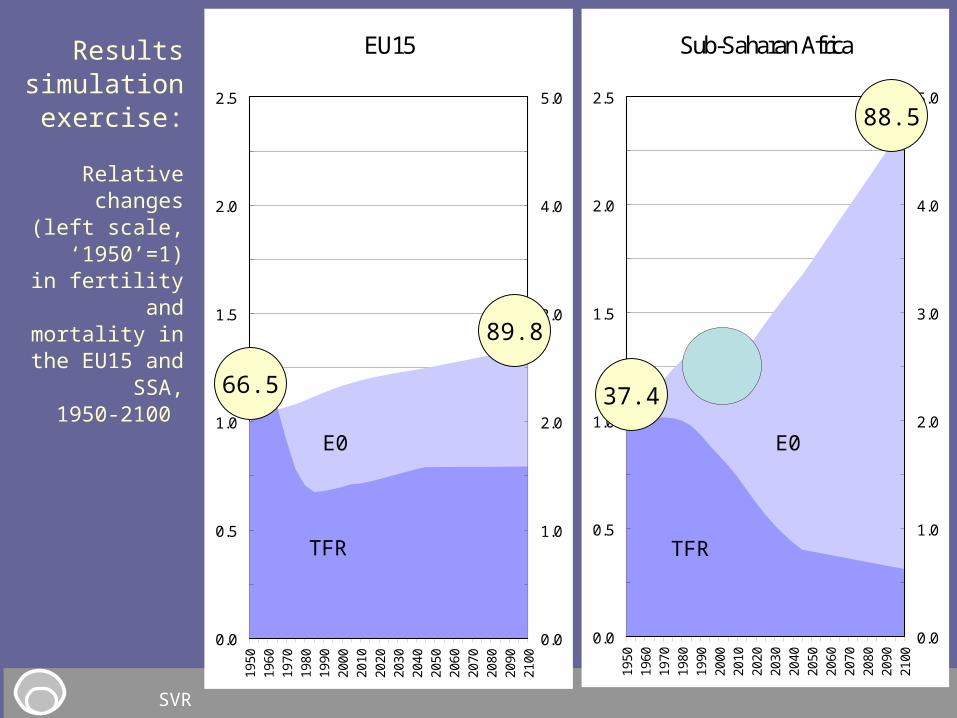
Results simulation
exercise:
Relative changes (left
scale, ‘1950’=1)
in fertility and mortality in
the EU15 and SSA,
1950-2100
SVR
Sub-Saharan Africa
0.0
0.5
1.0
1.5
2.0
2.5
1950
1960
1970
1980
1990
2000
2010
2020
2030
2040
2050
2060
2070
2080
2090
2100
0.0
1.0
2.0
3.0
4.0
5.0
EU15
0.0
0.5
1.0
1.5
2.0
2.5
1950
1960
1970
1980
1990
2000
2010
2020
2030
2040
2050
2060
2070
2080
2090
2100
0.0
1.0
2.0
3.0
4.0
5.0
TFRTFR
2.33
1.85
1.56
6.69
2.60
2.10

Results simulation
exercise:
Relative changes (left
scale, ‘1950’=1)
in fertility and mortality in
the EU15 and SSA,
1950-2100
SVR
Sub-Saharan Africa
0.0
0.5
1.0
1.5
2.0
2.5
1950
1960
1970
1980
1990
2000
2010
2020
2030
2040
2050
2060
2070
2080
2090
2100
0.0
1.0
2.0
3.0
4.0
5.0
EU15
0.0
0.5
1.0
1.5
2.0
2.5
1950
1960
1970
1980
1990
2000
2010
2020
2030
2040
2050
2060
2070
2080
2090
2100
0.0
1.0
2.0
3.0
4.0
5.0
TFRTFR
Results simulation
exercise:
Relative changes (left
scale, ‘1950’=1)
in fertility and mortality in
the EU15 and SSA,
1950-2100
SVR
Sub-Saharan Africa
0.0
0.5
1.0
1.5
2.0
2.5
1950
1960
1970
1980
1990
2000
2010
2020
2030
2040
2050
2060
2070
2080
2090
2100
0.0
1.0
2.0
3.0
4.0
5.0
E0
TFR
EU15
0.0
0.5
1.0
1.5
2.0
2.5
1950
1960
1970
1980
1990
2000
2010
2020
2030
2040
2050
2060
2070
2080
2090
2100
0.0
1.0
2.0
3.0
4.0
5.0
E0
TFR
66.5
89.8
37.4
88.5

Results simulation
exercise:
Relative changes (left
scale, ‘1950’=1)
in fertility and mortality in
the EU15 and SSA,
1950-2100
SVR
Sub-Saharan Africa
0.0
0.5
1.0
1.5
2.0
2.5
1950
1960
1970
1980
1990
2000
2010
2020
2030
2040
2050
2060
2070
2080
2090
2100
0.0
1.0
2.0
3.0
4.0
5.0
EU15
0.0
0.5
1.0
1.5
2.0
2.5
1950
1960
1970
1980
1990
2000
2010
2020
2030
2040
2050
2060
2070
2080
2090
2100
0.0
1.0
2.0
3.0
4.0
5.0
What are now the relative effects from these changes on the proportions of persons age 60 and
more (right scale, again with ‘1950’=1) ?
Let us first look at the effects of the changes in mortality, i.e. the increase in life expectancy.

Results simulation
exercise:
Relative changes (left
scale, ‘1950’=1)
in fertility and mortality in
the EU15 and SSA,
1950-2100
Effect of changes in
mortality only
SVR
Sub-Saharan Africa
0.0
0.5
1.0
1.5
2.0
2.5
1950
1960
1970
1980
1990
2000
2010
2020
2030
2040
2050
2060
2070
2080
2090
2100
0.0
1.0
2.0
3.0
4.0
5.0
EU15
0.0
0.5
1.0
1.5
2.0
2.5
1950
1960
1970
1980
1990
2000
2010
2020
2030
2040
2050
2060
2070
2080
2090
2100
0.0
1.0
2.0
3.0
4.0
5.0

Results simulation
exercise:
Relative changes (left
scale, ‘1950’=1)
in fertility and mortality in
the EU15 and SSA,
1950-2100
Effect of changes in
mortality only
SVR
EU15
0.0
0.5
1.0
1.5
2.0
2.5
1950
1960
1970
1980
1990
2000
2010
2020
2030
2040
2050
2060
2070
2080
2090
2100
0.0
1.0
2.0
3.0
4.0
5.0
Sub-Saharan Africa
0.0
0.5
1.0
1.5
2.0
2.5
1950
1960
1970
1980
1990
2000
2010
2020
2030
2040
2050
2060
2070
2080
2090
2100
0.0
1.0
2.0
3.0
4.0
5.0
For the EU15, between 1950 and 2100, the lowering of
mortality alone would imply a doubling of the proportion of
persons age 60 and more, from about 14% to 28% (on the right
scale corresponding to a change from ‘1’ to ‘2’)
For the Sub-Saharan countries, between 1950 and 2100, the impact is much more limited. After a decline, the proportion
would resume its initial value of about 6%.
This could seem awkward in view of the remarkable increase
in life expectancy.The explanation is the relatively high value of fertility, which is kept constant at a TFR=6.7.

Results simulation
exercise:
Relative changes (left
scale, ‘1950’=1)
in fertility and mortality in
the EU15 and SSA,
1950-2100
Effect of changes in
mortality only
SVR
EU15
0.0
0.5
1.0
1.5
2.0
2.5
1950
1960
1970
1980
1990
2000
2010
2020
2030
2040
2050
2060
2070
2080
2090
2100
0.0
1.0
2.0
3.0
4.0
5.0
Sub-Saharan Africa
0.0
0.5
1.0
1.5
2.0
2.5
1950
1960
1970
1980
1990
2000
2010
2020
2030
2040
2050
2060
2070
2080
2090
2100
0.0
1.0
2.0
3.0
4.0
5.0
Let us look now at the relative effects from both the changes in mortality and fertility.

Results simulation
exercise:
Relative changes (left
scale, ‘1950’=1)
in fertility and mortality in
the EU15 and SSA,
1950-2100
Effect of changes in
mortality and fertility
SVR

Results simulation
exercise:
Relative changes (left
scale, ‘1950’=1)
in fertility and mortality in
the EU15 and SSA,
1950-2100
Effect of changes in
mortality and fertility
SVR
EU15
0.0
0.5
1.0
1.5
2.0
2.5
1950
1960
1970
1980
1990
2000
2010
2020
2030
2040
2050
2060
2070
2080
2090
2100
0.0
1.0
2.0
3.0
4.0
5.0
Sub-Saharan Africa
0.0
0.5
1.0
1.5
2.0
2.5
1950
1960
1970
1980
1990
2000
2010
2020
2030
2040
2050
2060
2070
2080
2090
2100
0.0
1.0
2.0
3.0
4.0
5.0
The changes in fertility have an additional although rather
limited effect on the proportion of older persons.
The increase from 1980 to 2040 is the immediate result of the fertility decline in the
1960s.
A completely different situation. Clearly, so far, for Sub-Saharan Africa the main ‘force’ of ‘population ageing’
is not the increase in life expectancy but the
(important) decline in fertility.
At the same time, the results show that, although the
increase in the proportion of people aged 60 and more, has
so far remained rather limited, there would be an
acceleration in the increase within the next
5-10 years.
Note that the increase is ‘tapering off’ after 2030
(when fertility has remained stable for some time).

Changes in population size• The SSA countries will however not only be confronted with
a rapid increase in the proportions of older people. At the same time, they will continue to face the issue of rapid population growth. This is the subject of the next slides.
• The illustration will be made with the use of so-called ‘planes’. The advantage of using planes is that several planes can be presented in one single graph (the evolution in
the age composition will be shown in 25-year intervals).
• The graphs refer to the relative growth. As before, the situation ‘1950’ is used as reference. One additional advantage is the possibility to compare the evolution of the European countries with that of the African countries.
SVR

SVR
Evolution in population age structure (%),
1950-2050, with
percentage values scaled
to total population size
in 1950*
* Ref. = ‘1950’ =1
Situation 1950
0 -
410
- 1
4
20 -
24
30 -
34
40 -
44
50 -
54
60 -
64
70 -
74
80+1950
19752000
20252050
-0.2
0.0
0.2
0.4
0.6
0.8
1.0
EU15
0 -
410
- 1
4
20 -
24
30 -
34
40 -
44
50 -
54
60 -
64
70 -
74
80+1950
19752000
20252050
-0.2
0.0
0.2
0.4
0.6
0.8
1.0
Sub-Saharan Africa

SVR
Evolution in population age structure (%),
1950-2050, with
percentage values scaled
to total population size
in 1950*
* Ref. = ‘1950’ =1
Situation 1950
1975
0 -
410
- 1
4
20 -
24
30 -
34
40 -
44
50 -
54
60 -
64
70 -
74
80+1950
19752000
20252050
-0.2
0.0
0.2
0.4
0.6
0.8
1.0
EU15
0 -
410
- 1
4
20 -
24
30 -
34
40 -
44
50 -
54
60 -
64
70 -
74
80+1950
19752000
20252050
-0.2
0.0
0.2
0.4
0.6
0.8
1.0
Sub-Saharan Africa

SVR
Evolution in population age structure (%),
1950-2050, with
percentage values scaled
to total population size
in 1950*
* Ref. = ‘1950’ =1
Situation 1950
1975
2000
0 -
410
- 1
4
20 -
24
30 -
34
40 -
44
50 -
54
60 -
64
70 -
74
80+1950
19752000
20252050
-0.2
0.0
0.2
0.4
0.6
0.8
1.0
EU15
0 -
410
- 1
4
20 -
24
30 -
34
40 -
44
50 -
54
60 -
64
70 -
74
80+1950
19752000
20252050
-0.2
0.0
0.2
0.4
0.6
0.8
1.0
Sub-Saharan Africa

SVR
Evolution in population age structure (%),
1950-2050, with
percentage values scaled
to total population size
in 1950*
* Ref. = ‘1950’ =1
Situation 1950
1975
2000
2025
0 -
410
- 1
4
20 -
24
30 -
34
40 -
44
50 -
54
60 -
64
70 -
74
80+1950
19752000
20252050
-0.2
0.0
0.2
0.4
0.6
0.8
1.0
EU15
0 -
410
- 1
4
20 -
24
30 -
34
40 -
44
50 -
54
60 -
64
70 -
74
80+1950
19752000
20252050
-0.2
0.0
0.2
0.4
0.6
0.8
1.0
Sub-Saharan Africa

SVR
0 -
410
- 1
4
20 -
24
30 -
34
40 -
44
50 -
54
60 -
64
70 -
74
80+1950
19752000
20252050
-0.2
0.0
0.2
0.4
0.6
0.8
1.0
Sub-Saharan AfricaEvolution in population age structure (%),
1950-2050, with
percentage values scaled
to total population size
in 1950*
* Ref. = ‘1950’ =1
Situation 1950
1975
2000
2025
2050
0 -
410
- 1
4
20 -
24
30 -
34
40 -
44
50 -
54
60 -
64
70 -
74
80+1950
19752000
20252050
-0.2
0.0
0.2
0.4
0.6
0.8
1.0
EU15
There are striking differences between the two groups of countries.
By contrast, the EU15 countries remain relatively stable in terms of population size: a modest increase
between 1950 and 2025, from 295 million to 394 million (x1.3), and a small decrease (of -2%)
between 2025 and 2050.
On the other hand, there are important changes with respect to the age structure. For one thing, between
1950 and 2050 the proportion of older persons increases from 14% to 34%.
In the SSA countries, the percentage of older people remains low by European standards: even by 2050 it will be not more than 8%.
On the other hand, by 2050, their numbers will be 15 times larger than in 1950.
The most remarkable observation is the population growth of the SSA countries:from 180 million in 1950 to no less than 1.7 billion in 2050 a multiplication
by 9.4 (!)

SVR
0 -
410
- 1
4
20 -
24
30 -
34
40 -
44
50 -
54
60 -
64
70 -
74
80+1950
19752000
20252050
-0.2
0.0
0.2
0.4
0.6
0.8
1.0
Sub-Saharan AfricaEvolution in population age structure (%),
1950-2050, with
percentage values scaled
to total population size
in 1950*
* Ref. = ‘1950’ =1
Situation 1950
1975
2000
2025
2050
0 -
410
- 1
4
20 -
24
30 -
34
40 -
44
50 -
54
60 -
64
70 -
74
80+1950
19752000
20252050
-0.2
0.0
0.2
0.4
0.6
0.8
1.0
EU15
The SSA countries are not the only countries that will continue to face the issue of rapid population growth.
Between 1950 and 2050, the entire African population will have increased with a factor of x8.6; the populations of Latin America & the Caribbean with a factor
of x4.7; the population of Asia with x3.7); and the population of Oceania with x3.6.
The only continents with only modest increases in total population size are Northern America (x2.6) and Europe (x1.2). (And, as already indicated the
European population will in fact decline, from 728 million in 2000 to 653 million in 2050, or -10%.)
Even by 2050 the proportions of persons aged 60 and more will still be much lower in LDR compared to MDR: ‘only’ 20% vs. 33%. However, after 2000 one
witnesses a sharp acceleration of the increase in all LDR.
Indeed, between 2000 and 2050, all LD countries will experience a high annual growth rate in the number of older people, higher than what MD countries will
experience: 3.1% for Africa; 3% for Latin America; 2.7% for Asia; and 2.2% for Oceania (compared with only 0.8% and 1.7% for Europe and Northern America,
respectively).

What did we learn? (1/2)
• The simulation results show that for the EU15 the main force behind the phenomenon known as ‘population ageing’ is the lowering of mortality; the fertility decline of the 1960s has only intensified the phenomenon. For the SSA countries, however, for the next decades, the main force in pushing the proportions of older people upwards is the (drastic) fertility decline.
• For the EU15 member states, as of around 2040 (when fertility
will have remained stable) the pace of the increase in the proportion of older people will come down.
• By contrast, for the countries in SSA, the increases of the proportions of older people would just have started. In fact, it is to be expected that for the African countries (and LD-
countries in general) the increases will happen at a much higher pace that what MD-countries have ever experienced.
SVR

What did we learn? (2/2)
• In addition to experiencing changes in their age composition, many LD-countries will continue to face the problem of increasing population numbers, both with respect to the total size of their population as with respect to the numbers of older people.
– MD-countries will only experience moderate changes. In fact, because of fertility levels below replacement, some countries may even face the issue of (a modest) population decline.
• Already today, a majority (69%) of all people aged 60 and more in the World live in LDR. By 2050, this percentage will have increased to 82% (corresponding to around 1.6 billion).
SVR

To conclude (1/2)
• So far, life expectancies are still far lower in LDR than in MDR. However, also in these countries one has observed spectacular improvements. For example, in Sub-Saharan countries, between 1950 and 2000, life expectancy has increased by no less than 25% (from 37.4 to 47.0 years).
• The AIDS pandemic has curbed the growth of life expectancy in many countries, especially in Africa. Some have even experienced a regression in their situation. However, we may expect — and we certainly should hope — that, in spite of this, LDR will soon ‘catch up’ with the situation in MDR.
• ‘Population ageing’ will pose serious socio-economic challenges. This is true for both the countries in the ‘North’ and in the ‘South’. Some of these challenges will be addressed in more detail by the next speakers.
SVR

To conclude (2/2)
• ‘Population ageing is here to stay’. Already in the foreseeable future, all countries, from ‘North’ and ‘South’, will face similar demographic situations and (hence) similar socio-economic challenges. This could be a good reason for (more) international collaboration.– A ‘key’-issue could be the exchange of ‘good practices’; countries from ‘North’ and
‘South’ could learn from an exchange of experiences and traditional practices.
• Finally, let us keep in mind that in the LD-countries these demographic changes will occur at a more rapid pace than what European countries have experienced (or will experience); that these countries will continue to face the problems of population growth; and that they already face poor economic conditions.
SVR

Thank you for your attentionThank you for your attention
SVR