Embed Size (px)
Citation preview
International Consensus on Use ofContinuous Glucose MonitoringDiabetes Care 2017;40:1631–1640 | https://doi.org/10.2337/dc17-1600
Measurement of glycated hemoglobin (HbA1c) has been the traditional method forassessing glycemic control. However, it does not reflect intra- and interday glycemicexcursions that may lead to acute events (such as hypoglycemia) or postprandialhyperglycemia, which have been linked to both microvascular and macrovascular com-plications. Continuous glucose monitoring (CGM), either from real-time use (rtCGM) orintermittently viewed (iCGM), addresses many of the limitations inherent in HbA1ctesting and self-monitoring of blood glucose. Although both provide themeans tomovebeyond theHbA1c measurement as the solemarker of glycemic control, standardizedmetrics for analyzing CGM data are lacking. Moreover, clear criteria for matchingpeople with diabetes to themost appropriate glucose monitoring methodologies, aswell as standardized advice about howbest to use the new information they provide,have yet to be established. In February 2017, the Advanced Technologies & Treat-ments for Diabetes (ATTD) Congress convened an international panel of physicians,researchers, and individuals with diabetes who are expert in CGM technologies toaddress these issues. This article summarizes the ATTD consensus recommendationsand represents the current understanding of how CGM results can affect outcomes.
Glucose measurements are critical to effective diabetes management. Although mea-surement of glycated hemoglobin (HbA1c) has been the traditional method for assess-ing glycemic control, it does not reflect intra- and interday glycemic excursions thatmay lead to acute events (such as hypoglycemia) or postprandial hyperglycemia, whichhave been linked to both microvascular and macrovascular complications. Moreover,although self-monitoring of blood glucose (SMBG) has been shown to improve glyce-mic control and quality of life in both insulin-treated and noninsulin-treated diabeteswhen used within a structured testing regimen (1–4) [C,C,C,C], it cannot predict im-pending hypoglycemia or alert for hypoglycemia (5,6) [C,C] (7).Real-time continuous glucose monitoring (rtCGM) and intermittently viewed CGM
(iCGM) address many of the limitations inherent in HbA1c testing and SMBG. rtCGMuniformly tracks the glucose concentrations in the body’s interstitial fluid, providingnear real-time glucose data; iCGM uses similar methodology to show continuousglucose measurements retrospectively at the time of checking. Both rtCGM andiCGM facilitate monitoring of time spent in the target glucose range (“time in range”).However, only rtCGM can warn users if glucose is trending toward hypoglycemia orhyperglycemia. With iCGM, these trends can only be viewed after physically scanningthe sensor. It is often difficult to distinguish between technologies regarding issuessuch as calibrations, alarms/alerts, human factors of applying andwearing sensors, andthe cost, which are device specific. As these technological details are subject to con-stant change, the term CGM is used for all issues related to the device class unlessindicated otherwise.In February 2017, the Advanced Technologies & Treatments for Diabetes (ATTD)
Congress convened an international panel of physicians, researchers, and individuals
1Diabetes Centre for Children and Adolescents,Children’s and Youth Hospital “Auf Der Bult,”Hannover, Germany2The Myrtle and Henry Hirsch National Centerfor Childhood Diabetes, The Jesse and Sara LeaShafer Institute of Endocrinology and Diabetes,Schneider Children’s Medical Center of Israel,Petah Tikva, Israel3Department of Pediatric Endocrinology, Diabe-tes andMetabolic Diseases, University Children’sHospital, Ljubljana University Medical Centre,and Faculty of Medicine, University of Ljubljana,Ljubljana, Slovenia4International Diabetes Center at Park Nicollet,Minneapolis, MN5Close Concerns, San Francisco, CA6AcademicMedical Center, University of Amster-dam, Amsterdam, the Netherlands7University of Colorado Denver and BarbaraDavis Center for Diabetes, Aurora, CO8Science & Co, Dusseldorf, Germany9Division of Metabolism, Endocrinology, andNutrition, Department of Medicine, Universityof Washington School of Medicine, Seattle,WA10Diabetes Research Group, King’s College Lon-don, London, U.K.11Jaeb Center for Health Research, Tampa, FL12Diabetes Research Institute, University “Vita-Salute” San Raffaele, Milan, Italy13Division of Endocrinology and Diabetes, De-partment of Pediatrics, Stanford University Med-ical Center, Stanford, CA14Department of Information Engineering, Uni-versity of Padova, Padova, Italy15John A. Paulson School of Engineering and Ap-plied Sciences, Harvard University, Cambridge, MA16Academic Unit of Diabetes, Endocrinology &Metabolism, The University of Sheffield, Shef-field, U.K.17Wellcome Trust-MRC Institute of MetabolicScience and Department of Paediatrics, Univer-sity of Cambridge, Cambridge, U.K.
Thomas Danne,1 Revital Nimri,2
Tadej Battelino,3 Richard M. Bergenstal,4
Kelly L. Close,5 J. Hans DeVries,6
Satish Garg,7 Lutz Heinemann,8 Irl Hirsch,9
Stephanie A. Amiel,10 Roy Beck,11
Emanuele Bosi,12 Bruce Buckingham,13
Claudio Cobelli,14 Eyal Dassau,15
Francis J. Doyle III,15 Simon Heller,16
Roman Hovorka,17 Weiping Jia,18
Tim Jones,19 Olga Kordonouri,1
Boris Kovatchev,20 Aaron Kowalski,21
Lori Laffel,22 David Maahs,13
Helen R. Murphy,23 Kirsten Nørgaard,24
Christopher G. Parkin,25 Eric Renard,26
Banshi Saboo,27 Mauro Scharf,28
William V. Tamborlane,29
Stuart A. Weinzimer,29 and Moshe Phillip2
Diabetes Care Volume 40, December 2017 1631 CGM
ANDRISK
OFHYPOGLYCEM
IA
with diabetes who are expert in CGM toaddress these issues. The purpose of theconference was to provide guidance forclinicians, patients, and researchers in uti-lizing, interpreting, and reporting CGMdata in clinical care and research. Thepanelwas divided into subgroups to review theliterature and provide evidence-based rec-ommendations for relevant aspects ofCGM utilization and reporting. Primary ci-tations were identified for each topic,assigned a level of evidence (7) (indicatednext to the corresponding citation in thetext), and verified by the expert panel.This article summarizes the ATTD con-
sensus recommendations and representsthe current state of knowledge on CGMresults affecting outcomes. The contentrepresents the consensus of the panelmembers’ comprehensive evaluation ofthe issues. Supporting evidence is includedin the online Supplementary Data identi-fied at the end of each section.
1. LIMITATIONS OF HbA1C
Key Findingsc TheDiabetesControl andComplications
Trial (DCCT), followed by the Epidemi-ology of Diabetes Interventions andComplications (EDIC), demonstratedhow elevated HbA1c contributes tocomplications in type 1 diabetes. TheUK Prospective Diabetes Study (UKPDS)confirmed the importance of glycemiccontrol as well as other components ofmetabolic control, namely blood pres-sure, on health outcomes in individualswith type 2 diabetes (8,9) [A,A].
c Most global organizations recommendtarget HbA1c levels of ,7.0% (53mmol/mol) for adults and ,7.5%(58 mmol/mol) for children, althoughseveral organizations suggest an HbA1c
target of#6.5% for adults (10) [E] andchildren (11) [E]. However, all organi-zations agree that HbA1c targets shouldbe individualized to each patient.
c Although HbA1c remains the referencemarker for assessing glycemic controland predicting the risk of developmentof long-term complications, it has sev-eral limitations: HbA1c 1) provides onlyan average of glucose levels over theprevious past 2–3 months; 2) does notdetect hypoglycemia or hyperglycemiaon a daily basis; 3) is an unreliablemea-sure in patients with anemia (12) [B],hemoglobinopathies (13) [B], or irondeficiency (14) [B] and during preg-nancy (15) [B]; 4) does not reflect rapidchanges in daily glucose control; and5) does not provide data as to how toadjust the treatment regimen whenHbA1c levels are elevated. In summary,although HbA1c has proved extremelyvaluable in patient management, is avaluablemeasureof populationhealth,and remains a validated indicator of gly-cation as a risk factor for complications,it is not as helpful for personalized di-abetes management.
c The literature suggests that ethnic andracial differences exist in glycationrates (16–18) [B,C,C], which affectsthe accuracy of HbA1c measurements;however, a racial difference was notfound in the relationship betweenmean glucose and fructosamine or gly-cated albumin levels. This suggests thatthe racial discordance in glycation ratesis specific to red blood cells. The effectsof ethnic differences on average HbA1ccannot be entirely explained by mea-sured differences in glycemia, differ-ences in sociodemographic or clinical
factors, or differences in access tocare or quality of care (19) [E].
c An estimated HbA1c (eA1C) can be cal-culated if adequate rtCGM/iCGM data(70% or 10 days of the 14 days ofCGM data) are available. The eA1Cand laboratory-measured HbA1c maydiffer to some degree for a given indi-vidual because there are many factorsthat affect an HbA1c reading and tablesthat convert HbA1c to a mean glucoseand vice versa are based on mean val-ues for a population. Knowing how anindividual’s CGM-derived eA1C com-pares to their laboratory-measuredHbA1c may be helpful for safe and ef-fective clinical management (20) [E].
Recommendationsc HbA1c should be measured with a
device that is certified by the NGSP(National Glycohemoglobin Standardi-zation Program, www.ngsp.org) or theIFCC (International Federation of Clini-cal Chemistry and Laboratory Medi-cine, www.ifcchba1c.net).
c Clinicians and patients should target anHbA1c as close to normal as possiblewithout severe hypoglycemia or a signif-icantamountofnonseverehypoglycemiawhile at the same time individualizingglycemic targets according to patientage, duration of diabetes, comorbidities,and expected life expectancy, with “less-strict” HbA1c targets for those morefrail (21) [A].
c When there is a discrepancy betweenactual HbA1c and the eA1C based onmean glucose, other glucose measure-ment methods such as fructosamine,glycated albumin, SMBG, and in par-ticular CGM should be used in con-junction with HbA1c measurements
18Department of Endocrinology and Metabo-lism, Shanghai Jiao Tong University AffiliatedSixth People’s Hospital, Shanghai Diabetes Insti-tute, Shanghai Key Laboratory of Diabetes Mel-litus, Shanghai Clinical Center of Diabetes,Shanghai, China19Telethon Kids Institute and School of Paediat-rics and Child Health, The University of WesternAustralia, and Department of Endocrinology andDiabetes, Princess Margaret Hospital for Chil-dren, Perth, Australia20Center for Diabetes Technology, University ofVirginia School of Medicine, Charlottesville, VA21JDRF, New York, NY22Pediatric, Adolescent and Young Adult Sectionand Section on Clinical, Behavioral and Out-comes Research, Joslin Diabetes Center, HarvardMedical School, Boston, MA
23Norwich Medical School, University of East An-glia, Norwich, U.K.24Department of Endocrinology, CopenhagenUniversity Hospital Hvidovre, Hvidovre, Denmark25CGParkin Communications, Boulder City, NV26Department of Endocrinology, Diabetes, andNutrition, Montpellier University Hospital, andInstitute of Functional Genomics, University ofMontpellier, and INSERM Clinical InvestigationCentre, Montpellier, France27DiaCare, Ahmedabad, Gujarat, India28Centro de Diabetes Curitiba and Division ofPediatric Endocrinology, Hospital Nossa Senhoradas Graças, Curitiba, Brazil29Department of Pediatrics, Yale School of Med-icine, New Haven, CTCorresponding author: Thomas Danne, [email protected].
This article contains Supplementary Data onlineat http://care.diabetesjournals.org/lookup/suppl/doi:10.2337/dc17-1600/-/DC1.
This article is featured in a podcast available athttp://www.diabetesjournals.org/content/diabetes-core-update-podcasts.
© 2017 by the American Diabetes Association.Readers may use this article as long as the workis properly cited, the use is educational and notfor profit, and the work is not altered. More infor-mation is available at http://www.diabetesjournals.org/content/license.
See accompanying articles, pp. 1611,1614, 1622, 1641, 1644, 1651, and1661.
1632 Consensus Report Diabetes Care Volume 40, December 2017
when assessing glycemic control andadjusting therapy.
c CGM data should be used to assesshypoglycemia and glucose variability.
Additional discussion of these recom-mendations and supporting evidenceis presented in Appendix 1 of the Supple-mentary Data.
2. USE OF GLUCOSE MONITORINGMETHODOLOGIES (SMBG ANDCGM)TO GUIDE MANAGEMENT ANDASSESS OUTCOMES IN DIFFERENTPATIENT POPULATIONS
Key Findingsc SMBG has been shown to be helpful or
to correlatewith effectivemanagementin insulin-treated andnoninsulin-treateddiabetes (1–4,22,23) [C,C,C,C,A,C];however, SMBG has notable limita-tions. First, it requires a fingerstickto obtain a blood sample. Moreover,it only provides a single “point-in-time”measurement, which provides no in-dication of the direction or rate ofchange of glucose levels. Thus, usingSMBG data alone may result in inap-propriate therapy decisions (such asadministering correction insulin whenblood glucose levels are falling). Sec-ond, obtaining glucose data via SMBGis dependent upon the patient’s deci-sion to self-monitor. Accordingly, SMBGoften fails to detect nocturnal andasymptomatic hypoglycemia (5,6) [C,C].
c iCGM provides the current glucosevalue plus retrospective glucose datafor a specified time period upon “scan-ning.” At the time of this writing, onlyone iCGM system, also known as“flash” monitoring, was available. Thissystem utilizes two components: a glu-cose sensor, which is inserted theuser’s upper arm, and a separate touchscreen reader device.When the readerdevice is swiped close to the sensor,the sensor transmits both an instanta-neous glucose level and an 8-h trendgraph to the reader. The only currentlyavailable iCGM device is factory cali-brated, lasts up to 14 days, and doesnot need to be calibrated by the user.However, iCGM lacks alarms for lowandhigh glucose values, and, as with SMBG,measurements are only visualizedwhenthe user of the device chooses to makea measurement. Two studies usingiCGM have demonstrated significantimprovements in hypoglycemia, time
in range, glycemic variability, and usersatisfaction (24,25) [B,B]. The flash de-vice is also available without the needfor scanning in a blindedmode for clin-ical research or retrospective glucosepattern evaluation.
c rtCGM in unblinded mode providesreal-time numerical and graphical in-formation about the current glucoselevel, glucose trends, and the direction/rate of change of glucose. Devices withprogrammable alerts/alarms that warnusers of current and/or impending highor low glucose offer additional safetyadvantages. In Europe, a new type ofimplantable rtCGM system is availableas an alternative for transcutaneousCGM (26) [C].
c Numerous studies have shown thatuse of rtCGM improves glycemic con-trol and quality of life in both childrenand adultswith type 1 diabetes treatedwith either continuous subcutaneousinsulin infusion ormultiple daily insulininjection therapy, improving HbA1c,shortening the time spent in hypogly-cemia and hyperglycemia, and reduc-ing moderate-to-severe hypoglycemia(27–38) [C,C,B,B,C,C,A,C,B,C,B]. Thebenefit of rtCGM was seen primarily inthose patients who regularly used theirdevices (27,29,36) [C,B,B]. In a lifetimeanalysis, rtCGM reduced overall diabetes-relatedcomplications (39) [B]. Similar re-sults of the cost-effectiveness of rtCGMversus SMBG were reported using alarger, population-based model (40).
c Using data collected from a meta-analysis of patient-level data (36)[B], sensor-augmented pump therapywas determined to be cost-effectivefor the treatment of type 1 diabetes inthe Swedish health care system (41) [C].Sensitivity analyses indicated furthercost-effectiveness benefit of increas-ing the amount of rtCGM use from5 to 7 days a week, and decreasingthe use of SMBGwas incrementally cost-effective at every level.
c Subsequent studies have determinedthat sensor-augmented pump systemswith a low-glucose suspend feature arealso cost-effective relative to insulinpump therapy alone, in the Australian(42) [C], U.K. (43) [C], and French (44)[C] health care systems, due to im-proved glycemic control and reductionin hypoglycemia.
c Benefits of rtCGM use have also beenreported in individuals with type 2
diabetes who are managed with orwithout intensive insulin treatment(45–47) [B,C,C]. There are limiteddata regarding the benefit of rtCGMas an outcome measure for individualswith gestational diabetes mellitus andtype 2 diabetes, especially for thosewho do not use insulin (48) [C].
c The benefit of rtCGM is directly corre-lated to persistence and frequency ofuse. A meta-analysis by Pickup et al.(36) [B] found that every 1-day in-crease of sensor usage per week in-creased the effect of CGM; the effecton HbA1c is more pronounced thehigher the initial HbA1c.
Recommendationsc CGM should be considered in conjunc-
tion with HbA1c for glycemic status as-sessment and therapy adjustment in allpatients with type 1 diabetes and pa-tients with type 2 diabetes treatedwith intensive insulin therapy whoare not achieving glucose targets, espe-cially if the patient is experiencingproblematic hypoglycemia.
c Structured testing regimens should bedefined for patients when SMBG isprescribed.
c All patients should receive training inhow to interpret and respond to theirglucose data regardless of the monitor-ing method used. Patient education andtraining for CGM should utilize standard-ized programswith follow-up to improveadherence and facilitate appropriate useof data and diabetes therapies.
Additional discussion of these recom-mendations and supporting evidence ispresented in Appendix 2 of the Supple-mentary Data.
3. MINIMUM REQUIREMENTS FORCGM PERFORMANCE
Key Findingsc No internationally accepted standard
exists for CGM system performancecomparable with the InternationalOrganization for Standardization (ISO)15197 standard for SMBG, which spec-ifies design verification procedures andthe validation of performance by theintended users. However, ISO/IEEEFDIS 11073-10425 provides a norma-tive definition of the communicationbetween CGM devices and managers(suchas cell phones, personal computers,
care.diabetesjournals.org Danne and Associates 1633
personal health appliances, and set-topboxes) in a manner that enables plug-and-play interoperability.
c In contrast to iCGM, the accuracy ofcurrent rtCGM systems is dependenton SMBG testing for calibration. There-fore, it is important to have an accurateglucose meter. Successful calibrationalso requires several conditions; for ex-ample, it is bestperformedwhenglucoseis not changing rapidly. Importantly,users must be educated in the appropri-ate techniques.
c The mean absolute relative difference(MARD) is currently the most commonmetric used to assess the performanceof CGM systems. MARD is the averageof the absolute error between all CGMvalues and matched reference values.A small percentage indicates that theCGM readings are close to the refer-ence glucose value, whereas a largerMARD percentage indicates greaterdiscrepancies between the CGM andreference glucose values.
c Comparing MARD values from differ-ent clinical studies has several limita-tions, and thus head-to-head studiesshouldbeperformed.Additionalmetrics,such as precision absolute relative differ-ence, can be used as well to obtain anadditional evaluation of the CGMperfor-mance (49) [C].
c Although controversy exists regardingthe exact cut point for accuracy, in silicotesting has shown that a further lower-ing of MARD #10% from referencevalues has little additional benefit forinsulin dosing (50) [C].
Recommendationc Only CGM systems that provide an ac-
ceptable level of sensor accuracy shouldbe used.
Additional discussion of this recom-mendation and supporting evidence ispresented is presented in Appendix 3 ofthe Supplementary Data.
4. DEFINITION AND ASSESSMENTOF HYPOGLYCEMIA IN CLINICALSTUDIES
Key Findingsc Hypoglycemia remains a major barrier
for glycemic control and a commoncomplication of diabetes treatment,especially in type 1 diabetes (51) [E].
c In adults with type 1 diabetes, severe hy-poglycemia ismore related todurationof
diabetes and socioeconomic status thanHbA1c (35) [C]. Similarly, in childrenaged6–17 years old with type 1 diabetes(52) [C] or adults with type 2 diabetes(mostly receiving insulin or sulfonyl-ureas [53] [B]), severe hypoglycemiawas most common among those withthe lowest and highest HbA1c levels.
c Needing assistance is the usual concisedefinition for severe hypoglycemia.Most children require assistance withall hypoglycemia, not just severe hypo-glycemia (54) [C]. Therefore, severe hy-poglycemia in children is often definedas an event associatedwith a seizure orloss of consciousness or requiringemergency medical personnel, a visitto the emergency department, or ahospital admission. In adults, the defi-nition of severe hypoglycemia often in-cludes episodes associated with comaor seizure, for which the patient, per-haps being on their own, recoveredspontaneously.
c The degree of hypoglycemia thatcauses clinical symptoms and counter-regulatory response is specific to theindividual and depends on the personallevel of glycemic control (54) [C].
c Studies indicate that hypoglycemia fortwo or more hours impairs hormonalresponses (55,56) [C,B].
c Gradation of hypoglycemic eventsmaybe valuable: specifically, that of a pro-longed hypoglycemic event, in whichthe CGM levels indicate glucoselevels ,54 mg/dL (3.0 mmol/L) for$120 min. While this metric is some-what arbitrary, a study by Oz et al. (57)[B] found that the glycogen signal de-creases with a rate of ;10% per hourin the human brain at blood glucoselevels of ,54 mg/dL (3.0 mmol/L),indicating a mobilization rate commen-suratewith the severity of hypoglycemia.
c The low blood glucose index (LBGI)is a metric specifically designed tocalculate the risk for hypoglycemiaas reflected by SMBG data (58) [B].However, LBGI calculations based onCGM data tend to slightly underesti-mate risk, particularly in the low-riskrange (59) [C].
Recommendationsc The definition of hypoglycemia should
take into consideration several param-eters: the compartment of measure-ment (arterial, venous, and capillaryblood or interstitial), the nadir level of
blood glucose measured, and the dura-tion of the event and related symptoms.
c When assessing hypoglycemia usingCGM,theaccuracyof thedata inthe lowerglycemic range should be considered.
c The following classifications of hypo-glycemia, based on clinical evaluation,should be used in categorizing levels ofhypoglycemia.○ Level 1: a hypoglycemia alert glucose
value of ,70–54 mg/dL (3.9–3.0mmol/L) with orwithout symptoms.This should be considered an alertthat the individual may be at riskfor developing hypoglycemia andshould work to minimize the timespent in this range to reduce therisk of developingmore clinically sig-nificant hypoglycemia. This neednot be reported routinely in clinicalstudies, although that would de-pend on the purpose of the study.Nevertheless, most clinicians wantto know how often patients are,70–54 mg/dL (3.9–3.0 mmol/L)and would act to reduce the timespent in this range to minimize therisk of more clinically significant hy-poglycemia occurring.
○ Level 2: a glucose level of,54mg/dL(3.0 mmol/L) with our withoutsymptoms. This should be consid-ered clinically significant hypoglyce-mia requiring immediate attention.
○ Level 3: severe hypoglycemia. Thisdenotes cognitive impairment re-quiring external assistance for recov-ery (7) [E] but is not defined by aspecific glucose value.
c For clinical study CGM outcomes re-ports, hypoglycemia values,54 mg/dL(3.0 mmol/L) should be given moreweight or importance than those,70–54 mg/dL (3.9–3.0 mmol/L).
c When assessing hypoglycemia in clini-cal care, other important consequencesor adverse patient-reported outcomesshould be considered.○ Reduced awareness of subsequent
hypoglycemia.○ Associated cardiac arrhythmia, con-
fusion, or abnormal or combativebehavior.
○ Weight gain.○ Fear of hypoglycemia.
c Hypoglycemia should be quantified inthe following ways.○ As the percentage of CGMvalues that
are below a given threshold (,70mg/dL [3.9 mmol/L] or ,54 mg/dL
1634 Consensus Report Diabetes Care Volume 40, December 2017
[3.0 mmol/L]) or the number ofminutes or hours below thesethresholds.
○ As the number of hypoglycemicevents that occur over the givenCGM reporting period.
c A hypoglycemic event should be de-fined as follows.○ Beginning of a CGM event: readings
below the threshold for at least15 min is considered an event. Forexample, at least 15min,54mg/dL(3.0 mmol/L) to define a clinicallysignificant (level 2) hypoglycemicevent.
○ End of a CGM event: readings for 15min at $70 mg/dL (3.9 mmol/L).
○ A second hypoglycemic event out-come of prolonged hypoglycemia isconsidered when CGM levels are,54 mg/dL (3.0 mmol/L) for con-secutive 120 min or more.
c LBGI should be reviewed when assess-ing hypoglycemia risk.
Additional discussion of these recom-mendations and supporting evidence ispresented in Appendix 4 of the Supple-mentary Data.
5. ASSESSMENT OF GLYCEMICVARIABILITY
Key Findingsc Numerous studies have focused on
glycemic variability as an indepen-dent risk factor for diabetes compli-cations, particularly cardiovasculardisease (60–63) [C,E,C,C], and on theeffects of glycemic variability on cogni-tive function and quality of life (64) [C].
c Acceptance of glycemic variability as aclinically valuable marker of glycemiccontrol has greatly expanded the un-derstanding of glycemic control be-yond HbA1c alone (65–68) [E,E,E,E].
c The interpretation of average bloodglucose is relatively straightforward,providing a direct relationship toHbA1c. However, because glycemicvariability is a reflection of a dynamicprocess, understanding and measuringit is more complex (69,70) [E,C]. Be-yond the setting of laboratory experi-ments, the data sources available forroutine estimation of glycemic variabil-ity include episodic SMBG records andCGM traces (71) [B]. The density of theavailable data determines what prop-erties of glycemic variability can be in-vestigated.
c Glycemic variability is a process charac-terized by the amplitude, frequency,and duration of the fluctuation.
c Both the amplitude and the timing ofblood glucose fluctuations contributeto the risks for hypoglycemia and hy-perglycemia associated with diabetes(72) [C]. Increased glucose variabilityis consistently associated with mortal-ity in the intensive care unit (73,74)[C,B] and is a consistent predictor ofhypoglycemia, both in prospectivestudies and within the setting of ran-domized clinical trials (64,75) [C,B].
c When quantifying glucose variabilityfrom CGM data, the following physio-logical and statistical factors should beconsidered.○ In healthy individuals, the metabolic
systemhasaphysiological equilibriumrange (e.g., fasting blood glucose) towhich it returns if left undisturbed;with the progression of diabetes,this equilibrium range moves up.
○ This physiological equilibrium rangeis relatively universal (hence the di-agnostic criteria for prediabetesand diabetes). Therefore, the objec-tive of diabetes control is to keepblood glucose levels in the vicinityof a commonly accepted range (notthe mean for a person, which isindividual).
○ Deviations from the range in bothdirections carry risks. These risksincrease with the amplitude of thedeviations, nonlinearly and asym-metrically, into the hypoglycemicand hyperglycemic ranges.
○ The timing of the deviations is ofessence as it reflects system (per-son) dynamics and system stability.However, most of the traditionalglycemic variability metrics ignorethe time axis of CGM data.
○ Mathematical methods (e.g., riskanalysis, time series) are well devel-oped and can be adapted to diabe-tes, keeping in mind the objectivesof diabetes control.
c CGM data reflect the dynamics of glu-cose fluctuations by including all ofthese dimensions. A recent analysis ofCGM data in comparison with bloodglucose data obtained in a large studywith patients with type 1 diabetesshowed how glycemic variability indi-ces are related and demonstrated theimpact of CGM use on glycemic vari-ability (76) [C].
c SD, coefficient of variation (CV), andmean amplitude of glucose excur-sions are widely used to quantify gly-cemic variability. The CV (which is theSD divided by the mean) has theadvantage of being a metric relativeto the mean, which makes it moredescriptive of hypoglycemic excur-sions than the SD alone. For example,a population with a mean glucose of150 mg/dL and an SD of 60 wouldhave a CV of 40%.
c Stable glucose levels are defined as aCV,36%, and unstable glucose levelsare defined as CV$36% (77) [E].
Recommendationsc Glycemic variability evaluated from
CGM data should be consideredamong other factors of the overall clin-ical representation of glycemic control.
c CV should be considered the primarymeasure of variability; however, manyclinicians may want to see SD reportedas a key secondary glycemic variabilitymeasure since it is a metric with whichthey are familiar.
c The recommended metrics for glyce-mic variability should be included insummary statistics for data down-loaded from CGM devices into reports.
Additional discussion of these recom-mendations and supporting evidence ispresented in Appendix 5 of the Supple-mentary Data.
6. TIME IN “RANGES”
c Time in range (TIR) generally refers tothe time spent in an individual’s targetglucose range (usually 70–180 mg/dL[3.9–10 mmol/L] but occasionally 70–140mg/dL [3.9–7.8mmol/L]). TIRmea-surements add valuable information toassess the level of current glycemiccontrol in addition to what is knownfrom the HbA1c. However, clinicians,researchers, and regulators nowknow that time in target range aloneis not an adequate description of over-all glycemic control. It is also necessaryto quantitate the times below andabove target range, using a few sever-ity thresholds for each level (78) [E].Thus, time in “ranges” (TIRs) providesa more illustrative metric for clinicaland research purposes.
c TIRs are useful for a research compar-ison of interventions and can help pa-tients understandwhether the amount
care.diabetesjournals.org Danne and Associates 1635
of clinically significant hypoglycemia orhyperglycemia they are experiencing isimproving over time. Breaking out thetime in hypoglycemia and hyperglyce-mia into level 1 (monitor and take ac-tion if needed) and level 2 (immediateaction required due to themore poten-tially clinically significant nature of theglucose levels) can guide the urgencyand degree of clinical response.
Composite Measuresc Because the function of CGM use is to
monitor glucose levels with the ulti-mate goal of improving glycemic con-trol, it makes clinical sense to combineTIRs data with other measures.○ HbA1c level and time in level 2 (clin-
ically significant/immediate actionrequired) hypoglycemia is one suchcombined measure.
○ Time in target range combined withtime in level 2 hypoglycemia is
another such combined measure.This combined set of measurescould be set up as a coprimary out-come for a clinical trial askingwhether one therapy is more ef-fective than another in achievingan increased time in target range(70–180 mg/dL) while also beingnoninferior for the level 2 hypogly-cemia achieved. One then needs tofurther define the parameters ofjudging noninferior status. Theseexamples make clinical sense, sinceone wants to improve glucosecontrol (HbA1c or TIR) while also re-ducing or at least not increasing hy-poglycemia.
○ Even broader combined measuresof diabetes management such astargets for desired diabetes man-agement are being explored (e.g.,HbA1c 1 hypoglycemia 1 weight
gain or HbA1c 1 blood pressure 1LDL or HbA1c 1 blood pressure 1LDL1 aspirin use if high-risk cardio-vascular disease1 no tobacco use).These composites emphasize theimportance of taking a multifacto-rial approach to reducing diabetescomplications, particularly cardio-vascular disease.
Recommendationsc Percentages of time in ranges (target,
hypoglycemia, andhyperglycemia) shouldbe assessed and reported.
c Different TIRs in conjunction with ameasure of glycemic variability shouldbe reported as key diabetes controlmetrics in clinical studies.
Additional discussion of these recom-mendations and supporting evidence ispresented in Appendix 6 of the Supple-mentary Data.
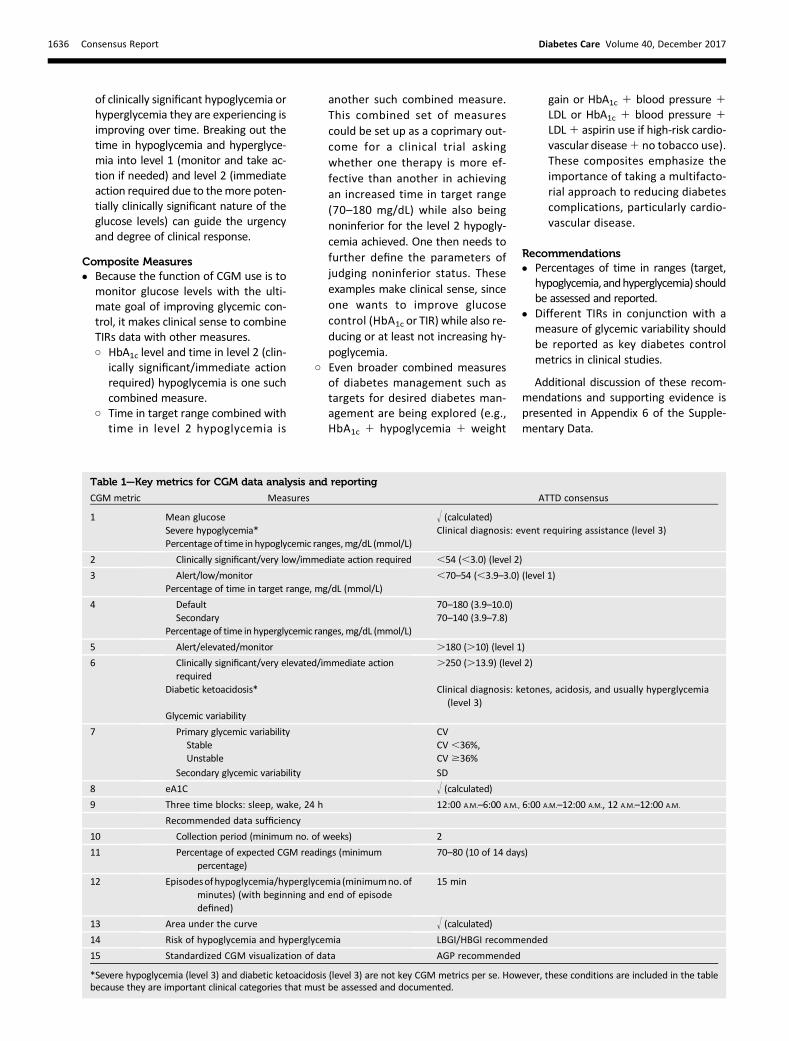
Table 1—Key metrics for CGM data analysis and reporting
CGM metric Measures ATTD consensus
1 Mean glucose ! (calculated)Severe hypoglycemia* Clinical diagnosis: event requiring assistance (level 3)Percentageof time in hypoglycemic ranges,mg/dL (mmol/L)
2 Clinically significant/very low/immediate action required ,54 (,3.0) (level 2)
3 Alert/low/monitor ,70–54 (,3.9–3.0) (level 1)Percentage of time in target range, mg/dL (mmol/L)
4 Default 70–180 (3.9–10.0)Secondary 70–140 (3.9–7.8)
Percentage of time in hyperglycemic ranges,mg/dL (mmol/L)
5 Alert/elevated/monitor .180 (.10) (level 1)
6 Clinically significant/very elevated/immediate actionrequired
.250 (.13.9) (level 2)
Diabetic ketoacidosis* Clinical diagnosis: ketones, acidosis, and usually hyperglycemia(level 3)
Glycemic variability
7 Primary glycemic variability CVStable CV ,36%,Unstable CV $36%
Secondary glycemic variability SD
8 eA1C ! (calculated)9 Three time blocks: sleep, wake, 24 h 12:00 A.M.–6:00 A.M., 6:00 A.M.–12:00 A.M., 12 A.M.–12:00 A.M.
Recommended data sufficiency
10 Collection period (minimum no. of weeks) 2
11 Percentage of expected CGM readings (minimumpercentage)
70–80 (10 of 14 days)
12 Episodesofhypoglycemia/hyperglycemia (minimumno.ofminutes) (with beginning and end of episodedefined)
15 min
13 Area under the curve ! (calculated)14 Risk of hypoglycemia and hyperglycemia LBGI/HBGI recommended
15 Standardized CGM visualization of data AGP recommended
*Severe hypoglycemia (level 3) and diabetic ketoacidosis (level 3) are not key CGM metrics per se. However, these conditions are included in the tablebecause they are important clinical categories that must be assessed and documented.
1636 Consensus Report Diabetes Care Volume 40, December 2017
7. VISUALIZATION, ANALYSIS, ANDDOCUMENTATION OF KEY CGMMETRICS
Key Findingsc Standardizing glucose reporting and
analysis similar to electrocardiogramoutput is vital to optimizing clinicaldecision-making in diabetes. Furtheroptimizing of such tools and expandingthem into shared decision-makingguides is needed.
c Reporting CGM data in a standardizedway, in conjunctionwith anHbA1c valueand other clinical conditions (e.g., se-vere hypoglycemia, diabetic ketoacido-sis) would foster a precise definition ofthis composite goal. Using a standard-ized composite goal, the medical com-munity could establish with moreconfidencewhether a particular insulinformulation, new technology for insu-lin delivery, or an innovative patient-centered approach to care was animportant factor in helping individualswith diabetes reach optimal glycemiccontrol.
c Standardized tools such as the Ambula-tory Glucose Profile (AGP [79]), PatternSnapshot (Medtronic) (80), Clarity(Dexcom) (81), andothers from variousdevice makers and data managementcompanies are now available. Use ofthe AGP approach was previously en-dorsed by an expert panel of cliniciansin a consensus conference held in2012 (82) [E] and is recommended bythis consensus group as a standard forvisualization of CGM data.
c Integration of standardized metricsinto electronic health records is impor-tant to maximize the clinical workflowand facilitate remote communicationswith patients.
c Patient responses to the current glu-cose level, trend arrows indicatingrate of change of glucose, and qualita-tive analysis of a graphical display ofglucose versus time do not requirestability of patterns. However, retro-spective analysis of CGM is dependenton stability of patterns from day to day(83) [B].
c A minimum of 14 consecutive daysof data with approximately 70% ofpossible CGM readings over those14 days appears to generate a reportthat enables optimal analysis anddecision-making; standard reportingand visualization of CGM data areimportant.
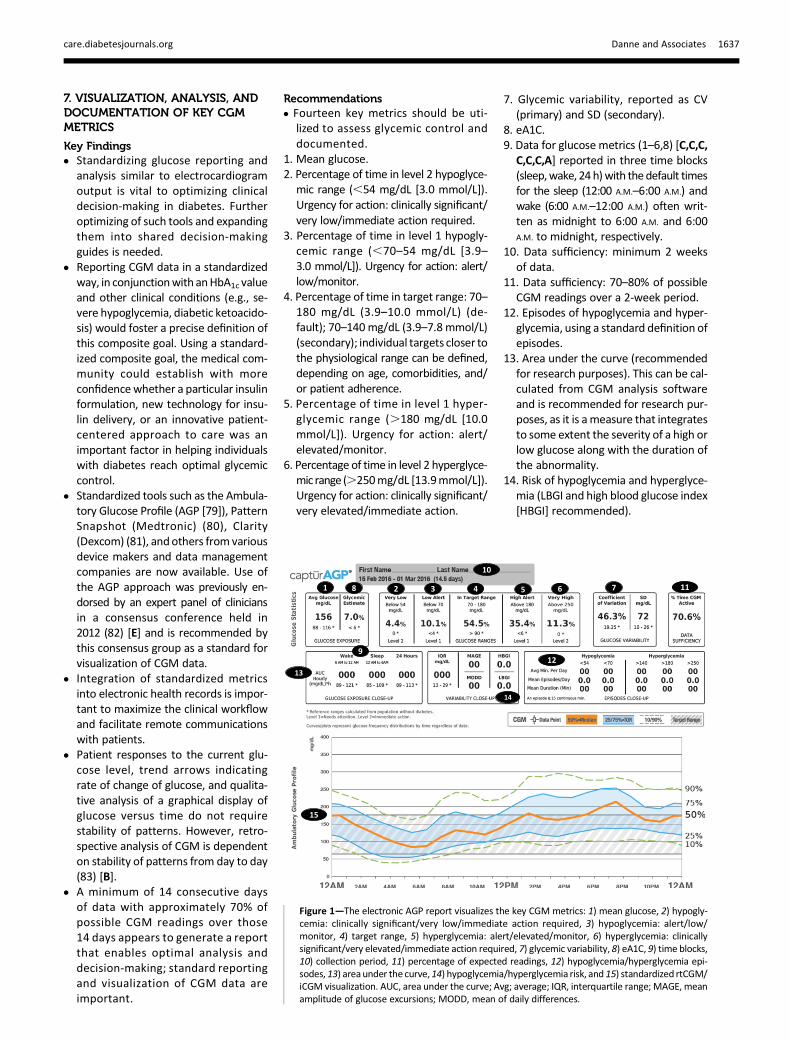
Recommendationsc Fourteen key metrics should be uti-
lized to assess glycemic control anddocumented.
1. Mean glucose.2. Percentage of time in level 2 hypoglyce-
mic range (,54 mg/dL [3.0 mmol/L]).Urgency for action: clinically significant/very low/immediate action required.
3. Percentage of time in level 1 hypogly-cemic range (,70–54 mg/dL [3.9–3.0 mmol/L]). Urgency for action: alert/low/monitor.
4. Percentage of time in target range: 70–180 mg/dL (3.9–10.0 mmol/L) (de-fault); 70–140mg/dL (3.9–7.8 mmol/L)(secondary); individual targets closer tothe physiological range can be defined,depending on age, comorbidities, and/or patient adherence.
5. Percentage of time in level 1 hyper-glycemic range (.180 mg/dL [10.0mmol/L]). Urgency for action: alert/elevated/monitor.
6. Percentage of time in level 2 hyperglyce-mic range (.250mg/dL [13.9mmol/L]).Urgency for action: clinically significant/very elevated/immediate action.
7. Glycemic variability, reported as CV(primary) and SD (secondary).
8. eA1C.9. Data for glucose metrics (1–6,8) [C,C,C,
C,C,C,A] reported in three time blocks(sleep,wake, 24h)with thedefault timesfor the sleep (12:00 A.M.–6:00 A.M.) andwake (6:00 A.M.–12:00 A.M.) often writ-ten as midnight to 6:00 A.M. and 6:00A.M. to midnight, respectively.
10. Data sufficiency: minimum 2 weeksof data.
11. Data sufficiency: 70–80% of possibleCGM readings over a 2-week period.
12. Episodes of hypoglycemia and hyper-glycemia, using a standard definition ofepisodes.
13. Area under the curve (recommendedfor research purposes). This can be cal-culated from CGM analysis softwareand is recommended for research pur-poses, as it is a measure that integratesto some extent the severity of a high orlow glucose along with the duration ofthe abnormality.
14. Risk of hypoglycemia and hyperglyce-mia (LBGI and high blood glucose index[HBGI] recommended).
Figure 1—The electronic AGP report visualizes the key CGMmetrics: 1) mean glucose, 2) hypogly-cemia: clinically significant/very low/immediate action required, 3) hypoglycemia: alert/low/monitor, 4) target range, 5) hyperglycemia: alert/elevated/monitor, 6) hyperglycemia: clinicallysignificant/very elevated/immediate action required, 7) glycemic variability, 8) eA1C, 9) time blocks,10) collection period, 11) percentage of expected readings, 12) hypoglycemia/hyperglycemia epi-sodes, 13) area under the curve,14) hypoglycemia/hyperglycemia risk, and 15) standardized rtCGM/iCGM visualization. AUC, area under the curve; Avg; average; IQR, interquartile range; MAGE, meanamplitude of glucose excursions; MODD, mean of daily differences.
care.diabetesjournals.org Danne and Associates 1637
c Standardized software for visualizationand reporting of the 14 key CGMmetricsshould be considered an additional com-ponent (no. 15)of analysis anddocumen-tation (use of the AGP is recommended).
c Although severe hypoglycemia (level3 hypoglycemia) and diabetic ketoa-cidosis (level 3 hyperglycemia) arenot CGM data–based determina-tions, they should be reported anddocumented.
c For research purposes, median andinterquartile range should be pre-sented for all measurements.
c Conduct further studies in a varietyof patient groups (including the pe-diatric population, pregnant individu-als, those with renal insufficiency,and the elderly) to determine accept-able and achievable time in range andthe accompanying acceptable ratesof hypoglycemia.
The key metrics for CGM analysis andreporting arepresented in Table 1. Figure 1illustrates how these metrics are pre-sented in the AGP.
CONCLUSIONS
CGM is a robust research tool, and con-tinuous glucose data should be recog-nized by governing bodies as a valuableand meaningful end point to be used inclinical trials of new drugs and devices fordiabetes treatment. The identification ofhypoglycemia is as important as the mea-surement of time in range in clinical trials.Quantifying the duration and magnitudeof glycemic excursions provides anothermeans of assessing glucose control. Theunifying theme of trials investigating theusefulness of CGM technologies is thatthe device must be worn on a near-dailybasis to optimize its benefits.The expert panel concludes that, in
clinical practice, the advanced metrics ofassessing continuous glucose data pre-sented here are appropriate as outcomeparameters that complement HbA1c for awide range of patients with diabetes andshould be considered for use to helpthem improve glycemic control providedthat appropriate educational and techni-cal support is available.
Acknowledgments. The consensus group par-ticipants wish to thank ATTD for organizing andcoordinating the meeting. They also wish tothank Rachel Naveh (National Center for Child-
hood Diabetes, The Jesse and Sara Lea ShaferInstituteofEndocrinologyandDiabetes,SchneiderChildren’s Medical Center of Israel) for assistancein organizing the meeting and the diaTribe Foun-dation (Ava Runge and Jim Hirsch) for editorialsupport.Funding. Support for the CGM consensus confer-ence and development of this article was providedby the ATTD Congress. Abbott Laboratories, Dex-com, Insulet Corporation, Eli Lilly,Medtronic, RocheDiabetesCare, andSanofiprovided funding toATTDto support the consensusmeeting. Editorial supportwas providedbyC.G.P. (CGParkin Communications)through a grant from the diaTribe Foundation.Duality of Interest. T.D. has received speakerhonoraria and research support and has con-sulted for Abbott, Bayer, Bristol-Myers Squibb,AstraZeneca, Boehringer Ingelheim, Dexcom, EliLilly,Medtronic, NovoNordisk, Sanofi, and Roche.T.D. is a shareholder of DreaMed. T.B. served onadvisory boards of Novo Nordisk, Sanofi, Eli Lilly,Boehringer Ingelheim, Medtronic, and BayerHealthCare. T.B.’s institution received researchgrant support, with receipt of travel and accom-modation expenses in some cases, from Abbott,Medtronic, Novo Nordisk, GluSense, Sanofi,Sandoz, and Diamyd. T.B. received honoraria forparticipating on the speakers’ bureaus of Eli Lilly,Bayer, Novo Nordisk, Medtronic, Sanofi, andRoche. T.B. owns stocks of DreaMed. R.M.B. hasreceived research support from and acted as aconsultant or has been on a scientific advisoryboard for Abbott Diabetes Care, Becton Dickinson,Dexcom, Eli Lilly, Glooko, The Leona M. and HarryB. Helmsley Charitable Trust, Hygieia, Johnson &Johnson,Medtronic,Merck, NovoNordisk, Roche,and Sanofi. R.M.B.’s employer, the nonprofitHealth Partners Institute, contracts for his ser-vices, and no personal income goes to R.M.B.R.M.B. has inherited Merck stock. R.M.B. is a vol-unteer for the American Diabetes Association andJDRF and has worked on the development andimplementation of the AGP. J.H.D. has receivedspeaker honoraria and research support from andhas consulted for Abbott, Dexcom, Medtronic,Merck Sharp & Dohme, Novo Nordisk, Sanofi,Roche, Senseonics, and Zealand. R.B. declaredno personalfinancial arrangementswith any com-pany. R.B.’s employer, the Jaeb Center for HealthResearch, has received grant support from Dex-com, Animas, Bigfoot Biomedical, and Tandem;nonfinancial study support fromDexcom, Abbott,and Roche; and consulting fees from Eli Lilly andInsulet. E.D. has served on advisory panels or hasbeen a consultant for Animas, Insulet, and Eli Lillyand has received research support from Dexcom,Insulet, Animas, and Xeris. R.H. has receivedspeaker honoraria from Eli Lilly, Novo Nordisk,and AstraZeneca; served on advisory panels forEli Lilly and Novo Nordisk; and received licensefees from B. Braun and Medtronic. H.R.M. sitson the Medtronic European Scientific AdvisoryBoard. E.R. has received consultancy honorariafrom A. Menarini Diagnostics, Abbott, BectonDickinson, Cellnovo, Dexcom, Eli Lilly, Insulet,Johnson & Johnson, Medtronic, Novo Nordisk,Roche, and Sanofi and research support fromAbbott, Dexcom, Insulet, and Roche. W.V.T. hasreceived consulting fees from Eli Lilly, Novo Nordisk,Sanofi, andMedtronic. S.A.W. servedasaconsultantfor Insulet. M.P. is on the advisory panels of Sanofi,Medtronic, Novo Nordisk, and Eli Lilly. The institute
thatM.P. heads has received research support fromMedtronic, Novo Nordisk, Eli Lilly, Merck, Sanofi,Bristol-Myers Squibb, Kamada, and Lexicon.M.P. re-ceived honoraria for participating on the speakers’bureaus of Eli Lilly and Abbott and is the chairmanand chief science officer and a shareholder atDreaMedDiabetes, Ltd.Nootherpotential conflictsof interest relevant to this article were reported.
References1. Kato N, Cui J, KatoM. Structured self-monitoringof blood glucose reduces glycated hemoglobin ininsulin-treated diabetes. J Diabetes Investig 2013;4:450–4532. Polonsky WH, Fisher L, Schikman CH, et al.Structured self-monitoringof blood glucose signif-icantly reduces A1C levels in poorly controlled,noninsulin-treated type 2 diabetes: results fromthe Structured Testing Program study. DiabetesCare 2011;34:262–263. Franciosi M, Lucisano G, Pellegrini F, et al.;ROSES StudyGroup. ROSES: role of self-monitoringof blood glucose and intensive education in pa-tients with type 2 diabetes not receiving insulin.A pilot randomized clinical trial. Diabet Med2011;28:789–7964. Kempf K, Kruse J, Martin S. ROSSO-in-praxifollow-up: long-term effects of self-monitoringof blood glucose on weight, hemoglobin A1c,and quality of life in patients with type 2 diabetesmellitus. Diabetes Technol Ther 2012;14:59–645. Bolli GB. Hypoglycaemia unawareness. Diabe-tes Metab 1997;23(Suppl. 3):29–356. Gold AE, MacLeod KM, Frier BM. Frequency ofsevere hypoglycemia in patients with type I dia-betes with impaired awareness of hypoglycemia.Diabetes Care 1994;17:697–7037. American Diabetes Association. Standards ofMedical Care in Diabetesd2017. Diabetes Care2017;40(Suppl. 1):S1–S1358. Orchard TJ, Nathan DM, Zinman B, et al.; Writ-ing Group for the DCCT/EDIC Research Group.Association between 7 years of intensive treat-ment of type 1 diabetes and long-term mortality.JAMA 2015;313:45–539. Holman RR, Paul SK, BethelMA,Matthews DR,Neil HAW. 10-year follow-up of intensive glucosecontrol in type 2 diabetes. N Engl JMed 2008;359:1577–158910. Garber AJ, Abrahamson MJ, Barzilay JI, et al.;American Association of Clinical Endocrinologists(AACE); American College of Endocrinology (ACE).Consensus statement by the American Associa-tion of Clinical Endocrinologists andAmericanCol-lege of Endocrinology on the comprehensivetype2diabetesmanagementalgorithm–2016 Ex-ecutive Summary. Endocr Pract 2016;22:84–11311. National Institute for Health and Care Ex-cellence (NICE). Diabetes (type 1 and type 2) inchildren and young people: diagnosis and man-agement, 2015. NICE guideline [NG18]. London,U.K., National Institute for Health and Care Excel-lence. Available fromwww.nice.org.uk/guidance/NG18. Accessed 4 May 201712. National Institute of Diabetes and Digestiveand Kidney Diseases. Sickle cell trait & other he-moglobinopathies & diabetes (for providers) [In-ternet], 2014. Available from http://diabetes.niddk.nih.gov/dm/pubs/hemovari-A1C/index.aspx. Accessed 26 August 201713. Bry L, Chen PC, Sacks DB. Effects of hemoglo-bin variants and chemically modified derivatives
1638 Consensus Report Diabetes Care Volume 40, December 2017
on assays for glycohemoglobin. Clin Chem 2001;47:153–16314. Ford ES, Cowie CC, Li C, Handelsman Y,Bloomgarden ZT. Iron-deficiency anemia, non-iron-deficiency anemia and HbA1c among adultsin the US. J Diabetes 2011;3:67–7315. Nielsen LR, Ekbom P, Damm P, et al. HbA1clevels are significantly lower in early and latepreg-nancy. Diabetes Care 2004;27:1200–120116. Bergenstal RM, Gal RL, Connor CG, et al.; T1DExchange Racial Differences Study Group. Racialdifferences in the relationship of glucose concen-trations and hemoglobin A1c levels. Ann InternMed 2017;167:95–10217. Shipman KE, Jawad M, Sullivan KM, Ford C,Gama R. Ethnic/racial determinants of glycemicmarkers in a UK sample. Acta Diabetol 2015;52:687–69218. Wolffenbuttel BHR, Herman WH, Gross JL,DharmalingamM, Jiang HH, Hardin DS. Ethnic dif-ferences in glycemicmarkers inpatientswith type2diabetes. Diabetes Care 2013;36:2931–293619. Herman WH. Are there clinical implications ofracial differences inHbA1c? Yes, to not consider cando great harm!DiabetesCare 2016;39:1458–146120. Beck RW, Connor CG, Mullen DM, Wesley,DM, Bergenstal RM. The fallacy of average: howusing HbA1c alone to assess glycemic control canbe misleading. Diabetes Care 2017;40:994–99921. Fullerton B, Jeitler K, Seitz M, Horvath K,Berghold A, Siebenhofer A. Intensive glucose con-trol versus conventional glucose control for type 1diabetes mellitus. Cochrane Database Syst Rev2014;14:CD00912222. Nathan DM, Genuth S, Lachin J, et al.; Diabe-tes Control and Complications Trial ResearchGroup. The effect of intensive treatment of dia-betes on the development and progression oflong-term complications in insulin-dependent di-abetes mellitus. N Engl J Med 1993;329:977–98623. Miller KM, Beck RW, Bergenstal RM, et al.;T1D Exchange Clinic Network. Evidence of astrong association between frequency of self-monitoring of blood glucose and hemoglobinA1c levels in T1D Exchange clinic registry partici-pants. Diabetes Care 2013;36:2009–201424. Bolinder J, Antuna R, Geelhoed-Duijvestijn P,Kroger J, Weitgasser R. Novel glucose-sensingtechnology and hypoglycaemia in type 1 diabetes:a multicentre, non-masked, randomised con-trolled trial. Lancet 2016;388:2254–226325. Haak T, Hanaire H, Ajjan R, Hermanns N,Riveline JP, RaymanG. Flash glucose-sensing tech-nology as a replacement for blood glucose mon-itoring for themanagementof insulin-treated type2diabetes: amulticenter, open-label randomized con-trolled trial. Diabetes Ther 2016;8:55–7326. Kropff J, Choudhary P, Neupane S, et al.Accuracy and longevity of an implantable continu-ous glucose sensor in the PRECISE study: a 180-day,prospective, multicenter, pivotal trial. DiabetesCare 2017;40:63–6827. Juvenile Diabetes Research Foundation Con-tinuous Glucose Monitoring Study Group. Effec-tiveness of continuous glucose monitoring in aclinical careenvironment:evidence fromthe JuvenileDiabetes Research Foundation Continuous GlucoseMonitoring (JDRF-CGM) trial. Diabetes Care 2010;33:17–2228. Hermanides J, Nørgaard K, Bruttomesso D,et al. Sensor-augmented pump therapy lowersHbA1c in suboptimally controlled type 1 diabetes;
a randomized controlled trial. Diabet Med 2011;28:1158–116729. Battelino T, Conget I, Olsen B, et al.; SWITCHStudy Group. The use and efficacy of continuousglucose monitoring in type 1 diabetes treatedwith insulin pump therapy: a randomised con-trolled trial. Diabetologia 2012;55:3155–316230. New JP, Ajjan R, Pfeiffer AF, Freckmann G.Continuous glucose monitoring in people with di-abetes: the randomized controlled Glucose LevelAwareness in Diabetes Study (GLADIS). DiabetMed 2015;32:609–61731. Wong JC, Foster NC, Maahs DM, et al.; T1DExchange Clinic Network. Real-time continuousglucose monitoring among participants in theT1D Exchange clinic registry. Diabetes Care2014;37:2702–270932. Riveline JP, Schaepelynck P, Chaillous L, et al.;EVADIAC Sensor Study Group. Assessment ofpatient-led or physician-driven continuous glu-cosemonitoring in patientswithpoorly controlledtype 1 diabetes using basal-bolus insulin regi-mens: a 1-year multicenter study. Diabetes Care2012;35:965–97133. Rachmiel M, Landau Z, BoazM, et al. The useof continuous glucose monitoring systems in apediatric population with type 1 diabetesmellitusin real-life settings: the AWeSoMe Study Groupexperience. Acta Diabetol 2015;52:323–32934. Bergenstal RM, Klonoff DC, Garg SK, et al.;ASPIRE In-Home Study Group. Threshold-basedinsulin-pump interruption for reduction of hypo-glycemia. N Engl J Med 2013;369:224–23235. Weinstock RS, Xing D, Maahs DM, et al.; T1DExchangeClinicNetwork. Severe hypoglycemia anddiabetic ketoacidosis in adults with type 1 diabe-tes: results from the T1D Exchange clinic registry.J Clin Endocrinol Metab 2013;98:3411–341936. Pickup JC, Freeman SC, Sutton AJ. Glycaemiccontrol in type 1 diabetes during real time contin-uous glucose monitoring compared with selfmonitoring of blood glucose: meta-analysis ofrandomised controlled trials using individual pa-tient data. BMJ 2011;343:d380537. Garg SK, Voelmle MK, Beatson CR, et al. Useof continuous glucosemonitoring in subjects withtype 1 diabetes onmultiple daily injections versuscontinuous subcutaneous insulin infusion ther-apy: a prospective 6-month study. Diabetes Care2011;34:574–57938. Beck RW, Riddlesworth T, Ruedy K, et al.;DIAMOND Study Group. Effect of continuous glu-cose monitoring on glycemic control in adultswith type 1 diabetes using insulin injections: theDIAMOND randomized clinical trial. JAMA 2017;317:371–37839. Huang ES, O’Grady M, Basu A, et al.; JuvenileDiabetes Research Foundation Continuous Glu-cose Monitoring Study Group. The cost-effective-ness of continuous glucose monitoring in type 1diabetes. Diabetes Care 2010;33:1269–127440. McQueen RB, Ellis SL, Campbell JD, Nair KV,Sullivan PW. Cost-effectiveness of continuous glu-cose monitoring and intensive insulin therapy fortype 1 diabetes. Cost Eff Resour Alloc 2011;9:1341. Roze S, Saunders R, Brandt AS, de Portu S,Papo NL, Jendle J. Health-economic analysis ofreal-time continuous glucose monitoring in peo-ple with type 1 diabetes. Diabet Med 2015;32:618–62642. Ly TT, Brnabic AJ, Eggleston A, et al. A cost-effectiveness analysis of sensor-augmented
insulin pump therapy and automated insulin sus-pension versus standard pump therapy for hypo-glycemic unaware patients with type 1 diabetes.Value Health 2014;17:561–56943. Roze S, Smith-Palmer J, Valentine WJ, et al.Long-term health economic benefits of sensor-augmented pump therapy vs continuous subcuta-neous insulin infusion alone in type 1 diabetes: aU.K. perspective. J Med Econ 2016;19:236–24244. Roze S, Smith-Palmer J, Valentine W, et al.Cost-effectiveness of sensor-augmented pumptherapy with low glucose suspend versus stan-dard insulin pump therapy in twodifferent patientpopulations with type 1 diabetes in France. Dia-betes Technol Ther 2016;18:75–8445. Beck RW, Riddlesworth TD, Ruedy K, et al.;DIAMOND Study Group. Continuous glucosemonitoring versus usual care in patients withtype 2 diabetes receiving multiple daily insulininjections: a randomized trial. Ann Intern Med2017;167:365–37446. Yoo HJ, An HG, Park SY, et al. Use of a realtime continuous glucose monitoring systemas a motivational device for poorly controlledtype 2 diabetes. Diabetes Res Clin Pract 2008;82:73–7947. Vigersky RA, Fonda SJ, Chellappa M, WalkerMS, Ehrhardt NM. Short- and long-term effects ofreal-time continuous glucose monitoring in pa-tients with type 2 diabetes. Diabetes Care 2012;35:32–3848. Carlson AL, Mullen DM, Bergenstal RM. Clin-ical use of continuous glucose monitoring inadults with type 2 diabetes. Diabetes TechnolTher 2017;19(Suppl. 2):S4–S1149. Obermaier K, Schmelzeisen-Redeker G,Schoemaker M, et al. Performance evaluationsof continuous glucosemonitoring systems: pre-cision absolute relative deviation is part of theassessment. J Diabetes Sci Technol 2013;7:824–83250. Kovatchev BP, Patek SD, Ortiz EA, BretonMD.Assessing sensor accuracy for non-adjunct use ofcontinuous glucose monitoring. Diabetes TechnolTher 2015;17:177–18651. Cryer PE. The barrier of hypoglycemia in di-abetes. Diabetes 2008;57:3169–317652. Campbell MS, Schatz DA, Chen V, et al.; T1DExchangeClinicNetwork. A contrast between child-ren and adolescents with excellent and poor con-trol: the T1D Exchange clinic registry experience.Pediatr Diabetes 2014;15:110–11753. Lipska KJ, Warton EM, Huang ES, et al. HbA1cand risk of severe hypoglycemia in type 2 diabe-tes: the Diabetes and Aging Study. Diabetes Care2013;36:3535–354254. Heller SR, Cryer PE. Reduced neuroendocrineand symptomatic responses to subsequent hypo-glycemia after 1 episode of hypoglycemia in non-diabetic humans. Diabetes 1991;40:223–22655. Davis MR, Mellman M, Shamoon H. Furtherdefects in counterregulatory responses inducedby recurrent hypoglycemia in IDDM. Diabetes1992;41:1335–134056. Davis SN,Mann S, Galassetti P, et al. Effects ofdiffering durations of antecedent hypoglycemiaon counterregulatory responses to subsequenthypoglycemia in normal humans. Diabetes 2000;49:1897–190357. Oz G, Kumar A, Rao JP, et al. Human brainglycogen metabolism during and after hypoglyce-mia. Diabetes 2009;58:1978–1985
care.diabetesjournals.org Danne and Associates 1639
58. Kovatchev BP, Cox DJ, Gonder-Frederick LA,Young-Hyman D, Schlundt D, Clarke W. Assess-ment of risk for severe hypoglycemia amongadults with IDDM: validation of the low bloodglucose index. Diabetes Care 1998;21:1870–187559. Fabris C, Patek SD, Breton MD. Are risk in-dices derived from CGM interchangeable withSMBG-based indices? J Diabetes Sci Technol2015;10:50–5960. Temelkova-Kurktschiev TS, Koehler C, HenkelE, Leonhardt W, Fuecker K, Hanefeld M. Postchal-lenge plasma glucose and glycemic spikes aremore strongly associated with atherosclerosisthan fasting glucose or HbA1c level. DiabetesCare 2000;23:1830–183461. Haffner SM. Do interventions to reduce cor-onary heart disease reduce the incidenceof type2diabetes? A possible role for inflammatory fac-tors. Circulation 2001;103:346–34762. Esposito K, Giugliano D, Nappo F, Marfella R;Campanian Postprandial Hyperglycemia StudyGroup. Regression of carotid atherosclerosis bycontrol of postprandial hyperglycemia in type 2diabetes mellitus. Circulation 2004;110:214–21963. Monnier L, Mas E, Ginet C, et al. Activation ofoxidative stress by acute glucose fluctuationscompared with sustained chronic hyperglycemiain patients with type 2 diabetes. JAMA 2006;295:1681–168764. Cox DJ, Kovatchev BP, Julian DM, et al. Fre-quencyof severehypoglycemia in insulin-dependentdiabetesmellitus can be predicted from self-mon-itoring blood glucose data. J Clin EndocrinolMetab 1994;79:1659–166265. DeVries JH. Glucose variability: where it isimportant and how to measure it. Diabetes2013;62:1405–1408
66. Hirsch IB. Glycemic variability and diabetescomplications: does it matter? Of course it does!Diabetes Care 2015;38:1610–161467. Service FJ. Glucose variability. Diabetes 2013;62:1398–140468. Bergenstal RM. Glycemic variability and dia-betes complications: does it matter? Simply put,there are better glycemic markers! Diabetes Care2015;38:1615–16269. RodbardD. Thechallengesofmeasuringglycemicvariability. J Diabetes Sci Technol 2012;6:712–71570. Kovatchev B, Cobelli C. Glucose variability:timing, risk analysis, and relationship to hypoglyce-mia in diabetes. Diabetes Care 2016;39:502–51071. Reichard P, Pihl M. Mortality and treatmentside-effects during long-term intensified conven-tional insulin treatment in the Stockholm DiabetesIntervention Study. Diabetes 1994;43:313–31772. Kovatchev BP, Flacke F, Sieber J, Breton MD.Accuracy and robustness of dynamical tracking ofaverage glycemia (A1c) to provide real-time esti-mation of hemoglobin A1c using routine self-monitored blood glucose data. Diabetes TechnolTher 2014;16:303–30973. Egi M, Bellomo R, Stachowski E, French CJ,Hart G. Variability of blood glucose concentrationand short-term mortality in critically ill patients.Anesthesiology 2006;105:244–25274. Eslami S, Taherzadeh Z, Schultz MJ, Abu-Hanna A. Glucose variability measures and theireffect onmortality: a systematic review. IntensiveCare Med 2011;37:583–59375. Qu Y, Jacober SJ, Zhang Q, Wolka LL, DeVriesJH. Rate of hypoglycemia in insulin-treated pa-tients with type 2 diabetes can be predictedfrom glycemic variability data. Diabetes TechnolTher 2012;14:1008–1012
76. El-Laboudi AH, Godsland IF, Johnston DG,Oliver NS. Measures of glycemic variability intype 1 diabetes and the effect of real-time con-tinuous glucose monitoring. Diabetes TechnolTher 2016;18:806–81277. Monnier L, Colette C, Wojtusciszyn A, et al.Toward defining the threshold between low andhigh glucose variability in diabetes. Diabetes Care2017;40:832–83878. Rodbard D. Interpretation of continuous glu-cose monitoring data: glycemic variability andquality of glycemic control. Diabetes TechnolTher 2009;11(Suppl. 1):S55–S6779. International Diabetes Center. AGP - Ambu-latory Glucose Profile: AGP reports. Availablefrom http://www.agpreport.org/agp/agpreports.Accessed 17 July 201780. Medtronic. New CareLink iPro Pattern Snap-shot. Available from https://professional.medtronicdiabetes.com/para/new-carelink�-ipro�-pattern-snapshot-report. Accessed 29 Au-gust 201781. Dexcom. Dexcom CLARITY Diabetes Manage-ment Software. Available from https://www.dexcom.com/clarity. Accessed 29 August 201782. Bergenstal RM, Ahmann AJ, Bailey T, et al.Recommendations for standardizing glucose re-porting and analysis to optimize clinical decisionmaking in diabetes: the Ambulatory Glucose Pro-file (AGP). Diabetes Technol Ther 2013;15:198–21183. Xing D, Kollman C, Beck RW, et al.; JuvenileDiabetes Research Foundation Continuous Glu-cose Monitoring Study Group. Optimal samplingintervals to assess long-term glycemic control us-ing continuous glucose monitoring. DiabetesTechnol Ther 2011;13:351–358
1640 Consensus Report Diabetes Care Volume 40, December 2017