Embed Size (px)
Citation preview

Copyright copy 2007 Global Insight Inc wwwglob
International Container Trade
and California Ports
May 22 2007
Senate Transportation Sub-Committee on California Ports and Goods Movement
Sacramento CA
Paul Bingham Global Insight Inc
alinsightcom 1
2Copyright copy 2007 Global Insight Inc wwwglobalinsightcom
Imports and Exports Continue to Increase as a Share of the US Economy (as share of GDP)
3
6
9
12
15
18
21
1975 1980 1985 1990 1995 2000 2005 2010 2015
Imports Exports
(Percent Share of US Real Gross Domestic Product)
Source Global Insight US Macroeconomic Forecast Service
(Annual percent change)
World Container Trade Has Been Growing Faster Than The World Economy Though The Gap Is Narrowing
-1
1
3
5
7
9
11
13
15
1995 1996 1997 1998 1999 2000 2001 2002 2003 2004 2005 2006 2007 2008 2009 2010
World TEUs
Source Global Insight World Service and World Trade Service
Copyright copy 2007 Global Insight Inc wwwglobalinsightcom 3
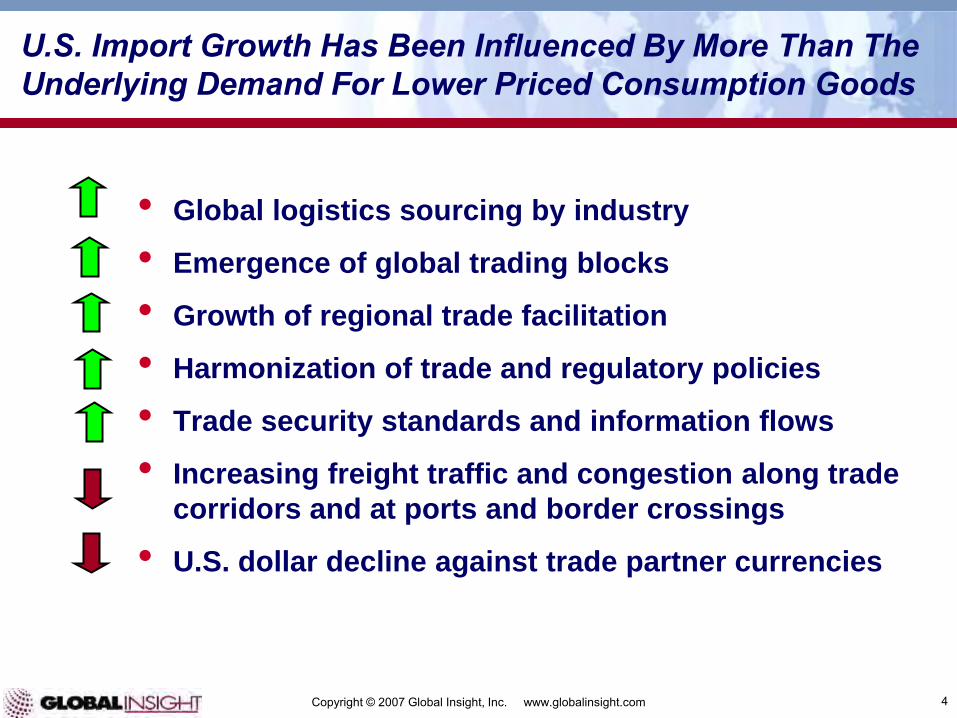
US Import Growth Has Been Influenced By More Than The Underlying Demand For Lower Priced Consumption Goods
bull Global logistics sourcing by industry
bull Emergence of global trading blocks
bull Growth of regional trade facilitation
bull Harmonization of trade and regulatory policies
bull Trade security standards and information flows
bull Increasing freight traffic and congestion along trade
corridors and at ports and border crossings
bull US dollar decline against trade partner currencies
Copyright copy 2007 Global Insight Inc wwwglobalinsightcom 4
California Portsrsquo Share Of US Ocean Container Trade Has Increased While Traffic Has Grown
Source Global Insight analysis of American Assoc of Port Authorities Data
Copyright copy 2007 Global Insight Inc wwwglobalinsightcom 5
Electrical Appliances
Textiles
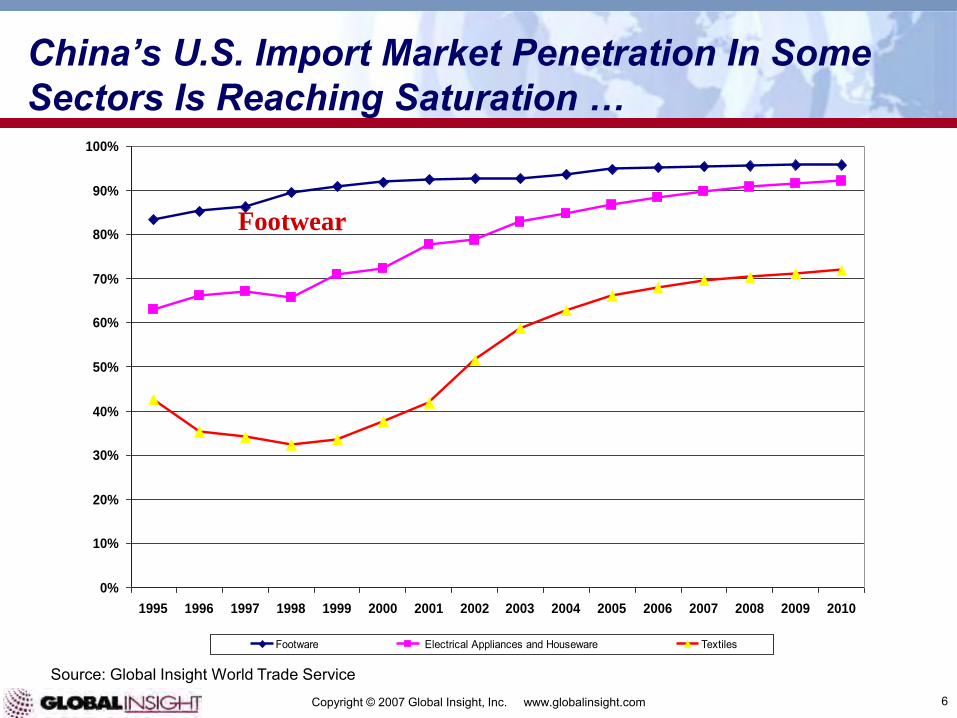
Chinarsquos US Import Market Penetration In Some Sectors Is Reaching Saturation hellip
0
10
20
30
40
50
60
70
80
90
100
1995 1996 1997 1998 1999 2000 2001 2002 2003 2004 2005 2006 2007 2008 2009 2010
Footware Electrical Appliances and Houseware Textiles
Footwear
Source Global Insight World Trade Service Copyright copy 2007 Global Insight Inc wwwglobalinsightcom 6
China Has Additional US Commodity Market Segments Yet To Capture
0
10
20
30
40
50
60
70
80
1995 1996 1997 1998 1999 2000 2001 2002 2003 2004 2005 2006 2007 2008 2009 2010
Semi-conductors Electronic Tubesetc Office and Computing Machinery
Office and Computing
Equipment
Semi-conductors
Electronic parts etc
Source Global Insight World Trade Service Copyright copy 2007 Global Insight Inc wwwglobalinsightcom 7
8Copyright copy 2007 Global Insight Inc wwwglobalinsightcom
As China Broadens Its Markets The US Becomes Less Important Even While US - China Trade Volume Triples
US Share of China Exports
0
5000000
10000000
15000000
20000000
25000000
30000000
35000000
40000000
2000 2001 2002 2003 2004 2005 2006 2007 2008 2009 2010
TE
Us
290
300
310
320
330
340
350
360
370
380
390
400
US
Sh
are
World Total United States United States Share of Ch Exp
Source Global Insight World Trade Service
Total US Logistics Costs Are Now Increasing As A Share Of The US Economy (as percent of GDP)
0
2
4
6
8
10
12
1994 1995 1996 1997 1998 1999 2000 2001 2002 2003 2004 2005
(Percent of Gross Domestic Product)
Source Council of Supply Chain Management Professionals 2006
Copyright copy 2007 Global Insight Inc wwwglobalinsightcom 9
Transportation Still Makes up Most of Total Logistics Costs in the United States
(Percent of 2005 Total US Logistics Costs)
Source Council of Supply Chain Management Professionals 2006
Sensitivity to Transportation Costs is Increasing
Copyright copy 2007 Global Insight Inc wwwglobalinsightcom 10
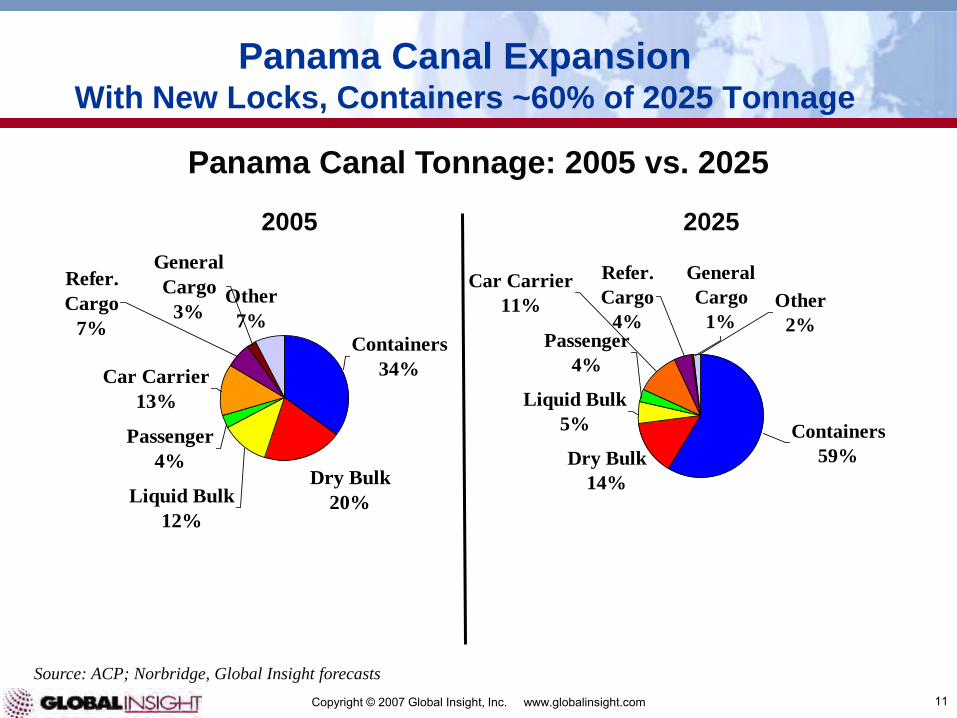
Panama Canal Expansion With New Locks Containers ~60 of 2025 Tonnage
Dry Bulk
20Liquid Bulk
12
Passenger
4
Car Carrier
13
Other
7
Containers
34
General
Cargo
3
Refer
Cargo
7
Dry Bulk
14
Liquid Bulk
5
Passenger
4
Containers
59
Refer
Cargo
4Other
2
General
Cargo
1
Car Carrier
11
Panama Canal Tonnage 2005 vs 2025
20252005
Source ACP Norbridge Global Insight forecasts
Copyright copy 2007 Global Insight Inc wwwglobalinsightcom 11
Mexican Alternatives
12Copyright copy 2007 Global Insight Inc wwwglobalinsightcom
in Development P
un
ta C
olo
net
Lazaro Cardenas
Manzanillo
Alfa-Omega Line
bull Container volumes continue to grow
bull USWC competitive distance markets
bull All-water service costs go up
bull Wrinkles to iron out in Mexico
bull MHFM Transport (Mexico)
bull SPV (Japan)
bull Arias Asia (China)
bull Hutchison (- UP RR)
bull BNSF + Grupo Mexico
bull MTC + Carlos Slim
bull Others
Thank You
Paul Bingham
Global Insight Inc
paulbinghamglobalinsightcom
wwwglobalinsightcom
Copyright copy 2007 Global Insight Inc wwwglobalinsightcom 13

2Copyright copy 2007 Global Insight Inc wwwglobalinsightcom
Imports and Exports Continue to Increase as a Share of the US Economy (as share of GDP)
3
6
9
12
15
18
21
1975 1980 1985 1990 1995 2000 2005 2010 2015
Imports Exports
(Percent Share of US Real Gross Domestic Product)
Source Global Insight US Macroeconomic Forecast Service
(Annual percent change)
World Container Trade Has Been Growing Faster Than The World Economy Though The Gap Is Narrowing
-1
1
3
5
7
9
11
13
15
1995 1996 1997 1998 1999 2000 2001 2002 2003 2004 2005 2006 2007 2008 2009 2010
World TEUs
Source Global Insight World Service and World Trade Service
Copyright copy 2007 Global Insight Inc wwwglobalinsightcom 3
US Import Growth Has Been Influenced By More Than The Underlying Demand For Lower Priced Consumption Goods
bull Global logistics sourcing by industry
bull Emergence of global trading blocks
bull Growth of regional trade facilitation
bull Harmonization of trade and regulatory policies
bull Trade security standards and information flows
bull Increasing freight traffic and congestion along trade
corridors and at ports and border crossings
bull US dollar decline against trade partner currencies
Copyright copy 2007 Global Insight Inc wwwglobalinsightcom 4
California Portsrsquo Share Of US Ocean Container Trade Has Increased While Traffic Has Grown
Source Global Insight analysis of American Assoc of Port Authorities Data
Copyright copy 2007 Global Insight Inc wwwglobalinsightcom 5
Electrical Appliances
Textiles
Chinarsquos US Import Market Penetration In Some Sectors Is Reaching Saturation hellip
0
10
20
30
40
50
60
70
80
90
100
1995 1996 1997 1998 1999 2000 2001 2002 2003 2004 2005 2006 2007 2008 2009 2010
Footware Electrical Appliances and Houseware Textiles
Footwear
Source Global Insight World Trade Service Copyright copy 2007 Global Insight Inc wwwglobalinsightcom 6
China Has Additional US Commodity Market Segments Yet To Capture
0
10
20
30
40
50
60
70
80
1995 1996 1997 1998 1999 2000 2001 2002 2003 2004 2005 2006 2007 2008 2009 2010
Semi-conductors Electronic Tubesetc Office and Computing Machinery
Office and Computing
Equipment
Semi-conductors
Electronic parts etc
Source Global Insight World Trade Service Copyright copy 2007 Global Insight Inc wwwglobalinsightcom 7
8Copyright copy 2007 Global Insight Inc wwwglobalinsightcom
As China Broadens Its Markets The US Becomes Less Important Even While US - China Trade Volume Triples
US Share of China Exports
0
5000000
10000000
15000000
20000000
25000000
30000000
35000000
40000000
2000 2001 2002 2003 2004 2005 2006 2007 2008 2009 2010
TE
Us
290
300
310
320
330
340
350
360
370
380
390
400
US
Sh
are
World Total United States United States Share of Ch Exp
Source Global Insight World Trade Service
Total US Logistics Costs Are Now Increasing As A Share Of The US Economy (as percent of GDP)
0
2
4
6
8
10
12
1994 1995 1996 1997 1998 1999 2000 2001 2002 2003 2004 2005
(Percent of Gross Domestic Product)
Source Council of Supply Chain Management Professionals 2006
Copyright copy 2007 Global Insight Inc wwwglobalinsightcom 9
Transportation Still Makes up Most of Total Logistics Costs in the United States
(Percent of 2005 Total US Logistics Costs)
Source Council of Supply Chain Management Professionals 2006
Sensitivity to Transportation Costs is Increasing
Copyright copy 2007 Global Insight Inc wwwglobalinsightcom 10
Panama Canal Expansion With New Locks Containers ~60 of 2025 Tonnage
Dry Bulk
20Liquid Bulk
12
Passenger
4
Car Carrier
13
Other
7
Containers
34
General
Cargo
3
Refer
Cargo
7
Dry Bulk
14
Liquid Bulk
5
Passenger
4
Containers
59
Refer
Cargo
4Other
2
General
Cargo
1
Car Carrier
11
Panama Canal Tonnage 2005 vs 2025
20252005
Source ACP Norbridge Global Insight forecasts
Copyright copy 2007 Global Insight Inc wwwglobalinsightcom 11
Mexican Alternatives
12Copyright copy 2007 Global Insight Inc wwwglobalinsightcom
in Development P
un
ta C
olo
net
Lazaro Cardenas
Manzanillo
Alfa-Omega Line
bull Container volumes continue to grow
bull USWC competitive distance markets
bull All-water service costs go up
bull Wrinkles to iron out in Mexico
bull MHFM Transport (Mexico)
bull SPV (Japan)
bull Arias Asia (China)
bull Hutchison (- UP RR)
bull BNSF + Grupo Mexico
bull MTC + Carlos Slim
bull Others
Thank You
Paul Bingham
Global Insight Inc
paulbinghamglobalinsightcom
wwwglobalinsightcom
Copyright copy 2007 Global Insight Inc wwwglobalinsightcom 13

Thank You
Paul Bingham
Global Insight Inc
paulbinghamglobalinsightcom
wwwglobalinsightcom
Copyright copy 2007 Global Insight Inc wwwglobalinsightcom 13