Embed Size (px)
Citation preview
INTERNATIONAL CORPORATE GOVERNANCE AND FINANCE: LEGAL, CULTURAL AND POLITICAL EXPLANATIONS
Hamadi Matoussi and Maha Khemakhem Jardak
Working Paper 503
September 2009
Send Correspondence to: Hamadi Matoussi; University of Manouba, Ariana, Tunisia Email: [email protected]
1
Abstract
Corporate governance has drawn much attention with recent managerial misbehavior and corporate scandals. Various laws and reports around the world came up with propositions and regulation to restore confidence and reinforce investor protection. La Porta, Lopez, Shleifer and Vishny (LLSV 1998-2002) built up their theory on the protection of investors by the legal system. Roe’s political theory (2003) challenges the LLSV’s legal theory and provides another explanation for the differences between countries centered on the political variables. The cultural theory (Licht 2001) argues that cross country differences in corporate governance can be explained by differences between national cultures. The objective of this research is to examine the disparity and the determinants of the investor protection regulations around the world. More specifically, we try to explain this disparity by legal and cultural variables. We investigate empirically the disparity of the investor protection regulations measured by the index established by the World Bank across 81 emerging and developed countries in 2006. Our results confirm that combining classifications based on cultural dimensions, religion and on legal families can shed some light on the obscure part of the comparative analysis of corporate governance and investor protection.
ملخص
أسفرت مختلف .جذبت حوآمة الشرآات إهتماما آبيرا إزاء سوء التصرفات اإلدارية وفضائح الشرآات في اآلونة األخيرة
وقد بني آل من ال . حماية المستثمرالقوانين والتقارير علي مستوى العالم عن إقتراحات وتنظيمات إلستعادة الثقة وتعزيز. نظريتهم علي حماية المستثمرين عن طريق النظام القانوني (LLSV 1998-2002) بورت ولوبيز وشيلفر وفيشنيالقانونية وقدمت تفسيرا آخر للفروق بين الدول التي ترآز علي LLSV نظرية ) 2003(وتتحدي نظرية روي السياسية
الثقافية إن اإلختالفات علي مستوي الدول في حوآمة الشرآات يمكن ( Licht 2001) قول نظريةوت. المتغيرات السياسيةويهدف هذا البحث إلي دراسة التفاوت بين تشريعات حماية المستثمر . تفسيرها بالرجوع إلي الفروق بين الثقافات الوطنية
.ذا التفاوت عن طريق المتغيرات القانونية والثقافيةأآثر تحديدا، فإننا نحاول أن نفسر ه .وحدداتها علي مستوي العالموسندرس علي نحو ضروري التباين بين تنظيمات حماية المستثمر المقاسة بواسطة المؤشر الذي أنشأه البنك الدولي عبر
ية وعلي روابط وتؤآد نتائجنا أن التصنيفات المجمعة المبنية علي أبعاد ثقافية ودين .2006 دولة ناشئة ومتقدمة في عام 81 .قانونية يمكنها أن تلقي بعض الضوء علي الجزء الغامض من التحليل المقارنة لحوآمة الشرآات وحماية المستثمر
2
1. Introduction
The differences in corporate governance and ownership structure among countries have persisted during the past half century despite convergence in economies and business practices. Companies share the same imperatives: the ability to raise new capital, the efficiency of resources allocation, the growth of firm value, and the availability of information to all decision-makers. These imperatives should drive countries and firms in advanced economies to adopt the same and the most efficient corporate rules and structures. But a simple observation of corporate ownership structure around the world shows that there are significant differences in corporate governance structures and ownership concentrations. In the United States and in the United Kingdom, publicly traded corporations have diffused ownership structure, whereas in other advanced economies and especially in Europe, firms continue to have a controlling shareholder. Employee involvement in the control of German corporations through codetermination also remains an important dimension of international differences. Concentrated family ownership in some European countries (French, Italian, Spanish), strong and powerful managers’ control of American and British firms, bank ownership of large blocks in Japan and mandated labor influence in Germany illustrate large differences among countries in their ownership patterns despite the global convergence of their economic practices and institutions.
Recent managerial misbehavior and corporate scandals; e.g. accounting manipulations, self-dealing behavior, excessive sale of stocks by managers just before a decline of share price draw much attention to corporate governance. The Enron scandal and bankruptcy raised serious doubts about the investor protection in US and led to more reform and regulation of the financial market1. On July 30, 2002, the US adopted the Sarbanes-Oxley act in order to enhance corporate responsibility and financial disclosures and combat corporate and accounting fraud2. Various laws and reports around the world came in response to restore confidence and to reinforce investor protection3.
As traditional research, these reforms tried to enhance corporate governance within the framework of agency theory. However, recent research argues that this theory fails to account for key differences across countries (Fligstein and Choo, 2005, Aguilera and Jackson, 2003). Thus, other theories have emerged. Researchers were challenged to theorize and to test empirically the cross national diversity in corporate governance and to identify key factors explaining these differences (La Porta et al., 1997-2002, Roe, 1994-2000, Licht, 2001, and Bebchuk and Roe, 1999). LLSV (1998-2002) raised the question of investor protection around the world. They argued that rights of investors depended on the legal rules of the jurisdictions where securities are issued. The laws and the quality of their enforcement are important determinants of what rights shareholders have and how well these rights are protected. The difference in legal protection of investors may explain why firms are financed and owned differently around the world. LLSV attribute the differences in legal rules across countries to the differences in their legal origins. They theorize and test empirically their predictions and find that common law countries (US, UK, Canada, etc…) have more protective laws than civil law countries (France, Germany, Italy, etc...). The Enron scandal and its bankruptcy raised serious doubts regarding investor protection in the US and consequently on the findings of LLSV (1998-2002). However, the quick reaction to the
1 See: “Recent corporate accounting scandals & the need for corporate governance reforms”, http://www.ipers.org/pdfs/news/corporategovernancereform.pdf. 2 The full text of the act is available at: http://www.sec.gov/about/laws/sae2002.pdf. 3 For example French law « loi sur la sécurité financière ».
3
Enron scandal and the adoption of the Sarbanes-Oxley act of 2002 could be viewed as proof of good protection of the US investor. This assertion had to be validated empirically after the Enron scandal in order to enhance La Porta’s approach and the market auto-regulation by the law (Sarbanes-Oxley act of 2002).
Roe (2003) challenged the LLSV theory and advanced the political variable to explain the differences in corporate governance around the world. The critical variables pointed out were political institutions, political orientations of governments, coalitions, ideologies and interest groups. Meanwhile, Gourevitch (2005) argued that politics shaped corporate governance in creating corporate law — namely that law was not an autonomous force because the process of creation, application and enforcement of law was driven by political preferences and coalitions between different players: managers, owners, workers. Gourevitch (2003) thought that in the case of the Enron crisis and the legal reform initiated in response, politics had undermined the quality of US corporate governance by changing the laws. The diversity of interests and preferences among shareholders, directors, managers, intermediaries, and accountants was reflected in the political marketplace where intermediaries colluded with managers at the expense of shareholders. Some wanted regulation to restore investor protection and confidence while others resist regulation to make more money.
Furthermore, several countries that recently implemented legal reforms to enhance investor protection have failed to produce desirable outcomes. It seems that changing the laws on the books and the act of simply writing investor rights into the law is not enough and does not guarantee improvement of corporate governance. Theorists, practitioners and policy makers share the view that cultural factors impact corporate governance and can impede changes and legal reforms. Ethnicity, customs, beliefs, shared values and religions appear as primordial factors that affect the effective system of corporate governance.
However, according to Licht (2001) and Licht, Goldschmidt, and Schwartz (2002-2005), cultural factors seem to be important in explaining the differences in corporate governance and ownership patterns. There are variations in cultures across the world and thus also in the values and priorities attached to certain behaviors and business practices. It would be a discouraging challenge to adopt rules to apply in all countries with different cultural values. Most countries around the world have already changed their rules after US reform to better protect their investors. In that context, some questions have to be resolved. Do these reforms adapt to national culture? Will these reforms be applied or will they be ignored?
In this research, we add new evidence to corporate governance patterns by investigating investor protection across countries. We adopt a global approach and conduct a cross-country analysis to explain differences in corporate governance. Our investigation covers developed and emerging economies — Christian, Muslim and others confessionals countries and also common law and civil law countries.
Specifically, we compare legal, cultural and political explanations of investor protection regulations. In order to do that, we first investigate what explains investor protection regulations around the world. Our attempt is to see if legal rules, culture and politics have a remarkable impact on the actual level of investor protection across countries and determine inevitably the success of the investor protection reforms. It is also interesting to see whether legal systems dominate culture and politics or whether they are complementary. In order to do that, we investigate empirically the disparity of investor protection regulations across 81 emerging and developed countries. We use a database developed by the World Bank from a survey on 175 countries published in Doing Business 2007. This database can be mobilized for research on corporate governance, since the World Bank has been involved in determining the key characteristics of good laws and has made a major contribution by
4
building a valuable index of investor protection. Then, we try to explain the disparity of legal investor protection rules by legal, cultural and political variables. The results show that legal origin remains an important variable in explaining the disparity of legal investor protection rules. However, cultural value dimensions proved to be an instrument rather than an isolated determinant of investor protection. Political dimensions also give additional explicative power to the model when they are added to legal origin and culture.
2. Theoretical Framework: Legal, Political, and Cultural Explanations of Corporate Governance Patterns The object of this section is twofold: to develop the spirit of each approach and its empirical investigation, and to propose a conceptual model which underlies our empirical investigation.
2.1 A Survey of Previous Literature There are broadly three major issues addressed in the literature to explain corporate governance patterns: the legal factor of LLSV (1997-2002), the political factor of Roe (2003) and Gourevitch (2003, 2005) and the cultural factor of Licht (2001) and Licht et al. (2002-2005). LLSV (1998) argue that the extent to which a country’s laws protect investor rights and the extent to which they are enforced are central to understanding the patterns of corporate governance and finance in different countries. Roe (2003) critiques the LLSV theory and states that there are variables other than law and its quality which are important in explaining the differences in ownership structure and corporate governance models around the world. The most critical one of these variables is politics as laws are made and enforced by political systems. Licht (2001) puts forward a novel theory about the role of culture in the development of corporate governance and financial regulation.
2.1.1 The legal factor There are hundreds of legal systems in the world. But despite this variety researchers tried to group them by legal families. The advantage of this classification is that it saves time and energy in description or prediction. The classification depends on the criteria used. In the past, legal systems have often been grouped by geography, race, language, religion or official ideology. Looking at the historical development and substantive features of the legal systems around the world, we can see that many of them fall into one of two families. In the whole history of humanity only two peoples seem to have founded secular, comprehensive, enduring, and wide spread legal systems: the Romans of the ancient world and the Anglo-Normans of the middle ages. The pedigree of civil law goes back to ancient Rome. The common law world begins in England. The common law system resulted from the victory of private landholders over king and nobility. Laws were adopted to prevent seizure of land by the sovereign. Common laws were formed by judges who had to resolve specific disputes. After that, common law spread to British colonies including the United States, Canada, Australia, India, and others.
The civil or Romano Germanic law system is the oldest, most influential and most widely used around the world. It originates from Roman law, uses statutes and comprehensive codes as a principal means of ordering legal material and relies greatly on legal scholars to formulate its rules. Scholars have identified three civil law traditions: French, German and Scandinavian.
In France, Napoleon created the French civil law system because he did not want judges to have the discretion to restore feudal privileges after the French revolution. The French commercial code was written in 1807 and was brought by the army to Belgium, Netherlands, Italy, part of Poland, Saharan Africa, Indochina and French Caribbean islands. France extended its legal influence to Luxembourg, Portugal and Spain as well. It was mainly French
5
civil law that lawmakers of new nations relied on for inspiration. In Germany, the German civil law system provides for the independence of judges and the protection of individual propriety rights. It consists of a hybrid system that has proved effective in promoting economic growth. One proof of the effectiveness of the German system is that it was borrowed by Japan and Korea which have also experienced economic success.
The Scandinavian law system is usually viewed as a part of civil law tradition although its law is not as much derived from Roman law than from French and German traditions.
This legal factor was brought forward by LLSV (1997-2002). They argue that laws and their enforcement are central to understanding the patterns of corporate governance around the world. The legal origin of laws are viewed as the primary factor that affects almost all other variables affecting corporate governance and that exhibits the highest degree of exogeneity. LLSV (1999-2000-2002) showed how common law and civil law systems have impacted on investor protection, ownership structure and financial markets. Common law countries (US, Canada, New Zealand, Australia, etc…) have the strongest protection of foreign investors — both shareholders and creditors — and lead to ownership dispersion and a strong market valuation, whereas French civil law countries (French and Spanish colonies) have the weakest protection leading to ownership concentration. German civil law countries (Germanic countries in Europe and a number of countries in East Asia) and Scandinavian countries are in between, and have stronger protection of creditors.
LLSV (1998) examined empirically how laws protecting investors differ across 49 countries and how the quality of their enforcement varies. They define an anti-director right index composed of six items (vote by mail, deposit of shares prior to the shareholder meeting, representation of minorities on the board of directors, oppressed minorities mechanisms and minimum percentage of shares that entitles a shareholder to call an extraordinary shareholder meeting). This index ranges from 1 to 6. A country gets the score 1 for each item if it protects minority shareholders and 0 otherwise. The results show that the common law countries have the highest anti-director rights scores (US, Canada, UK, Japan) and French civil law countries have the lowest anti-director rights scores (France, Germany, Italy). Furthermore, LLSV controlled for the GNP per capita and to find that anti-director rights scores are independent of the GNP per capita.
However, other researchers criticized LLSV’s investor protection index and developed a new index with contradictory findings. Lele and Siems (2006) built a new shareholder protection index for two kinds of investors: active and passive shareholders. They measured the level of protection of the active shareholder by an aggregation of 32 variables related to shareholder meeting (for example, power of the general shareholder meeting, the involvement of shareholders, voting rules and individual information rights). They also measured the level of protection of passive shareholders by an aggregation of 28 variables covering the aspects of board structure, duration of directors, duties and rights of directors. They coded the development of the law for over three decades 1975-2005 for five countries: Germany, France, UK, US, and India.
Their main findings were that shareholder protection had improved during the last three decades, the protection of minority shareholders was significantly stronger in stockholder countries, and that convergence in shareholder protection had taken place since 1993 and has been on the rise since 2001. They conclude that the differences among the four developed countries did not confirm the conjecture that a distinction between the Anglo-Saxon world and continental Europe existed.
Djankov, La Porta, Lopez and Shleifer (2006) built a new indicator of investor protection calculated for 72 countries: the anti-self-dealing index against expropriation by insiders. This
6
index focused explicitly on self dealing while previous indicators neglected this dimension. The index was constructed with a formulated questionnaire which treated a hypothetical case study. The anti-self-dealing index was calculated by averaging the indices of ex ante and ex post private control of self-dealing. Djankov et al. (2006) used the anti-self-dealing index to address three objectives. The first was to identify the key factors that determine the structure of self-dealing regulations in different countries. They found that legal origin remained an important determinant of investor protection calculated with the new self dealing approach. Their second concern was to examine the relationship between the anti-self-dealing measure and the development of the financial market. They found that common law countries had more developed stock markets than civil law countries, particularly French civil law countries4. The results also demonstrated that common law was a good predictor of the anti-self-dealing index. Furthermore, neither measure of public enforcement was associated with stock market development. The third objective was to compare the anti-self-dealing index with other investor protection measures, namely the anti-director right index. They compared the performance of different measures of investor protection as predictors of financial development. They wanted to know whether the anti-self-dealing index worked better than the anti-director right index in explaining financial markets development. A comparison between the anti-director right index and the anti-self-dealing index indicated that when controlling for the anti-self dealing index, the anti-director index lost significance for stock market capitalization to GDP and ownership concentration. This allowed them to conclude that the anti-self-dealing index is a more robust predictor of the development of stock markets than the anti-director right index.
2.1.2 The political factor Historical events such as colonization could profoundly affect corporate governance through the transplantation of corporate governance systems and laws. Societies were forced to take the corporate governance system of their conquerors. Berkowitz et al. (2003) illustrated that the legitimacy of a legal system was affected by the condition under which it was transplanted and that this legitimacy has an impact on the effectiveness of the legal system. When there is pressure on a population to adopt a legal system, there is low legitimacy and the system will fail to produce an effective rule of law. The transplant of the common law system in the United States, Canada, Australia and the transplant of the French civil law system in Belgium, Netherlands, Italy, part of Poland, Saharan Africa, Indochina, affected the ownership structures of these countries and the evolution of their financial institutions (Beck, Demirguc-Kunt and Levine, 2003). In addition, the civil law or the common law classification is difficult to determine for some countries whose legal systems have been transferred from common law to civil law or from civil law to common law. Such countries have mixed systems influenced by both the civil and the common law systems (South Africa, Zambia, Namibia, Botswana, Sri Lanka, and Israel). Furthermore, some countries have mixed systems that incorporate civil or common law with religious law such as Islamic countries. Another example is India’s law which is based both on common law and separate personal law applied to Muslims, Hindus, and Christians. Thus, the classification of countries into common law and civil law systems is beneficial but has some weaknesses.
4 Specifically, the regulation of self-dealing (ex ante and ex post private control of self dealing) improves the stock market capitalization to GDP, reduces the private benefit of control, and increases the value of initial public offerings in each country relative to GDP. The ex post control and the index of self-dealing have a positive impact on the number of domestic publicly traded firms. However, only the ex post private control of self-dealing has an effect on ownership concentration (reduces ownership concentration). Anti-self-dealing is not associated with ownership concentration.
7
This reality provided Roe (2003) and Gourevitch (2003) with enough evidence to argue that the differences in ownership structure and corporate governance models around the world cannot be explained only by legal origins and quality of laws. Germany and Scandinavia have high quality of laws but do not have dispersed ownership. So something else is at work, namely politics. Roe (2003) postulates that Germany and Scandinavia have a high quality of law but concentrated ownership because they have strong labor and social democratic parties. He considers that class struggle (rising from the conflict between managers, owners and workers) is an important determinant of corporate governance. Shareholders, who fear collusion between managers and workers at their expense, try to protect their interests by concentrating their holdings in blocks. Where workers have power in the control and decision-making of firms, as they do in many of the European social democracies, corporate governance systems tend to favor ownership concentration. Workers are represented on the board of directors and participate in control of the firm (German codetermination). Where managers and owners have the power and resources to control the firms, corporate governance institutions favor shareholders over stakeholders. Ownership is dispersed, and workers lack formal power on the board of directors (US system of governance). Gourevitch (2003) argues that there are other cleavages. Politics that produce the regulations that shape corporate governance come from coalitions. Country case studies confirm this idea. In Sweden, the social democratic party has dominated the government for most of the past seventy years. Sweden was the model of strong unions and leftist government. In Germany, the Christian democrats have been the key to governments since the Second World War; the same for Italy and other parts of Europe. In the US, populist political movements were the key to creation of unions with lower level of power and in the fragmentation of finance. Farmers, free traders, workers, ethnic groups, investors, all attempted to produce coalitions against the aggregation of economic power. Labor influence on social democracy cannot produce ownership dispersion or governance models, but labor can interact together with other players to produce outcomes. Gourevitch argues that corporate governance literature has neglected to examine the impact of political institutions on shaping outcomes in the way politics deal with regulation on this issue. He argues that political forces (political institutions, political orientations of governments, coalitions, ideologies and interest groups) not only define the laws but also determine how these laws actually operate. Variation in the content of laws and enforcement might be the product of variation in political systems. He notes that where social democracy is strong, strong labor power presses managers to coalesce with them. Owners must consequently seek other means to control managers, and the best alternative is close ownership or ownership concentration. Thus, in social democracies, shareholder rights are weak and shareholder dispersion is low. Gourevitch (2003) extends the channels of political mechanisms that affect corporate governance and ownership to interest group preferences and cross class coalitions between owners, managers and workers on one hand and to political institutions such as electoral law, federalism, legislative-executive relations and party systems on the other hand.
The political issue didn’t inspire empirical investigation. It can be considered, in our sense, as an elucidation or a complementary argumentation to the legal issue.
2.1.3 The cultural factor It seems that changing the laws on the books and the act of simply writing investor rights into the law is not enough and does not guarantee improvement of corporate governance. Theorists, practitioners and policy makers share the view that cultural factors impact corporate governance and can impede change and legal reforms. Ethnicity, customs, beliefs, shared values and religions appear as primordial factors that affect the corporate governance system’s efficiency. For example, the cultural environment in East-central Europe is a
8
potential impediment to change. After the failure of the communist regimes between 1989 and 1993, a comparative analysis between Western and Eastern European countries which had endured communist rule shows that the communist countries are strongly authorized cultural embeddedness and hierarchy. These values are compatible with low perceived legality. Thus, achieving social change through legal reform faces serious obstacles in such countries. Legal factors cannot be effective alone, because other factors such as culture play an important role. Existing cultural values block change and generate path dependence. Cultural values adjustments take place slowly in response to changed life circumstances and favored legal reforms.
The question raised in this context is: can we find cultural values compatible with reforms and changes?
Licht et al. (2005) argue that “the link between societal aversion to litigation and high scores on harmony and uncertainty avoidance implies that in such high scoring countries implementing a new legal regime may require alternative to the courts system”. Thus, in countries where investor protection cannot occur within the court system, active regulation by the State is required. They also argue that “cultural emphases on embeddedness and hierarchy prevalent in many developing and transition economies may be conductive to corruption, in parallel to general disregard of the law”. Countries that develop social norms that do not rely on litigation, such as Asian societies, certainly have other mechanisms of governance than the mechanisms known in the West.
The cultural factor empirically investigated by Stulz and Williamson (2003) and Licht et al. (2005), shows that cross country differences in corporate governance can be explained by differences between national cultures.
Stulz and Williamson (2003) explored whether differences in culture represented by religion and language, can explain differences in investor protection around the world. They argued that if predominant values in some countries were less supportive of market interactions than in other countries, one would expect a lower degree of investor protection, because enhancement of investor rights was less valued in these societies, and institutions produced by such cultures regarded financial markets as less valuable. They used two proxies for culture: religion as a key component of the system of beliefs and language which is the vehicle to communicate beliefs. Data on legal origin, investor and creditor rights and rule of law were taken from LLSV’s research. The data on each country’s primary religion and primary language was taken from the 2000 CIA World Factbook. The primary religion (Protestant, Catholic, Muslim, and Buddhist) is the religion practiced by the largest percentage of the population of a country. They thought that the dominant religion should have the primary influence on that country and that the impact of religion was not proportional as claimed by LLSV. Furthermore, groups of common languages shared the same features of organization and views. Stulz and Williamson identified two main languages in their sample: English and Spanish. The results showed that English speaking countries and Protestant countries made it easier for shareholders to vote. They examined the correlation between culture proxies and the enforcement of rights (rule of law, corruption, risk of expropriation, accounting standards). They found that language was irrelevant except for accounting standards. Protestant countries had better enforcement and especially higher standards than Catholic countries. Their results showed that the Protestant, Catholic and English speaking countries had higher investor protection than other countries, that Protestant countries had a higher corruption index (less corrupt) than Catholic, Muslim and Buddhist countries, that Protestant and Buddhist countries had a higher repudiation risk, that Protestant and Catholic had a higher expropriation index, that Spanish countries had a lower
9
expropriation index and finally that English speaking countries had a higher accounting index than Spanish countries.
Licht et al. (2005) investigated in what ways the laws on the books reflected countries’ national culture. They used LLSV’s dataset to operationalize legal rules, and the cultural value dimensions framework to conceptualize culture. More specifically, they used the culture value dimensions identified in cross-cultural psychology to characterize cultures of different societies and measured culture by Schwartz and Hofstede’s value dimensions. They demonstrated, through an international comparative analysis, that combining classifications based on cultural dimensions and on the legal families could shed some light on the obscure part of the comparative explanation.
2.2 The Conceptual Model
According to Licht (2005), the link between culture and law is absent in economic theory. He recalls the Williamson framework (2000), which advances a notional model to capture the new institutional economics. Williamson distinguishes four levels (Figure 1). We see from that model that Williamson adopts a historical perspective to explain how institutions have evolved. In effect, economic outcomes (and countries’ development) is affected by the governance structure of firms and other organizations. Yet the governance structure relies greatly on the legal rules in place, which are the result of informal institutions. For Licht (2005), Levels 1 and 2 represent the culture and legal factors respectively5. Corporate governance and investor protection are a result of the interaction of the two levels.
We think that politics cannot be dissociated from culture and law. Indeed, politics can be affected either by culture or by law and vice versa. Now, if we integrate (according to Roe, 2003 and Gourevitch, 2003) a political factor into our analysis, we obtain our conceptual model (Figure 2).
3. Data and Research Design The question is how do we explain the existence of higher or lower investor protection in various countries around the world? And also why do some countries provide more protection for investors than others?
The divergence in corporate governance patterns around the world is well documented. LLSV’s work has revolutionized the study of corporate governance by investigating legal investor protection around the world. They argue that corporate laws and regulations controlling investor protection influence corporate governance systems. Their results confirm that law matters. Others researchers argue against the one dimension explanation and propose other factors: politics (Roe, 2003 and Gourevitch, 2003); and culture (Stulz and Williamson, 2003 and Licht et al., 2005). Figure 1 resumes our conceptual model.
In this analysis, we add new evidence on corporate governance patterns by investigating investor protection across countries. We do not look only at variables of legal origin, but we try to integrate cultural and political variables as well. But do added cultural variables or political variables provide greater explicative power of investor protection than legal variables?
5 The foregoing analysis points to the assumption that underlies our basic hypotheses: in the long run the content of formal legal rules should be compatible with and partly reflect the prevailing cultural orientations in a society. The present study considers legal rules that pertain to reconciling conflicting economic interests through the court system, Williamson (2005).
10
3.1 Dependent Variable: The Investor Protection Index Lawyers generally follow a qualitative approach to deal with law or to compare different legal systems. They do not use numbers and quantitative measures of law because they think that such measures lead to a superficial understanding of different legal systems (Siems, 2005). However, in the investor protection issue, LLSV attempted to quantify the law in their famous study “law and finance”. They used six items to specify investor protection: voting by mail, blocking shares before meeting, cumulative voting, oppressed minority mechanism, pre-emptive rights to new issues, and share capital required to call an extraordinary shareholder meeting. In the last few years many studies have used LLSVs variables on investor protection (Stulz and Williamson, 2003, Licht et al., 2005, Kwok and Tadess, 2006, and Hope, 2003). Only a few studies managed to establish their proper measure of investor protection and their appropriate dataset (Djankov et al., 2006, Lele and Siems, 2006 and Gourevitch, 2005). Siems (2006) argued that “it’s doubtful whether the findings of La Porta et al. are accurate. Various studies have identified numerous coding errors (eg. Cools, 2005, and Braendle, 2006). But the main problem is that the limited number of variables hardly provides a meaningful picture of the legal protection of shareholders. The choice of variables by La Porta et al. not only suffers from a US bias but is also a poor proxy of shareholder protection in general, because their variables do not capture the most significant aspects of the law”. Recently, Djankov, La Porta, Lopez, and Shleifer (2006) revised the anti-director right index and calculated this index for 72 countries based on laws and regulations prevailing in 2003. However, the question remains: Does this new index overcome the bias of the original investor protection index?
Lele and Siems (2006) established a new shareholder protection index for Germany, France, the UK, the US and India over three decades 1975-2005. They gave a quantification of legal rules through 60 variables to compare variation across countries and across time of legal systems. They measured the level of protection of the active shareholder by an aggregation of 32 variables and the level of protection of the passive shareholders by an aggregation of 28 variables.
Gourevitch (2005) defined investor protection as the “sum of practices that serve to ensure that the firm is operated to maximize the value of their shareholders’ stock, rather than spent or wasted on something else”. He argued that there was no theoretical standard of what practices constitute minority shareholder protection, but that many codes of best practices existed. Gourevitch built a new index of shareholder protection called MSP (Minority Shareholder Protection). He used the definition of corporate governance practices to construct his items. The index is composed of four items: information practices including accounting rules and audit procedure, oversight practices as related to the board of directors and rules governing their fiduciary responsibilities, control practices including voting right rules, and managerial incentives which deal with manager compensation to align the conflict with the shareholders’ interests. The MSP index was calculated for 39 countries, with most of the sample countries falling between 20 and 50 on the index. Developed countries had higher scores than emerging economies.
Lately, the World Bank became interested in what makes countries able to generate growth, enforce investment, secure property rights and provide public order. A database was developed, which can be mobilized for research on corporate governance. Since then, the World Bank has been involved in determining the key characteristics of good laws and has
11
made a major contribution to this literature by building a valuable index of investor protection6.
In this research we adopt the measure of investor protection of the World Bank because we believe this measure is built with great rigor in the method of index construction and because the data covers a recent period and a large number of countries, including developed and emerging economies.
The investor protection index is constructed from a survey by the “The International Bank of Reconstruction and Development Association” in 20067. The survey was administered through more than 4400 local experts (lawyers, business consultants, accountants, and government officials). The survey is based on a questionnaire including a short case study and asks contributors how their country’s regulations would treat the described transaction as of January 15th 2006. The experts interact with the Doing Business team through conference calls, written correspondence and country visits. Doing Business team members visited 65 countries to verify data and expand the number of respondents. Data from the survey is subjected to a robustness test which leads to a revision of the collected information. The data collection allows for multiple interactions with local respondents to clarify misinterpretations of questions. If there were modifications to the laws and regulations in 2005 that affected their answers, the respondents needed to explain how the modifications changed their responses. The responses are provided on a voluntary basis without expectation of monetary compensation. The data is collected for 175 countries published in Doing Business 2007. This data is revised recurrently as new information is received from country visits and as more respondents are recruited.
The construction of the Doing Business investor protection index
The data collected from the survey allows the Doing Business team to build the indicator of investor protection. This index measures “the strength of minority shareholder protection against directors’ misuse of corporate assets for personal gain. The indicators distinguish three dimensions of investor protection: transparency of transactions (extent of disclosure index), liability for self-dealing (extent of director liability index) and shareholders’ ability to sue officers and directors for misconduct (ease of shareholder suits index)”8.
The level of disclosure index: This dimension is measured by five variables and ranges from 0 to 10, with higher values indicating greater disclosure.
The level of the director liabilities index: This dimension was measured by seven variables and ranges also from 0 to 10, with higher values indicating greater liability of directors.
6 This methodology was originally developed in Djankov, La Porta, Lopez-de-Silanes and Shleifer, 2006 and
adopted by Doing Business World Bank with minor changes. 7 This association helps to identify the source of obstacles in doing business in different countries and supports
the policymakers in designing reforms. 8 To construct these indexes, the respondents were asked to describe the minimum legal requirement regarding: 1) who approves the transaction; 2) what needs to be disclosed to the board, shareholders, stock exchange and regulators; 3) what are the duties of the officers, directors and controlling shareholders; 4) how could the transaction validity be challenged; 5) what kind of actions are available if buyer suffers damages; 6) what needs to be proved under each cause of action; 7) who has standing to sue under each available cause of action; 8) what is the availability of direct and derivative suits; 9) what access exists to information and discovery rights; 10) what are the potential fines and criminal sanctions (Djankov et al., 2006). The respondents based their answers on the laws and regulations applicable under the case facts and provided the text of laws (civil and commercial codes, stock market acts and regulations, criminal code, civil procedure code), statutes, judicial precedent and regulatory opinions used to answer the questionnaire.
12
The ease of shareholder suits index: This index is composed of six variables and ranges from 0 to 10, with higher values indicating greater powers of shareholders to challenge the transaction.
The investor protection index is the average of these three indexes and ranges from 0 to 10, with higher values indicating better investor protection. Singapore and Hong Kong have the highest values of investor protection 9.3 and 9 respectively. Tunisia has 3.3.
Doing business methodology has some limitations which must be detailed and considered in the interpretation of data. First, the data is collected from the most populated city in the country and may not be representative of the legal practices in other parts of the country. Second, the data focuses on the specific business form and may not be representative of other forms of business in that country. Third, the transaction described in the case study refers to a specific set of issues and does not represent the full set of issues the business encounters.
3.2 Independent Variables 3.2.1 The cultural variable
Hofstede (1980) defines culture as the collective programming of the mind, which distinguishes the members of one group or category of people from another. Culture is learned and is the product of our social environment. The cross cultural psychology framework defines culture within the operational concept of values. It moves from general statement about culture to values, value priorities and value dimensions. According to Schwartz and Ros (1995), culture is the process of attribution of values which lead to a norm of behavior and self imposed codes of conduct. Values are the socially shared, abstract ideas about what is good, right and desirable in society. The ordered set of values forms a system of values priorities. For extracting values priorities, researchers identify the principal societal problems. So in response to the social problems identified, scholars define “cultural value dimensions” that reflect the ways for a members of a society to deal with these problems.
Stulz and Williamson (2003) approached culture by religion in investigating the impact of culture on investor protection differences around the world. Indeed, religion is a key component of the system of beliefs and the base of all the values shared in society and the ethical propositions that govern human behavior.
The construction of cultural value dimensions
The literature which addressed the cultural dimension measurement can be attributed to two works: of Hofstede (1991) and Schwartz and Ros (1995).
Hofstede defines the value dimension as an aspect of culture that can be measured relative to other cultures. In Schwartz and Ros (1995), culture is the process of attribution of values which lead to a norm of behavior and self imposed codes of conduct. In order to extract values priorities, researchers identify the principal societal problems. Then, scholars define “cultural value dimensions” that reflect the ways for members of a society to deal with these problems.
We adopt the Hofstede measure because it is the most popular. In addition Hofstede’s framework is still the most influential and the most used in international management studies. Furthermore, the complete Schwartz database is not yet available to the public9. Another reason for using Hofstede’s is the availability of information10.
9 Kwok and Tadesse (2006). 10 Hofstede database covers more countries, providing more observations for emerging and developed countries.
13
Hofstede derives his cultural value dimensions from a questionnaire distributed in 1967-1973 to over 117,000 employees of IBM Corporation in fifty countries. The questions were designed to identify value orientations of people. Once the responses were given, he computed the scores on each question per national sample group. A factor analysis allowed the identification of the sets of questions that are influenced by a shared dimension. The factors obtained defined the cultural value dimensions. He then computed the score of each dimension for every nation by combining the questions that loaded on the relevant factor. Hofstede identified four factors and defined them as four cultural value dimensions: Uncertainty avoidance, Power distance, Individualism-collectivism and Masculinity-feminism. In 2001, Hofstede added another value dimension: Long-term orientation.
We retain in our analysis these five dimensions (see appendix I). We use the Hofstede value dimensions from his database. The scores of the five dimensions are provided for each country in our sample. For Arab countries without specific scores, we give them the same values given to the Arab World as a whole. Furthermore, we use Hofstede’s classification of countries in different cultural regions from the Licht et al. (2005) dataset.
3.2.2 The Religion dimension as a proxy for culture
Religion is a key component of the system of beliefs. Religion is the base of all the values shared in society and ethical propositions that govern human behavior. We adopt the line of reasoning initiated by Weber that the specific content of religious beliefs may profoundly affect economic behavior. We also rely on the work of Stulz and Williamson (2003), which approaches culture by religion, in investigating the impact of culture on investor protection differences around the world. We think that the culture value dimensions framework is relevant to operationalize the concept of culture but does not allow us to counter all aspects of culture. Using both religion and culture value dimensions can provide, in our sense, a better picture of how cultural variables help understanding the diversity in investor protection around the world.
Religion is widely used as a proxy of culture. LLSV (1999) use religion measured by the percentage of a country that practices a given religion, as a proxy of culture in their study of government quality. Stulz and Williamson (2003) use countries’ predominant religions as proxy of their national culture. The results show a great impact of religion on creditor rights and less impact on investor protection.
We retain the Stulz and Williamson measure because we think it is more suited to our research; the dominant religion should have the primary influence on that country’ laws and politics. Furthermore, groups of common languages share the same features of organization and views. The data on a country’s primary religion is taken from “religions of the world” web site.
3.2.3 The political variable Pagano and Volpin (2000), Perrotti and Von-Thadden (2004), and Roe (2005) seek to model political forces shaping investor protection. They present voting models in which investor protection is shaped by voting decisions. These models focus on the possibility of coalitions between insiders and stakeholders against outside shareholders (Pagano and Volpin 2000, Perrotti and Von-Thadden 2004) or coalition between insiders and outsiders against stakeholders (Roe, 2005).
Gourevitch (2005) investigates empirically the impact of political variables on corporate governance. He argues that corporate governance patterns vary with other features of the economy, among them job security, product market competition, education and training systems, financial structures, income inequality. He called these economic features
14
“institutional complementarity”. Measuring institutional complementarity for countries leads research to group countries according to the degree of coordination in to groups: liberal market economies (LME) and coordinated market economies (CME). Gourevitch measures the institutional complementaries by the coordination index11. He finds a positive correlation between the ownership concentration and the coordination index. Ownership concentration is more common in coordinated market economies and ownership dispersion is more common in liberal market economies. He finds a negative correlation between coordination index and minority shareholder protections index12.
Gourevitch (2005) sorts country institutions into majoritarian and consensus types. High level of minority protection and LME correlate with majoritarian political institutions. Low level of minority protection and OME correlates with consensus institutions. He uses the cohesion political index derived from Beck et al. (2001) World Bank database of political indicators (DPI) to classify countries into majoritarian-consensus political institutions. He regresses ownership concentration on the cohesion political index and the minority protection index on the cohesion political index. The results confirm that consensus political systems tend to have higher ownership concentration and lower shareholder protections. Majoritarian systems tend to have the reverse: lower ownership concentration and higher minority protections.
Pagano and Volpin’s (2005) model predicts that proportional electoral systems are conducive to weaker investor protection than majoritarian.
The data on a country’s primary religion is taken from the Database of Political Institutions issued in July 2005 by the World Bank.
3.2.4 Control variables The level of economic development: Richer countries may have higher investor protection. We investigate whether the difference in investor protection indexes across countries just reflects the difference in the per capita income. Rich countries may simply choose to protect investors by law while poor countries are not able to do that. To examine the robustness of the relationship between investor protection and the legal, political and cultural variables, we control for the level of economic development which can capture the effect of any of these variables. We want to make sure that the proxies of culture, politics and legal origin do not proxy for the level of economic growth. We measure the level of economic development by the log of GDP per capita 2005.
The rule of law index: We use also the rule of law index. The rule of law index represents the level of perceived legality in the country.
The control of corruption index: Corruption is the use of public or private office or power for personal gains. The corruption is antithetical to the rule of law because corruption has an effect on the lack of respect of law. The control of corruption index measures to what extent corruption is controlled.
The control of corruption index and the rule of law indexes are taken from Kaufmann et al. (2005) database. The indexes are calculated for the year 2005.
Table 1 gives the code, the definition and the measurement of the variables used in this study.
11 Measure of Hall and Gincherich (2001) constructed from 6 values: shareholder power, dispersion of control, stock market capitalization, level of wage coordination, degree of wage coordination and labor turnover. 12 Minority shareholder protections index is measured by four dimensions: information, oversight, control, and managerial incentives.
15
4. Empirical Results We want to explain corporate governance patterns by investigating investor protection across countries. In order to do that, we capture country differences by three dimensions: investor protection, cultural values and political system. For that purpose, we use respectively the World Bank’s investor protection index to measure investor protection, Licht et al. (2005) dataset and “religions of the world” website for the cultural variables. The data on a country’s primary religion and politics is taken from the “Database of Political Institutions” by Beck, Keefer and Clarke (1975-2004) World Bank (issued in July 2005).
The data for control variables is extracted from the World Bank’s World Development Indicators database for the level of economic development and the control of corruption index and the rule of law indexes are taken from Kaufmann et al. (2005) database.
Our results will be presented in three steps: 1) we start by studying the cross country difference of investor protection through an analysis of variance according to our main variables (legal, cultural and political); 2) we then focus on the nature and intensity of relation between investor protection and our explanatory variables by a regression analysis; and 3) we finally investigate the existence and treatment of an endogeneity problem using simultaneous equation model.
4.1 Descriptive Statistics and Results of ANOVA Analysis Table 2 shows the summary statistics and the mean differences of synthetic and detailed investor protection indexes according to legal classification (panel A), Hofstede classification (panel B), region classification (panel C), religion classification (panel D) and plurality (panel E).
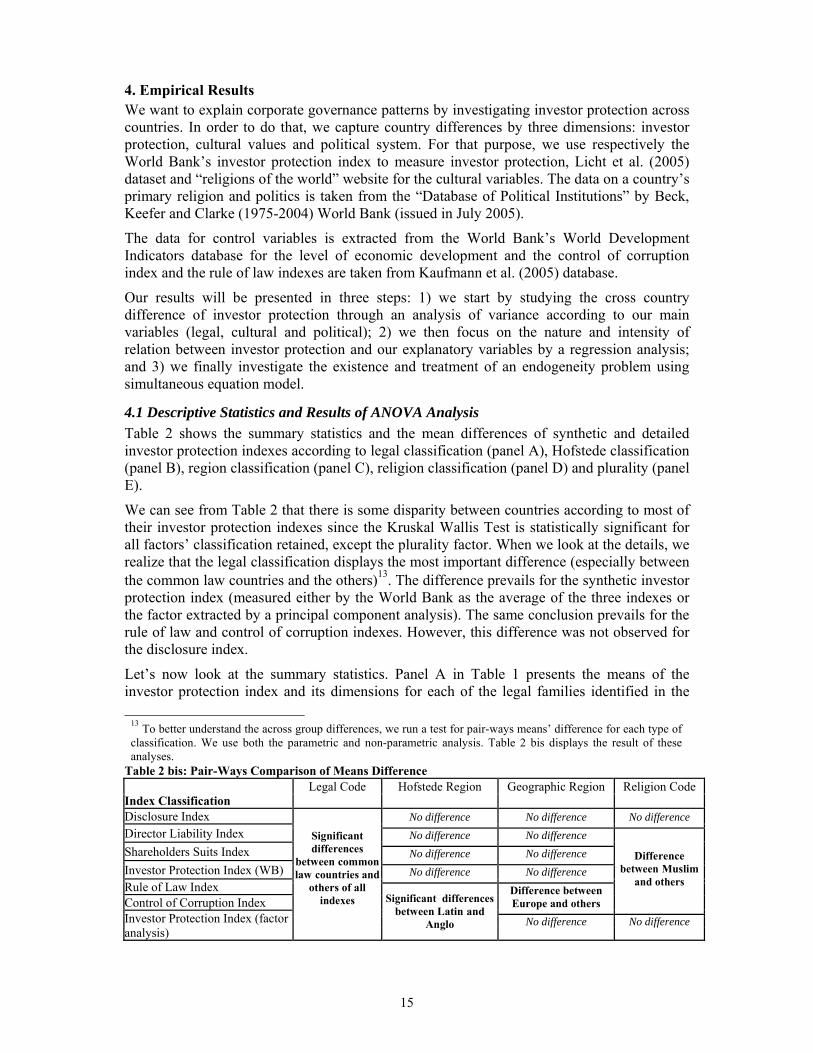
We can see from Table 2 that there is some disparity between countries according to most of their investor protection indexes since the Kruskal Wallis Test is statistically significant for all factors’ classification retained, except the plurality factor. When we look at the details, we realize that the legal classification displays the most important difference (especially between the common law countries and the others)13. The difference prevails for the synthetic investor protection index (measured either by the World Bank as the average of the three indexes or the factor extracted by a principal component analysis). The same conclusion prevails for the rule of law and control of corruption indexes. However, this difference was not observed for the disclosure index.
Let’s now look at the summary statistics. Panel A in Table 1 presents the means of the investor protection index and its dimensions for each of the legal families identified in the
13 To better understand the across group differences, we run a test for pair-ways means’ difference for each type of classification. We use both the parametric and non-parametric analysis. Table 2 bis displays the result of these analyses.
Table 2 bis: Pair-Ways Comparison of Means Difference
Legal Code Hofstede Region Geographic Region Religion Code
Index Classification
Disclosure Index No difference No difference No difference
Director Liability Index No difference No difference
Shareholders Suits Index No difference No difference
Investor Protection Index (WB) No difference No difference
Rule of Law Index
Control of Corruption Index Difference between Europe and others
Difference between Muslim
and others
Significant differences
between common law countries and
others of all indexes
No difference No difference
Investor Protection Index (factor analysis)
Significant differences between Latin and
Anglo
16
literature. We see from Panel A that common law countries have the highest score for all the indexes, which are largely above the total sample mean. Scandinavian civil law countries come in second position. However, the mean indexes for Germanic civil law countries and French civil law countries are under the sample mean for all the variables. Disclosure and director liability is higher in French civil law than in Germanic civil law countries. Thus, our results confirm that the legal origin remains an important determinant of the investor protection (calculated with the new investor protection index of Doing Business). Common law countries provide the best legal protection to investors. They require higher disclosure, greater liability of directors and greater power of shareholders to challenge the transaction than civil law countries. Germanic and French civil law have similar values for disclosure index, Scandinavian civil law has higher values but lower than common law countries. Director liability is most highly regulated in the Scandinavian countries, followed by the French countries and finally the Germanic civil law. Further, based on the index of shareholder suits, litigation is easier in common law countries than in civil law countries.
The culture classification of Hofstede displays some cross country differences only for the rule of law, the control of corruption and the investor protection factor. These differences are observed between Latin and Anglo countries. The summary statistics show the highest disclosure index for the Anglo countries, followed by the Latin developed countries. The director liability and shareholders suits indexes are the highest for the Anglo countries, followed by the Asian countries.
The geographic classification shows a significant difference between Europe and others for the rule of law and the control of corruption indexes. There is a significant difference between MENA countries and others with regards to the shareholder suit index. The summary statistics show the highest scores on rule of law and control of corruption indexes for the European countries, followed by North American countries. The director liability and shareholders suits indexes are the highest for the North American countries, followed by South Pacific countries. MENA countries display the lowest scores for almost all indexes.
Finally, when we use a religious classification, differences were observed between Muslim and other confessions for almost all indexes. The most important result from summary statistics is that the lowest scores are for Muslim countries for all indexes.
These results are interesting and support the legal and cultural theory explanation of cross country differences in investor protection. However, we need to understand what the determinants of these differences are. In order to do that, we use a regression analysis.
4.2 Cross Country Variation Determinants of Investor Protection: Results of the Regression Analysis In theory and in reviewing the literature, some researchers have explained investor protection by the legal origins, while some others have focused on the cultural differences between countries or on the political divergence. The previous empirical literature focused mostly on developed countries. The results are not convergent. In the following analysis, we add a new evidence to highlight this issue. Our contribution is on two levels: (1) first we try to integrate the three competitive theories of investor protection (and governance structure); second we use many databases to investigate a sample of 81 developed and emerging countries.
4.2.1 Legal explanation of investor protection Table 3 displays the results for the legal variables. We see from the table that all indicators of investor protection are related positively to the common law variable and negatively to the civil law variable. The coefficients are significant at 1% and 5%. These indexes are also positively and significantly related to GDP when we retain the common variable in the
17
model. Meanwhile, this relation is no longer significant when we retain the civil law variable. The rule of law and control of corruption variables are not significant. This result may be explained by the high correlation between the three variables (GDP, rule of law and control of corruption)14.
Our results corroborate previous research findings (LLSV, 1998-2002 and Djankov et al., 2006 and 2008) and confirm the relevance of the legal theory of investor protection, particularly that we used a more reliable and representative database.
However, one important question remains. What happens when we introduce cultural and political factors? This is the object of the next two sub-sections.
4.2.2 Cultural explanation of the investor protection To investigate the cultural explanation of investor protection, we regress the investor protection indexes on Hofstede’s cultural value dimensions. However, to test whether cultural orientations may serve as a proxy for the effects of major socio-economic factors, we control with log GDP per capita. Table 4 summarizes the results for the cultural variables.
Globally, the results don’t support the cultural hypothesis. In fact, except the Uncertainty Avoidance Index which displays a negative effect on investor protection indexes and the director liability index, all other cultural dimensions are not significant. Moreover, the adjusted R2 doesn’t exceed 14% even with the inclusion of the GPD variable which has an important explanation power.
Uncertainty Avoidance Index refers to the extent to which people feel threatened by uncertainty and try to avoid it and to protect themselves against it. High uncertainty avoidance is consistent with giving power to authorities who can control uncertainty. Thus, countries with high uncertainty avoidance are expected to be more secretive and thus reduce the level of disclosure. In countries where disclosure levels are very low, lawmakers do not require all disclosure details of a transaction and all material facts regarding James’ interest be made to shareholders and to the board of directors. This result is predicted by Gray (1988) and also confirmed by accounting research and confirmed by our analysis.
Before concluding on the relevance of the cultural explanation, we will combine the three explanations (legal, cultural and political) in the same model in the following sub-section.
4.2.3 Legal versus cultural and political explanation of investor protection Table 5 presents the results of the regression analysis.
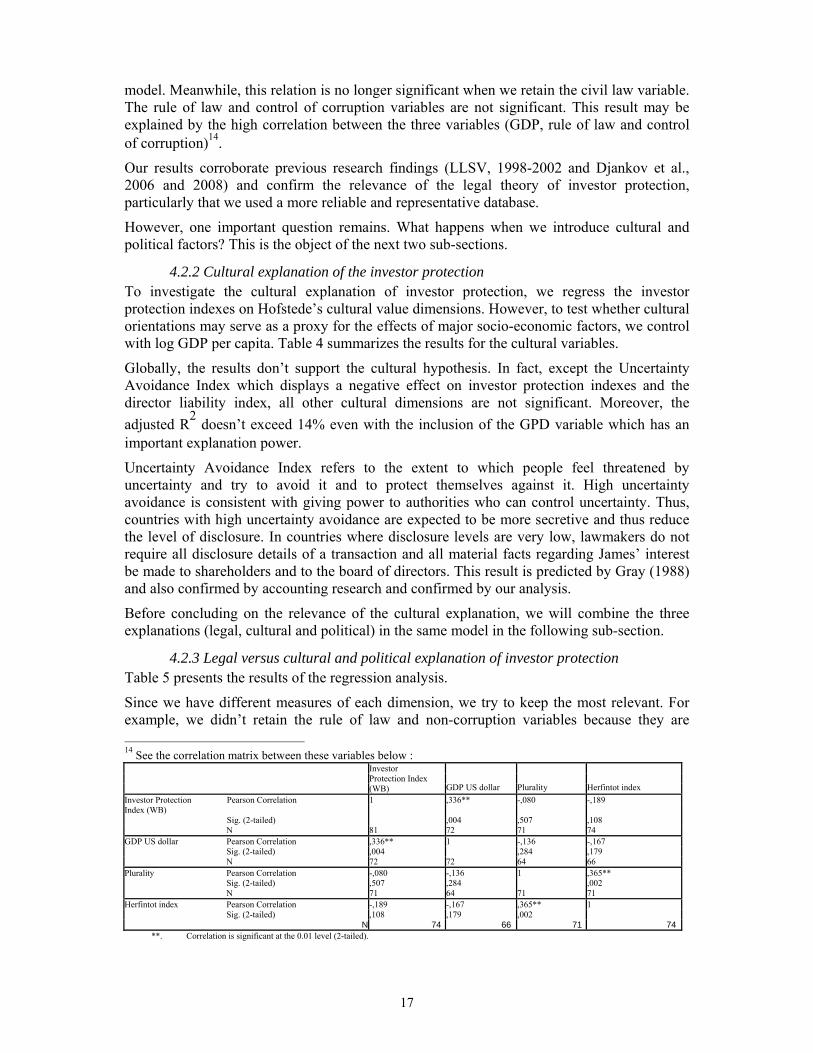
Since we have different measures of each dimension, we try to keep the most relevant. For example, we didn’t retain the rule of law and non-corruption variables because they are 14 See the correlation matrix between these variables below :
Investor Protection Index (WB) GDP US dollar Plurality Herfintot index
Pearson Correlation 1 ,336** -,080 -,189 Investor Protection Index (WB) Sig. (2-tailed) ,004 ,507 ,108 N 81 72 71 74 GDP US dollar Pearson Correlation ,336** 1 -,136 -,167 Sig. (2-tailed) ,004 ,284 ,179 N 72 72 64 66 Plurality Pearson Correlation -,080 -,136 1 ,365** Sig. (2-tailed) ,507 ,284 ,002 N 71 64 71 71 Herfintot index Pearson Correlation -,189 -,167 ,365** 1 Sig. (2-tailed) ,108 ,179 ,002
N 74 66 71 74 **. Correlation is significant at the 0.01 level (2-tailed).
18
highly correlated with GDP15. We also exclude the Individualism-collectivism and Masculinity-feminism variables because they have a t value near 0.10 (with a degree of significance exceeding 90%) when retained. For the political variable, we take only two from the database (Herfindal government index and plurality) because they were recommended by Pagano and Volpin (2005).
The results show a relatively high R2 (over 60% for synthetic investor protection index, nearly 50% for the shareholder suit index and nearly 40% for the director liability index). When we compare these results to those of the legal or cultural explanation alone, we see that investor protection is not determined by one dimension. The explanatory power substantially increases16. Thus, we see that investor protection is not uni-dimentional but rather multidimensional. When we look at the detail, we find that GDP, common law and power distance positively affect all aspects of investor protection. Disclosure is affected by legal (common law) and cultural (Power Distance) variables. Plurality has a negative impact on synthetic indexes and shareholder suit index17. Director liability is affected only in common law and the MENA variable is negatively associated with shareholder suit index.
To resume, we can say that each of these theories contribute in explaining the cross country variations in investor protection. But, two questions remain. First, is there an interaction effect for these variables on investor protection? This assertion was already suggested by Stulz and Williamson (2003) where they introduced an interaction variable (between openness and religion) and by Gourviz (2005) when he addressed the question of intervening variables (Minority Shareholder Protections and degree of shareholders concentration). The interaction hypothesis was tested without success. We run many regressions with interaction variables, but our results (not reported here) don’t support any moderation or mediation effect. The second question deals with the possible existence of endogeneity. This question will be examined in the next subsection.
4.3 Cross Country Variation Determinants of Investor Protection: Searching for an Endogeneity Problem
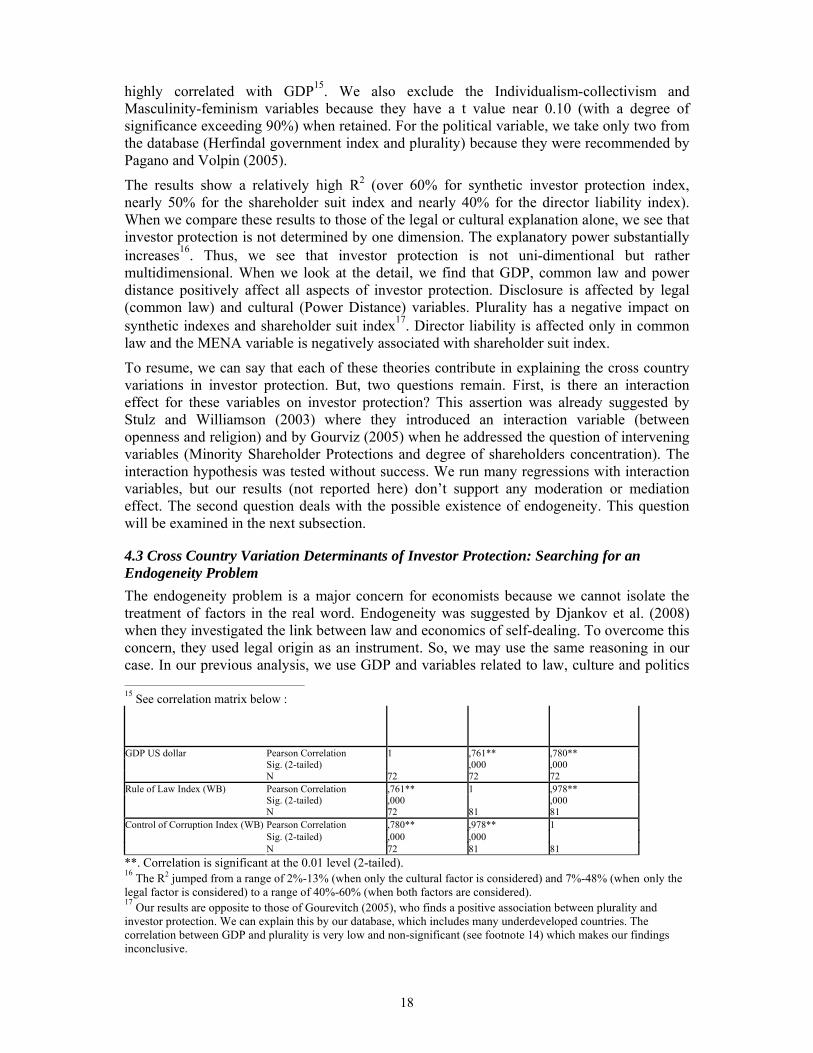
The endogeneity problem is a major concern for economists because we cannot isolate the treatment of factors in the real word. Endogeneity was suggested by Djankov et al. (2008) when they investigated the link between law and economics of self-dealing. To overcome this concern, they used legal origin as an instrument. So, we may use the same reasoning in our case. In our previous analysis, we use GDP and variables related to law, culture and politics 15 See correlation matrix below :
Pearson Correlation 1 ,761** ,780** Sig. (2-tailed) ,000 ,000
GDP US dollar
N 72 72 72 Pearson Correlation ,761** 1 ,978** Sig. (2-tailed) ,000 ,000
Rule of Law Index (WB)
N 72 81 81 Pearson Correlation ,780** ,978** 1 Sig. (2-tailed) ,000 ,000
Control of Corruption Index (WB)
N 72 81 81 **. Correlation is significant at the 0.01 level (2-tailed). 16 The R2 jumped from a range of 2%-13% (when only the cultural factor is considered) and 7%-48% (when only the legal factor is considered) to a range of 40%-60% (when both factors are considered). 17 Our results are opposite to those of Gourevitch (2005), who finds a positive association between plurality and investor protection. We can explain this by our database, which includes many underdeveloped countries. The correlation between GDP and plurality is very low and non-significant (see footnote 14) which makes our findings inconclusive.
19
as determinants of investor protection. Now, recall from Williamson framework (2003) and our conceptual model that economic development is determined by governance, which is determined by formal legal rules which depend on informal institutions. In our model, Level 1 (informal institutions) is captured mainly by culture. Legal rules are derived from culture and politics and all three contribute to generate the governance structure at the macro level and corporate governance at the micro level. Economic development and investor protection are very linked to each other and benefit substantially from a good governance structure.
Hence, while adopting LLSV’s model in explaining investor protection by legal factors and GDP per capita as a control variable, we suggest using culture as an instrument to overcome the endogeneity problem.
However, as discussed by Glaeser, La Porta, Lopez-de-Silanes, and Shleifer (2004), the use of instrumental variables in this context is problematic, since a valid instrument must not only be exogenous but must also be uncorrelated with the error term. As Williamson stated, the culture which is in Level 1 in his model is clearly exogenous.
4.3.1 Results of the OLS estimations We start by presenting the results of OLS estimation. Table 5 reports the OLS regressions of investor protection and GDP per capita by their legal, cultural and political determinants.
The results of the first estimation show a significant and high association between investor protection and GDP per capita on one side, and legal, cultural and political variables on the other side. The GDP per capita is affected by two cultural variables (power distance and individualism). The political variables have no effect on GDP per capita. The results of the second estimation show a significant effect of the GDP per capita on the three dimensions: legal (common law), culture (power distance) and politics (plurality).
4.3.2 Results of the two-stage least square estimation We now turn to concerns about the possible endogeneity of some of the right-hand-side variables. The most likely variable to suffer from this problem is GDP per capita. High investor protection may stimulate growth and GDP per capita. This would bias the absolute value of the OLS parameter estimate. A variable that may be endogenous for different reasons is culture. Another one is politics.
To explore these possibilities our instrumenting strategy is as follows. Beginning with GDP per capita, we use the Williamson model to claim that the propice cultural environment of a country may lead to a better economic activity and high GDP per capita. A word of caution is in order. Although we find the exclusion restrictions plausible we cannot rule out a priori that the proposed instruments do in fact directly affect investor protection, so we pay particular attention to the statistical tests of over-identifying restrictions that we report in all the instrumental variables specifications below.
Table 6 presents the two-stage least squares regressions using culture as an instrument for the GDP per capita.
Consistent with the results in Table 6, the GDP per capita is significant at 6% in the regressions for investor protection index. In addition, two the cultural variables (power distance index and individualism index) are a strong predictors of the GDP per capita. Note also that legal origin (common law) and politics (plurality) are good predictors of investor protection (at 1%). The regression coefficients didn’t fall that much when compared to the OLS specification.
A word of caution is in order. Although we find the exclusion restrictions plausible we cannot rule out a priory that the proposed instruments do in fact affect theft directly, so we pay
20
particular attention to the statistical tests of over-identifying restrictions reported in Table 6 for the instrumental variables specifications.
These results provide a striking confirmation of our hypotheses about the determinants of investor protection, even when we control for the endogeneity of cultural variables. All the variables that were significant in our OLS specification remain significant in the two-stage least square specification at 5% at least and in most cases at 1%. They also show that our concerns about endogeneity are justified, though more for some variables than for others. The Durbin-Wu-Hausman tests reject exogeneity of GDP per capita at the 1.5% level.
Finally, the instruments comfortably pass the Hansen test of over-identifying restrictions.
4.3.3 Results of the three-stage least square estimation Table 7 reports the results of the three-stage least square estimation were the GDP per capita and the investor protection determinants are estimated simultaneously.
The results of the three-stage least square estimation are different from those of the two-stage least square estimation. The regression coefficients are almost the same in level and significance.
The results confirm that culture is a good instrument for the GDP per capita and that investor legal and political factors with GDP per capita satisfactorily explain the cross countries variation in investor protection.
5. Conclusion The divergence in corporate governance patterns around the world has been well documented. LLSV’s work has revolutionized the study of corporate governance by investigating the legal investor protection around the world. They argued that corporate laws and regulations controlling investor protection influenced corporate governance systems. Their results confirmed that laws do matter. LLSV provide the most commonly accepted explanation of the degree of investor protection by legal origin, i.e. the distinction between common law and civil law families. However, this distinction does not capture the full process, influencing in turn the content and the quality of law relevant to corporate governance. Roe (2003), Pagano and Volpin (2000) and Gourevitch (2003) reviewed the political process that influenced the law and regulations shaping corporate governance. According to them, the fight for power inside the firm that shapes corporate governance is settled by the fight for power outside the firm in the political system that determines the laws. People in the society choose the corporate governance system that hurts them the least; they work through politics to reflect their preferences. Furthermore, Licht (2001), Stulz and Williamson (2003) and Licht et al. (2005) argued that the system of beliefs and values that determine the behavior and actions of individuals within a society could explain the differences in investor protection. Culture is viewed in this instance as the primary cause of all differences in law and regulations across countries and the mother of all path dependence, because culture impedes any changes and reforms that confront people’s beliefs and preferences. Political and cultural theories in corporate governance have contested the legal origin of LLSV and have opened the debate to investigate the relevance of each prediction. Stulz and Williamson and Licht et al. argued that comparative analysis in international corporate governance cannot rely only on LLSV’s legal classification.
In this paper we try to investigate the joint explanation of investor protection by legal origin, cultural value and the political system. We adopt a cross sectional analysis on a sample of 81 countries belonging to different contexts. Our results show that legal origin is still the most
21
responsible in explaining cross countries variation. Cultural and political dimensions have an incremental explanatory power of investor protection around the world.
We also show — through a simultaneous equation model — that there is an endogeneity problem that has to be solved before giving credit to our results. The cultural dimension is found to be a good instrument for GDP per capita in explaining investor protection.
We also show that MENA countries display the lowest score in investor protection and that belonging to Muslim countries has a negative effect on investor protection. So, who can we blame for this reality and what advice can we give to improve investor protection?
The situation is perhaps a heritage of colonialism, of our culture or of lack of democracy. Surely it is jointly determined by these three factors. If we have to advise our politicians or regulators, we recommend not copying blindly what comes from the West. Instead, we need to bring our cultural values into the equation.
22
References
Aguilera, and Jackson (2003). “The Cross-National Diversity of Corporate Governance: Dimensions and Determinants”. Academy of Management Review (28)3: 447-465.
Bebchuk. L. and M. Roe (1999). “A Theory of Path Dependence in Corporate Ownership and Governance”. Stanford Law Review 52 (1):127-170.
Beck, T., Demirguc-Kunt, A. and Levine, R. (2003). “Law, Endowments and Finance”. Journal of Financial Economics 70, 137–181.
Braendle, U. C. (2006). “Shareholder Protection in the USA and Germany: Law and Finance Revisited”. German Law Journal. 7 (3): 257–278.
Cools, Sofie (2005). “The Real Difference in Corporate Law between the United States and Continental Europe: Distribution of Powers”. Delaware Journal of Corporate Law 30, 697-766.
Djankov, S., R. La Porta, F. Lopez and A. Shleifer (2008). “The Law and Economics of Self Dealing”. Journal of Financial Economics 88(3): 430–465.
Fligstein, N. and J. Choo (2005). “Law and Corporate Governance”. Working paper, Institute of Industrial Relations, University of California.
Gourevitch, Peter A. (2003) “The Politics of Corporate Governance Regulation”. The Yale Law Journal 112, 1829-80.
Gourevitch, Peter A. (2005). “Political Drivers of Corporate Governance Patterns”. Working paper, Georgetown University
Gourevitch, P.A. and Hawes, M. (2002). “The Politics of Choice among National Production Systems”. Paris Presses de Sciences 241-270.
Hofstede, G. (2001). Cultures Consequences Comparing Values, Behaviors, Institutions and Organizations across Nations. Sage Publications, California.
Hofstede, G. (1991). Cultures and Organizations: Software of the Mind: Intercultural Cooperation and Its Importance for Survival. New York: McGraw-Hill
Hofstede, G. (1980). Culture's Consequences: International Differences in Work-Related Values. Sage Publications, Beverly Hills.
Hope, O-K. (2003). “Firm-Level Disclosures and the Relative Roles of Culture and Legal Origin”. Journal of International Financial Management and Accounting, 14 (3), 218-248
Kaufmann, D., A. Kraay and Mastruzzi, M. (2005). “Governance Matters IV: Governance Indicators for 1996-2004”. Unpublished working paper, World Bank. Washington. DC.
Kaufmann, D., A. Kraay and Zoido-Lobaton, P. (1999). “Aggregating Governance Indicators”. World Bank Policy Research, Working paper No. 2195.
23
Kwok, C.Y. and S. Tadesse (2006) “National Culture and Financial Systems”. Journal of International Business Studies 37, 227-247.
La Porta, R., Lopez, F., Shleifer, A. and R., Vishny (1997). “Legal Determinants of External Finance”. Journal of Finance 52, 1131-1150.
La Porta, R., Lopez, F., Shleifer, A. and R., Vishny (1998). “Law and Finance”. Journal of Political Economy 106, 1113-1155.
La Porta, R., Lopez, F., Shleifer, A. and R., Vishny (1999). “Corporate Ownership around the World”. Journal of Finance 54, 471-517.
La Porta, R., Lopez, F., Shleifer, A. and R., Vishny (2000). “Investor Protection and Corporate Governance”. Journal of Financial Economics 58, 3-28.
La Porta, R., Lopez, F., Shleifer, A. and R., Vishny (2002). “Investor Protection and Corporate Valuation”. Journal of Finance 3, 1147-1170.
Lele, P. and M. Siems (2006). “Shareholder Protection: A Leximetric Approach”. Working paper, University of Cambridge.
Licht, A. (2001). “The Mother of All Path Dependences towards a Cross Cultural Theory of Corporate Governance Systems”. Delaware Journal of Corporate Law 26, 147-209.
Licht, A., C. Goldschmidt and S. Schwartz (2002). “Culture Rules: The Foundations of the Rule of Law and Other Norms of Governance”. Working Paper.
Licht, A., C. Goldschmidt and S. Schwartz (2005). “Culture, Law and Corporate Governance”. International Review of Law and Economics 25, 229 –255.
Pagano, M. and P. Volpin (2000). “The Political Economy of Corporate Governance CSEF”. working paper n 29 and CEPR discussion paper no 2682.
Roe, Mark J. (1994). Strong Managers, Weak Owners: The Political Roots of American Corporate Finance. Princeton University Press, Princeton, N.J.
Roe, Mark J. (2003). Political Determinants of Corporate Governance: Political Context. Corporate Impact. Oxford University Press, Oxford, New York.
Schwartz, S.H., and Ross, M. (1995). “Values in the West: A Theoretical and Empirical Challenge to the Individualism-Collectivism Cultural Dimension”. World Psychology 1, 91-93.
Siems, M. (2005). “What does not Work in Securities Law: A Critique of La Porta et al.’s Methodology”. International Company and Commercial Law Review 7, 300-305.
Siems, M. (2006). “Shareholder Protection across Countries — Is the EU on the Right Track?” Working paper, Center of Business Research, Cambridge University.
Stulz, R. M and R. G. Williamson (2003). “Culture, Openness and Finance”. Journal of Financial Economics 70 (3): 313-349.
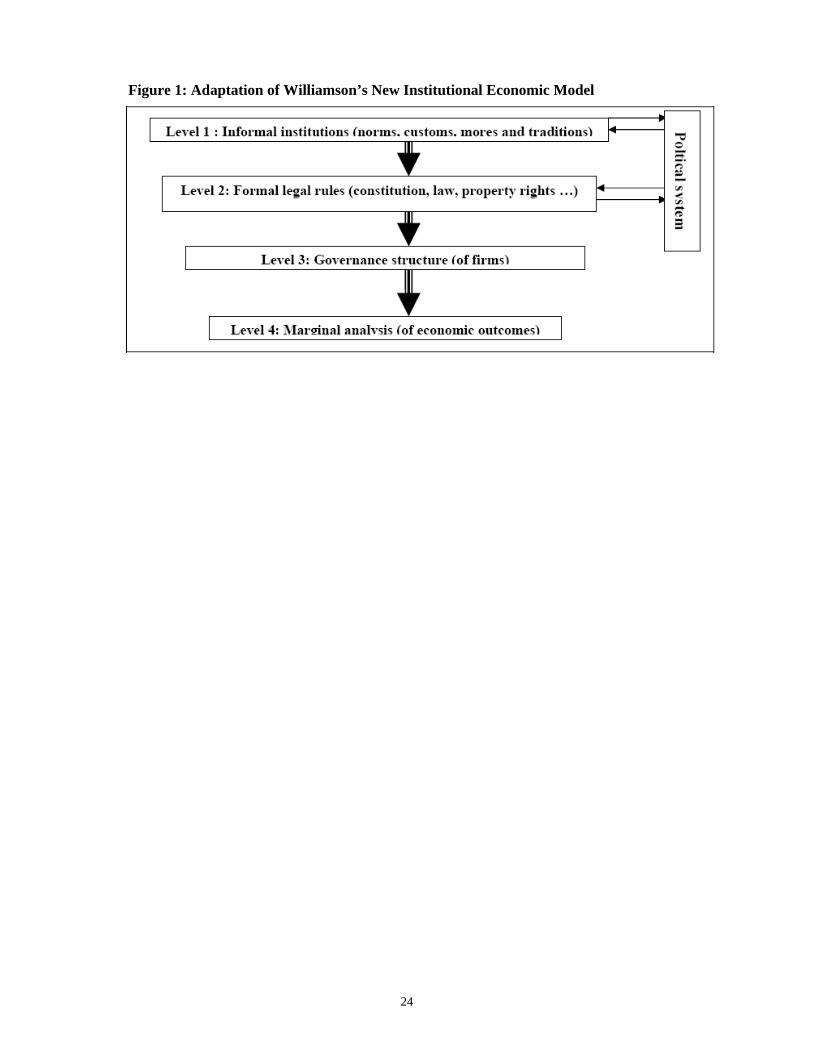
24
Figure 1: Adaptation of Williamson’s New Institutional Economic Model
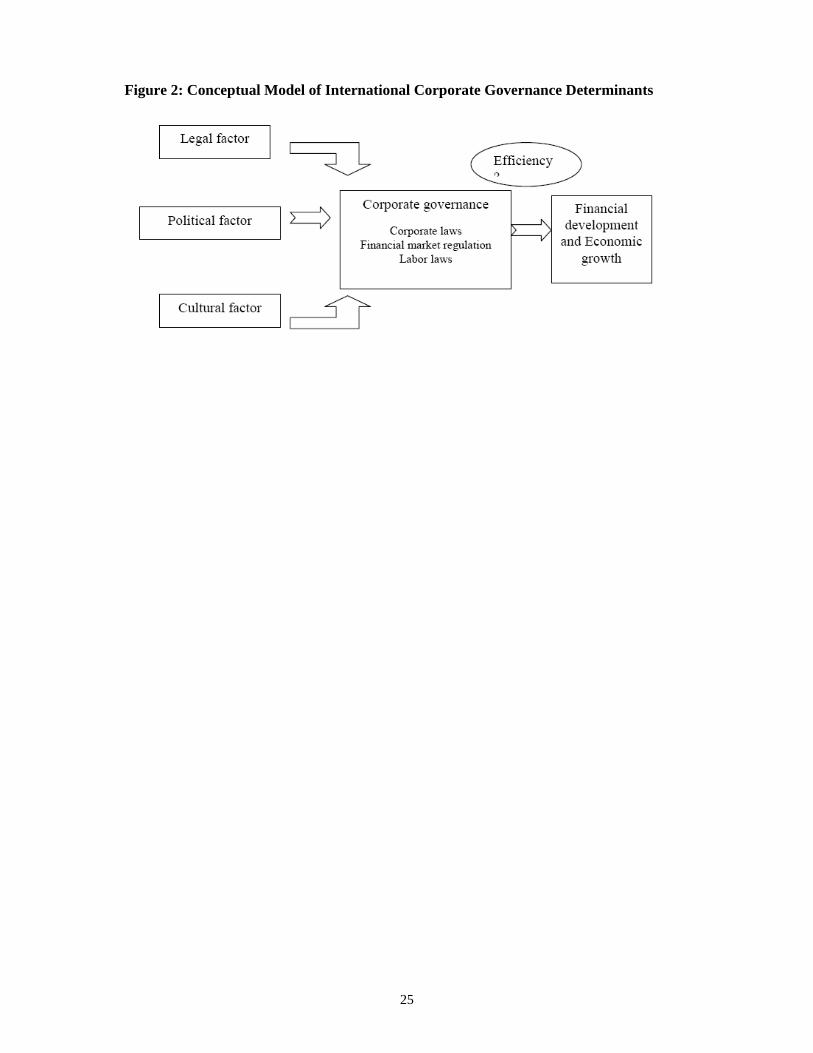
25
Figure 2: Conceptual Model of International Corporate Governance Determinants
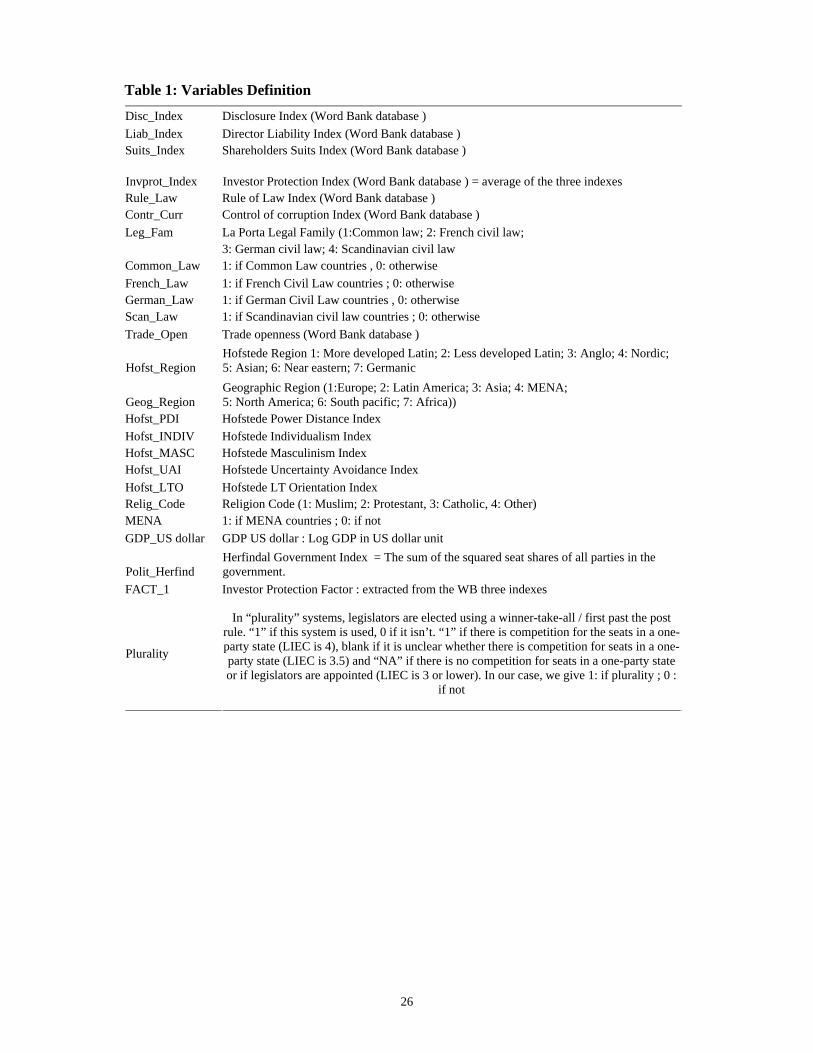
26
Table 1: Variables Definition
Disc_Index Disclosure Index (Word Bank database ) Liab_Index Director Liability Index (Word Bank database ) Suits_Index Shareholders Suits Index (Word Bank database )
Invprot_Index Investor Protection Index (Word Bank database ) = average of the three indexes Rule_Law Rule of Law Index (Word Bank database ) Contr_Curr Control of corruption Index (Word Bank database ) Leg_Fam La Porta Legal Family (1:Common law; 2: French civil law; 3: German civil law; 4: Scandinavian civil law Common_Law 1: if Common Law countries , 0: otherwise French_Law 1: if French Civil Law countries ; 0: otherwise German_Law 1: if German Civil Law countries , 0: otherwise Scan_Law 1: if Scandinavian civil law countries ; 0: otherwise Trade_Open Trade openness (Word Bank database )
Hofst_Region Hofstede Region 1: More developed Latin; 2: Less developed Latin; 3: Anglo; 4: Nordic; 5: Asian; 6: Near eastern; 7: Germanic
Geog_Region Geographic Region (1:Europe; 2: Latin America; 3: Asia; 4: MENA; 5: North America; 6: South pacific; 7: Africa))
Hofst_PDI Hofstede Power Distance Index Hofst_INDIV Hofstede Individualism Index Hofst_MASC Hofstede Masculinism Index Hofst_UAI Hofstede Uncertainty Avoidance Index Hofst_LTO Hofstede LT Orientation Index Relig_Code Religion Code (1: Muslim; 2: Protestant, 3: Catholic, 4: Other) MENA 1: if MENA countries ; 0: if not GDP_US dollar GDP US dollar : Log GDP in US dollar unit
Polit_Herfind Herfindal Government Index = The sum of the squared seat shares of all parties in the government.
FACT_1 Investor Protection Factor : extracted from the WB three indexes
Plurality
In “plurality” systems, legislators are elected using a winner-take-all / first past the post rule. “1” if this system is used, 0 if it isn’t. “1” if there is competition for the seats in a one-party state (LIEC is 4), blank if it is unclear whether there is competition for seats in a one-party state (LIEC is 3.5) and “NA” if there is no competition for seats in a one-party state or if legislators are appointed (LIEC is 3 or lower). In our case, we give 1: if plurality ; 0 :
if not
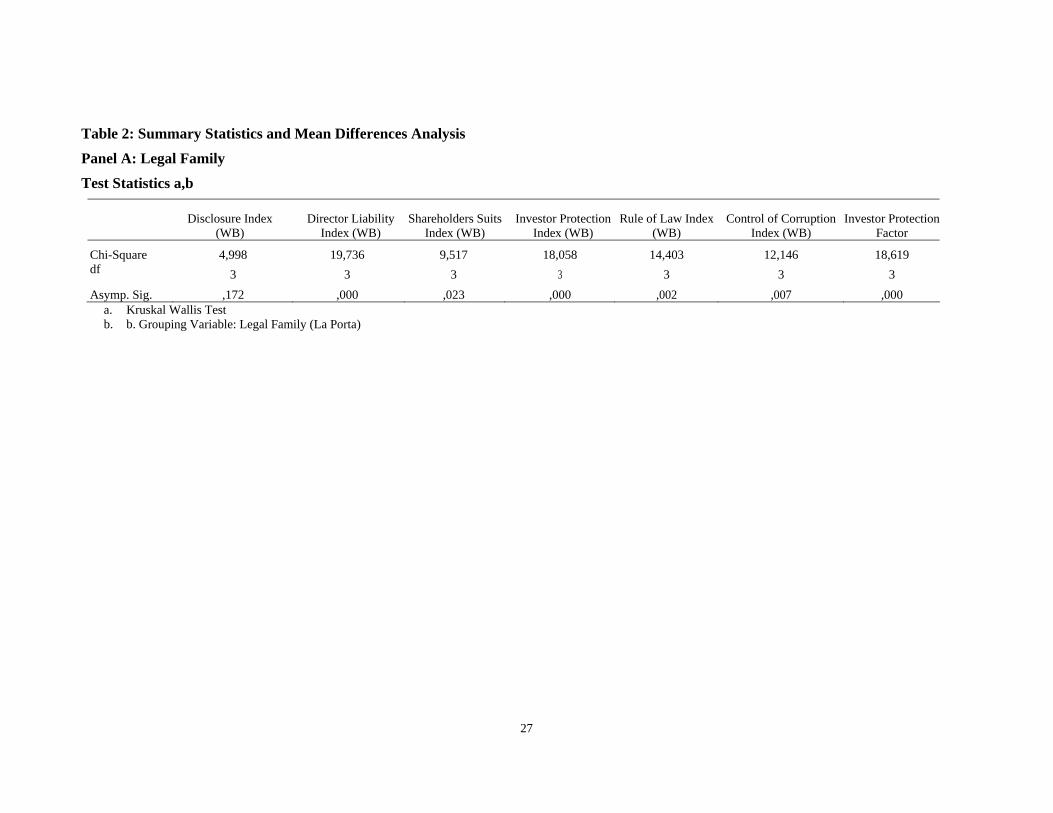
27
Table 2: Summary Statistics and Mean Differences Analysis
Panel A: Legal Family
Test Statistics a,b
Disclosure Index
(WB) Director Liability
Index (WB) Shareholders Suits
Index (WB) Investor Protection
Index (WB) Rule of Law Index
(WB) Control of Corruption
Index (WB) Investor Protection
Factor
Chi-Square 4,998 19,736 9,517 18,058 14,403 12,146 18,619 df 3 3 3 3 3 3 3 Asymp. Sig. ,172 ,000 ,023 ,000 ,002 ,007 ,000
a. Kruskal Wallis Test b. b. Grouping Variable: Legal Family (La Porta)
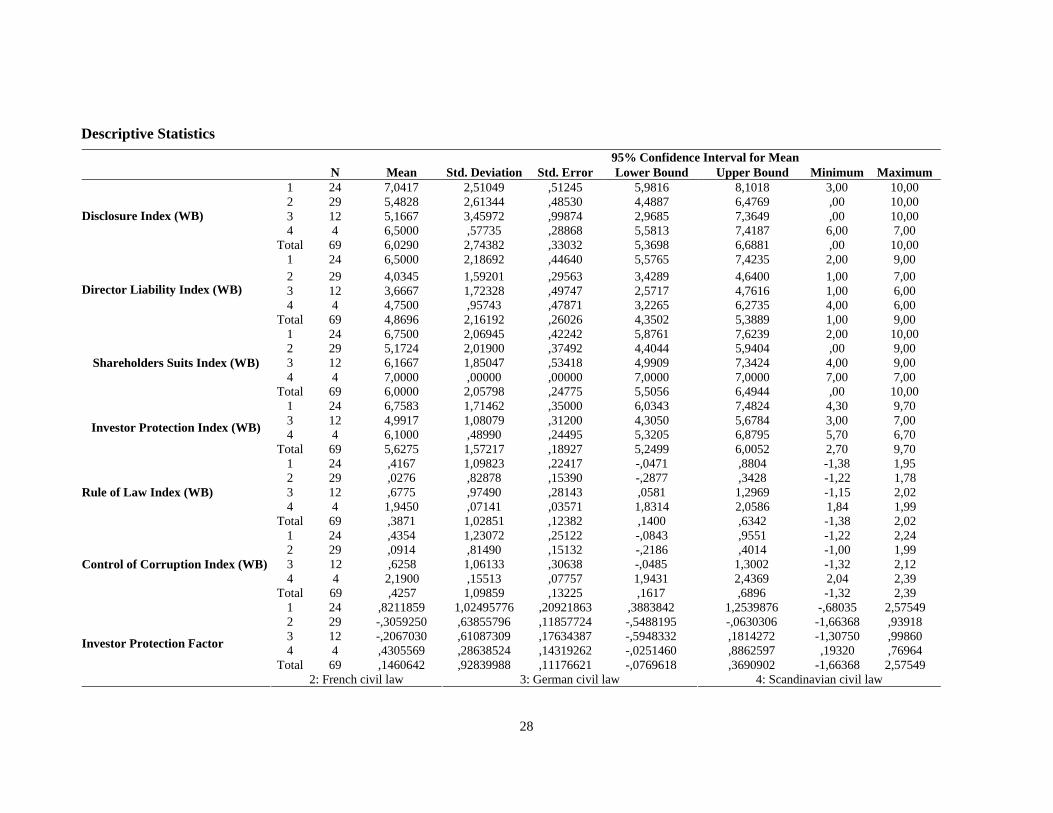
28
Descriptive Statistics 95% Confidence Interval for Mean
N Mean Std. Deviation Std. Error Lower Bound Upper Bound Minimum Maximum 1 24 7,0417 2,51049 ,51245 5,9816 8,1018 3,00 10,00 2 29 5,4828 2,61344 ,48530 4,4887 6,4769 ,00 10,00 3 12 5,1667 3,45972 ,99874 2,9685 7,3649 ,00 10,00 4 4 6,5000 ,57735 ,28868 5,5813 7,4187 6,00 7,00
Disclosure Index (WB)
Total 69 6,0290 2,74382 ,33032 5,3698 6,6881 ,00 10,00 1 24 6,5000 2,18692 ,44640 5,5765 7,4235 2,00 9,00 2 29 4,0345 1,59201 ,29563 3,4289 4,6400 1,00 7,00 3 12 3,6667 1,72328 ,49747 2,5717 4,7616 1,00 6,00 4 4 4,7500 ,95743 ,47871 3,2265 6,2735 4,00 6,00
Director Liability Index (WB)
Total 69 4,8696 2,16192 ,26026 4,3502 5,3889 1,00 9,00 1 24 6,7500 2,06945 ,42242 5,8761 7,6239 2,00 10,00 2 29 5,1724 2,01900 ,37492 4,4044 5,9404 ,00 9,00 3 12 6,1667 1,85047 ,53418 4,9909 7,3424 4,00 9,00 4 4 7,0000 ,00000 ,00000 7,0000 7,0000 7,00 7,00
Shareholders Suits Index (WB)
Total 69 6,0000 2,05798 ,24775 5,5056 6,4944 ,00 10,00 1 24 6,7583 1,71462 ,35000 6,0343 7,4824 4,30 9,70 3 12 4,9917 1,08079 ,31200 4,3050 5,6784 3,00 7,00 4 4 6,1000 ,48990 ,24495 5,3205 6,8795 5,70 6,70 Investor Protection Index (WB)
Total 69 5,6275 1,57217 ,18927 5,2499 6,0052 2,70 9,70 1 24 ,4167 1,09823 ,22417 -,0471 ,8804 -1,38 1,95 2 29 ,0276 ,82878 ,15390 -,2877 ,3428 -1,22 1,78 3 12 ,6775 ,97490 ,28143 ,0581 1,2969 -1,15 2,02 4 4 1,9450 ,07141 ,03571 1,8314 2,0586 1,84 1,99
Rule of Law Index (WB)
Total 69 ,3871 1,02851 ,12382 ,1400 ,6342 -1,38 2,02 1 24 ,4354 1,23072 ,25122 -,0843 ,9551 -1,22 2,24 2 29 ,0914 ,81490 ,15132 -,2186 ,4014 -1,00 1,99 3 12 ,6258 1,06133 ,30638 -,0485 1,3002 -1,32 2,12 4 4 2,1900 ,15513 ,07757 1,9431 2,4369 2,04 2,39
Control of Corruption Index (WB)
Total 69 ,4257 1,09859 ,13225 ,1617 ,6896 -1,32 2,39 1 24 ,8211859 1,02495776 ,20921863 ,3883842 1,2539876 -,68035 2,57549 2 29 -,3059250 ,63855796 ,11857724 -,5488195 -,0630306 -1,66368 ,93918 3 12 -,2067030 ,61087309 ,17634387 -,5948332 ,1814272 -1,30750 ,99860 4 4 ,4305569 ,28638524 ,14319262 -,0251460 ,8862597 ,19320 ,76964
Total 69 ,1460642 ,92839988 ,11176621 -,0769618 ,3690902 -1,66368 2,57549
Investor Protection Factor
2: French civil law 3: German civil law 4: Scandinavian civil law
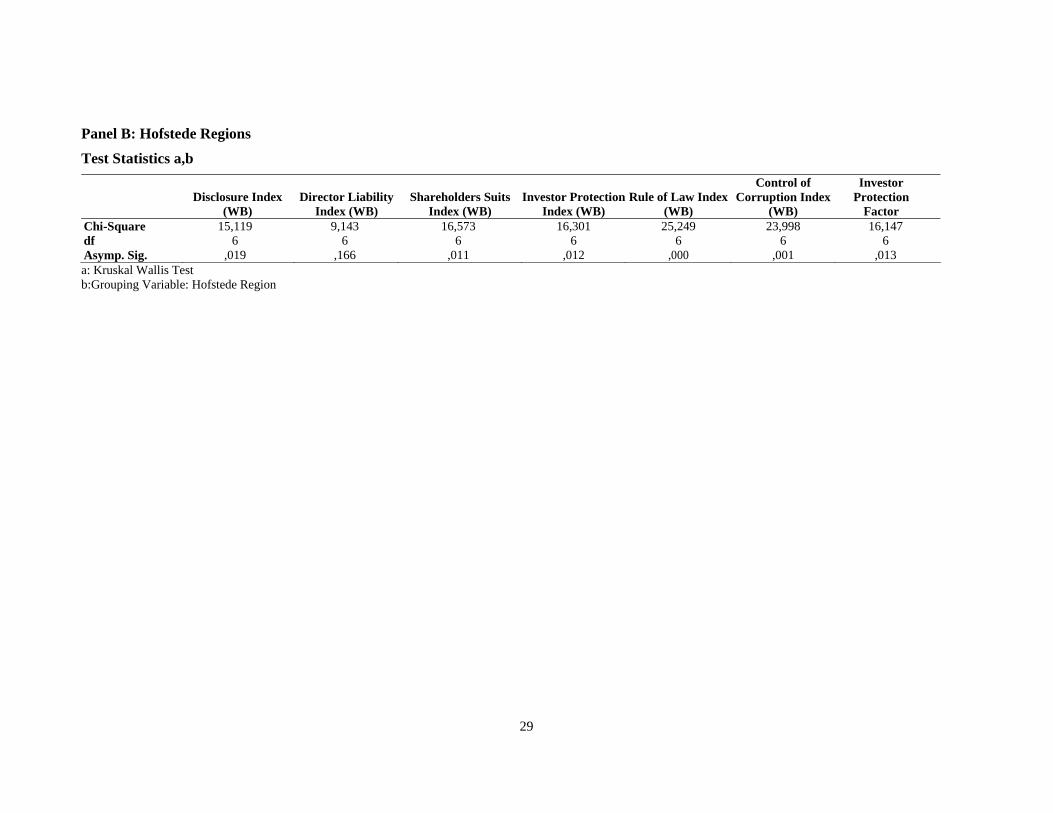
29
Panel B: Hofstede Regions
Test Statistics a,b
Disclosure Index
(WB) Director Liability
Index (WB) Shareholders Suits
Index (WB) Investor Protection
Index (WB) Rule of Law Index
(WB)
Control of Corruption Index
(WB)
Investor Protection
Factor Chi-Square 15,119 9,143 16,573 16,301 25,249 23,998 16,147 df 6 6 6 6 6 6 6 Asymp. Sig. ,019 ,166 ,011 ,012 ,000 ,001 ,013 a: Kruskal Wallis Test b:Grouping Variable: Hofstede Region
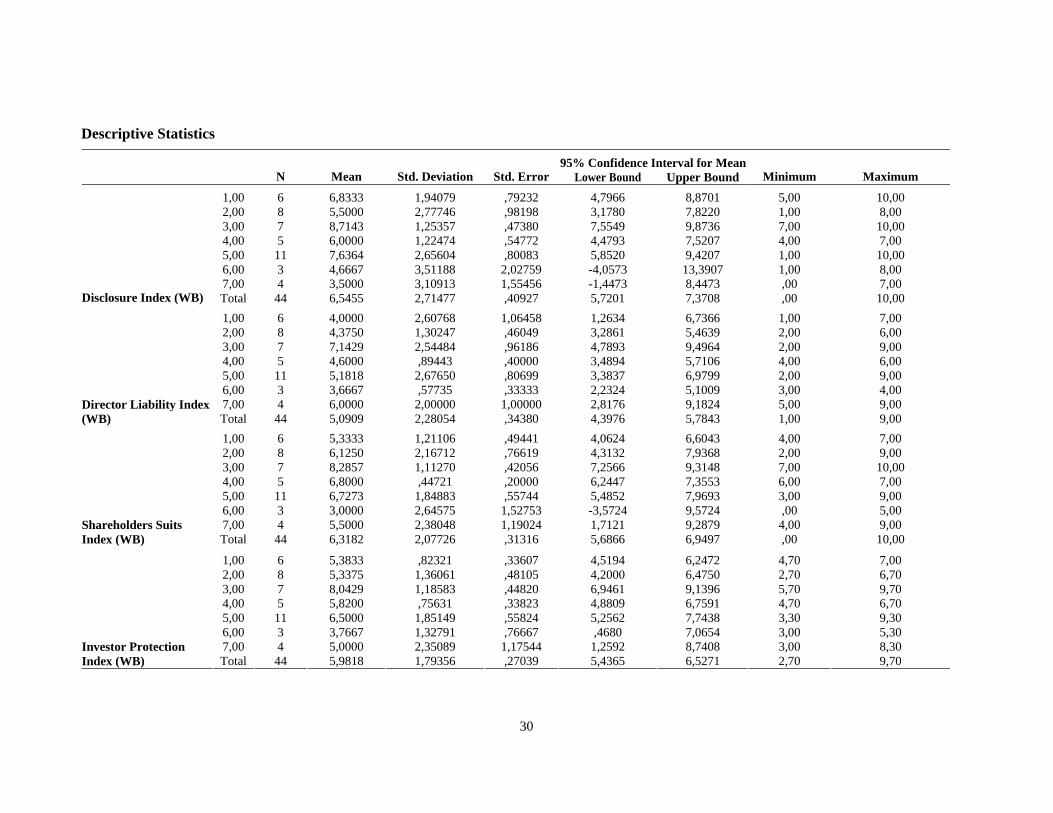
30
Descriptive Statistics
95% Confidence Interval for Mean N Mean Std. Deviation Std. Error Lower Bound Upper Bound Minimum Maximum
1,00 6 6,8333 1,94079 ,79232 4,7966 8,8701 5,00 10,00 2,00 8 5,5000 2,77746 ,98198 3,1780 7,8220 1,00 8,00 3,00 7 8,7143 1,25357 ,47380 7,5549 9,8736 7,00 10,00 4,00 5 6,0000 1,22474 ,54772 4,4793 7,5207 4,00 7,00 5,00 11 7,6364 2,65604 ,80083 5,8520 9,4207 1,00 10,00 6,00 3 4,6667 3,51188 2,02759 -4,0573 13,3907 1,00 8,00 7,00 4 3,5000 3,10913 1,55456 -1,4473 8,4473 ,00 7,00
Disclosure Index (WB) Total 44 6,5455 2,71477 ,40927 5,7201 7,3708 ,00 10,00 1,00 6 4,0000 2,60768 1,06458 1,2634 6,7366 1,00 7,00 2,00 8 4,3750 1,30247 ,46049 3,2861 5,4639 2,00 6,00 3,00 7 7,1429 2,54484 ,96186 4,7893 9,4964 2,00 9,00 4,00 5 4,6000 ,89443 ,40000 3,4894 5,7106 4,00 6,00 5,00 11 5,1818 2,67650 ,80699 3,3837 6,9799 2,00 9,00 6,00 3 3,6667 ,57735 ,33333 2,2324 5,1009 3,00 4,00 7,00 4 6,0000 2,00000 1,00000 2,8176 9,1824 5,00 9,00 Director Liability Index
(WB) Total 44 5,0909 2,28054 ,34380 4,3976 5,7843 1,00 9,00 1,00 6 5,3333 1,21106 ,49441 4,0624 6,6043 4,00 7,00 2,00 8 6,1250 2,16712 ,76619 4,3132 7,9368 2,00 9,00 3,00 7 8,2857 1,11270 ,42056 7,2566 9,3148 7,00 10,00 4,00 5 6,8000 ,44721 ,20000 6,2447 7,3553 6,00 7,00 5,00 11 6,7273 1,84883 ,55744 5,4852 7,9693 3,00 9,00 6,00 3 3,0000 2,64575 1,52753 -3,5724 9,5724 ,00 5,00 7,00 4 5,5000 2,38048 1,19024 1,7121 9,2879 4,00 9,00 Shareholders Suits
Index (WB) Total 44 6,3182 2,07726 ,31316 5,6866 6,9497 ,00 10,00
1,00 6 5,3833 ,82321 ,33607 4,5194 6,2472 4,70 7,00 2,00 8 5,3375 1,36061 ,48105 4,2000 6,4750 2,70 6,70 3,00 7 8,0429 1,18583 ,44820 6,9461 9,1396 5,70 9,70 4,00 5 5,8200 ,75631 ,33823 4,8809 6,7591 4,70 6,70 5,00 11 6,5000 1,85149 ,55824 5,2562 7,7438 3,30 9,30 6,00 3 3,7667 1,32791 ,76667 ,4680 7,0654 3,00 5,30 7,00 4 5,0000 2,35089 1,17544 1,2592 8,7408 3,00 8,30 Investor Protection
Index (WB) Total 44 5,9818 1,79356 ,27039 5,4365 6,5271 2,70 9,70
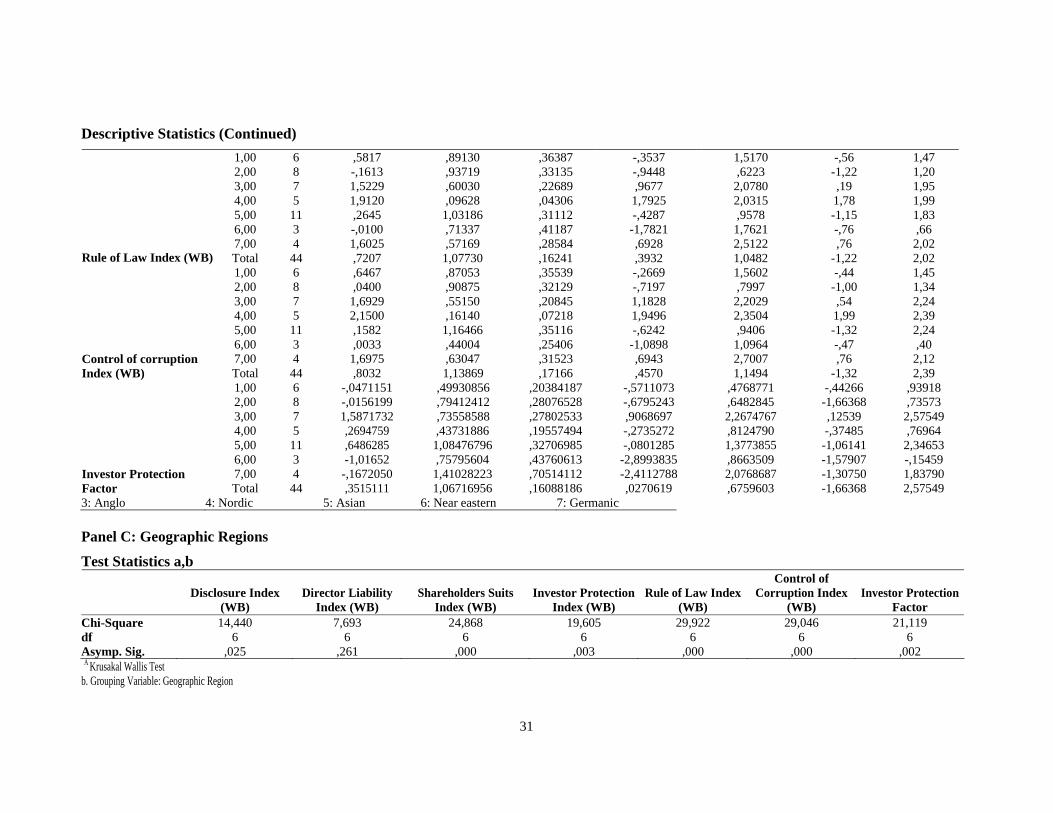
31
Descriptive Statistics (Continued) 1,00 6 ,5817 ,89130 ,36387 -,3537 1,5170 -,56 1,47 2,00 8 -,1613 ,93719 ,33135 -,9448 ,6223 -1,22 1,20 3,00 7 1,5229 ,60030 ,22689 ,9677 2,0780 ,19 1,95 4,00 5 1,9120 ,09628 ,04306 1,7925 2,0315 1,78 1,99 5,00 11 ,2645 1,03186 ,31112 -,4287 ,9578 -1,15 1,83 6,00 3 -,0100 ,71337 ,41187 -1,7821 1,7621 -,76 ,66 7,00 4 1,6025 ,57169 ,28584 ,6928 2,5122 ,76 2,02
Rule of Law Index (WB) Total 44 ,7207 1,07730 ,16241 ,3932 1,0482 -1,22 2,02 1,00 6 ,6467 ,87053 ,35539 -,2669 1,5602 -,44 1,45 2,00 8 ,0400 ,90875 ,32129 -,7197 ,7997 -1,00 1,34 3,00 7 1,6929 ,55150 ,20845 1,1828 2,2029 ,54 2,24 4,00 5 2,1500 ,16140 ,07218 1,9496 2,3504 1,99 2,39 5,00 11 ,1582 1,16466 ,35116 -,6242 ,9406 -1,32 2,24 6,00 3 ,0033 ,44004 ,25406 -1,0898 1,0964 -,47 ,40 7,00 4 1,6975 ,63047 ,31523 ,6943 2,7007 ,76 2,12 Control of corruption
Index (WB) Total 44 ,8032 1,13869 ,17166 ,4570 1,1494 -1,32 2,39 1,00 6 -,0471151 ,49930856 ,20384187 -,5711073 ,4768771 -,44266 ,93918 2,00 8 -,0156199 ,79412412 ,28076528 -,6795243 ,6482845 -1,66368 ,73573 3,00 7 1,5871732 ,73558588 ,27802533 ,9068697 2,2674767 ,12539 2,57549 4,00 5 ,2694759 ,43731886 ,19557494 -,2735272 ,8124790 -,37485 ,76964 5,00 11 ,6486285 1,08476796 ,32706985 -,0801285 1,3773855 -1,06141 2,34653 6,00 3 -1,01652 ,75795604 ,43760613 -2,8993835 ,8663509 -1,57907 -,15459 7,00 4 -,1672050 1,41028223 ,70514112 -2,4112788 2,0768687 -1,30750 1,83790 Investor Protection
Factor Total 44 ,3515111 1,06716956 ,16088186 ,0270619 ,6759603 -1,66368 2,57549 3: Anglo 4: Nordic 5: Asian 6: Near eastern 7: Germanic Panel C: Geographic Regions
Test Statistics a,b
Disclosure Index
(WB) Director Liability
Index (WB) Shareholders Suits
Index (WB) Investor Protection
Index (WB) Rule of Law Index
(WB)
Control of Corruption Index
(WB) Investor Protection
Factor Chi-Square 14,440 7,693 24,868 19,605 29,922 29,046 21,119 df 6 6 6 6 6 6 6 Asymp. Sig. ,025 ,261 ,000 ,003 ,000 ,000 ,002 A Krusakal Wallis Test b. Grouping Variable: Geographic Region
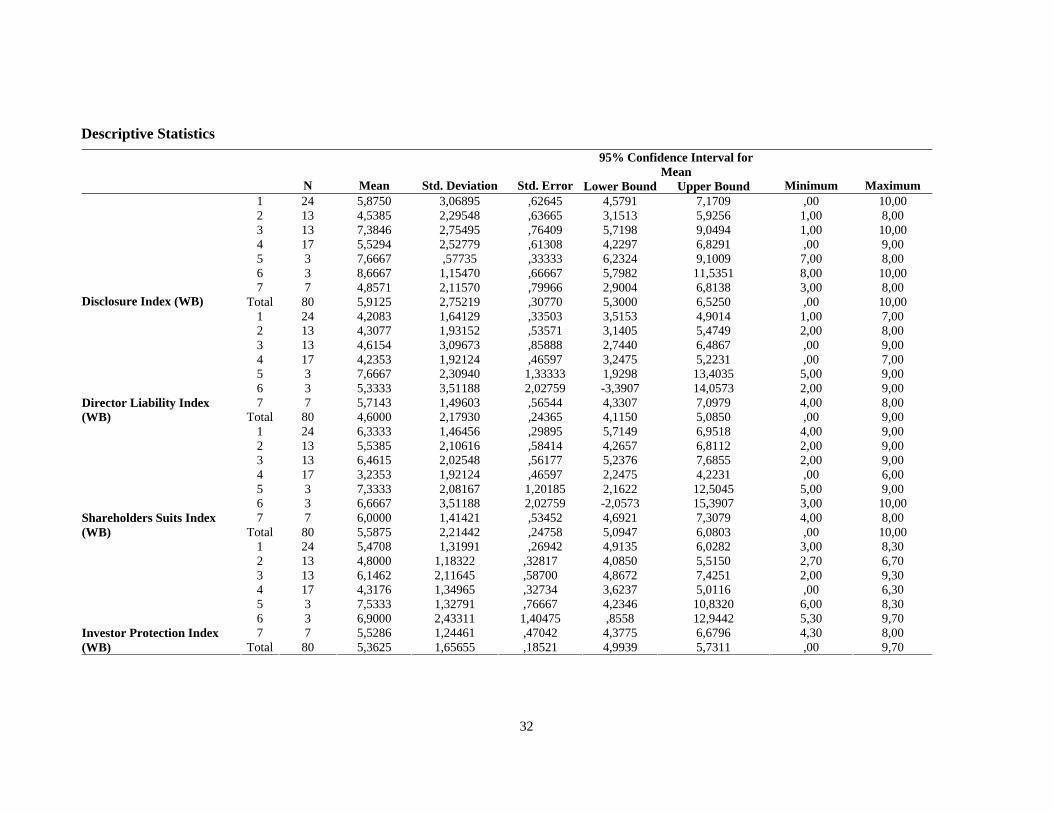
32
Descriptive Statistics 95% Confidence Interval for
Mean N Mean Std. Deviation Std. Error Lower Bound Upper Bound Minimum Maximum
1 24 5,8750 3,06895 ,62645 4,5791 7,1709 ,00 10,00 2 13 4,5385 2,29548 ,63665 3,1513 5,9256 1,00 8,00 3 13 7,3846 2,75495 ,76409 5,7198 9,0494 1,00 10,00 4 17 5,5294 2,52779 ,61308 4,2297 6,8291 ,00 9,00 5 3 7,6667 ,57735 ,33333 6,2324 9,1009 7,00 8,00 6 3 8,6667 1,15470 ,66667 5,7982 11,5351 8,00 10,00 7 7 4,8571 2,11570 ,79966 2,9004 6,8138 3,00 8,00
Disclosure Index (WB) Total 80 5,9125 2,75219 ,30770 5,3000 6,5250 ,00 10,00 1 24 4,2083 1,64129 ,33503 3,5153 4,9014 1,00 7,00 2 13 4,3077 1,93152 ,53571 3,1405 5,4749 2,00 8,00 3 13 4,6154 3,09673 ,85888 2,7440 6,4867 ,00 9,00 4 17 4,2353 1,92124 ,46597 3,2475 5,2231 ,00 7,00 5 3 7,6667 2,30940 1,33333 1,9298 13,4035 5,00 9,00 6 3 5,3333 3,51188 2,02759 -3,3907 14,0573 2,00 9,00 7 7 5,7143 1,49603 ,56544 4,3307 7,0979 4,00 8,00 Director Liability Index
(WB) Total 80 4,6000 2,17930 ,24365 4,1150 5,0850 ,00 9,00 1 24 6,3333 1,46456 ,29895 5,7149 6,9518 4,00 9,00 2 13 5,5385 2,10616 ,58414 4,2657 6,8112 2,00 9,00 3 13 6,4615 2,02548 ,56177 5,2376 7,6855 2,00 9,00 4 17 3,2353 1,92124 ,46597 2,2475 4,2231 ,00 6,00 5 3 7,3333 2,08167 1,20185 2,1622 12,5045 5,00 9,00 6 3 6,6667 3,51188 2,02759 -2,0573 15,3907 3,00 10,00 7 7 6,0000 1,41421 ,53452 4,6921 7,3079 4,00 8,00 Shareholders Suits Index
(WB) Total 80 5,5875 2,21442 ,24758 5,0947 6,0803 ,00 10,00 1 24 5,4708 1,31991 ,26942 4,9135 6,0282 3,00 8,30 2 13 4,8000 1,18322 ,32817 4,0850 5,5150 2,70 6,70 3 13 6,1462 2,11645 ,58700 4,8672 7,4251 2,00 9,30 4 17 4,3176 1,34965 ,32734 3,6237 5,0116 ,00 6,30 5 3 7,5333 1,32791 ,76667 4,2346 10,8320 6,00 8,30 6 3 6,9000 2,43311 1,40475 ,8558 12,9442 5,30 9,70 7 7 5,5286 1,24461 ,47042 4,3775 6,6796 4,30 8,00 Investor Protection Index
(WB) Total 80 5,3625 1,65655 ,18521 4,9939 5,7311 ,00 9,70
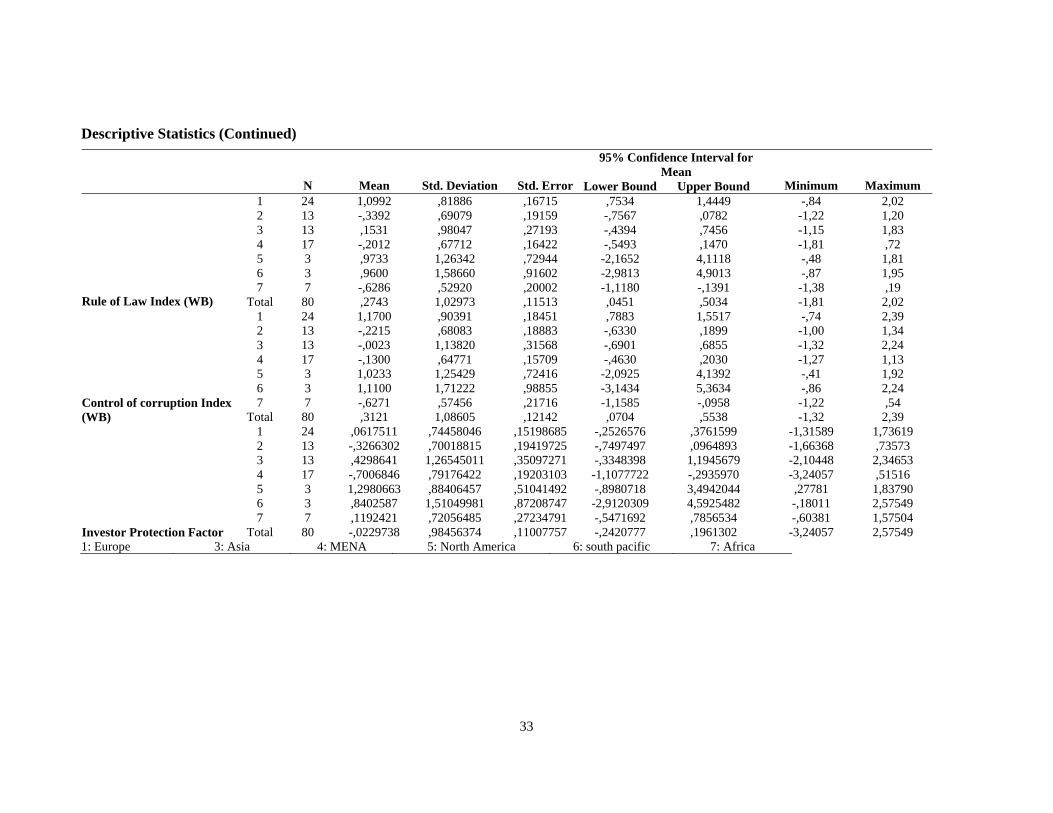
33
Descriptive Statistics (Continued) 95% Confidence Interval for
Mean N Mean Std. Deviation Std. Error Lower Bound Upper Bound Minimum Maximum
1 24 1,0992 ,81886 ,16715 ,7534 1,4449 -,84 2,02 2 13 -,3392 ,69079 ,19159 -,7567 ,0782 -1,22 1,20 3 13 ,1531 ,98047 ,27193 -,4394 ,7456 -1,15 1,83 4 17 -,2012 ,67712 ,16422 -,5493 ,1470 -1,81 ,72 5 3 ,9733 1,26342 ,72944 -2,1652 4,1118 -,48 1,81 6 3 ,9600 1,58660 ,91602 -2,9813 4,9013 -,87 1,95 7 7 -,6286 ,52920 ,20002 -1,1180 -,1391 -1,38 ,19
Rule of Law Index (WB) Total 80 ,2743 1,02973 ,11513 ,0451 ,5034 -1,81 2,02 1 24 1,1700 ,90391 ,18451 ,7883 1,5517 -,74 2,39 2 13 -,2215 ,68083 ,18883 -,6330 ,1899 -1,00 1,34 3 13 -,0023 1,13820 ,31568 -,6901 ,6855 -1,32 2,24 4 17 -,1300 ,64771 ,15709 -,4630 ,2030 -1,27 1,13 5 3 1,0233 1,25429 ,72416 -2,0925 4,1392 -,41 1,92 6 3 1,1100 1,71222 ,98855 -3,1434 5,3634 -,86 2,24 7 7 -,6271 ,57456 ,21716 -1,1585 -,0958 -1,22 ,54 Control of corruption Index
(WB) Total 80 ,3121 1,08605 ,12142 ,0704 ,5538 -1,32 2,39 1 24 ,0617511 ,74458046 ,15198685 -,2526576 ,3761599 -1,31589 1,73619 2 13 -,3266302 ,70018815 ,19419725 -,7497497 ,0964893 -1,66368 ,73573 3 13 ,4298641 1,26545011 ,35097271 -,3348398 1,1945679 -2,10448 2,34653 4 17 -,7006846 ,79176422 ,19203103 -1,1077722 -,2935970 -3,24057 ,51516 5 3 1,2980663 ,88406457 ,51041492 -,8980718 3,4942044 ,27781 1,83790 6 3 ,8402587 1,51049981 ,87208747 -2,9120309 4,5925482 -,18011 2,57549 7 7 ,1192421 ,72056485 ,27234791 -,5471692 ,7856534 -,60381 1,57504
Investor Protection Factor Total 80 -,0229738 ,98456374 ,11007757 -,2420777 ,1961302 -3,24057 2,57549 1: Europe 3: Asia 4: MENA 5: North America 6: south pacific 7: Africa
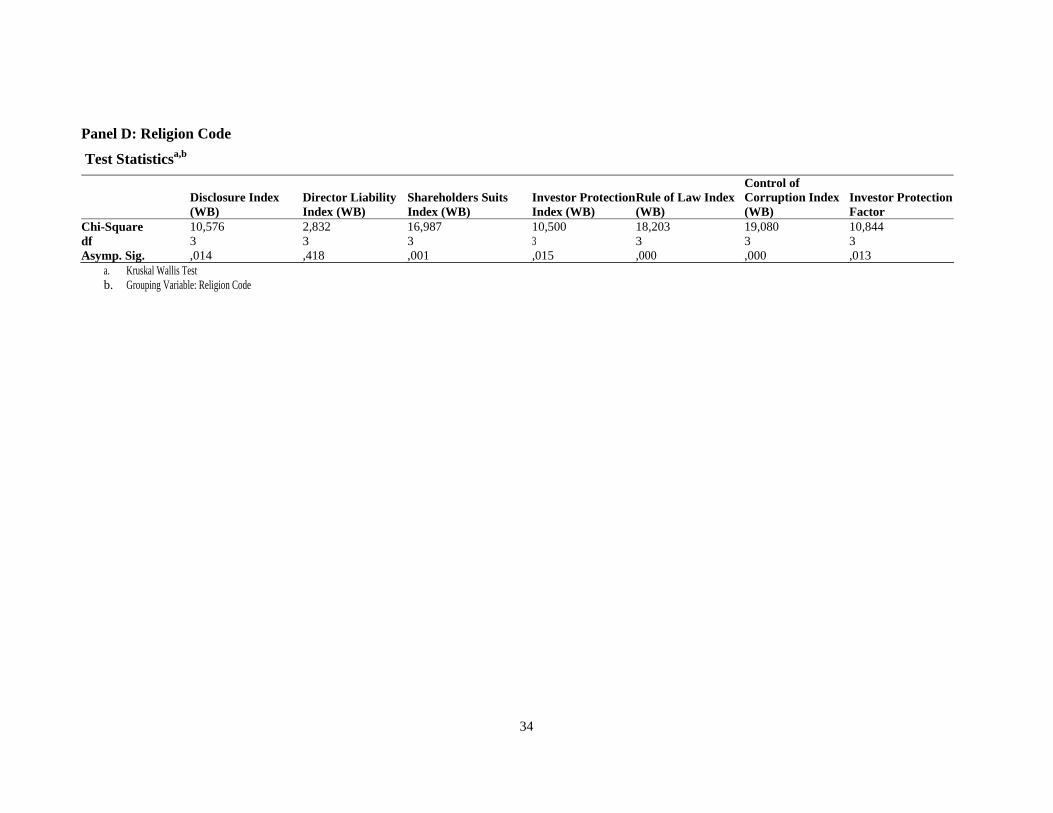
34
Panel D: Religion Code
Test Statisticsa,b
Disclosure Index (WB)
Director Liability Index (WB)
Shareholders Suits Index (WB)
Investor Protection Index (WB)
Rule of Law Index (WB)
Control of Corruption Index (WB)
Investor ProtectionFactor
Chi-Square 10,576 2,832 16,987 10,500 18,203 19,080 10,844 df 3 3 3 3 3 3 3 Asymp. Sig. ,014 ,418 ,001 ,015 ,000 ,000 ,013
a. Kruskal Wallis Test b. Grouping Variable: Religion Code
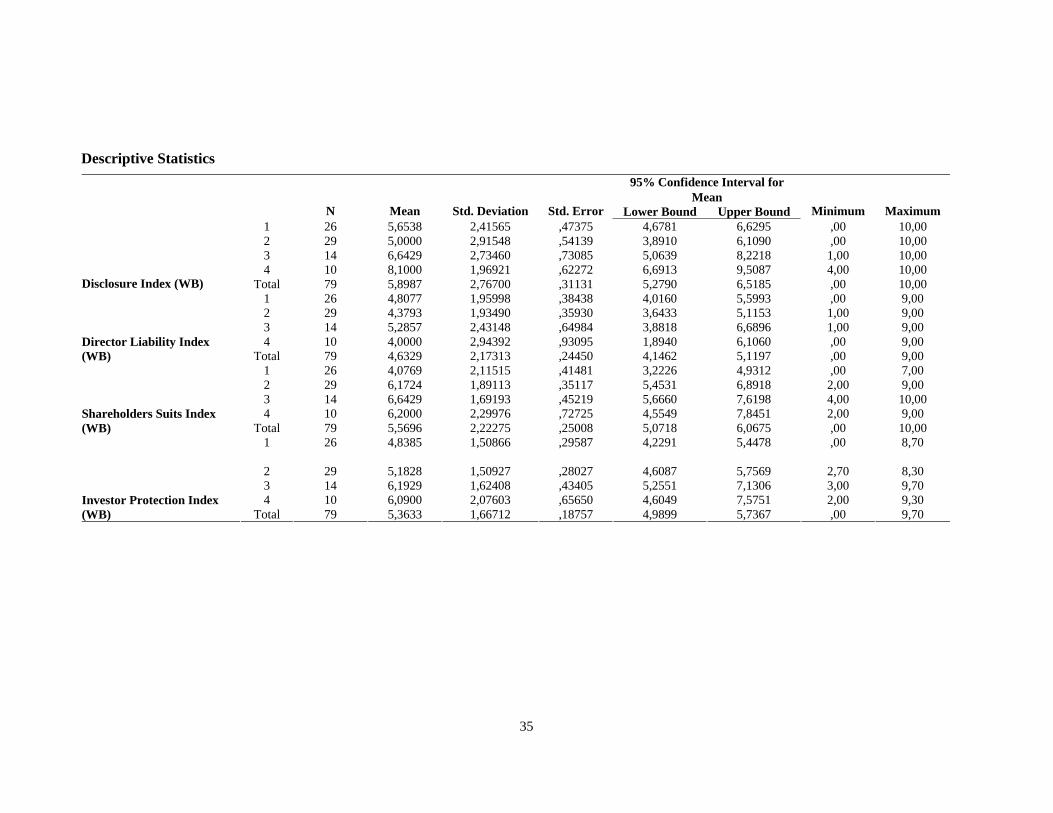
35
Descriptive Statistics 95% Confidence Interval for
Mean N Mean Std. Deviation Std. Error Lower Bound Upper Bound Minimum Maximum
1 26 5,6538 2,41565 ,47375 4,6781 6,6295 ,00 10,00 2 29 5,0000 2,91548 ,54139 3,8910 6,1090 ,00 10,00 3 14 6,6429 2,73460 ,73085 5,0639 8,2218 1,00 10,00 4 10 8,1000 1,96921 ,62272 6,6913 9,5087 4,00 10,00
Disclosure Index (WB) Total 79 5,8987 2,76700 ,31131 5,2790 6,5185 ,00 10,00 1 26 4,8077 1,95998 ,38438 4,0160 5,5993 ,00 9,00 2 29 4,3793 1,93490 ,35930 3,6433 5,1153 1,00 9,00 3 14 5,2857 2,43148 ,64984 3,8818 6,6896 1,00 9,00 4 10 4,0000 2,94392 ,93095 1,8940 6,1060 ,00 9,00 Director Liability Index
(WB) Total 79 4,6329 2,17313 ,24450 4,1462 5,1197 ,00 9,00 1 26 4,0769 2,11515 ,41481 3,2226 4,9312 ,00 7,00 2 29 6,1724 1,89113 ,35117 5,4531 6,8918 2,00 9,00 3 14 6,6429 1,69193 ,45219 5,6660 7,6198 4,00 10,00 4 10 6,2000 2,29976 ,72725 4,5549 7,8451 2,00 9,00 Shareholders Suits Index
(WB) Total 79 5,5696 2,22275 ,25008 5,0718 6,0675 ,00 10,00 1 26 4,8385 1,50866 ,29587 4,2291 5,4478 ,00 8,70
2 29 5,1828 1,50927 ,28027 4,6087 5,7569 2,70 8,30 3 14 6,1929 1,62408 ,43405 5,2551 7,1306 3,00 9,70 4 10 6,0900 2,07603 ,65650 4,6049 7,5751 2,00 9,30 Investor Protection Index
(WB) Total 79 5,3633 1,66712 ,18757 4,9899 5,7367 ,00 9,70
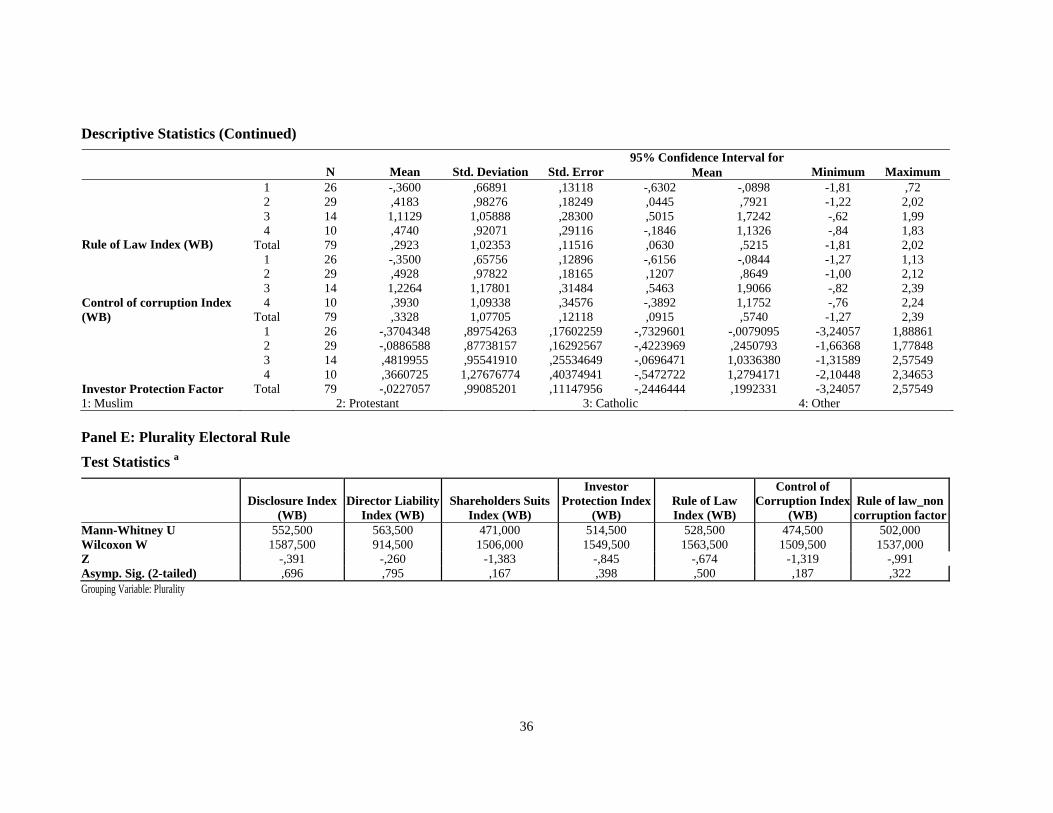
36
Descriptive Statistics (Continued) 95% Confidence Interval for
N Mean Std. Deviation Std. Error Mean Minimum Maximum 1 26 -,3600 ,66891 ,13118 -,6302 -,0898 -1,81 ,72 2 29 ,4183 ,98276 ,18249 ,0445 ,7921 -1,22 2,02 3 14 1,1129 1,05888 ,28300 ,5015 1,7242 -,62 1,99 4 10 ,4740 ,92071 ,29116 -,1846 1,1326 -,84 1,83
Rule of Law Index (WB) Total 79 ,2923 1,02353 ,11516 ,0630 ,5215 -1,81 2,02 1 26 -,3500 ,65756 ,12896 -,6156 -,0844 -1,27 1,13 2 29 ,4928 ,97822 ,18165 ,1207 ,8649 -1,00 2,12 3 14 1,2264 1,17801 ,31484 ,5463 1,9066 -,82 2,39 4 10 ,3930 1,09338 ,34576 -,3892 1,1752 -,76 2,24 Control of corruption Index
(WB) Total 79 ,3328 1,07705 ,12118 ,0915 ,5740 -1,27 2,39 1 26 -,3704348 ,89754263 ,17602259 -,7329601 -,0079095 -3,24057 1,88861 2 29 -,0886588 ,87738157 ,16292567 -,4223969 ,2450793 -1,66368 1,77848 3 14 ,4819955 ,95541910 ,25534649 -,0696471 1,0336380 -1,31589 2,57549 4 10 ,3660725 1,27676774 ,40374941 -,5472722 1,2794171 -2,10448 2,34653
Investor Protection Factor Total 79 -,0227057 ,99085201 ,11147956 -,2446444 ,1992331 -3,24057 2,57549 1: Muslim 2: Protestant 3: Catholic 4: Other Panel E: Plurality Electoral Rule
Test Statistics a
Disclosure Index
(WB) Director Liability
Index (WB) Shareholders Suits
Index (WB)
Investor Protection Index
(WB) Rule of Law Index (WB)
Control of Corruption Index
(WB) Rule of law_non corruption factor
Mann-Whitney U 552,500 563,500 471,000 514,500 528,500 474,500 502,000 Wilcoxon W 1587,500 914,500 1506,000 1549,500 1563,500 1509,500 1537,000 Z -,391 -,260 -1,383 -,845 -,674 -1,319 -,991 Asymp. Sig. (2-tailed) ,696 ,795 ,167 ,398 ,500 ,187 ,322 Grouping Variable: Plurality
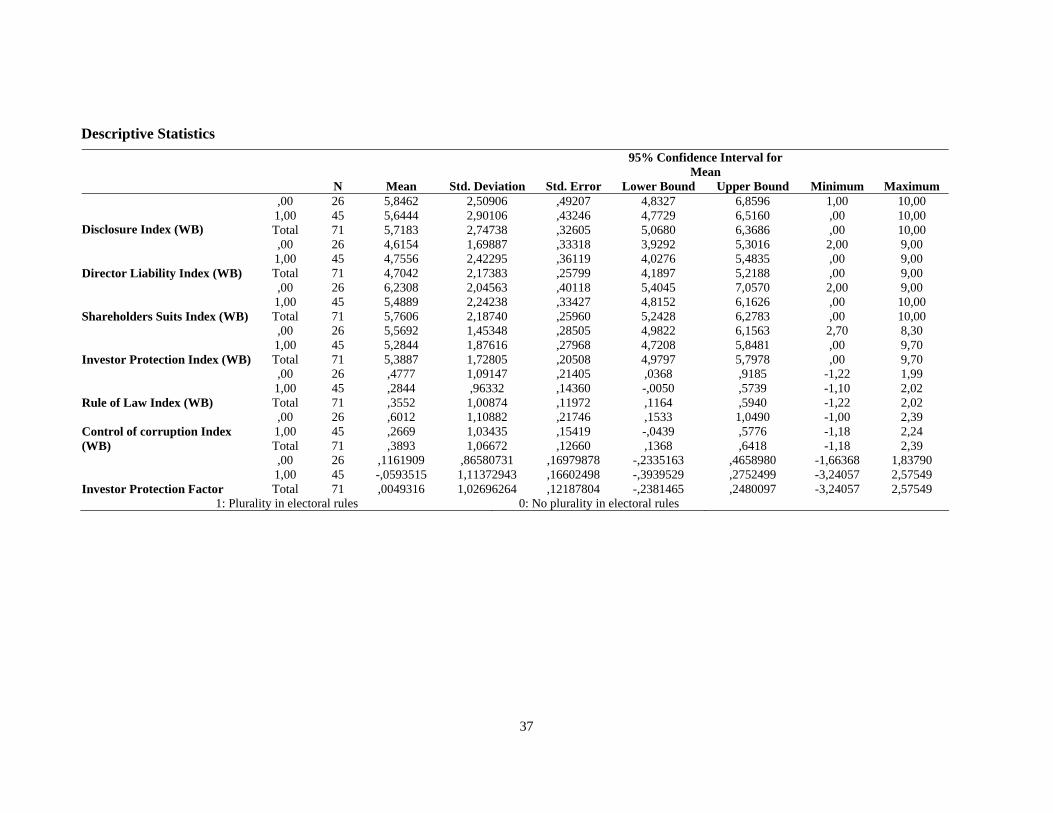
37
Descriptive Statistics 95% Confidence Interval for
Mean N Mean Std. Deviation Std. Error Lower Bound Upper Bound Minimum Maximum
,00 26 5,8462 2,50906 ,49207 4,8327 6,8596 1,00 10,00 1,00 45 5,6444 2,90106 ,43246 4,7729 6,5160 ,00 10,00
Disclosure Index (WB) Total 71 5,7183 2,74738 ,32605 5,0680 6,3686 ,00 10,00 ,00 26 4,6154 1,69887 ,33318 3,9292 5,3016 2,00 9,00 1,00 45 4,7556 2,42295 ,36119 4,0276 5,4835 ,00 9,00
Director Liability Index (WB) Total 71 4,7042 2,17383 ,25799 4,1897 5,2188 ,00 9,00 ,00 26 6,2308 2,04563 ,40118 5,4045 7,0570 2,00 9,00 1,00 45 5,4889 2,24238 ,33427 4,8152 6,1626 ,00 10,00
Shareholders Suits Index (WB) Total 71 5,7606 2,18740 ,25960 5,2428 6,2783 ,00 10,00 ,00 26 5,5692 1,45348 ,28505 4,9822 6,1563 2,70 8,30 1,00 45 5,2844 1,87616 ,27968 4,7208 5,8481 ,00 9,70
Investor Protection Index (WB) Total 71 5,3887 1,72805 ,20508 4,9797 5,7978 ,00 9,70 ,00 26 ,4777 1,09147 ,21405 ,0368 ,9185 -1,22 1,99 1,00 45 ,2844 ,96332 ,14360 -,0050 ,5739 -1,10 2,02
Rule of Law Index (WB) Total 71 ,3552 1,00874 ,11972 ,1164 ,5940 -1,22 2,02 ,00 26 ,6012 1,10882 ,21746 ,1533 1,0490 -1,00 2,39 1,00 45 ,2669 1,03435 ,15419 -,0439 ,5776 -1,18 2,24 Control of corruption Index
(WB) Total 71 ,3893 1,06672 ,12660 ,1368 ,6418 -1,18 2,39 ,00 26 ,1161909 ,86580731 ,16979878 -,2335163 ,4658980 -1,66368 1,83790 1,00 45 -,0593515 1,11372943 ,16602498 -,3939529 ,2752499 -3,24057 2,57549
Investor Protection Factor Total 71 ,0049316 1,02696264 ,12187804 -,2381465 ,2480097 -3,24057 2,57549 1: Plurality in electoral rules 0: No plurality in electoral rules
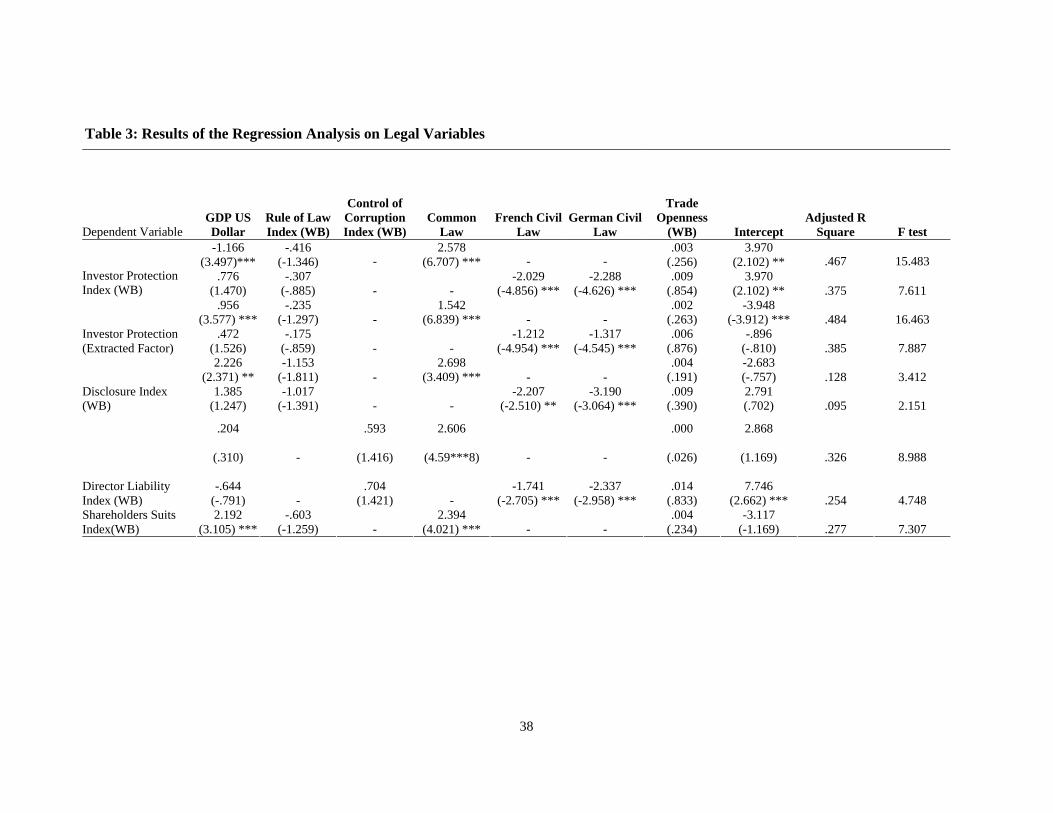
38
Table 3: Results of the Regression Analysis on Legal Variables
Dependent Variable GDP US Dollar
Rule of Law Index (WB)
Control of Corruption Index (WB)
Common Law
French Civil Law
German Civil Law
Trade Openness
(WB) Intercept Adjusted R
Square F test -1.166 -.416 2.578 .003 3.970
(3.497)*** (-1.346) - (6.707) *** - - (.256) (2.102) ** .467 15.483 .776 -.307 -2.029 -2.288 .009 3.970 Investor Protection
Index (WB) (1.470) (-.885) - - (-4.856) *** (-4.626) *** (.854) (2.102) ** .375 7.611 .956 -.235 1.542 .002 -3.948
(3.577) *** (-1.297) - (6.839) *** - - (.263) (-3.912) *** .484 16.463 .472 -.175 -1.212 -1.317 .006 -.896 Investor Protection
(Extracted Factor) (1.526) (-.859) - - (-4.954) *** (-4.545) *** (.876) (-.810) .385 7.887 2.226 -1.153 2.698 .004 -2.683
(2.371) ** (-1.811) - (3.409) *** - - (.191) (-.757) .128 3.412 1.385 -1.017 -2.207 -3.190 .009 2.791 Disclosure Index
(WB) (1.247) (-1.391) - - (-2.510) ** (-3.064) *** (.390) (.702) .095 2.151
.204 .593 2.606 .000 2.868
(.310) - (1.416) (4.59***8) - - (.026) (1.169) .326 8.988
-.644 .704 -1.741 -2.337 .014 7.746 Director Liability Index (WB) (-.791) - (1.421) - (-2.705) *** (-2.958) *** (.833) (2.662) *** .254 4.748
2.192 -.603 2.394 .004 -3.117 Shareholders Suits Index(WB) (3.105) *** (-1.259) - (4.021) *** - - (.234) (-1.169) .277 7.307
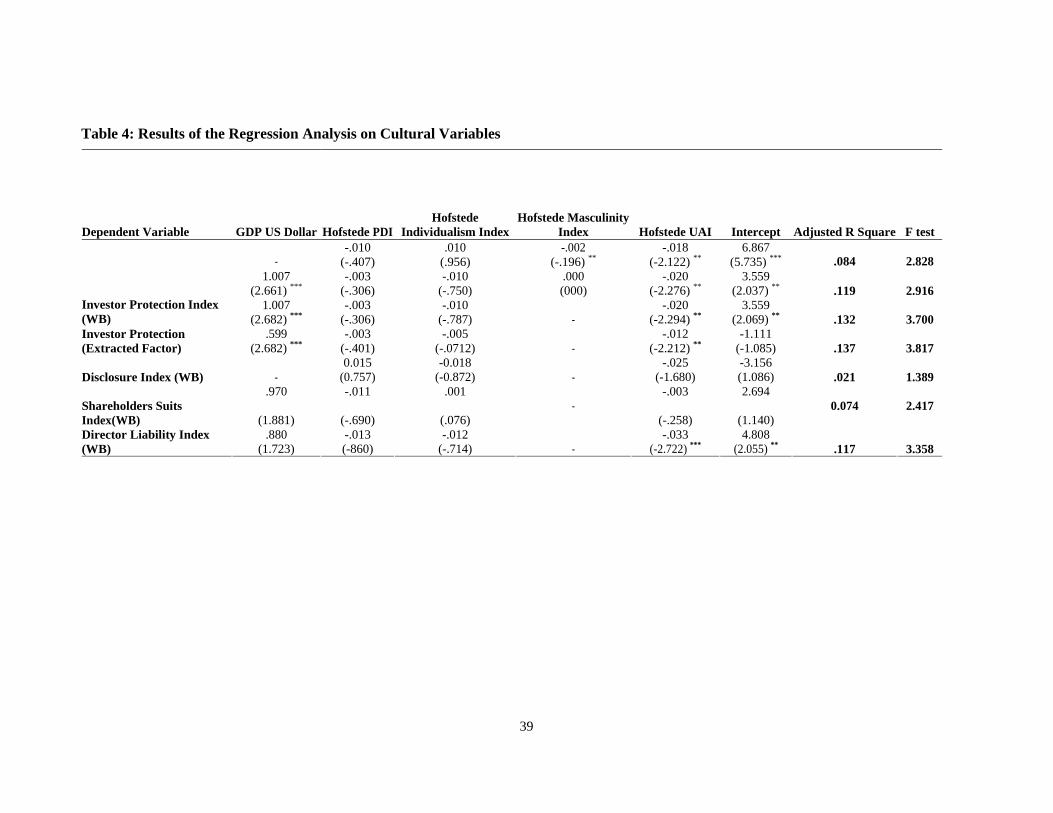
39
Table 4: Results of the Regression Analysis on Cultural Variables
Dependent Variable GDP US Dollar Hofstede PDIHofstede
Individualism IndexHofstede Masculinity
Index Hofstede UAI Intercept Adjusted R Square F test -.010 .010 -.002 -.018 6.867
- (-.407) (.956) (-.196) ** (-2.122) ** (5.735) *** .084 2.828 1.007 -.003 -.010 .000 -.020 3.559
(2.661) *** (-.306) (-.750) (000) (-2.276) ** (2.037) ** .119 2.916 1.007 -.003 -.010 -.020 3.559 Investor Protection Index
(WB) (2.682) *** (-.306) (-.787) - (-2.294) ** (2.069) ** .132 3.700 .599 -.003 -.005 -.012 -1.111 Investor Protection
(Extracted Factor) (2.682) *** (-.401) (-.0712) - (-2.212) ** (-1.085) .137 3.817 0.015 -0.018 -.025 -3.156
Disclosure Index (WB) - (0.757) (-0.872) - (-1.680) (1.086) .021 1.389 .970 -.011 .001 -.003 2.694
- 0.074 2.417 Shareholders Suits Index(WB) (1.881) (-.690) (.076) (-.258) (1.140)
.880 -.013 -.012 -.033 4.808 Director Liability Index (WB) (1.723) (-860) (-.714) - (-2.722) *** (2.055) ** .117 3.358
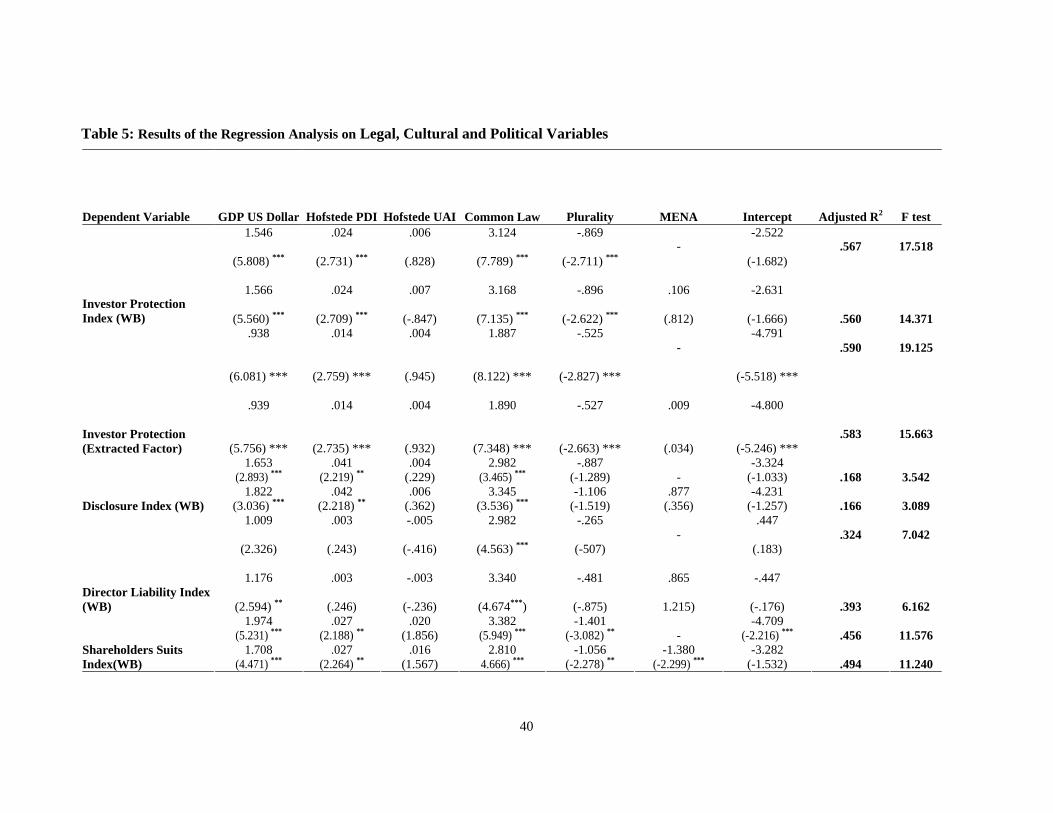
40
Table 5: Results of the Regression Analysis on Legal, Cultural and Political Variables
Dependent Variable GDP US Dollar Hofstede PDI Hofstede UAI Common Law Plurality MENA Intercept Adjusted R2 F test 1.546 .024 .006 3.124 -.869 -2.522
- .567 17.518 (5.808) *** (2.731) *** (.828) (7.789) *** (-2.711) *** (-1.682)
1.566 .024 .007 3.168 -.896 .106 -2.631
Investor Protection Index (WB) (5.560) *** (2.709) *** (-.847) (7.135) *** (-2.622) *** (.812) (-1.666) .560 14.371
.938 .014 .004 1.887 -.525 -4.791 - .590 19.125
(6.081) *** (2.759) *** (.945) (8.122) *** (-2.827) *** (-5.518) ***
.939 .014 .004 1.890 -.527 .009 -4.800
.583 15.663 Investor Protection (Extracted Factor) (5.756) *** (2.735) *** (.932) (7.348) *** (-2.663) *** (.034) (-5.246) ***
1.653 .041 .004 2.982 -.887 -3.324 (2.893) *** (2.219) ** (.229) (3.465) *** (-1.289) - (-1.033) .168 3.542
1.822 .042 .006 3.345 -1.106 .877 -4.231 Disclosure Index (WB) (3.036) *** (2.218) ** (.362) (3.536) *** (-1.519) (.356) (-1.257) .166 3.089
1.009 .003 -.005 2.982 -.265 .447 - .324 7.042
(2.326) (.243) (-.416) (4.563) *** (-507) (.183)
1.176 .003 -.003 3.340 -.481 .865 -.447 Director Liability Index (WB) (2.594) ** (.246) (-.236) (4.674***) (-.875) 1.215) (-.176) .393 6.162
1.974 .027 .020 3.382 -1.401 -4.709 (5.231) *** (2.188) ** (1.856) (5.949) *** (-3.082) ** - (-2.216) *** .456 11.576
1.708 .027 .016 2.810 -1.056 -1.380 -3.282 Shareholders Suits Index(WB) (4.471) *** (2.264) ** (1.567) 4.666) *** (-2.278) ** (-2.299) *** (-1.532) .494 11.240
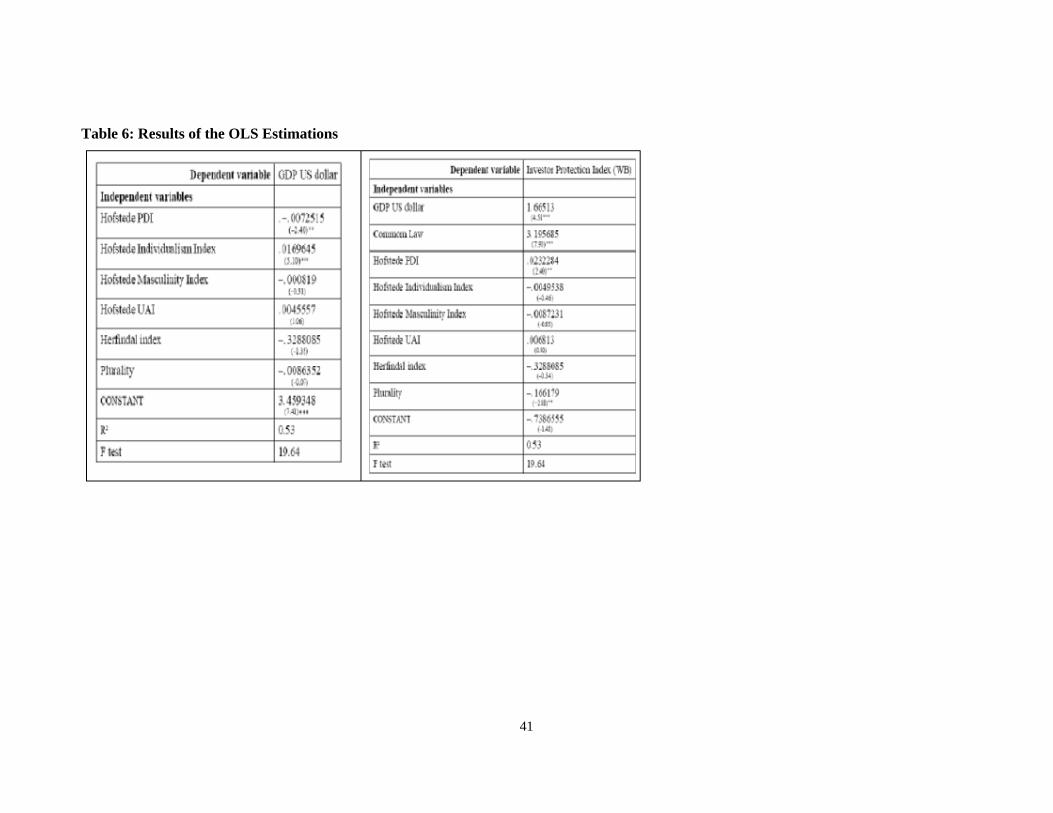
41
Table 6: Results of the OLS Estimations
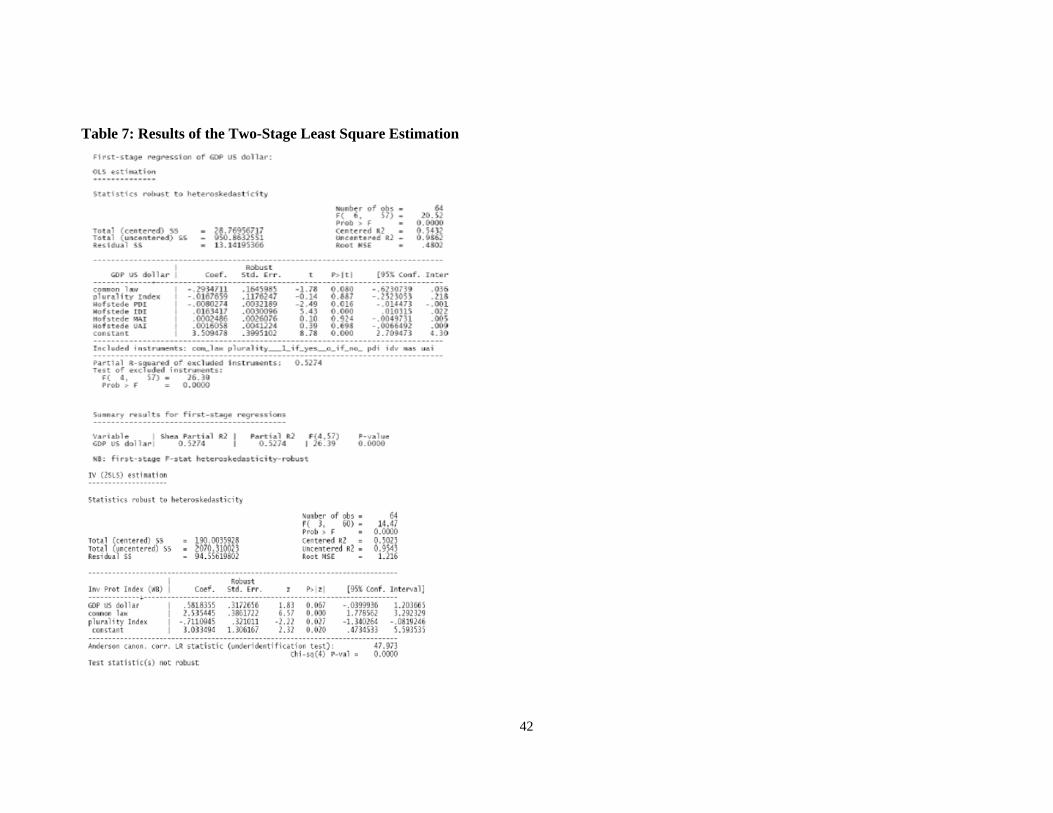
42
Table 7: Results of the Two-Stage Least Square Estimation
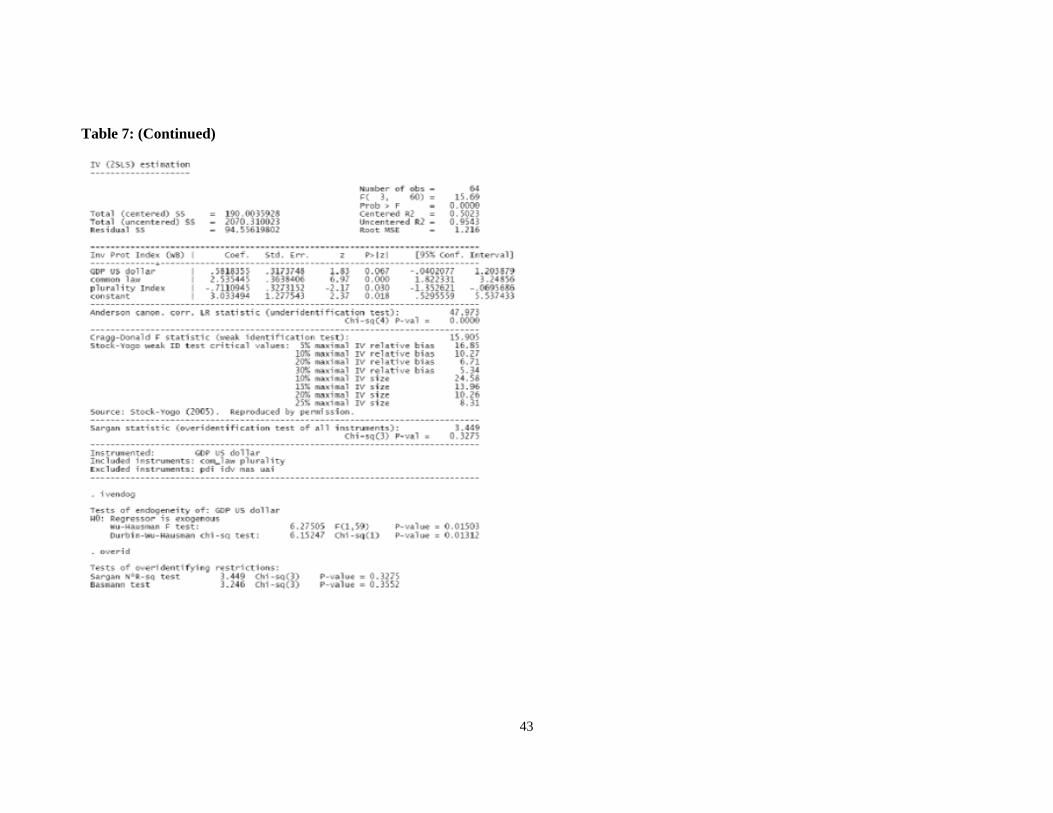
43
Table 7: (Continued)
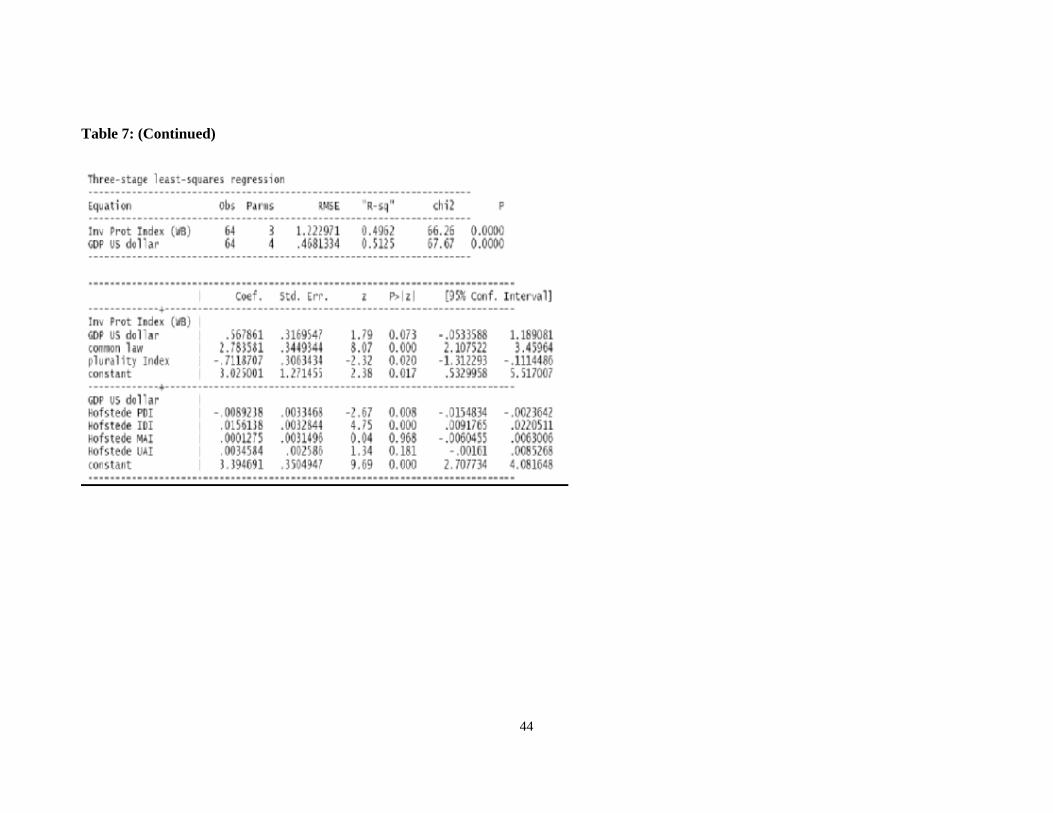
44
Table 7: (Continued)