Embed Size (px)
Citation preview
I \
This paper not to be cited without prior reference to the author
International Council for the
Exploration of the Sea
C.~. 1980/L: 31
Biological OceanographyCommittee
ON THE APPLICATION OF THE LIQUID SCINTILLATION
COUNTING OF 14C-LABELLED PHYTOPLANKTON.
by
Chr~ Ursin and Ann-Mari Bresta
The International Agency for 14c Determination
11 Agern Alle, DK-2970, Horsholm.
iChr. Ursin,present address: Dunish Isotope Centre,
DK-1717.Copenhagen.
Summarz
The paper describes two methods concerning the use of
liquid scintillation technique:in assaying weak beta-
emitters incorporated in phytoplankton material with14
special reference to the C-method in primary produc-
tivity measurements. The problem of ~-absorption and
quench correction is discussed, and a line of procedure
is pointed out. Results from using two commercially
available scintillation cocktails/tissue solubilizers
are presented. Furthermore, thepreparation and cali
b~ation of the NaH14co
3-so1utions for primary produc
tivity measurements is described.
, \
"On the Applicationof the Liquid Scintillation14Counting of C-labelled Phytoplankton".
INTRODUCTION
Measurements of the radioactiyity of labelIed phyto
plankton sampIes as weIl as standardization of the sodium
carbonate solution used ror primary productiyity measure
ments has for many years been carried out by using the
Qeiger-!!üller technique. This method is still used, but
now to a smaller extent The method has the advantage that
it is relatively inexpensive compared to other methods
and that the sampIes after measurements can be stored for
later recounting.
It has, however, many disadvantages. The efficiency
of an ordinary thin endwindow Geiger-Müller detector does
never exceed 10%. The most serious problem when
counting G -M is to compare the sampIes activity with
that of the applied l4C working solution. This is mainly
due to hard controllable differences in the ß-absorption
phenomenon both from sampIe to sampIe and between phyto
plankton and the precipitated working solution.
The reliability of the selfabsorption curve, which
~s necessary for calculation of the absolute activity of
the tracer solution, when using the bariumcarbonate preci-
pitation method, has been much discussed. It was exper
imentally found,that the extrapolation to zero thickness
activi~ie~ of the curve,does not represent the real con
ditions of radiation of labelIed plankton on the filters.
In 1965 Steemann Nielsentherefore developed a new
technique for G-M measurements of the absolute activity
in the lIlC_solution, the "Biological Hethod". The advan
tage of this method is,that the total radioactivity of
the workillg solutionand of the radioactivity of the
filtered planktonmaterial are made in an identical way.
\
- 2 -
Sinee the publieations by Shindler (1966), Wolfe
and Sehelske (1967) and others the use of the liquid
seintillation (LS) teehnique for measuring radio
aetivity of 14C_labelled phytoplankton samples,and of
the 14c solution,has inereased rapidly.
During refined sampie preparation methodology it is
possible with this teehnique to ealibrate the eountings
to a eonstant effieieney f.ex. in absolute units.
This ean be done to almost any kind of 14C_labelled
material.
But neither is this teehnique without pitfalls when
applied to labelied phytoplankton material.
It is a w€ll ,known faet,that the eounting effieieneies
for liquid seintillation sampies varies with the eompo~
sition of the liquid.
There are espeeially two phenomenons bothering the
eounting effieieneies:
1) Bad eontaet between the seintillation fluors and the
week p-partieles from 14C ineorporated in planktonie
algae (or other partieles of a size eomparable to the
p-range) •
2) Impurities from solubilizers, plankton material, fil
ters and alike.
Both phenomenons queneh the available energy, re-'\
dueing both the pulseheights and the total number of
deteetable nuelear events. Counting effieieneies as
measur.ed in a pulseheight ehannel are therefore uneertain,
partieularly when assaying weak-energy radionuelides as:14 '
C.
During sampie preparation,phenomenon no 1 must be
eompletely removed (and eheeked). But no 2 ean be handled
through pro'per quanti tation - and eorree tion.
Besides ~eing a very aeeurate teehnique the liquid
seintillation teehnique ~lUS been developed to handle larger
amounts of sampies ,.,ithout mueh human effort.
So it appears simple and time saving eompared to
the G -M teehnique.
To see if or how the p-absor~tionproblem eati be1 /• -avoided or removed the C Ageney earries out a data-
analysis of old and ne,., data eoneerning phytoplankton
sampies eounted both by theG -}1 - and 'the LS teehnique.
- J -
This is done as many users still want:. to employ the much
cheaper G -M. equipment. In the following the methods14
applied at the C Agency for preparatiort of the working
. solution and for measurements of the radioactivity by the
liquid scintillation techniqueare described.
THE WORKING SOr,UTION
Preparation of the carbon-14 labelIed sodium hydrogen
carbonate.
At our Institute,carbon-14 labelIed bariumcarb
onate (Ba14
coJ
from the Radiochemical Centre, Amersham)
constitutes the basic carbon-14 source. This is mixed'. ( 12 )with inactive barium carbonate Ba CO
Jof high chemical
quality. .
The final concentrationfinishup with 2.2 mmol dm- J ,
except for the 1 ~Ci solution, where the concentration
is 1.8 mmol dm-Je
With these concentrations ampoules are produced in
four standard versions with a total activity of 1, 4, 10,
and 20 ~Ci per cmJ , corresponding to the specific activ
ities 0.56, 1.8, 4.5, and 9.1 mCi per mmol respectively.
Line of procedure.
Preparation of the working solution at the Carbon-14
Agency is mainly carried .out according to Steemann Niel
sen (1952) and is as folIows:14STEP 1 ~le C-labelled DaCO
Jplus the calculated amount
of inactive BaCOJ
is placed inside the testtube (p).
:This tube (p) is placed in a 1 litre suctionflask (S),
in which previously has been added 15 cmJO.~ M sodium
hydroxide (NaOH).
The suctionflask is evacuated and 0.5 M hydrochloric
acid is slowly run into the testtube through the funnel (T).
This rel~ases carbondioxide,which diffuses down to
the sodium hydroxide-solution,~.,ithwhich it reacts,and
is thus abso~bed in the liquid phase.
Allthough experiments have shown that more th~n 99%of _the cO2 f'rom the DaCO
Jis absorbed in the NaOII~solution
within 15 minutes, thc apparatus is left to stand for at
least 60 minutes (usually over night).
- 4 -
Af'ter this period the vacuum is released and the
testtube (now containing BaC1 2 and HCl) is removed.
STEP 2 The content of' the suctionf'lask is diluted by f'reshly
prepared double distilled water, the pli is adjusted to
a value between 9.5 and 10 and made up to a f'inal volume
of' quite 1 litre.
The working solution thus made up is then trans
f'erred into ampoules by means of' an automatic dispenser.
Finally the ampoules are f'lame sealed, autoclaved, and
leakage tested.
Standardization of' the working solution.
STEP 3 During the dispensing operation 4 ampoules out of'
1000 are selected f'or calibration and standardization.
A special procedure of' selection is undertaken to control,
amongst others, that no radioactivity has been lost
during the dispensing and sealing operation•.Serial no.
1, 333, 666 and 1000 is systematically selected.
The content of' the 4 ampoules are transf'erred quan
titatively to 4 measuringf'lasks .(500cm?) and diluted
with 0.05 N sodiumhydroxide. The pli of' these solutions
is kept hi~l - between 11 and 12 - to 'prevent loss of'
radioactive carbondioxide during the preparation of' the
sampIes.
From each of the measuringflasks, aliquots of 1.0 cm3
are transf'erred to 6 LS-glass vials containing 10 cm3 of'
the scintillation cocktail Ready-Solv liP (Beckmann).
3 blanks are also prepared by adding precisely lcm3 of'
tlle inacti~e 0.05 M sodiumhydroxide solution to 3 glass
vials containing 10 cm3 of the same scintillation codc
tail.
All 27 sampIes are kept over night in the dark at
room temp~rature for decay of chemiluminescence. Next
day the 3 blanks are counted in the liquid scintillation
counter.
After having secured that no significant contami .
nation or checiiluminescence is present, a known, caref'ully
weighed amount of' a l4C-n-hexadecane-stan~ard is addedIII
to ~he 3 blanks. The C-standard usedis delivered from
the National-Bureau of' Standards (NnS)~ Wtishington D.C.
The radioactivity of the 27 sampIes are then measured
af'ter normal light and temperature equilibration in the
•
- 5 -
liquid scintillation counter.
Statistics'and certiricntion.
STEP 5 "Each radioactive sampIe is counted 3 times and
3 x 10⁵ c~unts are rccorded rrom ~ach as aminimum.
The uncertainty due to the radioactive decay mechanisms
~~, is about 0.lt~6 at the 95~6 conridence interval. Thus
playing an insigniricant role in the overall uncertainty on
the rinal measure or radioactivity per ampoule.
A computerprogramme gives us:
1. mean values or the cpm Net counting rate ror the 3
repeated measurement s of ea.eh subsampIe ,
2. mean values or cpm ror the 6 subsampIes from each ampoule,
3. mean values or cpm for the internal standard,
4. mean value of cpm for all, the subsampIes from the 4ampoules,
5. the coerricient of variation (CV)"within"and"between"
ampoules,
6. the counting erriciency (by internal standards), and
7. the dpm for the mean value ror all 4 ampoules.
Eaeh time a batch or ampoulcs has been
produced the absolute radioactivity is measured and a
certi:ficate ror the batch is 'vorked out. This shows all
technical batch data and the coerricient or variation
within the batch with respect to disintegration rate rrom
spot test ~amples as described above.
The eertifieate is always delivered togetherwith
_.,ampoules supplied rrom thc Agency.
The accuracy with respect to the disintegration
rate given in the certiricate is expressed as an cstimate
on the overall uncertainty, which we have round is less
than ±2. 5~6
Such a rigure can be achieved in many ways. We have
chosen to calculate this estimate or uncertainty in
accordance with the recommendation oi the International
Commisiion on Radiation Units and Mea~urcments (ICRU
Rep~rt 12). The limits or uncertainty ~ere taken as the
arithmetic sum or the uneertainty due to random variations,
ealculated at the 95.0~ conridence interval, plus, the
estimated systematic uncertainties.
•
•
- 6 -
Occasionally J ampoules out 0.1 a batch are tested for
non-volatile radioactivity after acidification. I.e.
1-2 drops 0.1 concentrated HGI are addedto the recently
opened ampoules and after about 20 minutes tlle content
0.1 the ampoule is counted in the scintillation cocktail
Ready Solv HP.
Hitherto no radioactivity above background level
has been'detected.
This test is particularly important ,,,hen measuring
the production 0.1 dissolved organiccarbon.
FILTERED PHYTOPLANKTON
Filter treatment •
It is assumed that the phytoplankton is on membrane
filterdises, and that they have been·treated with form
aldehyde or another histological fixative.
The filters are placed in a desiccator for 5 minutes
over the fumes from concentrated hydrochloric acid to
remove inorganic carbonate.
Thefilters are then dried in a desiccator containing
both silica-gel and sodalime. The role of the sodalime
is to remove excess hydrochloric acid.
After these treatments the.rims 0.1 the filters are
punched off and the area with the filtered phytoplankton
is placed in the glass sc~ntillation vial. The filter is
then ready for thefinal treatment by either 0.1 the two
follow~ng scintillation cocktails before the counting
procedure.
Determination 0.1 the radioactivity according to Hethod 1.
Soluene-J50!PGS (S!PGS)~
Since 1974 and up to 1978 the routine procedure for
sampie ·preparation and counting system used at the Gar
bon 14 Agency has been as foliows:
If the filter is completely dry, it should be wetted
by adding 0.1 cmJ distilled water.
The phytoplankton and the filter is dissolved-by
adding 1 ~m·J 0.1 the tissuesolubilizer Soluene-J50.
Gomplete dissolution takes 2-4 hours at room temperature.
l{hen using membrane· .1il ters 0.1 celluloseni tra te the
solution becomes yellow-brownish.
- 7 -
To avoid colour-quenching it is necessary to bleach
the sampIe by adding a few drops of 30% hydrogen peroxide.
After storage at room temperature for at least 3 hours
the sampIe is decolourized and 10 cm3 0f the scintillation
cocktail PCS, diluted with distilled wnter to 90%, is
added. After having tightly capped and gently shaken,the
sampIe is· stored in darkness at room temperature for
•
e·
at least 3.day~ for the decay of chemiluminescence.
The radioactivity is then measured in the scintil
lation counter after temperature equilibration.
Determination of radioactivity according to Method 2.
Readv Solv HP (RSHP).14At the C Agency we now run a second method as
daily routine. Both methods are run parallel as two
alternative obtional methods.
This second method involves only one operation
as folIows:
The central part of the filter, punched out and
treated as previously described, is placed in the glass
scintillation vial. 10 cm3 of the scintillation cocktail
RSHP is added, the vial is immediately tightly capped,
shaken and stored in darkne ss for about 24 hours, ,,,here
after radioactivity measurement can take place after temp
erature equilibration in the scintillation counter as
above.
As no significant chemiluminescenoe has ever been
found ~n the sampIes treated by this scintillation cock
tail, and according to test of the sampIe stability from
o sec. to 6 days, it was found that the rridioactivity
could be measured already after storage of about 10
hours. It is,however,recommended to wait 24 hours until
the ~adioactivity is measured to ensure that all the
planktonmaterfal has been completely solu.!ülized. This
is particularly important when .greater amounts of algae
are filtered.
Quench correction.
; To ease international" cooperation in the field of
phytoplankton primary production,our aim is to measure
all rridiriactive samplcs in absolute units. I.e. the
liquid scintillation counter Sl10uld ba calibrated in truc
disintegrations per unit time: dpm.
•
- 8 -
It is a \vell'known fact tha t fil tered phytoplankton
sumples give severe and very varying quench effect,
when counted in the liquid scintillation counter. So a
reliable calibration curve (or function) is a very im
portant tool in order to have the output converted to
true dpm.
Regularly, i.e. once or twice a year, a quench
correctio~ curve is constructed as folIows:
In each of 5 vials is placed a filter with inactive
algae prepared in the'same way as previously described.
Scintillation cocktnil/tissue solubilizer is added and
the sampIes are treated as described before, according
to one of the two methods of radioactivity determination.
:It should be emphasized that each scintillation
cocktail demands i ts own quenclfcorrection function.14
A known, carefully measured amount of the NBS C-
n-hexadecane-standard is pipetted'to all .5 vials, and the
radioactivity of the 5 vials is measured J times each.
About 200 mmJ of carbon tetrachlori'd~ is pipetted to
five evaporating devices, which fit at the top of each
vial, where they are placed.
These devices are the so called "Hat-trick" from
LKB-Instrument (cf.: Reunanen & Soini (1974».All 5 vials are replaced in the scintillation coun
ter and are incessantly recounted each for aperiod of
JO seconds, while the concentration of the quenching'
agent ~n the scintillation fluid increases due to dif
fusion from the "Hat-trick l1 device. The measurements
continue until a suitable quenching level has been
reached.
In this way the entire range of actual counting
efficiencies can be covered,with relatively few calibrated
sampIes'.
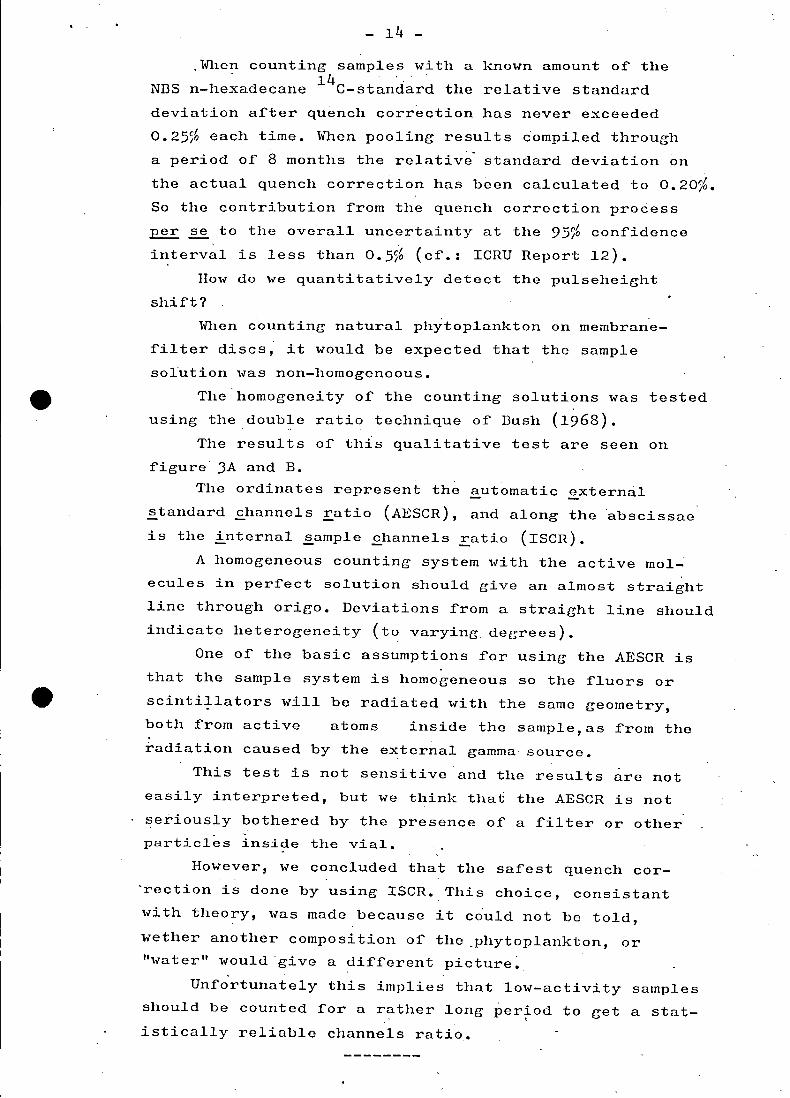
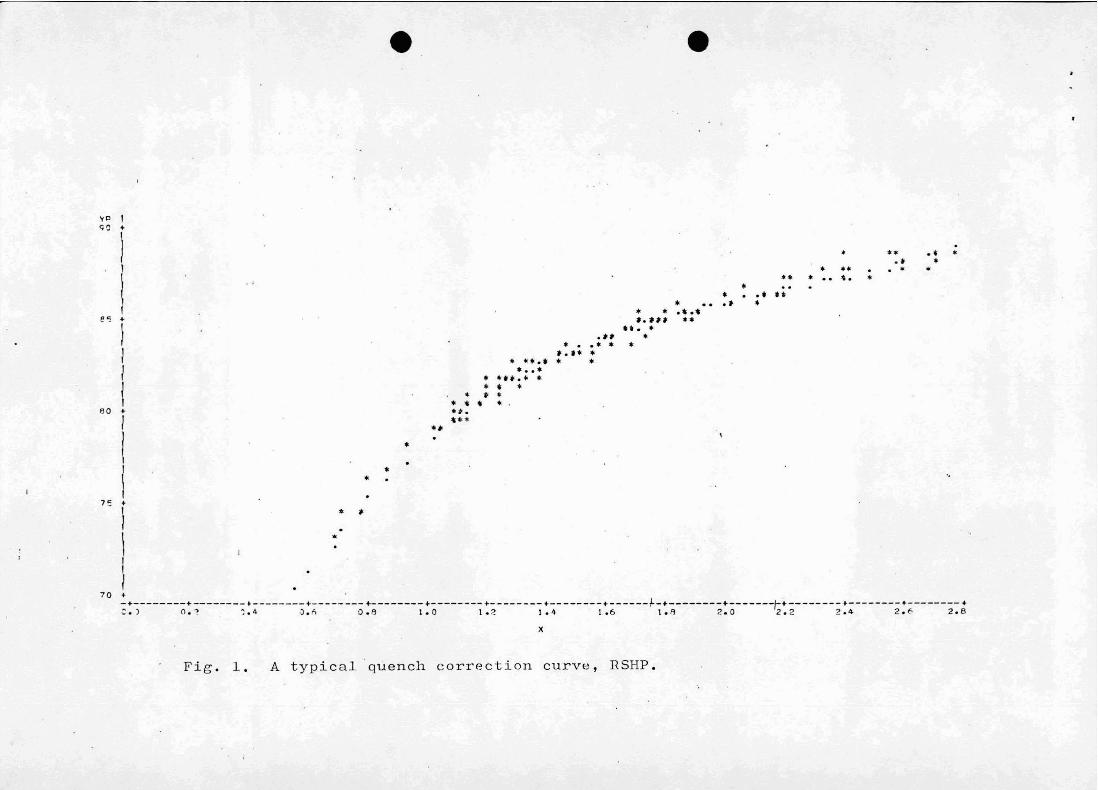
FiGure 1 shows a typical quench correction curve
constructed as just described lvi th inactive plankton
material on nitratefilters in the combined scintillation
cocktail/tissue solubilizer Ready Solv HP~
_ AlonG the ordinate are the calculated counting,
efficiencies and along the abscissa the internal sampIe
channels ratios (Isen).
•
- 9 -
Curve fitting and calculation of parameters.
In many liquid 6cintillation counters with more than
one channel it is feasible to set the gain and discrim
inators in such a way that a quenbhcurve is very close
to a straight line.
This was formerly a very common way of setting the
instrument, in order to get easily hand-processable data.
But the method could be ratller timeconsuming and tedious,
and worse: you very ~eldom hit the optimal setting of the
instrument.
We have chosen to fit the curve to a polynomial of
the third degree, which for this curve,has the following
form:J 2
E = AJX + A2X + AIX + AO'
example l:covering the range from 69~ to 89% counting
efficiencies (E), the parameters to the curve shown in
figure 1 have been calculated to:
E = 2.6lXJ - 17.0X2
+ 40.2X + 52.6
with the upper (UL) and lower (LL) limits at the 95%
confidence interval as follows:
UL. {J.O~}E = . XJ
LL 2.19
+{4J
.4}X +{5
4
•
1
}
J7.0 51.1
The output data from the LKB liquid scintillation
counter is as an option logged on punched papertape and
~re thus very easily processed by means of suitable EDP
programming.
We run the curve fitting on an IBM-J60/J70 computer
using the Gauss-Newton non-linear iterative methode
Calculation of the parameters is also feasible on
small desk-carculators, but the amount of data that can
be processed are often very limited.
The shown quench curve has been constructed from
JJ9 observati~ns based upon 10 independent sampIes •.
Statistical independence of these samples is considered
very important. The data were pooled from two data sets.
IDlen counting unknown samples the calculated·para
meters are fed to a built-in microcomputer in our liquid
scintillation counter.
•
- 10 -
Th~s computer automat~cally corrects the raw cpm ~n
accordance with the polynom~al of third degree and the
calculated parameters. But these calculat~ons can as well
be done on a (programmable) desk calculator.
The da~ly output from count~ngs of l4C_labelled
phytoplankton ~s thus g~ven ~n dpm, wh~ch should be d~rectly
comparable w~th the dpm of the appl~ed work~ng solut~on.
DISCUSSION
14The ~mportance of the bas~c source of C-labelled
carbonate.
There seems to be ev~denc~ that'pr~mary product~on
me~sured by us~ng NaH14coJ
sorut~ons produced by d~fferentinst~tutes may give cons~derable incollsistency ~n comp-
arative experiments, although w~thin each institute the
reproduceability is satisfactory, yhen using baiches
produced in the same way. These'discrepancies should be
due to:
1) Taxie, non-labelled impurit~es orig~nating from metal-,
rubber-, and plasticparts used during processing.
2) The presence of radioisotopes other than 14C , originating
from the industrially prepared l4C_material.14 "
~?lutions of NaH COJ
for measurement of the phytoplank-
ton primary ~~oduction have been prepared using two
methods:
a) By trapping l4C02 gas (released by strang acid fromlJ.
Ba COJ
) in sodium hydroxide solution in an all-glass
device.
b) By direct dilution of the industrially produced NaH14coJ
solution of high specific act~vity. (According to
Strickland and Parsans (1960)).
Measurements of photosynthetic capacities of plank
ton ~lgae hav~ indicated presence of taxie substances
in solutions prepared according to method b). Both Nair
(1974) and Steemann" Nielsen (1977) (the latter p~rtly
quoting Nair and partly referr~ng to own unpublished
results) report that unexpected l~w productivity rates. 14
(abou t 50/b) have been recorded by using NaH COJ
solutions prepared according to method e), compared to
results (from the same wat~rbody) obtained. with solutions
made according to method a). Both authors conclude .the
- 11 -
discrepancies being due to toxic substances in the
bicarbonate solutions prepared according to method b).
Steemann Nielsen (1977) mentions that certain
commercially prepared solutions o~ ~aH14coJ may contain
small amounts of other radioactive material. Williams
et ale (197J) reports that up to 150 dpm/~Ci may be
present in commercial radioactive bicarbonate as nonvol
atile radioactivity remaining in solution after removal
of inorganic ca~bonate by acidification. This could be
of great importance when determining the rate of release
of dissolved organic matter from·phytoplankton.14The. C Agency has always as described before made
1 .k " l' ~ Bal·CO
Jb t . ththe wor lng so utlons ~rom y rapplng e
14 .CO
2-gas using an all-glass device. Furthermore,the
applied sodiumhydroxide and.the hydrochloric acid have•been of the purest analytical.grade.
•
Standardization of the working solution.14
As the C-method is prevailing for measuring
planktonic primary production and as the only added
ingredience is the radioactive working solution we
find it very important that these solutions per se
have the same effect, if~, on the photosynthetic
capacity of the phytoplankton.
When using liquid scintillation counting of ,,,eak
energy beta emitters as Carbon-14 incorporated in algal14
material, it is necessary to make sure that the C-
labell~d p~ytoplankton sampies on membranefilters are
counted with weIl determined efficiency, so that the.
converted measure of radioactivity from each sampie
can be directly compared with the dpm of the working
solution.
As. men.tioned before, the difficul ties, which may
arise, are mainly due to a severe and non-uniform quench
effect and to tlle varying dcigree of homogeneity o~ the
counting solution, plus due to a bad contact between weak
energetic p-particles and scintillation fluors.
Despite of a very reliable ahd accuratequench
correction it is necessary to ensure that the planktori
material has been completely dissolved and that the scin
tillation cocktail/tis~ue solubilizer has the ability to
•
•
,12
do so, no matter the composition of the phytoplankton
populations.
The importance of a complete dissolution of the l4C_
labelIed phytoplankton in the sci-ntillation fluid is best
illustrated when considering that more than 20% of the14 -
C p-particles are emitted with a mean energy of about
10 KeV. This means that maximal range in histological
fixed biological tissue is less than 0.9 ~m. The maximal
range for the most energetic l4C -particles (155 ~m) is
only reached by less than 1% of the emitted particles.
The two scintillation cocktails/solubilizers mentioned
have been thoroughly tested both in a short term batch
experiment and in a long term experiment during the ice
free season of a whole year •
This test (Ursin et ale (1979)) has only been pub
lished in: "C14C Internal Report No. la/79",' available
on request free of charge.-
It was shown that both methods were capable of14 -
counting C-labelled natural phytoplankton. Tlle "short
ter~ esperiment" did not reveal any significant differ
ences between the two methods. The results are seen in
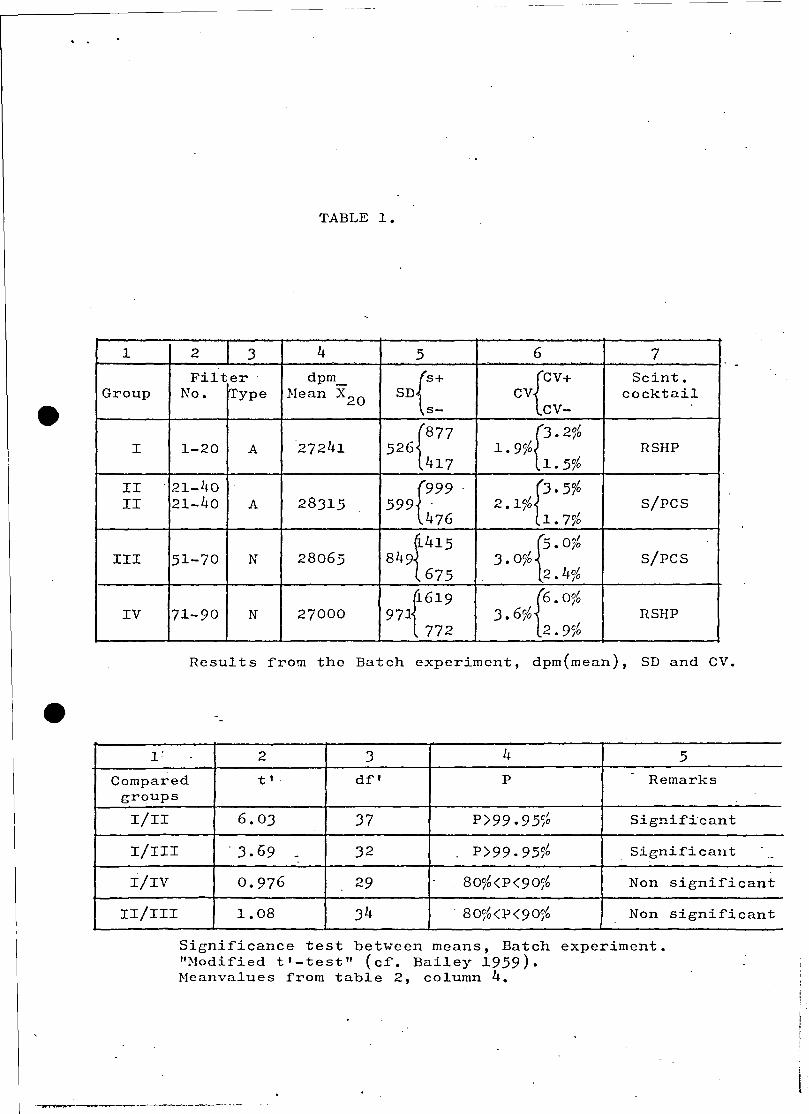
table 1.
Nethod 1 (S/PCS) seems to give higher mean values
but this is not statistically significant at the 95%
confidence interval.
The "long term experiment" on the contrary showed
that the above mentioned iendency in fact was significant
wllen compiling paired results from the most of a growth
·season.
The results are seen in table 2, J, and on Sigure 2.
Differences in mean values are observed, method 1
(S/PCS) giving the llighest values, and it is obvious
that the 1.4C-n-hexadecane-standard is counted with a
difrerent efr~CienCY than the~4C-labelled phytoplank-
ton. This indicate~ that the solubilizing capacity of
RSHP is insufficient for SOI?e -types or natural phyto
plankton. Thus ror investigations requiring a high level
or accuracy, S/PCS or dry combust~on should be preferred.
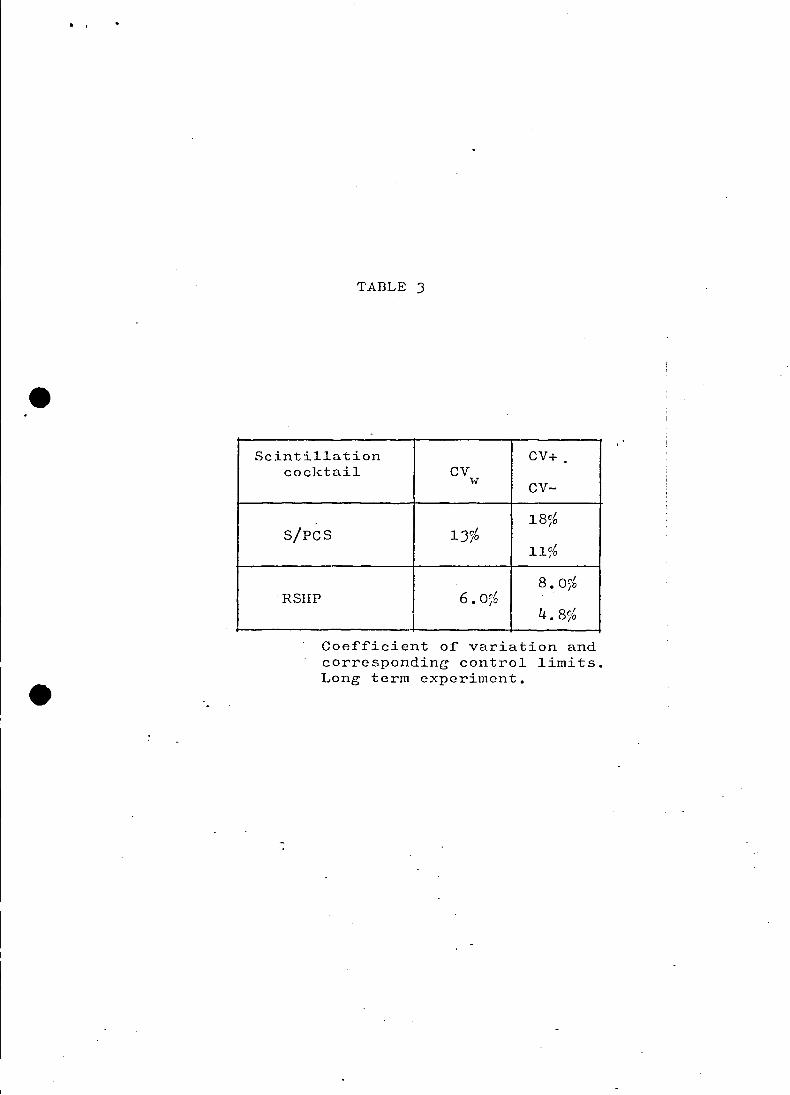
However, the extremelygood reproduceability (table 1 and J).obtained with RSHP makes method 2 superior, when the aim
or the study is compnrability, and wherea~ systematic
error or about 6~ could be tolerated.
zero
•
•
- 13 -
Desides,method 2 is very quick and does not demand
much skill for getting a good'reproduceability, ~hich is
a very important quality. The investigation emphasizes
the importance of using natural populations and especially
compilation of results through a whole year, when testing
such procedures. Otherwise the, observed lack of accuracy
would not have been revealed.
Our investigation of the two scintillation cocktails/
tissue solubilizers does not guarantee that e.g. oceanic
phytoplankton w'ould have given similar results.
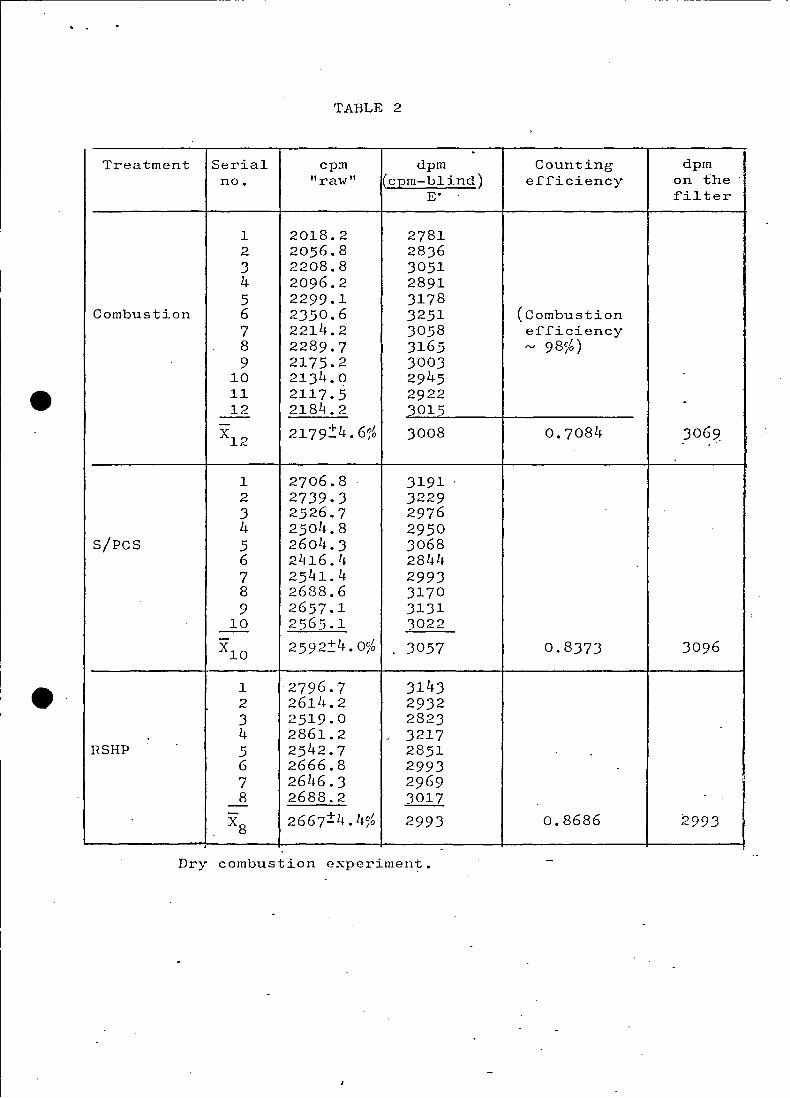
The combustion method in an induction furnace (Leco
Incorp.) was a modificd version of Durniso & Perez (1974).Tllis combustion method is considered as the most
reliable reference methode
Unfortunately it is rather timeconsuming and not
suited for handling large amounts, of sampIes.
Curve fitting, precision and accuracy.
How accurate can a quench' correction bo done using
the described procedure?
IDlen calculating thci parameters for thc third degree
polynomial model we check the differences between the ob
served values and the computed values according to the
'applied parameters in the model.
These differences,w6ich are called the residual
values,are tested for their mean value and normality.
The mean value is most frequently very close to
(~ypical < 10-8
).
This is of course not surprising as the Gauss
Newton's iterative non-linear regression method uses
. this cri terion '''hen calculating the parameters.
The relative standard deviation on the residual
values .sho~ld be as small as possible •.If the relative
standard devi~tion exceeds l~,- we confi~e the efficiency
range thus,calculating a new set of parameters including
only a limited part of the observations closer to the
area, where tlle unknown phytopl~nkton sampIes are ex
pected to "fall".
In this way it should be possible to use only para
meters for ,,,hich the relative standard deviation on the
variable R (R = residu~l.value) is below l~ (and the
relative standard error of the mean is below O.lj~).
•
•
- 14
.When eounting sampIes with a known amount of the. 14' " '
NDS n-hexadecane C-standard the relative standard
deviation after quench correction has never exceeded
0.255'0 each time. When pooling resul t s c'ompiled through
aperiod of 8 months the relativi standard deviation on
the actual quench correction has been calculated to 0.20%.
So the contribution from the quench correction proeess
per ~ to the overall uncertainty at the 951'0 confidenee
interval is less than 0.5% (cf.: ICRU Report 12).
HOlv do we quantitatively deteet the pulseheight
shift?
When eounting natural phytoplankton on membrane
filter dises; it would be expected that the sampIe
sol'ution was non-homogeneous.
The'homogeneity of the counting solutions was tested
using the doub~e ratio technique of Bush (1968).
The results of th{s qualitative test are seen on
figure' JA and B.
The ordinates represent the automatie ~xternal
~tandard ~hannels E,atio (AESCR), and along theabseissae
is the internal ~ample ehannels E,atio (ISCR).
A homogeneous counting system with the active mol
eeules in perfeet solution should give an almost straight
line through origo. Deviations from a straight line should
indieate heterogeneity (to varying degrees).
One of the basic assumptions for using the AESCR is
that the sampIe system is homogeneous so the fluors or
scintillators will be radiated with the same geometry,
both from aetive atoms inside the sample,as from the
~adiation caused by the external gamma source.
This test is not sensitive and the results are not
easily interpreted, but we think that the AESCR is not
~eriously bothered by the presence of a filter or other
particles inside the vial.
However, we concluded that the safest quench cor
"reetion is done by using ISCR. Tllis ehoiee, consistant
with theory, was made because it c6uld not be told,
wether another composition of the_phytoplankton, or
"water" would'give a different picture~
Unfortunately this implies thatlow-activity sarnples
should be counted for a rather long period to get a stat-•
istically reliable channels ratio.
•
•
..- 15 -
REFERENCES
Bai1ey, N. T. J. (1976). "Statistica1 Methods in Bio1ogy"·.Hodder and Stoughton, London.
Burnison, B.K. and Perez, K.T. 14974). "A simple Methodfor the Dry Combustion of C-labelled Materials".Ecology, 12: 899-902.
Bush, E.T. (1968). "A double Ratio Technique as an Aidto Selection of SampIe Preparation Procedures inLiquid Scintillation Counting". Int.Journ. ofApplied Radiation and Isotopes, .!..2.: 447-452.
ICRU Report 12. "Certification of Standardized Radioactive Sourees". International Commission onRadiation Units and Measurements.
Reunanen, M.A. and Soini, E.J. (1974). "New method forobtaining the quench correction curve in liquidscintillation counting". Liquid Scintil1ationCounting ..1.
,Steemann NielsIU' E. (1952). "The Use of Radio-acti~eCarbon (C ) for Measuring Organic Production inthe Sea". J.Cons.Explor.Mer., 18:117-140.
Steemann Nielsen, E. 14965). "On the Determination ofthe Activity in C-Ampoules for Measuring PrimaryProduction". Limnol. and Oceanogr. 10 (Suppl.):R247-R252.
Steemann Nielsen, E. (1977). "The Carbon 14 Techniquefor Measuring Organic Production by PlanktonAlgae. AReport on the Present Knowledge". FoliaLimnol.Scandinavica, 17:45.
Ursin, Chr. et ale (1979). "Test of the Scintillationracktail "READY-SOLV HP" (Beckman) for Counting
C-Labelled Phytoplankton on Membrane Filters".c14c Internal Report No. la/79 •.
Williams, ·P. J .1eB., et ale (1973). "Potential sourcesof error~in the measurement of low rates ofplanktonic photosynthesis and excretion". NatureNew BioI., 236:91. -
,...-----------------
TABLE 1.
•1 2 3 4 5 6 7
Filter dpm_ t Cv+
Scint.Group No. rrype Hean X20 sn CV cocktail
s- CV-
{S77 f"2%I 1-20 A 27241 526 1.95& RSHP417 1.5%
II '21-40 r 9 f'5%II 21-40 A 28315 599 . 2.1% S/PCS476 1.75&
t15 foO%III 51-70 N 28065 849 3.05& S/PCS675 2.45&
t 19 rO%IV 71-90 N 27000 971 3.6% RSHP
772 2.95'0
Results from the Batch experiment, dpm(mean), sn and CV .
•1: 2 3 4
Compared t l . dfl Pgroups
I/II 6.03 37 P)99.955b
I/III - 3.69 32 P)99.955'o
i/IV 0.976 29 805&<P<905&
II/III 1.08 34 . 805&<P<905'o
5
Remarks
Significant
Significant
Non significant
Non significant
Significance test between means, Batch experiment."Nodified tl-test" (cf. Bailey i959).Neanvalues from table 2, column 4 •
.~-------_.------
. .
TABLE 2
--- - --------
•
e·
..1Treatment Seria1 cp:n dpm Counting dpm
no. "raw" (cprn-b1 ind) efficiency on theE· filter
1 2018.2 27812 2056.8 28363 2208.8 30514 2096.2 28915 2299.1 3178
Combustion 6 2350.6 3251 (Combustion7 2214.2 3058 efficiency8 2289.7 3165 ~ 987b)9 2175.2 3003
10 2134.0 294511 2117.5 2922
2184.2 3015.
12---2179:!:4. 6~b 0.7084 .3 06 9.X12 3008
1 2706.8 3191 .2 2739.3 32293 2526.7 29764 2504.8 2950
S/PCS 5 2604.3 30686 2416.4 28447 2541.4 29938 2688.6 31709 2657.1 3131
10 2565.1 3022---2592~1~. O~b 0.8373 3096X10 3057
1 2796.7 31432 2614.2 29323 2519.0 28234 2861.2 . 3217
RSHP 5 2542.7 2851 .6 2666.8 29937 261~6. 3 2969 ..
8 2688.2 3017-- 2667±4. 4~b 0.8686 2993X8 2993.
Dry cornbustion experirnen~.
· .
TADLE J
Scintillation CV+cocktail CV
wCV-
l8~b
S/PCS 13%11~0
8.056RSHP 6.056
4.856
Coefficient of variation andcorresponding control limits.Lang term experiment.
.t ..•••.... ....• ••. ".••
• ••••..•..
•••.-...••
•
• ••••••.....•••••• ••..• •••••.... ·*.t....
••••• •.. .•..
..•. ..
• '* '*."'......"•
••
. "..
• I
ec: +
IIII
80 +
I
lI
7" +
I\II
70 +-+--------+--------+--------+--------+--------+--------+--------+--------+------~-+--------+-------t+--------+--------+--------+.:.) O.'? '::.4 .).1'> 0.8 1.0 I.~ 1.4 I.b 1.8 2.0 2.2 2.4 2.<!' 2.8
~" ,<;0 +
)1
x
Fig. 1. A typical quench correction curve, RSHP.
W Jl___ , - -l- - - -.-1- - - - -,--,-
d%
"oe
oe
...
"11
"11
"1< 1<
Jl oe,. 1<
-1- -x- - _.- -11- _.- - - --,-"25 30 " 35 1,0
"
...
45
"11 "
"
11
5C
"
55
•oe
Jl 1(
60 w &2
1(
NO.
Fig.2. The relative difference between paired observations (versus serial number),Lang term experiment.
(dob - (fIrm sjpcs - dpm nSHP) x 100)I - tx(dpm S/PCS + dpm nSHP)
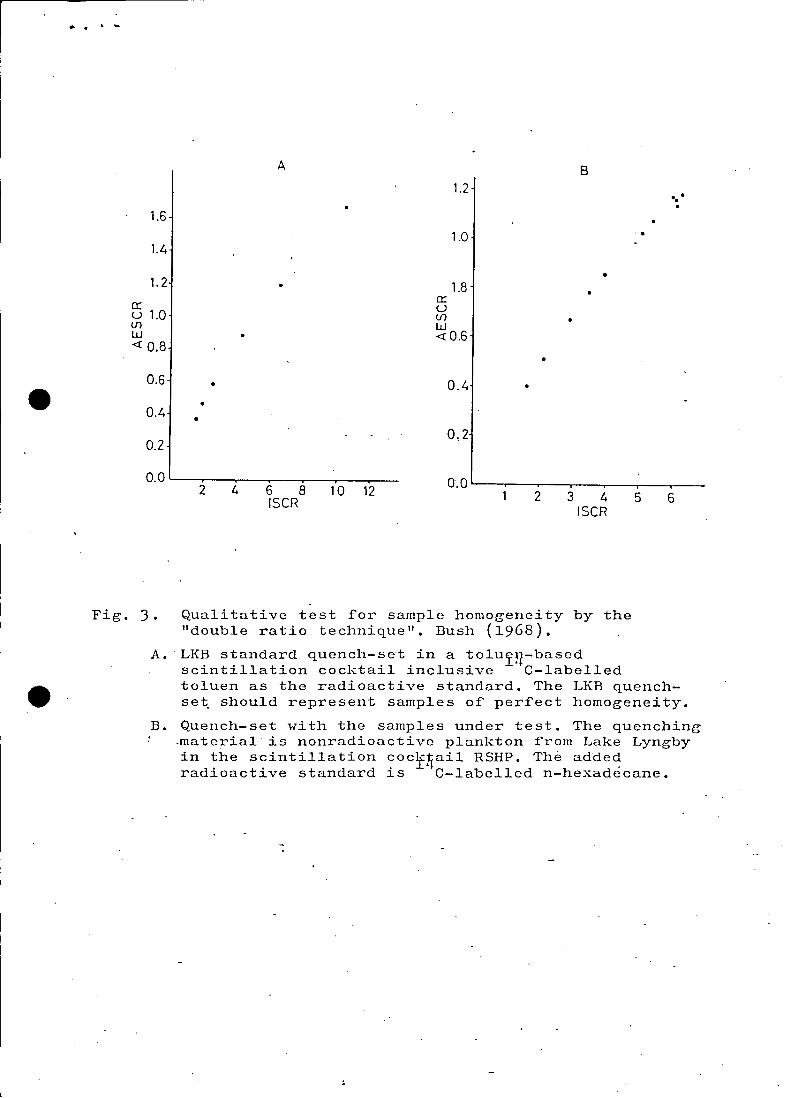
Fig. 3.
.. . .. .....
A B1.2 ..•.
1.6
1.01.4
•1.2 1.80::
a:uu 1.0 tfl
tfl WW <t: 0.6<t: 0.8
0.6 • 0.4 ••0.4 •
0.20,2
0.0 0.02 4 6 8 10 12 2 3 4 5 6ISCRISCR
Qualitative test i'or samp1e homogeneity by the"double ratio technique". Bush (1968).
A. LKB standard quench-set in a to1uru-basedscinti1lation cocktail inclusive C-labelledtoluen as the radioactive standard. The LKB quenchse~ shou1d represent samp1es oi' peri'ect homogeneity.
B. Quench-set with the samples under test. The quenching.material'is nonradioactive plankton from Lake Lyngbyin the scintillation coc~ijail RSHP. Th~ adde~
radioactive standard is C-1abe11ed n-hexadecane.