Embed Size (px)
Citation preview

Bank of Canada Banque du Canada
Working Paper 2004-17 / Document de travail 2004-17
International Cross-Listing andthe Bonding Hypothesis
by
Michael R. King and Dan Segal

ISSN 1192-5434
Printed in Canada on recycled paper

Bank of Canada Working Paper 2004-17
May 2004
International Cross-Listing andthe Bonding Hypothesis
by
Michael R. King 1 and Dan Segal 2
1Financial Markets DepartmentBank of Canada
Ottawa, Ontario, Canada K1A [email protected]
2Joseph L. Rotman School of ManagementUniversity of Toronto
Toronto, Ontario, Canada M5S [email protected]
The views expressed in this paper are those of the authors.No responsibility for them should be attributed to the Bank of Canada.


iii
Contents
Acknowledgements. . . . . . . . . . . . . . . . . . . . . . . . . . . . . . . . . . . . . . . . . . . . . . . . . . . . . . . . . . . . ivAbstract/Résumé. . . . . . . . . . . . . . . . . . . . . . . . . . . . . . . . . . . . . . . . . . . . . . . . . . . . . . . . . . . . . . . v
1. Introduction . . . . . . . . . . . . . . . . . . . . . . . . . . . . . . . . . . . . . . . . . . . . . . . . . . . . . . . . . . . . . . 1
2. Impact of Cross-Listing . . . . . . . . . . . . . . . . . . . . . . . . . . . . . . . . . . . . . . . . . . . . . . . . . . . . . 4
3. The Bonding Hypothesis . . . . . . . . . . . . . . . . . . . . . . . . . . . . . . . . . . . . . . . . . . . . . . . . . . . . 6
4. Hypothesis Development . . . . . . . . . . . . . . . . . . . . . . . . . . . . . . . . . . . . . . . . . . . . . . . . . . . 8
5. Data and Methodology. . . . . . . . . . . . . . . . . . . . . . . . . . . . . . . . . . . . . . . . . . . . . . . . . . . . .12
6. Empirical Results . . . . . . . . . . . . . . . . . . . . . . . . . . . . . . . . . . . . . . . . . . . . . . . . . . . . . . . . . 19
7. Conclusion . . . . . . . . . . . . . . . . . . . . . . . . . . . . . . . . . . . . . . . . . . . . . . . . . . . . . . . . . . . . . . 23
Bibliography . . . . . . . . . . . . . . . . . . . . . . . . . . . . . . . . . . . . . . . . . . . . . . . . . . . . . . . . . . . . . . . . . 25
Tables . . . . . . . . . . . . . . . . . . . . . . . . . . . . . . . . . . . . . . . . . . . . . . . . . . . . . . . . . . . . . . . . . . . . . . 29
Appendix A: Variable Definitions . . . . . . . . . . . . . . . . . . . . . . . . . . . . . . . . . . . . . . . . . . . . . . . . 40

iv
Acknowledgements
We wish to thank Greg Bauer, Laurence Booth, Craig Doidge, Steve Foerster, Paul Halpern, Cally
Jordan, Andrew Karolyi, Ole Kristian-Hope, Vikas Mehotra, Usha Mittoo, Randall Morck, Eric
Santor, Larry Schembri, Tim Simin, Chris Spille of NASDAQ, three anonymous referees, seminar
participants at the 2003 Canadian Economics Association, 2003 Northern Finance Association,
2004 New York Stock Exchange conference on “The Future of Global Equity Trading,”
University of Toronto, University of Alberta, Toronto Stock Exchange, Ontario Securities
Commission, CIRANO, and the Bank of Canada for their suggestions and comments. Data for
this project were made available by the NYSE and NASDAQ.

v
e
ry to
meet
are
U.S.
. The
rket
elle-ci
’ont
re à une
e
en
hé
eurs
arché
Abstract
The authors describe a new view of cross-listing that links the impact on firm valuation to th
firm’s ability to develop an active secondary market for its shares in the U.S. markets. Contra
previous research, cross-listing may not provide benefits for all firms, even when those firms
the highest regulatory requirements for disclosure and supervision. When cross-listed firms
divided into two groups on the basis of their share turnover in the home market relative to the
market, the firms that develop active trading in the U.S. market experience an increase in
valuation. Cross-listed firms that remain predominantly traded in the home market following
cross-listing are valued similarly to non-cross-listed firms. To gain the full benefits of cross-
listing, a foreign firm must convince investors that their shareholder rights will be protected
effectiveness of this reputational bonding is witnessed in the ratio of trading on the U.S. ma
relative to the home market.
JEL classification: G12, G15Bank classification: Financial markets; International topics
Résumé
Abordant la question sous un angle nouveau, les auteurs émettent l’idée que l’incidence de
l’intercotation sur la valeur des actions d’une entreprise pourrait être liée à la capacité de c
d’accroître le volume des transactions sur ses titres aux États-Unis. Contrairement à ce qu
conclu les chercheurs précédents, les sociétés ne gagneraient pas toutes à inscrire leur tit
bourse étrangère, même lorsqu’elles satisfont aux obligations d’information et aux règles d
surveillance les plus rigoureuses. Si l’on divise les entreprises intercotées en deux groupes
fonction de leurs volumes relatifs de transactions sur les marchés national et américain, on
constate que celles dont le titre est activement échangé aux États-Unis sont évaluées plus
favorablement. Les sociétés dont les actions continuent de se négocier surtout sur le marc
d’origine après leur admission à la cote d’une bourse américaine ne sont pas évaluées
différemment de celles qui sont cotées uniquement dans leur pays d’attache. Pour tirer le
maximum d’avantages de l’intercotation, l’entreprise étrangère doit convaincre les investiss
qu’elle respectera leurs droits d’actionnaires. Le volume des transactions effectuées sur le m
américain plutôt que national indique à quel point elle y est parvenue.
Classification JEL : G12, G15Classification de la Banque : Marchés financiers; Questions internationales

1
1. Introduction
We examine the impact of cross-listing on the valuation of Canadian firms that list on both a
Canadian and a U.S. stock exchange. Whereas earlier work on cross-listing focuses on the
benefits that result from the access to foreign investors and the subsequent increased liquidity and
lower cost of capital, recent work argues that a principal motivation for cross-listing is investor
protection. Coffee (1999, 2002) and Stulz (1999) were the first to suggest that a foreign firm from
a jurisdiction that features potentially weaker investor protection can increase its valuation by
bonding itself to the U.S. securities regime through cross-listing. The bonding hypothesis suggests
that firms from countries with poor protection of minority shareholders signal their desire to respect
the rights of shareholders by listing in a jurisdiction with higher scrutiny, tougher regulation, and
better enforcement. Better investor protection is seen as one of the factors that explain the
increase in stock returns following cross-listing, because U.S. and home-country investors are
more willing to invest in a foreign firm that has tied its hands in this way. Reese and Weisbach
(2002), Doidge, Karolyi, and Stulz (2004), and Doidge (2004) obtain empirical results that support
the bonding hypothesis. Although the bonding hypothesis applies most directly to firms from
emerging markets, we examine whether bonding has an impact on the valuation of Canadian
firms.
The bonding hypothesis may apply to Canadian firms for three reasons. First, previous research
suggests that the level of investor protection in the United States is qualitatively higher than in
Canada, either because of stricter supervision by the Securities and Exchange Commission (SEC)
or the greater scrutiny by reputational intermediaries as suggested by Coffee (2002). Of the
13 cases of legal actions brought by the SEC against foreign firms between 1995 and 2002, 4
were brought against Canadian firms, whereas 36 civil cases were brought by U.S. plaintiffs
against Canadian firms and their insiders from 1990 to 2002 — over 40 per cent of all the cases
documented by Siegel (2004). Second, a number of studies find evidence of information leakage
ahead of takeover announcements in Canada, witnessed by price run-ups or abnormal volume in
the target firm’s shares prior to the event (Jabbour, Jalilvand, and Switzer 2000; Eckbo and
Thorburn 2000; Bris 2003). This pattern suggests that certain investors systematically have
access to information before it is made public and are able to trade on it. This information
asymmetry may lead minority shareholders to perceive that their shareholder rights are not well
protected. Third, research on concentrated ownership argues that the valuation of firms with
controlling shareholders is lower relative to widely held firms, because minority shareholders may
be less well protected (La Porta et al. 2000, 2002; Morck 2000). Unlike the United States, where

2
widely dispersed ownership is the norm, Canada has more concentrated corporate ownership with
more large firms controlled by wealthy families, more frequent use of pyramidal ownership
structures, and more prevalent use of multiple classes of voting shares (Attig, Gadhoum, and Lang
2002; Morck, Stangeland, and Yeung 2000). In this environment, theory predicts that minority
shareholders will be at a disadvantage. For these reasons, bonding may have an impact on the
valuation of cross-listed Canadian firms over and above the documented effects related to higher
returns, greater investor recognition, and a lower cost of equity. We examine this hypothesis.
A comparison of Canadian and U.S. firms provides a unique experiment of this bonding
hypothesis. Canadian firms make up the single largest group of foreign firms listed on U.S. stock
exchanges, with more than 180 Canadian firms cross-listed in 2003. In addition, most studies of
cross-listing focus on foreign firms that issue American Depositary Receipts (ADRs), with an
emphasis on those ADRs subject to the highest regulatory requirements. Canadian firms,
however, are required to cross-list using an ordinary share that is no different from the shares
issued by U.S. firms.1 These Canadian firms must meet all the same filing and disclosure
requirements as a U.S. firm, and are subject to supervision, and enforcement by the SEC. The
U.S.-listed shares of Canadian firms are denominated in U.S. dollars, and are fully fungible with
the home shares listed on the Toronto Stock Exchange (TSX), denominated in Canadian dollars.
These two shares trade seamlessly across markets, with prices adjusting to eliminate arbitrage
opportunities that result from movements in exchange rates (Gagnon and Karolyi 2003).
Moreover, Eun and Sabherwal (2003) show that price discovery for these cross-listed shares
occur in both markets. Given these facts, the shares of Canadian firms should be expected to be
close substitutes in the portfolios of U.S. investors.
This paper makes three important contributions to the cross-listing literature. First, most studies of
cross-listing look only at cross-listed firms.2 We examine both cross-listed and non-cross-listed
firms to mitigate selection bias in the definition of the sample. Two groups of non-cross-listed firms
are considered: Canadian firms that are listed exclusively in Canada, and U.S. firms. The non-
cross-listed Canadian firms provide a partial counterfactual case, because they include many large
firms that could potentially be cross-listed but are not. The cross-listed firms, therefore, can be
viewed as a treatment group, and the non-cross-listed Canadian firms the control group. The U.S.
1 The exceptions are Canadian shares that are unregistered and trade over the counter on the National Quotation Bureau’s “pink sheets.” Reese and Weisbach (2002) report 284 such issues between 1985 and 1999. 2 Reese and Weisbach (2002) and Doidge, Karolyi, and Stulz (2004) are notable exceptions.

3
sample acts as a benchmark for comparing both groups of Canadian firms. Second, most studies
of cross-listing adopt an event-study approach to examine the impact on stock returns, employing
short windows of up to twelve months before and after the date of cross-listing.3 We examine the
longer-term impact on valuation, using twelve years of data from 1990 to 2001 to capture steady-
state relationships. Third, we examine relative valuation rather than absolute returns, similar to
Sundaram and Logue (1996). By comparing firms using multiples of book value and earnings, we
provide a standardized metric that controls for differences in exchange rates and discount rates.
By using a different dependent variable than other studies, we provide a robustness check for
other research on the impact of cross-listing.
We describe two main findings. First, cross-listing has a positive impact on valuation over and
above the positive impacts associated with firm size, profitability, cost of equity, and past sales
growth. This result is consistent with the findings in the cross-listing literature, although the time
horizon in this study is much longer than before. This positive impact is most evident when
comparing the cross-listed and non-cross-listed Canadian firms. The cross-listed firms that are
subject to stricter SEC supervision and greater scrutiny by U.S. investors are valued more highly
than Canadian firms that are listed exclusively on the TSX. This finding is consistent with the
predictions of the bonding hypothesis. Second, the location of share trading is linked to valuation.
Cross-listed firms that are traded actively in the U.S. market experience a significant increase of
valuation over the long term. Cross-listed Canadian firms that fail to develop active share turnover
in the United States and remain traded predominantly in Canada are valued no differently from
non-cross-listed Canadian firms. Greater share turnover on the U.S. stock markets may be viewed
as a proxy for reputational bonding, consistent with Siegel (2004). U.S. investors may differentiate
between those Canadian firms that respect the rights of U.S. investors and those that do not.
Trading is then concentrated in the former, with investors making subsequent judgments on the
firm’s attractiveness as a second step in the investment process. Effective bonding may therefore
be a pre-condition for generating greater share turnover following cross-listing. This hypothesis
needs to be explored further in research that examines the characteristics of Canadian firms that
are predominantly traded in the United States. Important characteristics to consider are firm
ownership structure, the geographic location of a firm’s sales, and a firm’s history of capital raising
in the United States.
3 Mittoo (2003) looks at returns for up to three years following the date of cross-listing.

4
This paper is organized as follows. Section 2 reviews key findings from the cross-listing literature
and motivates the choice of explanatory variables used in the analysis that follows. These
variables will be used to control for the known impact of cross-listing on a firm’s valuation in order
to identify the impact of bonding. Section 3 outlines the bonding hypothesis and explains why the
level of investor protection in Canada may be perceived to be lower than in the United States.
Section 4 develops the hypotheses that are examined in this paper. Section 5 describes the data
and the methodology for testing these hypotheses. Section 6 presents empirical results. Section 7
concludes.
2. Impact of Cross-Listing
By the mid-1990s, foreign firms from more than 40 countries had shares cross-listed on U.S.
exchanges (Karolyi 1998). The majority of those shares trade in the form of ADRs, with the focus
of most research on Level II and Level III ADRs that have the highest disclosure and filing
requirements.4 As an alternative to an ADR, foreign firms from a subset of countries such as
Canada, Israel, Hong Kong, and the Netherlands have the choice of listing on a U.S. exchange as
an ordinary share. While Canadian firms are not required to list as an ordinary share, almost all
Canadian firms prefer this format.5 When listing as an ordinary share, Canadian firms meet all the
same requirements as U.S. firms: they file annual financial statements that present results
according to U.S. generally accepted accounting principles (GAAP), meet continuous disclosure
requirements, and satisfy other regulatory requirements imposed by the SEC. Similar to the case
with U.S. firms, U.S investors have the right to sue these Canadian firms under provisions such as
Rule 10b-5 (Coffee 1999). These regulatory requirements, the associated costs, and the risk of a
lawsuit may be a significant deterrent to cross-listing (Reese and Weisbach 2002).
Although Canadian firms that cross-list in the United States are required to list as ordinary shares,
this process has been facilitated since 1991 by the Multi Jurisdictional Disclosure System (MJDS).
Under the MJDS, a Canadian issuer with a public float of US$75 million (excluding control stakes
of 10 per cent or more), a one-year history as a reporting issuer in Canada, and a record of
compliance with Canadian reporting requirements is permitted to file its Canadian prospectus to
4 ADRs have different levels of disclosure required for different ADR classes. Foreign firms that pursue a Level II ADR where no capital is raised, or a Level III ADR where new capital is raised, must file annual financial statements on Form 20-F, and a registration statement on Form F-6, as well as reconcile their accounts either partially or fully to meet U.S. GAAP (Coffee 1999; Karolyi 1998; Miller 1999). 5 While no Canadian firms currently have ADRs, a few cases have occurred in the past. We wish to thank Cally Jordan for clarifying this point.

5
satisfy SEC registration requirements, accompanied by the relevant “wrap-around” form,
depending on the type of security issued. Public offerings of equity securities for cash are
accompanied by Form F-10, which includes financial statements that are reconciled to U.S. GAAP
in accordance with Form 20-F. Continuous reporting requirements under the Exchange Act can be
met by filing home jurisdiction documents with the SEC. If these requirements are met, MJDS
offerings are given “no-review” status by the SEC and the offering is subject to review by only the
Canadian regulatory authorities. Not surprisingly, the MJDS has encouraged many Canadian firms
to cross-list; the number of Canadian firms cross-listing on U.S. stock exchanges in the 1990s has
increased, despite the greater integration of these two markets (Mittoo 2003). As a result, Canada
has the highest number of cross-listed firms in the United States of any foreign country when
considering ordinary listings, and Level II and Level III ADRs (Reese and Weisbach 2002).6
Studies of cross-listing have documented a number of benefits from this activity that stem from two
main effects: the reduction in a firm’s idiosyncratic risk as it overcomes market segmentation and
becomes part of the global portfolio, and the increase in liquidity due to the improved information
environment following cross-listing (Foerster and Karolyi 1999; Karolyi 1998). These effects are
difficult to disentangle.
The first effect explains the increased returns following cross-listing. International capital markets
remain segmented to a greater or lesser degree despite globalization, leading stocks to be priced
as part of the domestic portfolio. When firms cross-list, their correlation — or beta — with the
home market declines as their beta with the global market increases, leading to a reduction in the
riskiness of the firm’s shares when held in a diversified portfolio (Errunza and Losq 1985; Errunza
and Miller 2000; Foerster and Karolyi 1999; Karolyi 1998; Karolyi and Stulz 2002; Miller 1999;
Stulz 1995, 1999). This reduction in idiosyncratic risk leads to a lower cost of equity and higher
returns. Cross-listed firms generally exhibit abnormal returns in the run-up to cross-listing and
shortly after the event, but decline in the year following cross-listing as the built-in risk premium
that compensated for market segmentation dissipates (Foerster and Karolyi 1999; Miller 1999).
Mittoo (2003) presents a cautionary note. She finds that the positive price and liquidity effects
have declined over time, and that cross-listed Canadian firms in her sample underperform over the
three years following cross-listing.
6 This result is not surprising, given the geographic proximity, trade links, and cultural similarities between the two countries. For more on this explanation, see Sarkissian and Schill (2003).

6
The second effect of cross-listing is a reduction in information asymmetry for these firms.
Secondary market liquidity increases following cross-listing in both the home and the foreign
market, accompanied by a reduction in trading costs and a narrowing of bid-ask spreads in the
home market (Bancel and Mittoo 2001; Chan, Fong, and Stulz 1994; Domowitz, Glen, and
Madhavan 1998; Doukas and Switzer 2000; Foerster and Karolyi 1998; Mittoo 1992, 2003;
Pagano, Roell, and Zechner 2001). Greater liquidity is associated with increased visibility, greater
analyst coverage, improved earnings forecasts, and better investor recognition (Bailey, Karolyi,
and Salva 2002; Baker, Nofsinger, and Weaver 2002; Bancel and Mittoo 2001; Foerster and
Karolyi 1999; Lang, Lins, and Miller 2003; Leuz 2002; Smith and Sofianos 1997). Blass and Yafeh
(2001) argue that this channel is particularly important for younger firms or firms in specific
industries such as high-technology. The better information environment is associated with the
increased returns and the higher valuation of the cross-listed firm, consistent with Merton’s (1987)
investor recognition hypothesis.
These studies suggest that any examination of cross-listing must explain the higher returns while
taking into account the reduction in the cost of equity, increased liquidity, and firm-specific
characteristics such as firm size and industry membership.
3. The Bonding Hypothesis
What is the bonding hypothesis? Coffee (2002) notes that bonding was used originally in law and
economics to refer to the costs or liabilities that an agent or entrepreneur will incur to assure
investors that it will perform as promised, thereby enabling it to market its securities at a higher
price. This concept is used to explain the growth in cross-listings on U.S. exchanges over other
jurisdictions in separate papers published by Coffee (1999) and Stulz (1999). Coffee (2002) uses
bonding to refer to a mechanism by which firms incorporated in a jurisdiction with weak protection
of minority rights or poor enforcement mechanisms can voluntarily subject themselves to higher
disclosure standards and stricter enforcement in order to attract investors who would otherwise be
reluctant to invest (or who would discount such stocks to reflect the risk of minority expropriation).
This bonding may occur either through the courts or through monitoring by reputational
intermediaries such as U.S. underwriters, auditors, credit rating agencies, equity analysts, and

7
stock exchanges. Coffee terms the first channel legal or liability-based bonding, and the second
channel reputational bonding.7
A number of empirical studies have tested the bonding hypothesis, either directly or indirectly
(Doidge 2004; Doidge, Karolyi, and Stulz 2004; Dyck and Zingales 2004; Miller 1999; Reese and
Weisbach 2002; Siegel 2004; Tribukait 2002).8 Because regulatory bonding is a phenomenon that
is not directly observable, these authors have designed tests that attempt to capture this effect
using proxies. In an early study that does not focus on bonding directly, Miller (1999) examines
ADRs and finds that the benefits of cross-listing are evident only for ADRs that are subject to the
highest levels of disclosure and regulatory supervision. Reese and Weisbach (2002) proxy for
bonding using the frequency and location of equity offerings that follow cross-listing. Equity issues
increase following all cross-listings, but the increase is larger for firms that are from jurisdictions
with weak investor protection, and those firms raise more equity in the firm’s home country than in
the United States. Nenova (2003), Dyck and Zingales (2004), and Doidge (2004) examine the
private benefits that accrue to majority shareholders, proxied by the premium on changes in
controlling blocks of shares, or the difference in valuation between voting and non-voting shares
for firms with multiple classes of shares. Doidge (2004) finds, for example, that the premium
between voting and non-voting shares declines following cross-listing, an indication that minority
investors are better protected and benefit more from cross-listing.
Recent research has raised two important modifications to the bonding hypothesis. First, bonding
may occur through the operation of the financial markets and not the courts. Siegel (2004) studies
Mexican firms with ADRs traded on U.S. exchanges and finds that U.S. law enforcement neither
deterred nor punished Mexican insiders who expropriated assets from those companies. Further,
using the sample of all legal actions by the SEC against foreign firms from 1995 to 2003, Siegel
finds that the courts have been mostly ineffective in punishing the foreign firms. He finds, instead,
that investors punish Mexican firms by reducing their access to capital. Siegel concludes that
bonding works through a reputational mechanism and not through the courts.
Second, regulatory bonding is costly, because it restricts the ability of controlling shareholders to
expropriate rents from the firm (Doidge, Karolyi, and Stulz 2004; Reese and Weisbach 2002).
7 Although Stulz (1999, 25) does not use the term bonding, he makes a similar case, stating: “To the extent that the local exchange may not have such high standards, globalization enables firms to seek listings on foreign exchanges which have high standards, thereby increasing firm value by insuring that the firm’s policies are more likely to increase shareholder wealth and by making it easier for the firm to raise funds.” 8 Benos and Weisbach (2003) summarize a number of these studies.

8
Firms may therefore self-select and not cross-list, despite the benefits documented in the
literature. Doidge, Karolyi, and Stulz (2004) point out that fewer than one in ten large public
companies from outside the United States choose to cross-list their shares on U.S. stock markets.
In Canada, for example, 10 out of the top 35 companies that make up the TSE35 index were not
cross-listed in 2003. Using a cost-benefit framework, Doidge, Karolyi, and Stulz show that firms
have an incentive to cross-list when controlling shareholders stand to benefit from valuable growth
opportunities that cannot be financed domestically. They find that cross-listed firms are valued at
a premium to non-cross-listed firms when controlling for future growth opportunities, and this
difference is greatest for firms that are from jurisdictions with weak investor protection.
The literature on the bonding hypothesis does not say anything directly about the home-bias
phenomenon.9 Home bias refers to the unwillingness of investors to diversify their portfolios
internationally, making the proportion of foreign assets held by domestic investors too small
relative to the predictions of modern portfolio theory. There is a large literature on this topic, but
few studies that consider the impact of cross-listing on home bias. Given the positive impacts of
cross-listing, it is unclear what the relative valuation should be when cross-listed firms are
compared with U.S. firms. The literature on home bias suggests that foreign firms are valued at a
discount to U.S. firms as a result of information asymmetries, geography, or other factors
(Ahearne, Griever, and Warnock 2001; Coval and Moskowitz 1999; Hasan and Simaan 2000;
Huberman 2001; Portes, Rey, and Oh 2001). Dahlquist et al. (2002) suggest that concerns about
ownership structure may be the cause of home bias, providing a link with the bonding literature.
We do not address this issue directly, although the analysis below does present some interesting
results.
4. Hypothesis Development
The bonding hypothesis has been debated largely in terms of its benefit for firms from countries
where investor protection is weak, particularly for firms from emerging markets. We argue,
however, that there may be benefits to cross-listing for Canadian firms if investor protection in the
United States is perceived to be higher than in Canada.
Most observers would start from the assumption that Canada offers the same high level of investor
protection as the United States. The legal indices of shareholder and creditor rights created by La
9 Lewis (1999) provides a comprehensive review of both equity home bias in the finance literature, and consumption home bias in the macroeconomics literature.

9
Porta et al. (1998) would appear to support this hypothesis. Table 1 shows that Canada and the
United States have similar ratings on the basis of La Porta et al.’s indices, particularly in
categories such as oppressed minorities mechanism, antidirector rights, the efficiency of the
judicial system, the rule of law, and the risk of expropriation. The main difference in the table
concerns ownership concentration for the ten largest non-financial firms, where Canada has a
higher concentration. On the basis of this comparison, shareholder rights in Canada appear to be
as well protected as in the United States. Comparisons of accounting standards across countries,
and the minimum listing standards on the major stock exchanges, lead to a similar picture.
A different picture emerges from other indicators of investor protection. A number of studies
question the enforcement of securities regulation in Canada, particularly in the area of insider
trading. Bhattacharya and Daouk (2002) observe that insider trading laws were established in
Canada much later than in the United States, with the first prosecution under Canadian laws
coming in 1976, fifteen years after the first prosecution in the United States. In a cross-country
study of 52 countries, Bris (2003) finds that the amount of profits realized by insiders ahead of the
announcement of a takeover is higher in Canada than in almost every other country in the sample.
Using data on Canadian acquisitions, Jabbour, Jalilvand, and Switzer (2000) and Eckbo and
Thorburn (2000) document a run-up in the shares of Canadian firms prior to the announcement of
an acquisition, which they ascribe to trading by informed corporate insiders. McNally and Smith
(2003) find large-scale evidence of insider trading and reporting violations, based on a study of
stock buyback programs and insider trading around significant news announcements.
The poor record of enforcement in this area led the Canadian government to introduce legislation
in June 2003 designed to bring white-collar crime under the Criminal Code, while increasing
penalties and setting up special police teams to pursue investigations in this area. A report
published in November 2003 by a working group of Canadian securities regulators and
supervisors (Insider Trading Task Force 2003) acknowledges the severity of the problem, noting a
number of key differences relative to the United States, such as a lack of specific requirements on
containing insider information for lawyers, accountants, and banks in Canada. Not surprisingly,
Canadian firms are disproportionately represented in the cases of legal actions brought by the
SEC against foreign firms discussed in Siegel (2004), representing 4 out of the 13 cases. In terms
of civil cases brought by U.S. plaintiffs against foreign firms, Canada’s record is worse,
representing 36 out of 87 cases, or 42 per cent of cases from 1990 to mid-2002 (Siegel 2004).
Although part of this record may be explained by the close proximity of Canada and the United

10
States and the large number of cross-listed Canadian firms, the figures suggest that corporate
practices that go unpunished in Canada are prosecuted in the United States.10
There are also important differences in the structure and concentration of ownership of firms
between Canada and the United States. Concentrated corporate ownership is associated with
lower firm valuations, because minority shareholders may be less well protected (La Porta et al.
2000, 2002; Morck 2000). Morck, Stangeland, and Yeung (2000) and Attig, Gadhoum, and Lang
(2002) find that Canada has higher levels of corporate ownership by wealthy families, more
frequent use of pyramidal ownership structures, and more prevalent use of multiple classes of
voting shares than the United States. Table 2 reports the ownership data collected by Attig,
Gadhoum, and Lang (2002) for 1,093 publicly traded Canadian firms. Over 55 per cent of firms are
family owned when control is based on a 10 per cent ownership threshold, with this number
declining to 41 per cent using a 20 per cent ownership threshold. Only 19 per cent of Canadian
firms are widely held at the 10 per cent threshold, and 37 per cent of firms at the 20 per cent
threshold. More than 1 in 6 Canadian firms uses multiple classes of shares, while almost 7 per
cent have non-voting, ordinary shares. These statistics are in sharp contrast to the United States,
where widely dispersed ownership is the norm and discriminatory voting rights is the exception
(Morck 2000).
Taken together, these differences in enforcement and ownership structure between Canada and
the United States suggest that investor protection for minority shareholders may be weaker in
Canada than in the United States. If this proves to be the case, then Canadian firms should have a
lower valuation than their U.S. peers. Below, we put forward three hypotheses.
Hypothesis 1: Canadian firms listed exclusively in the home market are valued at a discount to
U.S. firms, after controlling for firm-specific characteristics.
If investor protection is higher in the United States than in Canada, the bonding hypothesis
predicts that Canadian firms may benefit by cross-listing if this action leads shareholders to
believe they will be better protected. Even if the U.S. courts do not appear to be successful in
protecting the rights of U.S. investors, as Siegel (2004) suggests, the signal from cross-listing and
the greater scrutiny by “reputational intermediaries” as suggested by Coffee (2002) may lead to an
increase in the valuation of Canadian firms that signal their quality in this way. In other words,
10 McNally and Smith (2003) provide a record of all insider trading prosecutions by Canadian securities commissions from 1980 to 2002, and report only 25 cases and 15 prosecutions.

11
bonding may have an impact on the valuation of cross-listed Canadian firms over and above the
documented effects related to higher returns, greater liquidity, and a lower cost of equity.
Hypothesis 2: Cross-listed Canadian firms are valued at a premium to exclusively Canadian-listed
firms, after controlling for firm size, profitability, industry membership, and future growth prospects.
This hypothesis is straightforward to test, but interpretation of the results is not. A finding that
cross-listed firms are valued more highly after controlling for these factors may be consistent with
the bonding hypothesis, but it is insufficient for proving that the higher marginal valuation results
from reputational bonding. As Coffee (2002) points out, the difficulty in testing for the impact of
bonding is to control for other factors that may explain the increased valuation, such as higher
sales in the United States or enhanced analyst coverage. If bonding is a latent and unobservable
effect, researchers must try to identify either an instrument or a proxy variable that can be used to
capture this effect (Wooldridge 2002).
We suggest a proxy for bonding that is based on share turnover in the U.S. market. Siegel (2004)
notes that bonding occurs through a reputational mechanism, not through the courts. In the case
of the Mexican companies in his study, access to new capital — both in Mexico and the United
States — was restricted after the asset-taking became public. Other Mexican firms that did not
engage in any form of expropriation, however, were more likely to receive outside resources,
leading Siegel to conclude that the market punished firms much more harshly than did the SEC.
We argue that U.S. investors differentiate between cross-listed companies on the basis of their
reputation for respecting the rights of shareholders. Siegel’s finding for Mexican ADRs should be
applicable to all cross-listed firms where the treatment of minority shareholders is a concern.
Although the Mexican case is quite extreme, because the scale of expropriation was large and the
country underwent a financial shock with the 1994 Peso crisis, investors may still differentiate
between cross-listed firms on the basis of their reputation for respecting investors’ rights. In the
case of cross-listed Canadian firms, the implication is that Canadian firms that treat minority
shareholders unfairly — or are suspected of having done so — would find their access to capital
restricted.
We argue that, in the absence of a shock that can be used to test the hypothesis put forward by
Siegel (2004), an alternative proxy of bonding is to examine at the secondary trading of cross-
listed firms. A stylized fact in the cross-listing literature is that cross-listing leads to an increase in
liquidity because of a pickup in trading volumes in both the home and the foreign stock market. If

12
this increase in trading volumes is absent, then firms that incur the costs required to cross-list may
not experience the benefits of a lower cost of equity and higher returns. In this case, a failure to
generate significant share turnover in the U.S. market would indicate a failure to bond, suggesting
that U.S. investors do not believe that their minority rights will be respected by this firm.
Hypothesis 3: Cross-listed firms that bond to the U.S. markets will exhibit higher share turnover on
the U.S. stock exchange and higher valuations than other cross-listed firms that do not bond.
Although share turnover on U.S. exchanges is undoubtedly a noisy measure that captures a
number of different effects, we argue that secondary trading in the U.S. market is conditional on
investors believing they will be fairly treated as minority shareholders. Bonding can be viewed as
an a priori condition for U.S. shareholders to invest in a cross-listed firm. As Siegel (2004) shows,
U.S. investors do not initially know the firm’s type, but learn over time whether the firm’s owners
and managers can be trusted. The three hypotheses proposed in this section will be examined in
section 6.
5. Data and Methodology
We use annual company accounts data and monthly price data for both U.S. and Canadian firms
from Standard & Poor’s Compustat for the 12-year period from 1990 to 2001. Monthly betas and
prices for U.S.-listed securities are collected from the Center for Research in Stock Prices (CRSP)
database, and for Canadian-listed securities from the TSX-Canadian Financial Markets Research
Center (TSX-CFMRC) database. Canadian firms that are cross-listed on a U.S. stock exchange
are identified using data from the NYSE, the NASDAQ, and year-end editions of the TSE Review.
Observations dropped from the sample are all firm-year observations with negative assets,
negative book value of equity, or negative sales. Foreign firms listed in the United States from
countries other than Canada are dropped from the sample. The remaining sample of U.S. and
Canadian firms is then restricted to those industries that are present in both countries, based on
the three-digit Standard Industrial Classification code. This restriction ensures that the valuation of
industries not present in both samples does not bias the results. Note that the final sample
includes firms with different fiscal year-ends. Compustat treats financial results reported for fiscal
years ending in January through June as having occurred in the previous calendar year. For
example, the financial results for a firm with a fiscal year-end of June 2001 are classified as
belonging to calendar year 2000. All per-share statistics are adjusted for stock splits, stock
dividends, and similar events.

13
Table 3 provides descriptive statistics on the three categories of firms in the sample. Panel A
shows that the final sample consists of 6,761 U.S. firms, 717 Canadian firms listed exclusively on
the TSX, and 206 cross-listed Canadian firms. Although the data cover twelve years, the median
firm in each sample is observed between three and five years. For this reason, there are 37,758
firm-year observations for U.S. firms, 3,367 observations for Canadian firms, and 974 observations
for cross-listed firms. For this reason, we use econometric techniques that are robust to
unbalanced panels. Panel B provides statistics on the market value of firms in each sample,
measured in U.S. dollars at year-end exchange rates. The cross-listed Canadian firms are larger
on average than either the non-cross-listed Canadian or U.S. firms, with more positive skewness
than the other two samples. Note that the mean and median Canadian firms listed only on the
TSX are significantly smaller than the U.S. firms. Panel C shows that the Canadian firms are more
frequently sampled in the latter half of the 1990s, a factor that needs to be accounted for in the
analysis that follows. Panel D shows the distribution of all samples across five industry groupings.
The U.S. sample has a concentration in manufacturing and service firms (41 per cent), high-
technology (24 per cent), and financial services (23 per cent). The Canadian sample has similar
weighting in manufacturing and services (40 per cent), but a greater percentage in natural
resources (23 per cent). The cross-listed sample has lower manufacturing and services
(34 per cent), more natural resources (33 per cent), and more high-technology firms (21 per cent)
than the non-cross-listed Canadian firms. Our regressions control for industry membership
directly. These results are also robust when high-technology firms, or only Nortel Networks, are
dropped.
The impact of cross-listing on valuation is tested through a series of regressions, where the
dependent variable is a measure of the valuation of a firm’s equity. The use of valuation ratios
instead of returns as the key dependent variable is similar to Sundaram and Logue (1996).
Valuation ratios provide a means of comparing firms across borders using a standardized metric,
while avoiding the problems associated with currency risk. The ratio of book-to-market (BM) is
used in one specification and the ratio of last-twelve-months earnings-to-price (EP) is used in a
second specification.11 Although the use of a forward-looking measure of earnings would be
preferred in this setting, data on the earnings expectations for Canadian firms are not available for
a large enough sample of firms, nor is a sufficiently long history available for the subset of
11 These regressions are also run using Tobin’s q, free cash flow-to-enterprise value, and earnings before interest, taxes, and depreciation-to-enterprise value, which generate similar results. The results are not shown, but are available upon request.

14
Canadian firms covered by I/B/E/S. Following the convention in the literature, the book-to-market
and earnings-to-price are calculated using the price three months after fiscal year-end to allow for
the publication of the financial results.12 Table 4 provides descriptive statistics on the dependent
and independent variables for each sample.
Given that we use earnings-to-price as one of the valuation measures, we are careful to check the
relative incidence of negative earnings before extraordinary items across Canadian and U.S. firms
in our sample. Panel E of Table 3 shows the distribution of losses by sample, where losses are
based on net income before extraordinary items. Over the entire period, 19 per cent of U.S. firms
in this sample had losses, compared with 21 per cent for the Canadian firms listed on the TSX,
and 32 per cent for the cross-listed firms. The higher incidence of losses among cross-listed firms
is surprising, and may lead to an upward bias in the comparisons based on earnings-to-price. The
regressions on book-to-market are more robust to firms with losses, because book value is a stock
measure of cumulative retained earnings and therefore less volatile than annual earnings. For this
reason, we view the results of the regressions on book-to-market as more informative.
The regressions attempt to capture the impact of bonding on valuation by controlling for those
effects associated with cross-listing that lead to an increase in valuation. The control variables
consist of company-specific variables, and dummy variables that identify a firm’s country of origin
(CTRY) and whether it is cross-listed (CROSS). A similar dummy-variable approach is used by
Nenova (2003), Doidge, Karolyi, and Stulz (2004), and Dyck and Zingales (2004). Although this
method is imperfect, it tries to capture systematic effects on valuation related to country of origin
and cross-listing that remain after controlling for the known effects of cross-listing.
The control variables used in the regressions are as follows. Firm-specific variables are calculated
for each year for firm size, profitability, cost of equity, future growth opportunities, and share
turnover. Firm size (SIZE) is measured by the natural log of total assets, denominated in U.S.
dollars. Canadian-dollar assets are converted using the exchange rate at the end of the firm’s
fiscal year. Profitability is measured using return on equity (ROE). To test the robustness of this
measure, ROE is decomposed into profit margin (PMARG), asset turnover (ATURN), and financial
leverage (FLEV), following the Dupont method.
12 The results reported below are robust when other prices are used, such as fiscal year-end and one and two months after year-end.

15
The cost of equity (K) is computed using the single-factor Capital Asset Pricing Model (CAPM).
Although the CAPM has its critics, it is widely used in finance, particularly by practitioners (Graham
and Harvey 2001).13 The nominal annualized yield on the 90-day treasury bill in each market is
used to proxy for the risk-free rate. Company betas are taken from the CRSP and TSX-CFMRC
databases and are calculated based on five years of monthly observations using a rolling
window.14 Canadian betas are relative to the Toronto Stock Exchange 300 (TSE300) composite
index, and U.S. betas are based on the Standard & Poor’s 500 (S&P500) index.15 The cost of
equity for cross-listed firms is based on two betas, namely their correlation with both the TSE300
and the S&P500. The equity premium for Canada and the United States is taken from Claus and
Thomas (2001), who estimate the equity-market premium over the period 1985 to 1998 for
Canada at 2.23 per cent and for the United States at 3.40 per cent.16 Similar to the case of ROE,
the robustness of the cost of equity is checked by decomposing it into two components: the risk-
free rate (TBILL) and the firm-specific equity premium (PREM).
Following Doidge, Karolyi, and Stulz (2004), a firm’s future growth opportunities are proxied using
sales growth over the past two years (SALES). For example, sales data from 1988 and 1989 are
used to calculate the average sales growth in 1990. When three years of sales data are not
available, we use sales growth over two years. We include a dummy variable to control for firms
that have negative earnings before extraordinary items (LOSS). This dummy variable takes on a
value of 1 in a year when a firm has losses, and zero otherwise. We include dummy variables for
five industries based on the North American Industry Classification System (NAICS) code.17 In
these regressions, the reference industry is firms engaged in manufacturing, wholesale or retail
trade, and services. The other four categories are: financial services and real estate, high-tech,
transportation and utilities, and natural resources (including mining, oil and gas, and forestry).
Panel D of Table 3 provides details on the NAICS codes used to identify industries. We include a
full set of year dummies (YEAR) in each regression to control for time-specific effects. Although
13 The three-factor model developed by Fama and French (1992) is one alternative among many, but it would not be suitable in this context, given that book-to-market is one of our two dependent variables. 14 A small number of firms in our sample did not have a beta in either of these sources. For these firms, we calculated the median unlevered beta for each industry based on the first two-digits of the Standard Industrial Classification (SIC) code, then re-levered this industry beta for each firm. 15 The TSE300 composite index was replaced with the S&P/TSX composite index on 1 May 2002. Our study covers an earlier period, so the TSE300 index is used. 16 These results are robust to the assumption that Canada and the United States have the same equity premium, as well as the assumption that Canada has a higher equity premium than the United States (following Damodoran 2002). The results are qualitatively the same under all three cases. 17 NAICS are used instead of SIC codes because the new system distinguishes better among high-technology firms.

16
panel regressions capture variation across time for individual firms, the time dummies capture
systematic effects affecting all firms. In these regressions, the reference year is 1990, although the
results are robust to the use of other reference years. Owing to a lack of ownership data, we do
not control for the ownership structure of these firms. Details on the formulae used to calculate all
the variables in the regressions are provided in Appendix A.
The relationship between the three samples of firms can be tested simultaneously by considering
a panel regression with two dummy variables. One dummy variable specifies the nationality of the
firm, with CTRY=1 for Canadian firms. A second dummy variable captures the effect of being
cross-listed, with CROSS=1 for cross-listed firms. The net effect on valuation of being a cross-
listed firm relative to U.S. firms is therefore the sum of the two dummy variables, CTRY and
CROSS. There may be an issue of self-selection in these samples, because the cross-listed firms
are expected to be large and profitable firms that compete globally in their industry. Recall,
however, that 10 out of the top 35 Canadian firms are not cross-listed, although they could
potentially benefit from cross-listing. These samples therefore compare firms that received a
treatment of cross-listing, as well as a control group of firms that qualified for the treatment but
opted out. We estimate two models:
BMit = a + ß1SIZEit + ß2ROEit + ß3Kit + ß4SALESit + ß5LOSSit + ß6CROSSit + ß7CTRYi + ßnNAICSit+
ßkYEARt+ eit , (1)
EPit = a + ß1SIZEit + ß2ROEit + ß3Kit + ß4SALESit + ß5LOSSit + ß6CROSSit + ß7CTRYi + ßnNAICSit+
ßkYEARt+ eit , (2)
where book-to-market (BM) is the dependent variable in one specification and earnings-to-price
(EP) in a second. The control variables in both regressions are the log of total assets in U.S.
dollars (SIZE), return on equity (ROE), cost of equity (K), past sales growth (SALES), a dummy
variable when the firm has negative earnings before extraordinary items (LOSS), and a dummy
variable for each of four industries (NAICS) where the reference industry is firms in manufacturing,
trade, and services. CROSS is a dummy variable set equal to 1 for cross-listed firms and set to 0
otherwise. CTRY is a dummy variable set equal to 1 for Canadian-listed firms and set to 0
otherwise. YEAR represents dummy variables for each year, with 1990 as the reference year. We
checked the robustness for ROE and cost of equity. In each regression we replaced ROE with its
components: profit margin (PMARG), asset turnover (ATURN), and financial leverage (FLEV). We
replaced the cost of equity with the risk-free rate (TBILL) in the country where the share is listed,
and the firm-specific equity premium (PREM).

17
In all cases, Hypothesis 1, which states that Canadian-listed firms are valued at a discount to U.S.-
listed firms, is tested by examining whether the coefficient of the CTRY dummy is positive and
statistically significant. We expect to find a positive coefficient, which implies a discount relative to
U.S.-listed firms. The interpretation on cross-listed firms is more difficult, because this specification
does not compare the cross-listed firms and the non-cross-listed firms directly. Instead, the
reference case is U.S. firms. For this reason, the sum of the coefficients CROSS and CTRY
provides a measure of the relative valuation of cross-listed firms to U.S. firms. An F-test is used to
determine whether this coefficient is statistically different from zero.
Hypothesis 2, which states that cross-listed Canadian firms are valued at a premium to exclusively
Canadian-listed firms because of the impact of reputational bonding, is tested by restricting the
sample to those two groups of firms and re-estimating the equations. This sample indicates the
likely impact of investor protection by comparing two sets of firms that are chiefly distinguished by
the level of scrutiny they receive from regulators and investors. The cross-listed firms are subject
to regulation and supervision by the SEC, and are exposed to the scrutiny of reputational
intermediaries in the U.S. markets (Coffee 2002). We estimate the following two models:
BMit = a + ß1SIZEit + ß2ROEit + ß3Kit + ß4SALESit + ß5LOSSit + ß6CROSSit + ßnNAICSit+
ßkYEARt+ eit , (3)
EPit = a + ß1SIZEit + ß2ROEit + ß3Kit + ß4SALESit + ß5LOSSit + ß6CROSSit + ßnNAICSit+
ßkYEARt+ eit , (4)
where CROSS is a dummy variable with 1 for cross-listed observations, and 0 otherwise, and all
other variables are as before. All the firms in this comparison are Canadian, so the dummy
variable CTRY is not required. If cross-listed Canadian firms are valued at a premium relative to
non-cross-listed Canadian firms, then we expect to find a negative coefficient on the CROSS
variable, indicating that cross-listed firms have higher multiples of book value and past earnings.
Although the regressions on Canadian firms highlight the impact of cross-listing on valuation, they
do not isolate the impact of bonding. The impact of investor protection is not identified in these
regressions, because the effect could be due to other factors. Recall that Hypothesis 3 predicts
that cross-listed firms that bond to the U.S. markets will have higher valuations and greater share
turnover on U.S. stock exchanges than other cross-listed firms that do not bond. We try to capture
this effect by dividing our cross-listed sample into two groups based on the primary location of
their trading. We collected data on relative share turnover on the TSX and on the U.S. exchanges

18
— the NYSE, NASDAQ, and AMEX — for all the cross-listed firms in our sample. The source for
this data is the TSX Review, a monthly publication of the Toronto Stock Exchange. The TSX
Review reports the total volume of trading on Canadian and U.S. stock exchanges, the total value
of trading, and the percentage of traded value by stock exchange. We construct two variables that
relate relative turnover in these two markets, based on the ratio of U.S. turnover to Canadian
turnover. CROSSHI identifies 322 observations of firms that have greater U.S. turnover than
Canadian turnover. CROSSLO identifies 652 observations of firms that have greater Canadian
turnover than U.S. turnover. Relative turnover for cross-listed firms varies considerably, with a
mean ratio of U.S. to Canadian turnover of 2.6 times and a median ratio of 0.47 times. Although
some cross-listed firms experience almost no share turnover on U.S. exchanges, others have
almost no share turnover on the TSX.
We estimate the same regressions as before, but substitute CROSSHI and CROSSLO for the
dummy variable CROSS. When comparing all three samples of firms in equations (1) and (2), our
expectation is that the coefficient on CROSSHI will be negative and significant, which implies that
Canadian firms that are traded predominantly on a U.S. stock exchange receive a higher valuation
relative to non-cross-listed firms. We expect that the coefficient on CROSSLO will be positive and
significant, which would suggest that Canadian firms that fail to bond to the U.S. markets and
remain traded predominantly in the home market following cross-listing have a lower valuation. In
those cases, the relationship between U.S. firms and cross-listed firms is the sum of the
coefficients on CTRY and either CROSSHI or CROSSLO. When we compare Canadian cross-
listed firms with Canadian firms listed exclusively on the TSX in equations (3) and (4), we expect
the coefficient on CROSSHI to be positive and significant, which implies a premium valuation for
cross-listed firms. The variable CROSSLO, however, should not be statistically different from zero,
because we expect that Canadian investors will not view these firms any differently from other
non-cross-listed firms.
As a final robustness check on our results, we compare the cross-listed Canadian firms with the
U.S. firms, excluding the Canadian firms that are not cross-listed. Although this comparison is
implicit in the panel regressions using all three samples in equations (1) and (2), it provides a
useful check on our results. We expect to find that cross-listed firms that are traded actively in the
U.S. have similar valuations to U.S. firms, and that the Canadian firms that fail to bond are valued
at a discount. This comparison is made by repeating the regressions in equations (3) and (4), but
restricting the sample to U.S. firms and cross-listed Canadian firms. In this case, the reference firm
is a U.S. firm in the manufacturing, trade, and services sector.

19
All of these regressions are estimated using panel regressions with random effects, in order to
capture unobserved firm-specific heterogeneity. Panel methods capture both the time-series
dimension of the data and the cross-sectional dimension, and assume a particular structural form
for the residuals (Wooldridge 2002). The random-effects approach assumes that part of the
residual is firm-specific but random, although it remains unidentified. This assumption is less
restrictive than the fixed effects approach that assumes the firm-specific residual is constant over
time. These estimations are performed using Stata 8.0.
6. Empirical Results
Table 5 shows the results of the regressions on all firms using random effects based on the
specifications in equations (1) and (2). The first two columns show regressions on book-to-market,
and the final two columns show regressions on earnings-to-price. Year dummies are included in
all regressions, but are not shown. These dummy variables are negative and statistically
significant for all years, which implies that valuations from 1991 onwards are consistently higher
than in 1990. Industry dummies are included for four out of five industries, with manufacturing,
trade, and service sector firms as the base or reference industry, because they represent the
greatest number of observations in each sample. The key variables of interest are the country
dummy variable that highlights the impact on valuation of being a Canadian firm, and the cross-
listing dummy variable that picks up the impact of being listed on both a Canadian and a U.S.
stock exchange.
The direction and statistical significance on the control variables are consistent throughout all the
regressions that follow. Recall that a negative coefficient implies a higher valuation (lower book-to-
market or earnings-to-price), while a positive coefficient implies a lower valuation. The log of size
has a positive coefficient in regressions on book-to-market, which implies that larger firms are
valued at a discount to smaller firms, consistent with the size effect documented in the literature.
Size has the opposite effect in regressions on earnings-to-price, which implies that smaller firms
have a higher valuation on this measure. The coefficient of ROE shows a similar relationship
because it is negative and significant for regressions on book-to-market, which suggests that more
profitable firms have higher valuations in a given sample. The coefficient is negative when using
earnings-to-price, which supports a view of mean reversion of earnings.18 The decomposition of
18 Bauman, Conover, and Cox (2002) and Fama and French (2000) document mean reversion of earnings.

20
ROE shows that this effect is driven by asset turnover and financial leverage.19 The coefficient on
cost of equity is negative and significant in most regressions, with the impact larger for regressions
on book-to-market. The components of cost of equity are pulling in opposite directions, with the
firm-specific premium negative and significant in most regressions, while the risk-free rate is
positive and significant in fewer cases. Higher past sales growth is associated with a higher
valuation in regressions on book-to-market, but a lower valuation in regressions on earnings-to-
price.20
The changing direction of these control variables, which change signs when using book-to-market
and earnings-to-price, appear to be driven by the inclusion of firms with losses. The dummy
variable for losses is positive and significant for regressions on book-to-market, which implies that
firms experiencing negative earnings before extraordinary items have a lower valuation than firms
with positive earnings. When using earnings-to-price, the impact of losses is to increase or over-
inflate a firm’s valuation.21 When the regressions are run excluding observations of firms with
losses, however, the direction and statistical significance are consistent for both valuation
measures. These results are not shown but are available upon request.
The country dummy variable is positive and significant in the regressions on book-to-market, and
positive but only significant in one case in the regressions on earnings-to-price. The positive
coefficient implies that Canadian firms are valued at a discount relative to U.S. firms in this
sample. This discount is economically important, because the coefficient implies a discount of over
20 per cent based on multiples of book value and 10 per cent based on multiples of earnings.
These results support Hypothesis 1 that Canadian firms listed exclusively in the home market are
valued at a discount to U.S. firms, after controlling for firm-specific characteristics.
The coefficient on the dummy variable for cross-listed firms is negative and significant in all
cases, which implies that cross-listed firms in this sample have a higher valuation than the non-
cross-listed Canadian ones. In this case, the premium amounts to 8.5 to 9.9 per cent of book value
and 1.4 to 1.5 per cent of past earnings. The relationship between cross-listed Canadian firms and
19 Because financial leverage is measured as total assets over equity in the Dupont formula, a higher financial leverage ratio implies less equity and more debt for a given set of assets. Greater leverage leads to a higher valuation, as shown by the negative coefficient. 20 The results using book-to-market are consistent with the results in Doidge, Karolyi, and Stulz (2004), who use Tobin’s q. 21 A negative price-earnings ratio has no economic meaning. In practice, investors use a forward-looking measure of earnings, not a backward-looking measure as used in this study. Forward-looking estimates of earnings per share are not available for a large enough sample of Canadian firms.

21
U.S. firms is based on the sum of the two dummy variables, with an F-test used to determine
whether the sum of the coefficients is different from zero. The sum of the coefficients of the cross-
listing dummy and the country dummy is statistically different from zero when using book-to-
market, although the country effect dominates. Cross-listing generally mitigates the country
discount for Canadian firms, on this measure. When using earnings-to-price, the F-test cannot
reject the null hypothesis that the sum of the coefficients is zero, which implies that cross-listed
firms are valued similarly to U.S. firms with the same characteristics on the basis of this measure.
While the regressions in Table 5 appear to support Hypothesis 2 — that cross-listed firms are
valued at a premium to exclusively Canadian-listed firms, after controlling for firm-specific
characteristics — this relationship is tested directly by estimating the regressions using only the
Canadian firms. Table 6 shows the results of this estimation. Note the consistency in the direction
and statistical significance on the control variables with the estimations in Table 5. The coefficient
on the dummy variable for cross-listed firms in Table 6 is negative and significant in columns 1 and
2, which implies a 12.4 to 13.6 per cent premium for cross-listed firms on the basis of book value.
The coefficient is not statistically significant in columns 3 and 4, which implies that cross-listed
firms are valued similarly to non-cross-listed firms on the basis of past earnings. This finding is
consistent with the results in Table 5, and provides support for Hypothesis 2. Cross-listing may
lead to an increase in valuation, depending on the valuation measure that is being considered.
Given the higher incidence of losses among cross-listed firms, as shown in Panel E of Table 3, we
find the results using book-to-market more convincing. This result is consistent with the bonding
hypothesis, because it suggests that those firms that are exposed to the scrutiny of the U.S.
markets have a higher valuation. These regressions, however, do not prove the bonding
hypothesis, because the effect could be due to other factors that are not controlled for directly in
these regressions.
To test for the impact of bonding on valuation in Hypothesis 3, we re-estimate the regressions
above using two dummy variables — CROSSHI and CROSSLO — in the place of the dummy
variable for cross-listed firms. CROSSHI takes on a value of one for cross-listed firms that have
greater turnover on U.S. stock exchanges than on the TSX, and zero otherwise. CROSSLO takes
on a value of one for firms that have greater turnover on the TSX than on U.S. stock exchanges,
and zero otherwise. We argue that the relative location of share turnover is a proxy or indicator of
the degree of reputational bonding to the U.S. regulatory regime, because it indicates the degree
of investor confidence that their shareholder rights will be respected. Table 7 shows the results of
this estimation in regressions on U.S. and Canadian firms. All the control variables have similar

22
coefficients and statistical significance as the results in Table 5. The country dummy is positive
and significant in three out of four regressions, which implies a discount for Canadian firms. The
coefficient on CROSSLO is negative but only weakly significant (at the 10 per cent level) in three
out of four regressions, which implies a small premium to non-cross-listed Canadian firms. The F-
tests of the sum of CROSSLO and the country dummy imply that cross-listed firms that remain
predominantly traded on the TSX are valued at a discount to U.S. firms on the basis of book value,
but are valued similarly on the basis of past earnings.
By contrast, the coefficient on CROSSHI is negative and significant at the 1 per cent level in the
regressions using book-to-market, which implies a higher valuation relative to other Canadian
firms for cross-listed firms that are traded predominantly on a U.S. stock exchange. The location of
share turnover does not affect the valuation on the basis of earnings-to-price. The F-tests suggest
that these cross-listed firms are valued similarly to U.S. firms when using both multiples of book
value and past earnings. This finding provides clear support for the view that reputational bonding
has a positive impact on valuation.
Table 8 shows the results of these regressions when including only Canadian firms in the sample.
The results confirm the earlier findings. Cross-listed firms that remain predominantly traded on the
TSX are valued similarly to non-cross-listed firms, as shown by the statistically insignificant
coefficients on the dummy variable, CROSSLO. By contrast, cross-listed firms that are
predominantly traded on the U.S. stock exchanges have a premium valuation that is large and
economically important. Cross-listing increases valuations by 21.4 to 23.2 per cent, measured
using book value. This finding has not been shown before in the cross-listing literature, which
views cross-listing as having a positive effect for all firms that cross-list. These results suggest that
firms that cross-list but do not attract the secondary trading and sponsorship on U.S. markets do
not enjoy the benefits of cross-listing, despite having paid the costs in terms of listing fees and
regulatory filings. Instead, U.S. investors differentiate between the cross-listed firms, and
concentrate their trading in a subset of firms that see an increase in their valuation.
The regressions in Tables 9 and 10 provide a robustness check on the earlier results. They allow
a direct comparison to be made between cross-listed firms and U.S. firms, by excluding Canadian
firms that are listed solely on the home market. In this case, the dummy variable for cross-listing
picks up both the country effect and the impact of cross-listing. The same patterns emerge as
described before. Table 9, with its statistically insignificant coefficient on the dummy variable for
cross-listing, shows that cross-listed firms are valued similarly to U.S. firms on the basis of book
value and past earnings. These results are interesting, because they suggest that U.S. investors

23
may not exhibit the same degree of home bias towards cross-listed firms, consistent with the
findings in Ahearne, Griever, and Warnock (2001).
Table 10 provides a sharply different picture that highlights the value of differentiating between
cross-listed firms on the basis of their location of trading. In these regressions, the cross-listed
firms that are traded predominantly on the TSX are valued at a discount of 11.3 to 12.9 per cent
on the basis of book value relative to the average U.S. firm, while their valuation based on
earnings is not statistically different. The cross-listed firms that attract sponsorship in the U.S.
stock markets are valued similarly to U.S. firms. This difference in valuation among the cross-listed
firms was hidden when all the cross-listed firms are grouped together, because the offsetting
effects on valuation led the overall effect to be neutral. Table 10 shows that there are clear
benefits to cross-listing when reputational bonding occurs, despite the fact that U.S. investors
continue to exhibit home bias against a subset of cross-listed firms.
7. Conclusion
We have described a new view of the impact of cross-listing that links valuation to a firm’s ability to
develop an active secondary market for its shares in the U.S. stock markets. Contrary to previous
research, cross-listing may not provide benefits for all firms, even when those firms meet the
highest regulatory requirements for disclosure and supervision. When cross-listed firms are
divided into two groups based on the ratio of their share turnover in the home market relative to
the U.S. market, the firms that develop active trading in the U.S. market are valued more highly
than the cross-listed firms that remain predominantly traded in the home market based on
multiples of book value. Cross-listed Canadian firms that do not develop active trading in the
United States following cross-listing are valued similarly to non-cross-listed Canadian firms. We
have argued that this premium valuation is linked to the firm’s reputation among U.S. investors,
and is consistent with the bonding hypothesis developed by Coffee (1999) and Stulz (1999). We
have also argued that a foreign firm, to gain the full benefits of cross-listing, must convince
investors that their shareholder rights will be protected. U.S. investors may then be willing to
consider the foreign firm for inclusion in their portfolio. The amount of trading on the U.S. market
may therefore be viewed as a proxy for the degree to which a foreign firm has been successful in
bonding to the U.S. markets. This research supports the view that reputational bonding is what
matters, not legal bonding.
We have reported results that are supportive of the bonding hypothesis using a new proxy for
reputational bonding based on insights from Siegel (2004). The next step is to test the results

24
using other measures of bonding proposed in earlier studies, such as the location of subsequent
equity issuance (Reese and Weisbach 2002). For example, some firms cross-list at the time of
their initial public offering, and others pursue secondary equity offerings subsequent to cross-
listing. The amount of time and effort spent on investor relations connected to such an offering, as
well as the reputation of the underwriters, should affect the degree of reputational bonding. Other
factors to consider are whether the cross-listed firm subsequently engaged in an acquisition paid
for by stock, and how much of the firm’s sales take place in the U.S. market.
More importantly, future research on bonding will need to control for other factors that are likely to
affect the degree of reputational bonding and subsequent trading in the U.S. market. Ownership
structure is an important factor. Although a time-series database of the ownership structure of
Canadian firms is not available, Doidge (2004) and Nenova (2003) demonstrate the value of
accounting for the existence of dual classes of shares or similar arrangements that lead to a
separation between cash flow rights and voting rights. An important contribution of future research
would be to capture the impact of ownership structure on secondary trading.

25
Bibliography
Ahearne, A.G., W.L. Griever, and F.E. Warnock. 2001. “Information Costs and Home Bias: An Analysis of U.S. Holdings of Foreign Equities.” International Financial Discussion Paper No. 691, Board of Governors of the Federal Reserve System.
Attig, N., Y. Gadhoum, and L.H.P. Lang. 2002. “Ultimate Ownership of the U.S. and Canada.” Laval University. Photocopy.
Bailey, W., G.A. Karolyi, and C. Salva. 2002. “The Economic Consequences of Increased Disclosure: Evidence from International Cross-Listings.” Cornell University. Photocopy.
Baker, H.K., J.R. Nofsinger, and D.G. Weaver. 2002. “International Cross-Listing and Visibility.” Journal of Financial and Quantitative Analysis 37(3): 495–521.
Bancel, F. and U.R. Mittoo. 2001. “European Managerial Perceptions of the Net Benefits of Foreign Stock Listings.” European Financial Management 7(2): 213–36
Bandyopadhyay, S.P., A.S. Hilton, and G. Richardson. 2002. “A Re-examination of Reconciling Items Between Canadian and United States GAAP.” Managerial Finance 28(3): 37–56.
Bauman, W.S., C.M. Conover, and D.R. Cox. 2002. “Are the Best Small Firms the Best Investments?” Journal of Financial Research 25(2): 169–86.
Benos, E. and M.S. Weisbach. 2003. “Private Benefits and Cross-Listings in the United States: A Survey of Recent Research Estimating Private Benefits and the Role of Cross-Listings as a Bonding Mechanism.” University of Illinois. Photocopy.
Bhattacharya, U. and H. Daouk. 2002. “The World Price of Insider Trading.” Journal of Finance 57(1): 75–108.
Blass, A. and Y. Yafeh. 2001. “Vagabond Shoes Longing to Stray: Why Foreign Firms List in the United States.” Journal of Banking and Finance 25(3): 555–72.
Bris, A. 2003. “Do Insider Trading Laws Work?” Yale School of Management. Photocopy.
Chan, K.C., W-M. Fong, and R.M. Stulz. 1994. “Information, Trading and Stock Returns: Lessons From Dually-Listed Securities.” National Bureau of Economic Research Working Paper No. 4743 (May), 21.
Claus, J. and J. Thomas. 2001. “Equity Premia as Low as Three Percent? Evidence from Analysts' Earnings Forecasts for Domestic and International Stock Markets.” Journal of Finance 56(5): 1629–66.
Coffee, J.C. 1999. “The Future as History: The Prospects for Global Convergence in Corporate Governance and Its Implications.” Northwestern University Law Review 93(3): 641–708.
______. 2002. “Racing Towards the Top?: The Impact of Cross-Listings and Stock Market Competition on International Corporate Governance.” Columbia University Center for Law and Economic Studies Working Paper No. 205.

26
Coval, J.D. and T.J. Moskowitz. 1999. “Home Bias at Home: Local Equity Preferences in Domestic Portfolios.” Journal of Finance 54(6): 2045–73.
Dahlquist, M., L. Pinkowitz, R.M. Stulz, and R. Williamson. 2002. “Corporate Governance and The Home Bias.” Ohio State University. Photocopy.
Damodoran, A. 2002. “Estimating Equity Risk Premiums.” Stern School of Business, NYU. Photocopy.
Doidge, C. 2004. “U.S. Cross-Listings and the Private Benefits of Control: Evidence from Dual Class Firms.” Journal of Financial Economics, forthcoming.
Doidge, C., G.A. Karolyi, and R. Stulz. 2004. “Why Are Foreign Firms Listed in the U.S. Worth More?” Journal of Financial Economics, forthcoming.
Domowitz, I., J. Glen, and A. Madhavan. 1998. “International Cross-Listing and Order Flow Migration: Evidence from an Emerging Market.” Journal of Finance 53(6): 2001–27.
Doukas, J. and L.N. Switzer. 2000. “Common Stock Returns and International Listing Announcements: Conditional Tests of the Mild Segmentation Hypothesis.” Journal of Banking and Finance 24(3): 471–502.
Dyck, A. and L. Zingales. 2003. “Private Benefits of Control: An International Comparison.” Journal of Finance, forthcoming.
Eckbo, B.E. and K.S. Thorburn. 2000. “Gains to Bidder Firms Revisited: Domestic and Foreign Acquisitions in Canada.” Journal of Financial and Quantitative Analysis 35(1): 1–25.
Errunza, V.R. and E. Losq. 1985. “International Asset Pricing under Mild Segmentation: Theory and Test.” Journal of Finance 40(1): 105–24.
Errunza, V.R. and D.P. Miller. 2000. “Market Segmentation and the Cost of Capital in International Equity Markets.” Journal of Financial and Quantitative Analysis 35(4): 577–600.
Eun, C.S. and S. Sabherwal. 2003. “Cross-Border Listings and Price Discovery: Evidence from U.S. Listed Canadian Stocks.” Journal of Finance 57(2): 549–75.
Fama, E.F. and K.R. French. 1992. “The Cross-Section of Expected Stock Returns.” Journal of Finance 47(2): 427–65.
______. 2000. “Forecasting Profitability and Earnings.” Journal of Business 73(2): 161–75.
Foerster, S.R. and G.A. Karolyi. 1993. “International Listings of Stocks: The Case of Canada and the U.S.” Journal of International Business Studies 24: 763–84.
______. 1998. “Multimarket Trading and Liquidity: A Transaction Data Analysis of Canada-U.S. Interlistings.” Journal of International Financial Markets, Institutions and Money 8(3-4): 393–412.
______. 1999. “The Effects of Market Segmentation and Investor Recognition on Asset Prices: Evidence from Foreign Stocks Listing in the United States.” Journal of Finance 54(3): 981–1013.

27
Gagnon, L. and G.A. Karolyi. 2003. “Multi-Market Trading and Arbitrage.” Queen’s University. Photocopy.
Graham, J.R. and C.R. Harvey. 2001. “The Theory and Practice of Corporate Finance: Evidence from the Field.” Journal of Financial Economics 60(2-3): 187–243.
Hasan, I. and Y. Simaan. 2000. “A Rational Explanation for Home Country Bias.” Journal of International Money and Finance 19(3): 331–61.
Huberman, G. 2001. “Familiarity Breeds Investment.” Review of Financial Studies 14(3): 659–80.
Insider Trading Task Force. 2003. Illegal Insider Trading in Canada: Recommendations on Prevention, Detection, and Deterrence.
Jabbour, A.R., A. Jalilvand, and J.A. Switzer. 2000. “Pre-Bid Run-Ups and Insider Trading Activity: Evidence from Canadian Acquisitions.” International Review of Financial Analysis 9(1): 21–43.
Karolyi, G.A. 1998. “Why Do Firms List Shares Abroad?: A Survey of the Evidence and Its Managerial Implications.” Financial Markets, Institutions and Instruments 7(1): 1–60.
Karolyi, G.A. and R.M. Stulz. 2002. “Are Financial Assets Priced Locally or Globally?” NBER Working Paper No. 8994, Cambridge, MA.
Lang, M.H., K.V. Lins, and D.P. Miller. 2003. “ADRs, Analysts and Accuracy: Does Cross-Listing in the U.S. Improve a Firm’s Information Environment and Increase Market Value?” Journal of Accounting Research 41(2): 317–45.
La Porta, R., F. Lopez-de-Silanes, A. Shleifer, and R. Vishny. 1998. “Law and Finance.” Journal of Political Economy 106(6): 1113–55.
______. 2000. “Investor Protection and Corporate Governance.” Journal of Financial Economics 58(1-2): 3–27.
______. 2002. “Investor Protection and Corporate Valuation.” Journal of Finance 57(3): 1147–70.
Leuz, C. 2002. “Discussion of ADRs, Analysts, and Accuracy: Does Cross-Listing in the U.S. Improve a Firm’s Information Environment and Increase Market Value?” University of Pennsylvania. Photocopy.
Lewis, K. 1999. “Trying to Explain Home Bias in Equities and Consumption.” Journal of Economic Literature 37(2): 571–608.
McNally, W.J. and B.F. Smith. 2003. “Do Insiders Play by the Rules?” Canadian Public Policy 29(2): 125–44.
Merton, R.C. 1987. “A Simple Model of Capital Market Equilibrium with Incomplete Information.” Journal of Finance 42(3): 483–510.
Miller, D.P. 1999. “The Market Reaction to International Cross-Listings: Evidence from Depositary Receipts.” Journal of Financial Economics 51(1): 103–23.

28
Mittoo, U.R. 1992. “Additional Evidence on Integration in the Canadian Stock Market.” Journal of Finance 47(5): 2035–54.
______. 2003. “Globalization and the Value of U.S. Listings: Revisiting Canadian Evidence.” Journal of Banking and Finance 27(9): 1629–61.
Morck, R.K., ed. 2000. Concentrated Corporate Ownership. Chicago: University of Chicago.
Morck, R.K., D.A. Stangeland, and B. Yeung. 2000. “Inherited Wealth, Corporate Control and Economic Growth: The Canadian Disease.” In Concentrated Corporate Ownership. Chicago: University of Chicago.
Nenova, T. 2003. “The Value of Corporate Voting Rights and Control: A Cross-Country Analysis.” Journal of Financial Economics 68(3): 325–51.
Pagano, M., A. Roell, and J. Zechner. 2001. “What Makes Stock Exchanges Succeed? Evidence from Interlisting Decisions.” European Economic Review 45(4-6): 770–82.
Portes, R., H. Rey, and Y. Oh. 2001. “Information and Capital Flows: The Determinants of Transactions in Financial Assets.” European Economic Review 45(4-6): 783–96.
Reese, W.A. and M.S. Weisbach. 2002. “Protection of Minority Shareholder Interests, Cross-Listings in the United States, and Subsequent Equity Offerings.” Journal of Financial Economics 66: 65–104.
Sarkissian, S. and M.J. Schill. 2003. “The Overseas Listing Decision: New Evidence of Proximity Preference.” Darden School of Business Working Paper No. 03-07. Photocopy.
Siegel, J. 2004. “Can Foreign Firms Bond Themselves Effectively by Renting U.S. Securities Laws?” Journal of Financial Economics, forthcoming.
Smith, K. and G. Sofianos. 1997. “The Impact of an NYSE Listing on the Global Trading of Non-U.S. Stocks.” NYSE Working Paper No. 97-02.
Stulz, R.M. 1995. “The Cost of Capital in Internationally Integrated Markets: The Case of Nestle.” European Financial Management 1(1): 11–22.
______. 1999. “Globalization, Corporate Finance, and the Cost of Capital.” Journal of Applied Corporate Finance 26: 3–28.
Sundaram, A. and D. Logue. 1996. “Valuation Effects of Foreign Country Listing on U.S. Exchanges.” Journal of International Business Studies 27: 67–88.
Tribukait, H.V. 2002. “The Invisible Enforcer? Price Behavior of Mexican Firms Cross-Listed on the NYSE Around Earnings Announcements.” Harvard University. Photocopy.
Wooldridge, J.M. 2002. Econometric Analysis of Cross Section and Panel Data. Cambridge, MA:
MIT Press.

29
Table 1: Ratings of Shareholder and Creditor Rights of Canada and United States The following table lists the categories of shareholder and creditor rights for Canada and the United States, as reported by La Porta et al. (1998). Country name Canada U.S. Legal origin of company law or commercial code Common Common Multiple classes of voting shares allowed (one share – one vote=0) Yes Yes Proxy voting by mail allowed Yes Yes Shares not blocked before shareholders’ meeting No No Cumulative voting for board of directors Yes Yes Oppressed minorities mechanism Yes Yes Existing shareholders have preemptive rights for new equity issues Yes Yes Percentage of share capital to call an extraordinary shareholders’ meeting 5% 10% Index of antidirector rights (0=lowest, 6=highest) 5.00 5.00 Mandatory dividend in law No No Restrictions for going into reorganization No No Automatic stay on secured assets in reorganization Yes Yes Secured creditors first in liquidation Yes Yes Management stays during reorganization Yes Yes Index of creditors’ rights (0=lowest 4=highest) 1.00 1.00 Legal restriction on minimum percentage of share capital to avoid No No Efficiency of judicial system (0=lowest, 10=highest) 9.25 10.00 Rule of law (rescaled 0=lowest, 10=highest) 10.00 10.00 Risk of expropriation (0=highest, 10=lowest) 9.67 9.98 Risk of contract repudiation (0=highest, 10=lowest) 8.96 9.00 Accounting standards (0=lowest, 100=highest) 74.00 71.00 Average per cent of common shares owned by three largest shareholders 40% 20%

30
Table 2: Ownership Structure of Canadian Firms The following table reports the ownership structure for 1,093 Canadian firms for the year 1996, as reported by Attig, Gadhoum, and Lang (2002). Firms are classified into five categories based on their majority shareholder with a 10 per cent ownership stake, or a 20 per cent ownership stake. Panel A: Controlling shareholder (per cent) 10 per cent cut-off 20 per cent cut-off Widely held firms 18.8 36.8 Family controlled firms 55.4 41.0 State controlled firms 4.3 1.9 Widely held financial institution 17.1 10.7 Unclassified 4.4 9.6 Panel B: Means of enhancing control (per cent) Multiple control chains 8.1 Multiple classes of shares 17.2 Non-voting shares 6.5

31
Table 3: Descriptive Statistics of Sample This table reports descriptive statistics of the three categories of firms in the sample. “U.S.” means U.S. firms listed on a U.S. stock exchange but not on a Canadian stock exchange. “Canada” means Canadian firms that are listed only on the Toronto Stock Exchange (TSX). “Cross-listed” means Canadian firms that have a listing on both the TSX and a listing on a U.S. stock exchange. Panel A shows the number of firms and observations in each sample. Panel B gives statistics on their market value in U.S. dollars, using end-of-year exchange rates. The median, 5, and 95 percentiles provide a picture of the distribution of each category of firm. Panel C shows the number of observations by year for each sample. Panel D shows the industry membership of each sample. Panel E gives the incidence of negative earnings (losses) for each sample as a percentage of total observations in a given year. Panel A: Number of firms in each sample Sample U.S. Canada Cross-listed Firms 6,761 717 206 88% 9% 3% Observations 37,758 3,367 974 90% 8% 2% Median years in sample 5 3 4 Panel B: Market value (U.S. dollars in millions) Sample U.S. Canada Cross-listed Mean $2,247.6 $536.7 $2,437.0 Median $195.4 $112.1 $550.4 Standard deviation $12,127.7 $1,523.6 $7,831.3 5 percentile $16.8 $13.0 $31.5 95 percentile $7,863.8 $2,254.4 $10,510.3 Panel C: Annual observations in each sample Year U.S. Canada Cross-listed Total 1990 2,518 172 44 2,734 1991 2,393 159 44 2,596 1992 2,537 155 50 2,742 1993 2,648 165 53 2,866 1994 3,146 237 58 3,441 1995 3,301 267 78 3,646 1996 3,537 306 92 3,935 1997 3,723 328 102 4,153 1998 3,598 352 110 4,060 1999 3,551 418 111 4,080 2000 3,467 423 118 4,008 2001 3,339 385 114 3,838 Total 37,758 3,367 974 42,099 (continued)

32
Table 3 (concluded)
Panel D: Industry membership in each sample* Industry U.S. Canada Cross-listed Total Dummy Financial services, real estate 8,674 437 71 9,182 naic1 23% 13% 7% 22% High-technology 8,894 654 202 9,750 naic2 24% 19% 21% 23% Transportation, utilities 2,607 169 51 2,827 naic3 7% 5% 5% 7% Mining, oil and gas, forestry 1,951 769 321 3,041 naic4 5% 23% 33% 7% Manufacturing, services, trade 15,632 1,338 329 17,299 naic5 41% 40% 34% 41% Total 37,758 3,367 974 42,099 100% 100% 100% 100% * This panel shows the distribution of observations for five industries. Industry dummy variables (naic1 – naic5) are constructed based on NAICS codes as follows: financial services and real estate = 2-digit codes 52 and 53; high-technology = 2-digit code 51, 3-digit codes 333, 334, and 4-digit code 5415; transportation and utilities = 2-digit codes 22, 48, and 49; mining, oil and gas, and forestry = 2-digit code 21, 3-digit codes 321 and 322; and other = all remaining observations not included in the other categories, predominantly manufacturing, wholesale and retail trade, and services. Panel E: Incidence of losses for each sample (per cent) Year U.S. Canada Cross-listed Total 1990 16.4 20.9 29.5 16.9 1991 19.6 24.5 38.6 20.2 1992 19.3 23.2 36.0 19.8 1993 19.6 18.2 32.1 19.8 1994 15.5 8.4 17.2 15.1 1995 16.0 14.2 26.9 16.1 1996 17.6 16.7 28.3 17.7 1997 17.5 16.2 31.4 17.8 1998 19.7 22.4 38.2 20.4 1999 19.5 22.7 30.6 20.1 2000 20.1 23.6 32.2 20.8 2001 27.0 32.2 37.7 27.9 Total 19.0 20.8 31.9 19.5

33
Table 4: Descriptive Statistics on Key Variables by Sample This table reports descriptive statistics on the key variables used in the regressions. U.S. Canada Cross-listed BOOK-TO-MARKET Mean 0.6934 0.9012 0.7964 Standard deviation 0.6056 0.8034 0.8436 Min 0.1285 0.1737 0.0473 Max 1.6854 2.2082 8.2916 EARNINGS-TO-PRICE Mean 0.0254 0.0275 -0.0070 Standard deviation 0.1734 0.2144 0.2831 Min -0.1777 -0.2403 -3.0395 Max 0.1440 0.2047 1.1459 LOG OF SIZE (US$ MM) Mean 5.8838 5.3551 6.6326 Standard deviation 2.0198 1.8237 2.0439 Min 2.9061 2.8621 1.8088 Max 9.4892 8.5030 12.1633 RETURN ON EQUITY Mean 0.0765 0.0533 0.0166 Standard deviation 0.3225 0.2060 0.2240 Min -0.3221 -0.3439 -0.9706 Max 0.2858 0.2744 0.8179 COST OF EQUITY Mean 0.0816 0.0743 0.0761 Standard deviation 0.0241 0.0252 0.0212 Min 0.0466 0.0450 0.0311 Max 0.1249 0.1341 0.1623 SALES GROWTH Mean 0.1821 0.3308 0.2730 Standard deviation 0.4530 0.8127 0.6960 Min -0.1338 -0.1708 -0.6770 Max 0.6759 1.3732 7.5434
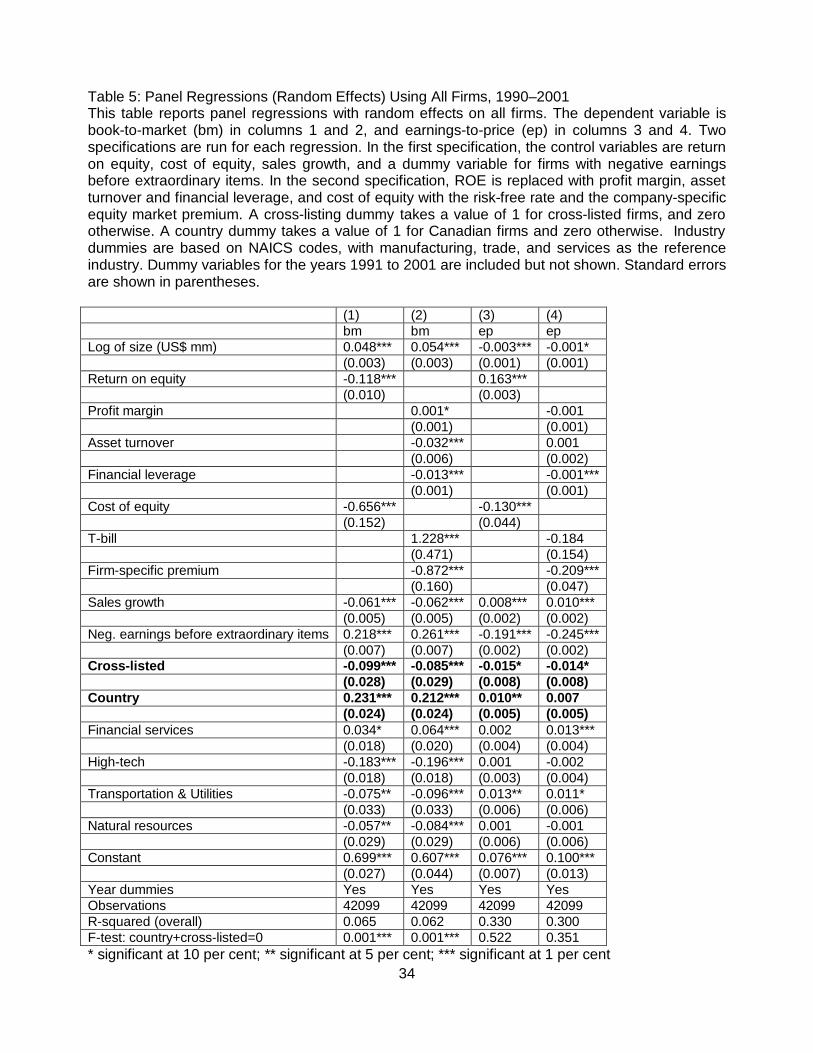
34
Table 5: Panel Regressions (Random Effects) Using All Firms, 1990–2001 This table reports panel regressions with random effects on all firms. The dependent variable is book-to-market (bm) in columns 1 and 2, and earnings-to-price (ep) in columns 3 and 4. Two specifications are run for each regression. In the first specification, the control variables are return on equity, cost of equity, sales growth, and a dummy variable for firms with negative earnings before extraordinary items. In the second specification, ROE is replaced with profit margin, asset turnover and financial leverage, and cost of equity with the risk-free rate and the company-specific equity market premium. A cross-listing dummy takes a value of 1 for cross-listed firms, and zero otherwise. A country dummy takes a value of 1 for Canadian firms and zero otherwise. Industry dummies are based on NAICS codes, with manufacturing, trade, and services as the reference industry. Dummy variables for the years 1991 to 2001 are included but not shown. Standard errors are shown in parentheses. (1) (2) (3) (4) bm bm ep ep Log of size (US$ mm) 0.048*** 0.054*** -0.003*** -0.001* (0.003) (0.003) (0.001) (0.001) Return on equity -0.118*** 0.163*** (0.010) (0.003) Profit margin 0.001* -0.001 (0.001) (0.001) Asset turnover -0.032*** 0.001 (0.006) (0.002) Financial leverage -0.013*** -0.001*** (0.001) (0.001) Cost of equity -0.656*** -0.130*** (0.152) (0.044) T-bill 1.228*** -0.184 (0.471) (0.154) Firm-specific premium -0.872*** -0.209*** (0.160) (0.047) Sales growth -0.061*** -0.062*** 0.008*** 0.010*** (0.005) (0.005) (0.002) (0.002) Neg. earnings before extraordinary items 0.218*** 0.261*** -0.191*** -0.245*** (0.007) (0.007) (0.002) (0.002) Cross-listed -0.099*** -0.085*** -0.015* -0.014* (0.028) (0.029) (0.008) (0.008) Country 0.231*** 0.212*** 0.010** 0.007 (0.024) (0.024) (0.005) (0.005) Financial services 0.034* 0.064*** 0.002 0.013*** (0.018) (0.020) (0.004) (0.004) High-tech -0.183*** -0.196*** 0.001 -0.002 (0.018) (0.018) (0.003) (0.004) Transportation & Utilities -0.075** -0.096*** 0.013** 0.011* (0.033) (0.033) (0.006) (0.006) Natural resources -0.057** -0.084*** 0.001 -0.001 (0.029) (0.029) (0.006) (0.006) Constant 0.699*** 0.607*** 0.076*** 0.100*** (0.027) (0.044) (0.007) (0.013) Year dummies Yes Yes Yes Yes Observations 42099 42099 42099 42099 R-squared (overall) 0.065 0.062 0.330 0.300 F-test: country+cross-listed=0 0.001*** 0.001*** 0.522 0.351 * significant at 10 per cent; ** significant at 5 per cent; *** significant at 1 per cent

35
Table 6: Panel Regressions (Random Effects) Using Canadian Firms, 1990–2001 This table reports panel regressions with random effects on book-to-market and earnings-to-price for Canadian firms, excluding U.S. firms. See Table 5 for a description of the regressions. Standard errors are shown in parentheses. (1) (2) (3) (4) bm Bm ep ep Log of size (US$ mm) 0.099*** 0.119*** -0.006*** -0.002 (0.013) (0.013) (0.002) (0.003) Return on equity -0.276*** 0.738*** (0.067) (0.017) Profit margin 0.001 0.001 (0.001) (0.001) Asset turnover -0.024 0.003 (0.029) (0.006) Financial leverage -0.022*** -0.001 (0.004) (0.001) Cost of equity -0.276 0.095 (0.788) (0.197) T-bill 1.482 0.330 (1.613) (0.501) Firm-specific premium -0.809 0.009 (0.956) (0.270) Sales growth -0.050*** -0.051*** -0.005 0.001 (0.013) (0.013) (0.003) (0.004) Neg. earnings before extraordinary items 0.212*** 0.309*** -0.059*** -0.299*** (0.033) (0.026) (0.009) (0.008) Cross-listed -0.124*** -0.136*** -0.011 -0.007 (0.040) (0.040) (0.009) (0.011) Financial services -0.073 -0.021 -0.026* -0.001 (0.102) (0.105) (0.016) (0.018) High-tech -0.295*** -0.298*** -0.002 -0.011 (0.080) (0.080) (0.013) (0.013) Transportation & Utilities -0.224 -0.238 0.003 0.017 (0.156) (0.156) (0.024) (0.025) Natural resources -0.066 -0.088 -0.018 -0.018 (0.074) (0.078) (0.012) (0.013) Constant 0.722*** 0.493** 0.023 0.049 (0.142) (0.215) (0.033) (0.063) Year dummies Yes Yes Yes Yes Observations 4341 4341 4341 4341 R-squared (overall) 0.064 0.064 0.484 0.303 * significant at 10 per cent; ** significant at 5 per cent; *** significant at 1 per cent

36
Table 7: Panel Regressions (Random Effects) Using All Firms, 1990–2001 This table reports panel regressions with random effects on book-to-market and earnings-to-price for all firms. See Table 5 for a description of the regressions. Two dummy variables are used to identify cross-listed firms: CROSSLO takes a value of 1 for cross-listed firms that are predominantly traded on the TSX, and zero otherwise. CROSSHI takes a value of 1 for cross-listed firms that are predominantly traded on a U.S. stock exchange, and zero otherwise. Standard errors are shown in parentheses. (1) (2) (3) (4) bm bm ep ep Log of size (US$ mm) 0.046*** 0.052*** -0.003*** -0.001* (0.003) (0.003) (0.001) (0.001) Return on equity -0.118*** 0.163*** (0.010) (0.003) Profit margin 0.001 -0.001 (0.001) (0.001) Asset turnover -0.030*** 0.001 (0.006) (0.002) Financial leverage -0.013*** -0.001*** (0.001) (0.001) Cost of equity -0.610*** -0.139*** (0.152) (0.044) T-bill 1.343*** -0.177 (0.472) (0.154) Firm-specific premium -0.827*** -0.221*** (0.160) (0.047) Sales growth -0.069*** -0.070*** 0.009*** 0.011*** (0.005) (0.005) (0.002) (0.002) Neg. earnings before extraordinary items 0.216*** 0.259*** -0.190*** -0.244*** (0.007) (0.007) (0.002) (0.002) Turnover mostly TSE -0.058* -0.042 -0.016* -0.016* (CROSSLO) (0.032) (0.033) (0.009) (0.009) Turnover mostly U.S. -0.194*** -0.176*** -0.015 -0.014 (CROSSHI) (0.043) (0.043) (0.012) (0.012) Country 0.220*** 0.201*** 0.010** 0.007 (0.024) (0.024) (0.005) (0.005) Financial services 0.037** 0.069*** 0.002 0.013*** (0.018) (0.020) (0.004) (0.004) High-tech -0.182*** -0.194*** 0.001 -0.002 (0.017) (0.018) (0.003) (0.004) Transportation & Utilities -0.071** -0.091*** 0.013** 0.011* (0.033) (0.033) (0.006) (0.006) Natural resources -0.052* -0.078*** -0.001 -0.001 (0.028) (0.029) (0.006) (0.006) Constant 0.702*** 0.602*** 0.077*** 0.100*** (0.027) (0.044) (0.007) (0.013) Year dummies Yes Yes Yes Yes Observations 41944 41944 41944 41944 R-squared (overall) 0.067 0.103 0.329 0.300 F-test: country+CROSSLO=0 0.001*** 0.001*** 0.513 0.345 F-test: country+CROSSHI=0 0.553 0.576 0.687 0.576 * significant at 10 per cent; ** significant at 5 per cent; *** significant at 1 per cent

37
Table 8: Panel Regressions (Random Effects) Using Canadian Firms, 1990–2001 This table reports panel regressions with random effects on book-to-market and earnings-to-price for Canadian firms, excluding U.S. firms. See Table 5 for a description of the regressions. Two dummy variables are used to identify cross-listed firms: CROSSLO takes a value of 1 for cross-listed firms that are predominantly traded on the TSX, and zero otherwise. CROSSHI takes a value of 1 for cross-listed firms that are predominantly traded on a U.S. stock exchange, and zero otherwise. Standard errors are shown in parentheses. (1) (2) (3) (4) bm bm ep ep Log of size (US$ mm) 0.087*** 0.109*** -0.006** -0.002 (0.013) (0.013) (0.003) (0.003) Return on equity -0.281*** 0.759*** (0.069) (0.018) Profit margin -0.001 0.001 (0.001) (0.001) Asset turnover -0.004 0.002 (0.028) (0.007) Financial leverage -0.021*** -0.001 (0.004) (0.001) Cost of equity 0.216 0.074 (0.823) (0.208) T-bill 1.081 0.379 (1.779) (0.556) Firm-specific premium 0.141 -0.123 (0.972) (0.281) Sales growth -0.080*** -0.080*** -0.001 0.004 (0.014) (0.014) (0.004) (0.004) Neg. earnings before extraordinary items 0.196*** 0.294*** -0.052*** -0.294*** (0.033) (0.026) (0.009) (0.008) Turnover mostly TSE -0.086* -0.101** -0.011 -0.008 (CROSSLO) (0.044) (0.045) (0.010) (0.012) Turnover mostly U.S. -0.214*** -0.232*** -0.013 -0.006 (CROSSHI) (0.058) (0.058) (0.013) (0.015) Financial services -0.050 0.016 -0.028* -0.004 (0.098) (0.101) (0.016) (0.018) High-tech -0.280*** -0.276*** -0.001 -0.011 (0.077) (0.078) (0.013) (0.014) Transportation & Utilities -0.201 -0.206 0.003 0.014 (0.149) (0.149) (0.025) (0.025) Natural resources -0.042 -0.048 -0.022* -0.021 (0.072) (0.075) (0.012) (0.014) Constant 0.697*** 0.523** 0.023 0.049 (0.146) (0.234) (0.035) (0.070) Year dummies Yes Yes Yes Yes Observations 4186 4186 4186 4186 R-squared (overall) 0.067 0.067 0.486 0.300 * significant at 10 per cent; ** significant at 5 per cent; *** significant at 1 per cent
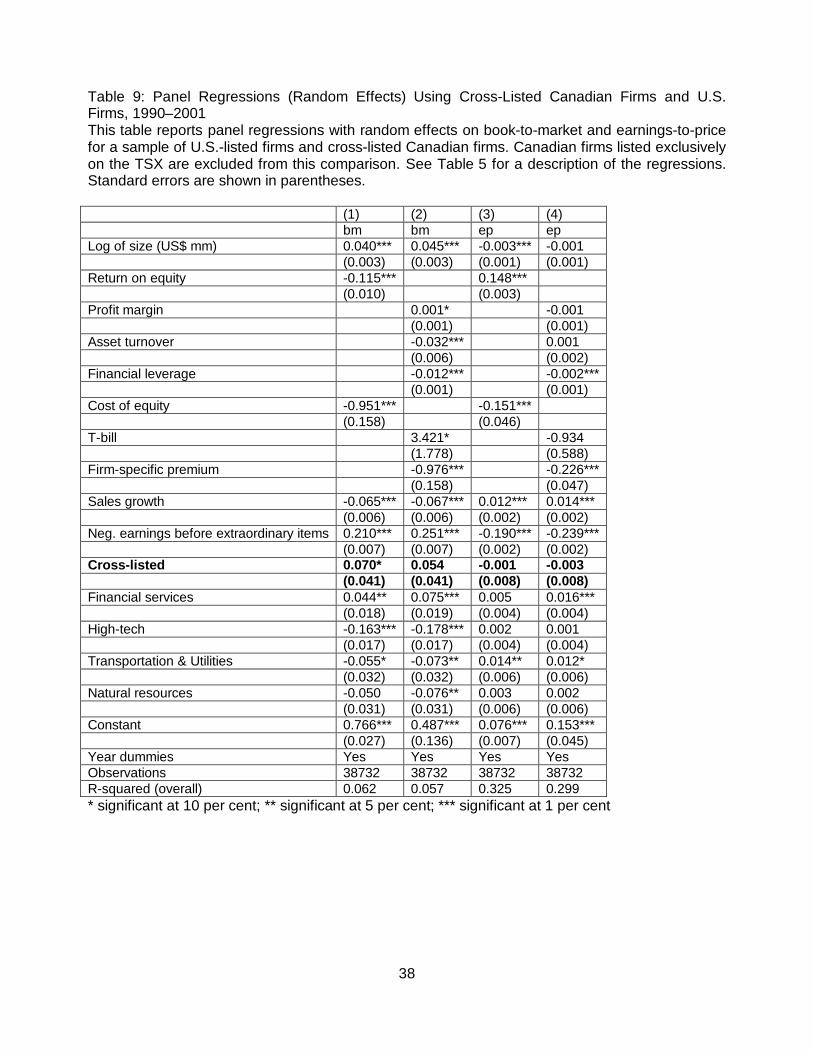
38
Table 9: Panel Regressions (Random Effects) Using Cross-Listed Canadian Firms and U.S. Firms, 1990–2001 This table reports panel regressions with random effects on book-to-market and earnings-to-price for a sample of U.S.-listed firms and cross-listed Canadian firms. Canadian firms listed exclusively on the TSX are excluded from this comparison. See Table 5 for a description of the regressions. Standard errors are shown in parentheses. (1) (2) (3) (4) bm bm ep ep Log of size (US$ mm) 0.040*** 0.045*** -0.003*** -0.001 (0.003) (0.003) (0.001) (0.001) Return on equity -0.115*** 0.148*** (0.010) (0.003) Profit margin 0.001* -0.001 (0.001) (0.001) Asset turnover -0.032*** 0.001 (0.006) (0.002) Financial leverage -0.012*** -0.002*** (0.001) (0.001) Cost of equity -0.951*** -0.151*** (0.158) (0.046) T-bill 3.421* -0.934 (1.778) (0.588) Firm-specific premium -0.976*** -0.226*** (0.158) (0.047) Sales growth -0.065*** -0.067*** 0.012*** 0.014*** (0.006) (0.006) (0.002) (0.002) Neg. earnings before extraordinary items 0.210*** 0.251*** -0.190*** -0.239*** (0.007) (0.007) (0.002) (0.002) Cross-listed 0.070* 0.054 -0.001 -0.003 (0.041) (0.041) (0.008) (0.008) Financial services 0.044** 0.075*** 0.005 0.016*** (0.018) (0.019) (0.004) (0.004) High-tech -0.163*** -0.178*** 0.002 0.001 (0.017) (0.017) (0.004) (0.004) Transportation & Utilities -0.055* -0.073** 0.014** 0.012* (0.032) (0.032) (0.006) (0.006) Natural resources -0.050 -0.076** 0.003 0.002 (0.031) (0.031) (0.006) (0.006) Constant 0.766*** 0.487*** 0.076*** 0.153*** (0.027) (0.136) (0.007) (0.045) Year dummies Yes Yes Yes Yes Observations 38732 38732 38732 38732 R-squared (overall) 0.062 0.057 0.325 0.299 * significant at 10 per cent; ** significant at 5 per cent; *** significant at 1 per cent

39
Table 10: Panel Regressions (Random Effects) Using Cross-Listed Canadian Firms and U.S. Firms, 1990–2001 This table reports panel regressions with random effects on book-to-market and earnings-to-price for a sample of U.S.-listed firms and cross-listed Canadian firms. Canadian firms listed exclusively on the TSX are excluded from this comparison. See Table 5 for a description of the regressions. Two dummy variables are used to identify cross-listed firms: CROSSLO takes a value of 1 for cross-listed firms that are predominantly traded on the TSX, and zero otherwise. CROSSHI takes a value of 1 for cross-listed firms that are predominantly traded on a U.S. stock exchange, and zero otherwise. Standard errors are shown in parentheses. (1) (2) (3) (4) bm bm ep ep Log of size (US$ mm) 0.040*** 0.045*** -0.003*** -0.001 (0.003) (0.003) (0.001) (0.001) Return on equity -0.115*** 0.148*** (0.010) (0.003) Profit margin 0.001* -0.001 (0.001) (0.001) Asset turnover -0.032*** 0.001 (0.006) (0.002) Financial leverage -0.012*** -0.002*** (0.001) (0.001) Cost of equity -0.947*** -0.151*** (0.158) (0.046) T-bill 3.080* -0.937 (1.780) (0.588) Firm-specific premium -0.970*** -0.226*** (0.158) (0.047) Sales growth -0.065*** -0.067*** 0.012*** 0.014*** (0.006) (0.006) (0.002) (0.002) Neg. earnings before extraordinary items 0.210*** 0.251*** -0.190*** -0.239*** (0.007) (0.007) (0.002) (0.002) Turnover mostly TSE 0.129*** 0.113*** 0.001 -0.002 (CROSSLO) (0.043) (0.043) (0.009) (0.010) Turnover mostly U.S. -0.041 -0.054 -0.002 -0.004 (CROSSHI) (0.050) (0.050) (0.012) (0.012) Financial services 0.044** 0.075*** 0.005 0.016*** (0.018) (0.019) (0.004) (0.004) High-tech -0.162*** -0.177*** 0.002 0.001 (0.017) (0.017) (0.004) (0.004) Transportation & Utilities -0.055* -0.074** 0.014** 0.012* (0.032) (0.032) (0.006) (0.006) Natural resources -0.049 -0.075** 0.003 0.002 (0.031) (0.031) (0.006) (0.006) Constant 0.766*** 0.513*** 0.076*** 0.153*** (0.027) (0.136) (0.007) (0.045) Year dummies Yes Yes Yes Yes Observations 38732 38732 38732 38732 R-squared (overall) 0.062 0.058 0.325 0.299 * significant at 10 per cent; ** significant at 5 per cent; *** significant at 1 per cent

40
Appendix A: Variable Definitions
Asset turnover = total sales/total assets = DATA12/DATA6
Book-to-market = book value per share/price = [DATA60/( DATA25*DATA27)]/P
Cost of equity = treasury bill rate + ß * (return on market index – treasury bill rate)
Earnings-to-price = [earnings before extraordinary items per common share/cumulative
adjustment factor]/ price per share = (DATA58/DATA27)/P. If DATA58 is not available, earnings-
to-price is computed as earnings before extraordinary items [DATA18/(DATA25*DATA27)]/ P
Financial leverage = total assets/common equity = DATA6/DATA60
Price per share (P) = closing price at the end of the first quarter of each year (e.g., 31 March)
(DATA14)
Profit margin = net income before extraordinary items/total sales = DATA18/DATA12
Return on equity (ROE) = net income before extraordinary items/common equity =
DATA18/DATA60
Risk-adjusted stock market return = (total equity market return over past year – T-bill
rate)/[standard deviation of (total equity market return over past year – T-bill rate)]
Sales growth = (salest-2/salest)^0.5 – 1
Shares outstanding = number of shares outstanding at year end*cumulative adjustment factor =
DATA25*DATA27


Bank of Canada Working PapersDocuments de travail de la Banque du Canada
Working papers are generally published in the language of the author, with an abstract in both officiallanguages.Les documents de travail sont publiés généralement dans la langue utilisée par les auteurs; ils sontcependant précédés d’un résumé bilingue.
Copies and a complete list of working papers are available from:Pour obtenir des exemplaires et une liste complète des documents de travail, prière de s’adresser à:
Publications Distribution, Bank of Canada Diffusion des publications, Banque du Canada234 Wellington Street, Ottawa, Ontario K1A 0G9 234, rue Wellington, Ottawa (Ontario) K1A 0G9E-mail: [email protected] Adresse électronique : [email protected] site: http://www.bankofcanada.ca Site Web : http://www.banqueducanada.ca
20042004-16 The Effect of Economic News on Bond Market Liquidity C. D’Souza and C. Gaa
2004-15 The Bank of Canada’s Business OutlookSurvey: An Assessment M. Martin and C. Papile
2004-14 National Saving–Investment Dynamics andInternational Capital Mobility F. Pelgrin and S. Schich
2004-13 Contraintes de liquidité et capital humaindans une petite économie ouverte F. Pelgrin
2004-12 Durées d’utilisation des facteurs et fonction deproduction : une estimation par la méthode desmoments généralisés en système E. Heyer, F. Pelgrin, and A. Sylvain
2004-11 Estimating New Keynesian Phillips CurvesUsing Exact Methods L. Khalaf and M. Kichian
2004-10 Public Venture Capital and Entrepreneurship O. Secrieru and M. Vigneault
2004-9 Estimating Policy-Neutral Interest Rates for CanadaUsing a Dynamic Stochastic General-EquilibriumFramework J.-P. Lam and G. Tkacz
2004-8 The Economic Theory of Retail Pricing: A Survey O. Secrieru
2004-7 The Demand for Money in a Stochastic Environment J. Atta-Mensah
2004-6 Bank Capital, Agency Costs, and Monetary Policy C. Meh and K. Moran
2004-5 Structural Change and Forecasting Long-Run Energy Prices J.-T. Bernard, L. Khalaf, and M. Kichian
2004-4 A Structural Small Open-Economy Modelfor Canada S. Murchison, A. Rennison, and Z. Zhu
2004-3 Modélisation<< PAC>> du secteur extérieurde l’économie américaine M.-A. Gosselin and R. Lalonde
2004-2 Exact Tests of Equal Forecast Accuracy with anApplication to the Term Structure of Interest Rates R. Luger