Embed Size (px)
Citation preview

International Drug Prices: Evidence from STRIDE
Jonathan P. Caulkins1,2
Abstract
Most of the principal illicit drugs used in the United States are produced overseas, so international markets for these substances bear on U.S. drug availability, prices, use, and consequences. Prices are a key characteristic of these markets, but international drug price information in the open literature primarily consists of summary or representative figures cited in official publications. This paper seeks to augment that information base by systematically examining international price observations in the Drug Enforcement Administration’s STRIDE database. Results are generally consistent with conventional reporting of these prices. Some evidence of quantity discounts (alternately, price markups along the distribution chain) is found in source and transshipment countries. Acknowledgements Data analyzed in this paper were provided by the Office of National Drug Control Policy (ONDCP). Methods employed were developed while the author worked at RAND’s Drug Policy Research Center. Findings and those of the author alone, not of the ONDCP, Carnegie Mellon University, or RAND. 1Carnegie Mellon University H. John Heinz III School of Public Policy and Management, 5000 Forbes Ave., Pittsburgh, PA 15213-3890, [email protected]. 2RAND Drug Policy Research Center, PO Box 2138, Santa Monica, CA 90407-2138.
4/4/2003 1

INTRODUCTION
Illicit drugs are distributed in markets by individuals and organizations motivated by money (profit), so price data are relevant for a variety of policy analysis and evaluation purposes (Caulkins and Reuter, 1998). Given limitations on data pertaining to other quantities (e.g., quantities trafficked and consumed) and the fact that drug enforcement agents routinely negotiate drug transactions (undercover buys), there has been great interest over the last decade in developing better estimates of illicit drug prices, particularly price trends. Analysis to date has focused on prices inside consumer countries (primarily the United States, but also to a lesser extent Europe and Australia). This paper examines data from outside the 50 U.S. states contained in the DEA’s System to Retrieve Information from Drug Evidence (STRIDE) (Frank, 1987).
STRIDE is an administrative data set that has recorded acquisitions analyzed in DEA laboratories since 1977. Specifically, STRIDE records information on the type of drug acquired, the amount acquired, purity, date and location of acquisition, price paid (for a purchase), and the DEA office associated with the transaction, among other variables. Such transaction-level information on price and purity is very attractive to analysts, and the data have been used to estimate market trends, price elasticities, and a variety of other uses.
STRIDE data are not without problems and critics (Manski et al., 2001; Horowitz, 2001). However, domestic price series produced from STRIDE seem to have validity, inasmuch as they correlate strongly with independently generated data sets that are theoretically related, such as self-reported marijuana use among high school seniors (Caulkins 1999), emergency room mentions for both cocaine and heroin from the Drug Abuse Warning Network (DAWN) (Caulkins, 2001b), medical examiner mentions of cocaine and urinalysis results for arrestees (ONDCP, 1992), and with urinalysis results in the workplace generally and admissions for cocaine treatment (Crane et al., 1997). But the fact remains that the data come from a convenience sample derived from enforcement imperatives. Conventional wisdom concerning international drug prices can be summarized as follows.
• Purity is higher and prices dramatically lower in third world source countries than in first world final markets.
• Prices in transshipment countries are intermediate between those in source countries and final market countries and perhaps are lower than they otherwise would be because of availability stemming from leakage from those transshipments.
• European cocaine prices, European heroin prices, and U.S. cocaine prices are roughly similar (on the order of $100 per gram); U.S. heroin prices are an order of magnitude higher.
• Heroin is more expensive in source countries in the Western Hemisphere than in Asia.
Findings here are generally consistent with these broad patterns, but there are some interesting particulars.
4/4/2003 2
ANALYSIS OF STRIDE DATA
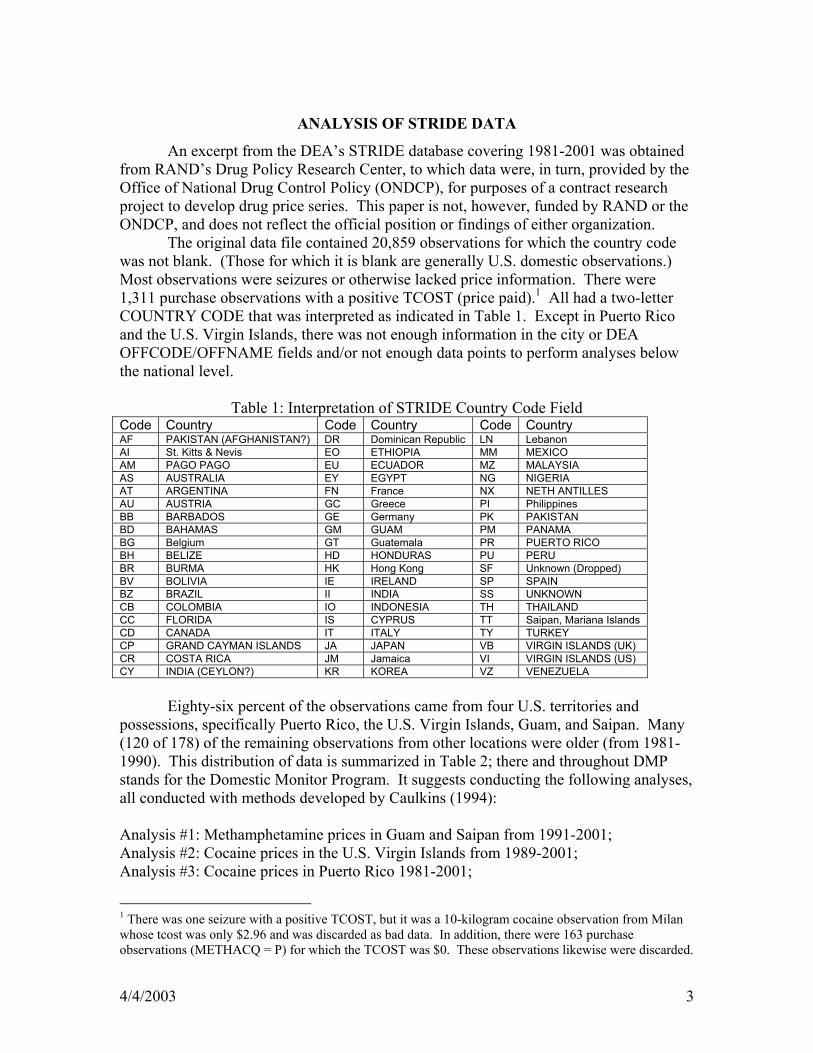
An excerpt from the DEA’s STRIDE database covering 1981-2001 was obtained from RAND’s Drug Policy Research Center, to which data were, in turn, provided by the Office of National Drug Control Policy (ONDCP), for purposes of a contract research project to develop drug price series. This paper is not, however, funded by RAND or the ONDCP, and does not reflect the official position or findings of either organization. The original data file contained 20,859 observations for which the country code was not blank. (Those for which it is blank are generally U.S. domestic observations.) Most observations were seizures or otherwise lacked price information. There were 1,311 purchase observations with a positive TCOST (price paid).1 All had a two-letter COUNTRY CODE that was interpreted as indicated in Table 1. Except in Puerto Rico and the U.S. Virgin Islands, there was not enough information in the city or DEA OFFCODE/OFFNAME fields and/or not enough data points to perform analyses below the national level.
Table 1: Interpretation of STRIDE Country Code Field Code Country Code Country Code Country AF PAKISTAN (AFGHANISTAN?) DR Dominican Republic LN Lebanon AI St. Kitts & Nevis EO ETHIOPIA MM MEXICO AM PAGO PAGO EU ECUADOR MZ MALAYSIA AS AUSTRALIA EY EGYPT NG NIGERIA AT ARGENTINA FN France NX NETH ANTILLES AU AUSTRIA GC Greece PI Philippines BB BARBADOS GE Germany PK PAKISTAN BD BAHAMAS GM GUAM PM PANAMA BG Belgium GT Guatemala PR PUERTO RICO BH BELIZE HD HONDURAS PU PERU BR BURMA HK Hong Kong SF Unknown (Dropped) BV BOLIVIA IE IRELAND SP SPAIN BZ BRAZIL II INDIA SS UNKNOWN CB COLOMBIA IO INDONESIA TH THAILAND CC FLORIDA IS CYPRUS TT Saipan, Mariana Islands CD CANADA IT ITALY TY TURKEY CP GRAND CAYMAN ISLANDS JA JAPAN VB VIRGIN ISLANDS (UK) CR COSTA RICA JM Jamaica VI VIRGIN ISLANDS (US) CY INDIA (CEYLON?) KR KOREA VZ VENEZUELA Eighty-six percent of the observations came from four U.S. territories and possessions, specifically Puerto Rico, the U.S. Virgin Islands, Guam, and Saipan. Many (120 of 178) of the remaining observations from other locations were older (from 1981-1990). This distribution of data is summarized in Table 2; there and throughout DMP stands for the Domestic Monitor Program. It suggests conducting the following analyses, all conducted with methods developed by Caulkins (1994): Analysis #1: Methamphetamine prices in Guam and Saipan from 1991-2001; Analysis #2: Cocaine prices in the U.S. Virgin Islands from 1989-2001; Analysis #3: Cocaine prices in Puerto Rico 1981-2001;
1 There was one seizure with a positive TCOST, but it was a 10-kilogram cocaine observation from Milan whose tcost was only $2.96 and was discarded as bad data. In addition, there were 163 purchase observations (METHACQ = P) for which the TCOST was $0. These observations likewise were discarded.
4/4/2003 3
Analysis #4: Heroin prices in Puerto Rico 1981-2001; Analysis #5: All other price observations.
Table 2a: Distribution of 1981-2001 International Purchase Observations with Positive Purchase Price (TCOST) by Drug Category
Place Meth MJ Heroin Cocaine DMP Total Puerto Rico 0 7 179 273 283 742 US Virgin Islands 0 2 14 187 8 211 Guam 88 2 23 8 0 121 Saipan 55 4 0 0 0 59 All Other 14 7 104 48 5 178
Table 2b: Distribution of 1991-2001 International Purchase Observations with Positive Purchase Price (TCOST) by Drug Category
Place Meth MJ Heroin Cocaine DMP Total Puerto Rico 0 6 108 155 283 552 US Virgin Islands 0 2 13 176 8 199 Guam 85 0 8 2 0 95 Saipan 55 4 0 0 0 59 All Other 12 0 27 14 5 58 Analysis #1: Methamphetamine Prices in Guam and Saipan
For Guam and Saipan there were 85 and 55, respectively, methamphetamine (DRUGCAT = 111) observations between the years 1991-2001. Analysis was restricted to methamphetamine hydrochloride (DRUGCODE = 1105D005), thereby excluding 4 (2) DL-METHA observations from Guam (Saipan), in part because they had lower prices per raw gram.2 Six observations with weight (variable name: AMOUNT) of just 0.001 grams were excluded (4 for Guam; 2 for Saipan). In addition, one 85.2 gram, $26,000 purchase in Saipan in 1992 was excluded because it was an order of magnitude larger than the next largest purchase (which was only 8.096 grams).
There were a moderate number of zero potency observations (23 in Guam; 17 in Saipan), but very few positive but low potency observations. Guam had three (13 percent, 16 percent, and 20 percent), but the next lowest was 81 percent. Saipan had one of 74 percent, and the next lowest was 90 percent. Regressions suggested that actual purity was not a significant predictor of price. For example, dummy variables for “low but positive” potency were not significant predictors of price in Guam. It was surmised that zero potency observations could be treated as missing values, rather than true zeros; that the occasional low potency observations were likely “rip-offs”; and that among high purity observations there was so little variation in purity that it was sensible to adopt the simpler approach of estimating price per raw gram, with no purity adjustment.
Dummy variables for city were not significant predictors of price in Guam. There was no variation in the city field in Saipan.
2 Three of the four lowest prices per raw gram in Guam were for DL Metha.
4/4/2003 4

Regressions indicated a clear relationship between price per raw gram and amount purchased, as in Caulkins and Padman (1993). In particular, a log-linear model (amount paid proportional to amount purchased raised to an exponent) fit the data well over most if not all of the quantity range. There was some evidence that in Guam the one-parameter log-linear model broke down over the full range of amounts considered (0.029–10.1 grams), with a smaller exponent (steeper quantity discounts) applying at the low end of the range than at the high end. At times, Caulkins (1994) found better results when the one-parameter log-linear model was applied over no more than two orders of magnitude variation in raw quantity, so the 14 observations with amounts below 0.095 grams were dropped when estimating the final price series in Guam. The best-fitting quantity discount parameters were β = 0.61977 and 0.63233 in Guam and Saipan, respectively. Standardized individual transaction prices per raw gram were calculated as TCOST/(AMOUNTβ).
Table 3 summarizes the results by year, including number of observations (in total and with positive purity), average purity for observations with positive purity, average price per raw gram, and the average price per pure gram computed simply as the ratio of the average standardized price per raw gram divided by the average purity for observations with positive purity. Prices are adjusted to 2001 dollars using the consumer price index.
Table 3: Methamphetamine Purity & Price per Gram in Guam & Saipan (2001$)
Guam Saipan
Year
# of Obs Total & (Purity>0)
Average Purity
Price per Raw Gram
Raw Price Divided by Purity
# of Obs Total & (Purity>0)
Average Purity
Price per Raw Gram
Raw Price Divided by Purity
1992 4 (2) 89% $1,846 $2,086 0 1993 0 0 1994 1 (0) $1,015 0 1995 1 98% $868 $886 4 (1) 99% $732 $739 1996 3 98% $773 $789 13 (10) 98% $871 $888 1997 3 98% $531 $540 7 (3) 95% $995 $1,051 1998 17 (14) 92% $545 $596 5 99% $798 $809 1999 4 (3) 97% $814 $842 11 (5) 97% $843 $867 2000 11 89% $715 $804 8 94% $760 $809 2001 21 92% $814 $881 2 97% $714 $739
Perhaps the most striking thing about these prices is how much higher they are
than those reported for the United States generally by the ONDCP (2001a, 23), and shown in Figure 1. It appears that despite Guam’s sometimes-reported role as a transshipment country for Asian “ice” or crystal meth (DEA, 2002), local methamphetamine prices are not lower in Guam than in the United States. It is also worth noting the absence of sharp price differences between Guam and Saipan, which one might think could exist since arbitrage between two separate islands might be more difficult than between, say, two different cities on the U.S. mainland, and such price differences are known to exist within the United States (Caulkins, 1994, 1995).
4/4/2003 5

Figure 1: Price per Pure Gram of Methamphetamine is Higher in Guam and Saipan than on the US Mainland
$8
$6 $4
$2
$0
00
00
00
00
$1,000
$1,200
1994 1995 1996 1997 1998 1999 2000 2001 2002
GuamSaipanUS Mainland (ONDCP)
Analysis #2: Cocaine prices in the US Virgin Islands from 1989-2001
There were 186 cocaine (DRUGCAT = 620) observations from the U.S. Virgin Islands between the years 1989-2001. All were cocaine or cocaine hydrochloride, not base, so no distinction was made among types of cocaine. Four very small observations were dropped (3 of 0.001 grams, one of 0.04 grams) from the analysis.
In the analysis of purity, eleven observations with very low potency (10 of zero, one of 2.7 percent) were omitted. All other observations had potencies above 22 percent and most were considerably higher than that. It seems likely that the zero purity observations in fact represent missing values, and the 2.7 percent observation may actually have been 27 percent, since no other potency was reported with a non-zero tenths of a percent digit. Descriptive statistics on purity are given in Table 4.
Table 4: Purity STRIDE Cocaine Observations in the US Virgin Islands over Time
Year
Observations w/ Purity >5%
1st Quartile of Purity
Median Purity
3rd Quartile of Purity
1989 3 78% 80% 82% 1990 3 59% 70% 85% 1991 13 81% 88% 90% 1992 14 79% 84% 89% 1993 16 49% 61.5% 75.5% 1994 10 81% 84% 86% 1995 9 76% 88% 93% 1996 8 72.5% 79.5% 82.5% 1997 9 80% 84% 84% 1998 29 73% 82% 86% 1999 35 73% 80% 86% 2000 14 67% 78.5% 84% 2001 8 71.5% 80.5% 83%
4/4/2003 6

Most observations were from St. Thomas (98) and St. Croix (40), but there were some from Christiansted (19), Frederiksted (8), and St. John Island (6). However, there was no evidence that purity or price varied by location, so dummy variables for location were excluded in the final analysis.
There was likewise no evidence that purity varied by transaction size and minimal variation over time, except that it was lower in 1993. Hence, expected purity (Caulkins, 1994) was estimated simply as the average purity in the Virgin Islands as a whole for that year. This estimate necessarily meant that the fit obtained regressing on raw quantity was identical to that obtained regressing on expected pure quantity, because the purity variation over time was redundant with the year dummy variables. In particular, the exponent in the transaction size adjustment turned out to be 0.675.3 So the standardized price per raw gram was calculated as TCOST/(AMOUNT0.675) and the standardized price per expected pure gram was calculated as TCOST/((Expected Purity * AMOUNT)0.675). The results are summarized in Table 5 and compared with U.S. mainland prices in Figure 2, specifically with the simple average of the quarterly figures given by ONDCP (2001b) for the standard and alternate price estimation methods. For technical reasons the alternate ONDCP method is preferred (Caulkins, 1994), suggesting little difference in cocaine prices between the U.S. Virgin Islands and the U.S. mainland, particularly given that the relevant price series for the mainland are for “small users (less than 1 pure gram)” vs. purchases of one pure gram for the Virgin Islands.
Table 5: Price of Cocaine in the US Virgin Islands over Time
Average Standardized Price
Year
Number of
Observations
Per Raw Gram Per Expected Pure Gram
1989 3 $230.93 $268.46 1990 3 $180.85 $230.08 1991 13 $130.52 $142.28 1992 14 $126.40 $142.18 1993 16 $110.00 $152.72 1994 13 $112.49 $126.54 1995 9 $119.85 $130.65 1996 8 $71.03 $82.93 1997 9 $105.87 $119.09 1998 37 $110.00 $125.76 1999 35 $74.04 $86.08 2000 14 $95.96 $112.99 2001 8 $93.89 $108.69
3 As in Caulkins (1994), simply regressing log of amount paid on log of raw quantity and log purity gave a statistically significant but implausibly small coefficient for log purity – just 0.299 vs. 0.680 for log raw quantity – confirming that modeling price as a function of actual pure quantity is problematic.
4/4/2003 7

Figure 2: Cocaine Prices in the Virgin Islands and the U.S. Mainland (2001$)
$0
$50
$100
$150
$200
$250
$300
1988 1990 1992 1994 1996 1998 2000 2002
Virgin Islands ($/raw gram)Virgin Islands ($/expected pure gram)US Mainland ($/pure gram -- alternate est)US Mainland ($/pure gram -- standard est)
Analysis #3: Cocaine Prices in Puerto Rico
There were 273 cocaine (DRUGCAT = 620) observations from Puerto Rico between the years1981-2001. All were cocaine or cocaine hydrochloride, not base, so again no distinction was made among types of cocaine.
Two observations with weight less than 0.1 grams were dropped. At the other end of the spectrum, the 16 observations of more than about 1/8 kilogram (specifically 135 grams) were excluded, because the one-parameter log-linear adjustment for quantity discounts is unlikely to remain valid above that point. Specifically, that excluded one observation of 160 grams, one of 187 grams, 5 roughly half-kilogram observations, and nine roughly one-kilogram observations. The 14 half-kilo and up observations were, with two exceptions, all from 1990-1993 and mostly from 1991. One exception was a 1999 observation that looks otherwise normal. The other exception was a 1986 observation that is clearly a typo (TCOST = $512 implying a price per gram of just $0.20).
Discarding that obvious outlier, the other 13 large purchase observations are summarized in Table 6. It appears from Figure 3 that kilogram purchases are noticeably more pure and less expensive per kilogram (even without adjusting for purity) than are half-kilogram purchases, at least if one excludes the February 5th, 1990 observation, which occurred during the late-1989/early-1990 cocaine shortage and consequent price spike (Crane et al., 1997). (Figure 3 also excludes the 1999 observation since it occurs so much later.)
4/4/2003 8

Table 6: Half-Kilogram and Kilogram Cocaine Purchases in Puerto Rico
Date city Amount (Grams)
TCOST (Dollars)
POTENCY (Percent)
Raw Price per Kilogram
Price per Pure
Kilogram 2/5/1990 CAROLINA, SAN JUAN 995 19000 24.0 $19,095 $79,564
10/18/1990 SANTURCE, SAN JUAN 501.2 11000 85.0 $21,947 $25,820 1/17/1991 HATO REY, SAN JUAN 500.9 10500 63.0 $20,962 $33,273 4/2/1991 PONCE, PONCE 499.6 10000 73.0 $20,016 $27,419
5/24/1991 PONCE, PONCE 1001 14500 95.0 $14,486 $15,248 7/10/1991 1005 11000 91.0 $10,945 $12,028 9/20/1991 SAN JUAN, SAN JUAN 1005 16000 91.0 $15,920 $17,495 10/9/1991 SAN JUAN, SAN JUAN 1008 14500 83.0 $14,385 $17,331 12/6/1991 HATO REY, SAN JUAN 489.1 5000 75.0 $10,223 $13,630
12/12/1991 CAGUAS, GUAYAMA 994 12000 92.0 $12,072 $13,122 9/14/1991 999.1 16000 93.0 $16,014 $17,220 1/23/1993 SAN JUAN, SAN JUAN 1000 10000 88.0 $10,000 $11,364 7/23/1999 BAYAMON, SAN JUAN 997.3 7000 64.0 $7,019 $10,967
Figure 3: Kilogram Cocaine Purchases in Puerto Rico Between October 1990 – January
1993 Appear to be Less Expensive, per Unit Weight, and More Pure Than Are Half-Kilogram Purchases
$0
$5,000
$10,000
$15,000
$20,000
$25,000
60% 70% 80% 90% 100%
Purity
Pric
e/K
g (N
ot A
djus
ted
for P
urity
)
Half-Kilo PurchasesKilogram Purchases
4/4/2003 9

Of the 255 observations with weights between 0.1 and 135 grams, three were excluded as outliers (Table 7). The first is suspicious because the 11 other observations for that quantity were between $800 - $4,000, suggesting that perhaps the true TCOST was $1,000, not $10,000. The second had an abnormally high potency for its time (next highest was 65 percent) and price per gram (next highest was $432) and the smallest amount by a factor of 5. The third was probably actually a heroin observation because it was flagged as being a Domestic Monitor Program observations (MONFLAG = ‘M’), had a heroin signature program entry (SIGNATURE = ‘HE4’), and the amount was two orders of magnitude smaller than for other cocaine observations in 1991.
Table 7: Outliers Excluded from Cocaine Price Analysis for Puerto Rico Date Tcost Amount Potency Price/gram
6/26/81 $10,000 21 84% $476 7/20/83 $300 0.3 90% $1,000
11/27/91 $50 0.27 3.4% $185 Excluding these left 273 – 2 – 16 – 3 = 252 observations from which price trends could be produced. Eleven had zero purity, mostly from “Pas Piedras, Humacao”. Descriptive statistics on purity for the others are given in Table 8. Table 8: Purity of 0.1 – 135 Gram Cocaine Purchases in Puerto Rico
Year
Number of Observations
1st Quartile of Purity
Median Purity
3rd Quartile of Purity
1981 11 11 21 28 1982 3 43 89 89 1983 17 27 46 51 1984 17 42 49 63 1985 7 22 30 61 1986 15 48 52 62 1987 18 68 87.5 93 1988 12 59 74 84 1989 6 58 74 77 1990 5 55 56 69 1991 11 61 89 90 1992 21 82 86 89 1993 4 35 64 86.5 1994 9 80 86 89 1995 24 51 80 85 1996 6 21 78.5 89 1997 5 80 80 84 1998 14 69 84.5 91 1999 17 79 86 90 2000 14 72 81 87 2001 16 72 83.5 87.5
The city field had 42 different cities, many of which had just one or a few
observations, so they were collapsed into “regions” based on the second half of the city record. (For example, “Hato Rey, San Juan” was recoded as simply “San Juan”.) The resulting distribution of observations is given in Table 9. Note: five observations were missing city information. There was some slight evidence that purity varied by location
4/4/2003 10

(lower in Guayama than San Juan). Purity did depend on transaction size, with higher purity for larger transactions. Therefore, time and location dummies were included in the analysis.
Table 9: Number of Cocaine Purchases in Puerto Rico, by “Region” City Obs included
AGUADILLA 5 ARECIBO 5
CAYO SANTIAGO 6 GUAYAMA 46 HUMACAO 19
JUANA DIAZ 5 MAYAGUEZ 4
MISSING 5 PONCE 28
SAN JUAN 129
As with the analysis for the Virgin Islands, purity is not a good predictor of the amount paid. The coefficient on purity is statistically insignificant and negative when simply regressing log purchase price on log amount and log purity. Instead, price series were created standardizing price per raw gram (TCOST/(AMOUNT0.82861)) and per expected pure gram (TCOST/((Expected Purity * AMOUNT)0.77927)), where expected purity is estimated by regressing log purity on log quantity, dummy variables for location, and dummy variables for location. The results are summarized in Table 10 and compared to mainland prices (again from ONDCP, 2001b) in Figure 4. Prices appear similar to those on the mainland in the 1980s but lower in the in 1990s.
Table 10: Price of Cocaine in Puerto Rico Over Time (2001$)
# of Observations Average Purity of Average Standardized Price per Year Total
w/ Positive Purity
All Obs.
Obs w/ Purity > 0
Price/Raw Gram
Price/Expected Pure Gram
Avg Price per Raw Gram Over Average Purity
1981 11 11 25.2% 25.2% $227 $1,027 $901 1982 3 3 73.7% 73.7% $302 $452 $410 1983 17 17 43.9% 43.9% $334 $762 $762 1984 17 17 52.9% 52.9% $223 $439 $422 1985 7 7 38.3% 38.3% $162 $428 $424 1986 15 15 52.9% 52.9% $172 $346 $324 1987 18 18 79.7% 79.7% $152 $219 $191 1988 12 12 64.7% 64.7% $141 $303 $218 1989 6 6 71.3% 71.3% $95 $141 $133 1990 5 5 62.4% 62.4% $97 $176 $156 1991 11 11 77.9% 77.9% $82 $130 $106 1992 21 21 84.7% 84.7% $59 $77 $69 1993 4 4 60.8% 60.8% $52 $93 $86 1994 9 9 84.7% 84.7% $67 $77 $79 1995 24 23 67.9% 70.9% $43 $59 $61 1996 6 6 63.3% 63.3% $43 $76 $68 1997 5 5 80.2% 80.2% $59 $89 $73 1998 14 14 77.9% 77.9% $46 $67 $59 1999 17 8 37.1% 78.9% $75 $103 $96 2000 14 14 79.9% 79.9% $76 $99 $96 2001 16 16 77.0% 77.0% $53 $68 $69
4/4/2003 11

Figure 4: Price of Cocaine in Puerto Rico Over Time (2001$)
$0
$200
$400
$600
$800
$1,000
1980 1985 1990 1995 2000
Coc
aine
Pric
e pe
r Gra
m
Puerto Rico ($/Expected Pure Gram)
US Mainland (ONDCP Alternate Series)
Analysis #4: Heroin in Puerto Rico
There were 462 heroin observations from Puerto Rico (COUNTRY CODE = ‘PR’), as indicated by a DRUGCAT = 610 (Heroin) or DRUGCAT = 905 (Domestic Monitor Program).4 DRUGCODES include heroin (6), heroin hydrochloride (164), heroin citrate (9), and DMP (283); no distinction was made among the first three in the analysis. Likewise 140 observations were missing a SIGNATURE variable, so it was not used in the analysis.
The DRUGCAT and Domestic Monitor Flag (MONFLAG) variables were inconsistent. Forty-one of the DRUGCAT = 610 observations have a MONFLAG = ‘M’. (All DRUGCAT = 905 observations have MONFLAG = ‘M’.) Dummy variables for DMP vs. other heroin observations were created based on both the DRUGCAT and the MONFLAG variables, but in no case were they significant and so were dropped in the final analysis.
AMOUNT ranged from 0.031 grams up to 15 roughly 1/8 kilogram and 2 roughly ¼ kilogram purchases, but the one-parameter log-linear model for quantity discounts seemed to hold over that entire range, so no observations were discarded because they were “too small” or “too large”. Indeed, the only observation excluded as an outlier was a $12.30 purchase of 129.5 grams on March 20th, 1997. Likely it was actually $12,300, not $12.30.
POTENCY was 0 for 25 observations, about half of which had weights of less than 0.1 grams. It is presumed that these actually represent missing data, not true zero
4 There were also 5 observations with COUNTRY CODE = ‘DR’, which some documentation indicated implies Puerto Rico and their DEA office was San Juan (OFFNAME = “SAN JUAN”), but the city was “SANTIAGO” (not PUNTA SANTIAGO), suggesting they might be from Santiago in the Dominican Republic. On the other hand there is a monitor flag and the author is not aware of a DMP program in the Dominican Republic. Still, to be safe, these five observations were not included in the analysis.
4/4/2003 12

purity observations. There was a clear trend toward increasing purity over time (see Table 11).
Table 11: Purity of STRIDE Heroin Observations in Puerto Rico Over Time
Year
Number of Observations
1st Quartile of Purity
Median Purity
3rd Quartile of Purity
1981 2 7.8 8.05 8.3 1982 0 -- -- -- 1983 2 16 17 18 1984 10 14 19 59 1985 11 7.3 7.8 25 1986 15 8.4 13 30 1987 7 14 30 34 1988 3 28 35 37 1989 10 54 82.5 91 1990 11 5 5.5 37.5 1991 13 45 60 77 1992 32 49.25 60.7 66.55 1993 33 41.1 50.9 60 1994 57 33.9 51.4 66.3 1995 39 50.5 65.9 82 1996 29 42 54 73.8 1997 27 48.4 61.5 70.2 1998 38 37.1 51.35 68.4 1999 45 28 42.5 58.1 2000 49 41 55.1 66 2001 28 38.85 54.75 74.15
As with the case of cocaine, observations were scattered over some 31 cities,
therefore, they were again consolidated to the “region” level, as indicated in Table 12.
Table 12: Regional Location of STRIDE Heroin Observations in Puerto Rico City Obs included
AGUADILLA 9 ARECIBO 3
GUAYAMA 56 HUMACAO 31
JUANA DIAZ 3 MISSING 19 PONCE 40
SAN JUAN 300 Location did not seem to strongly predict purity or price, but location dummies
were retained anyhow, so the analysis paralleled that for cocaine.5 In particular, price series were created standardizing price per raw gram (TCOST/(AMOUNT0.79732)) and per expected pure gram (TCOST/((Expected Purity * AMOUNT)0.72876)), where expected
5 Note that for heroin, when log amount paid is regressed on log quantity and log purity, the coefficient on log purity is statistically significant and positive (0.28924), although still much smaller than the corresponding coefficient for log amount (0.81453), suggesting that expected not actual purity still governs price.
4/4/2003 13
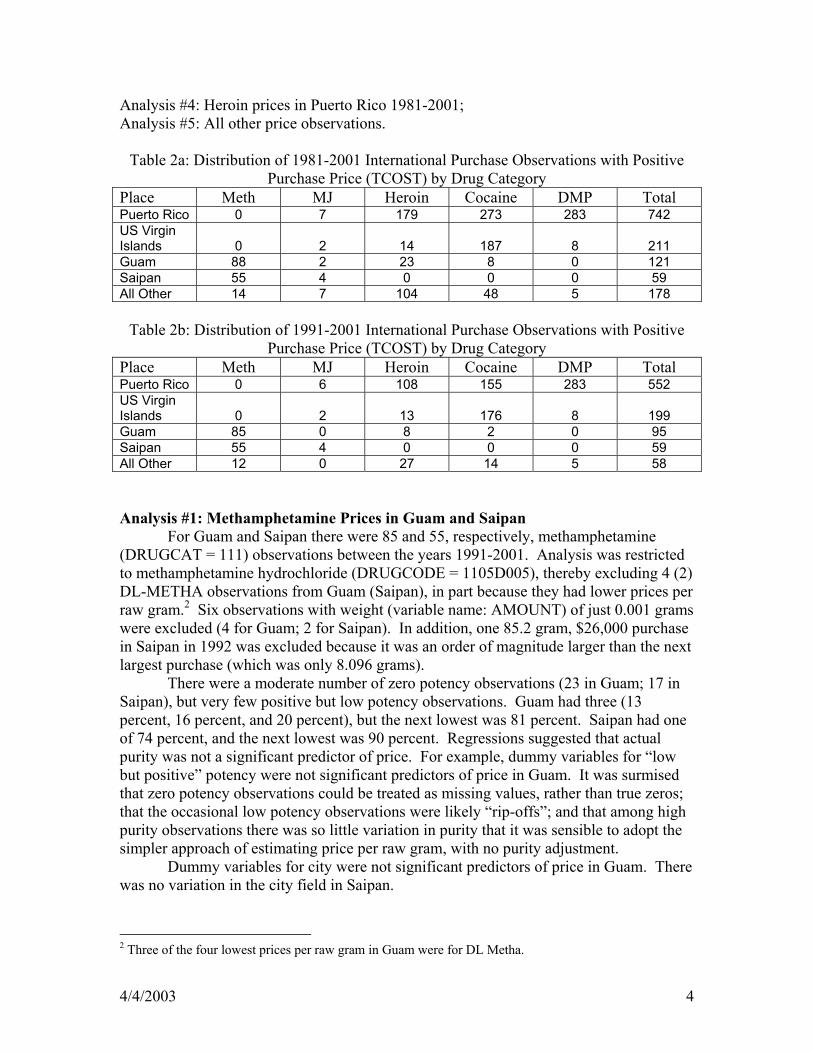
purity is estimated by regressing log purity on log quantity, dummy variables for location, and dummy variables for location. The results are summarized in Table 13.
Table 13: Price of Heroin in Puerto Rico Over Time
# of Observations Average Purity of Average Standardized Price per Year Total
w/ Positive Purity
All Obs.
Obs w/ Purity > 0
Price/Raw Gram
Price/Expected Pure Gram
Avg Price per Raw Gram Over Average Purity
1981 2 2 8.1% 8.1% $338 $2,555 $4,200 1982 0 0 1983 2 2 17.0% 17.0% $610 $2,508 $3,589 1984 10 10 32.9% 32.9% $581 $1,681 $1,765 1985 11 11 13.9% 13.9% $517 $3,070 $3,719 1986 15 15 18.2% 18.2% $590 $2,758 $3,239 1987 7 7 27.4% 27.4% $624 $2,182 $2,281 1988 3 3 33.3% 33.3% $497 $1,206 $1,492 1989 10 9 68.3% 75.9% $692 $897 $912 1990 11 11 26.7% 26.7% $465 $2,334 $1,738 1991 13 13 60.8% 60.8% $437 $686 $719 1992 32 32 57.0% 57.0% $326 $531 $572 1993 33 30 49.7% 54.7% $282 $473 $515 1994 57 52 50.4% 55.2% $248 $419 $450 1995 39 36 61.8% 66.9% $229 $329 $343 1996 29 29 57.6% 57.6% $195 $337 $339 1997 27 26 59.9% 62.2% $202 $302 $324 1998 38 36 51.6% 54.5% $180 $307 $330 1999 45 40 41.3% 46.4% $158 $323 $340 2000 49 46 52.3% 55.7% $138 $232 $247 2001 28 26 52.1% 56.1% $128 $217 $229
For heroin in Puerto Rico, a significant proportion of the purchase observations were for $100, or amounts close to $100, allowing the creation of another price series computed not in terms of amount paid per gram but amount obtained per $100. This series will not, in general, reproduce the price series in Table 13 because the smaller number of observations makes it noisier. Furthermore, quantity discounts imply that the price per pure gram for $100 heroin transactions is typically well above the price per pure gram for transactions of about one pure gram. However, this alternative series is still of interest. In some sense it can be viewed as a “gold standard” for price trends because it sidesteps any questions about how best to compare and synthesize information from purchases of unlike size.
In particular, 253 of the 461 observations had a TCOST between $70 and $140 (inclusive). Dropping the 16 zero purity observations and the four from 1985-1987 (there were none for 1988-1991) left 233 observations for 1992-2001. For each year, the total amount spent and pure amount purchased by these observations is recorded in Table 14, along with their ratio, a direct measure of the amount paid per pure gram, both in current and inflation-adjusted dollars. Parallel analysis with the 222 observations between $80 and $120 and the 132 observations with TCOST exactly equal to $100 gave similar price levels and trends, albeit slightly more variable due to the smaller number of data points.
4/4/2003 14
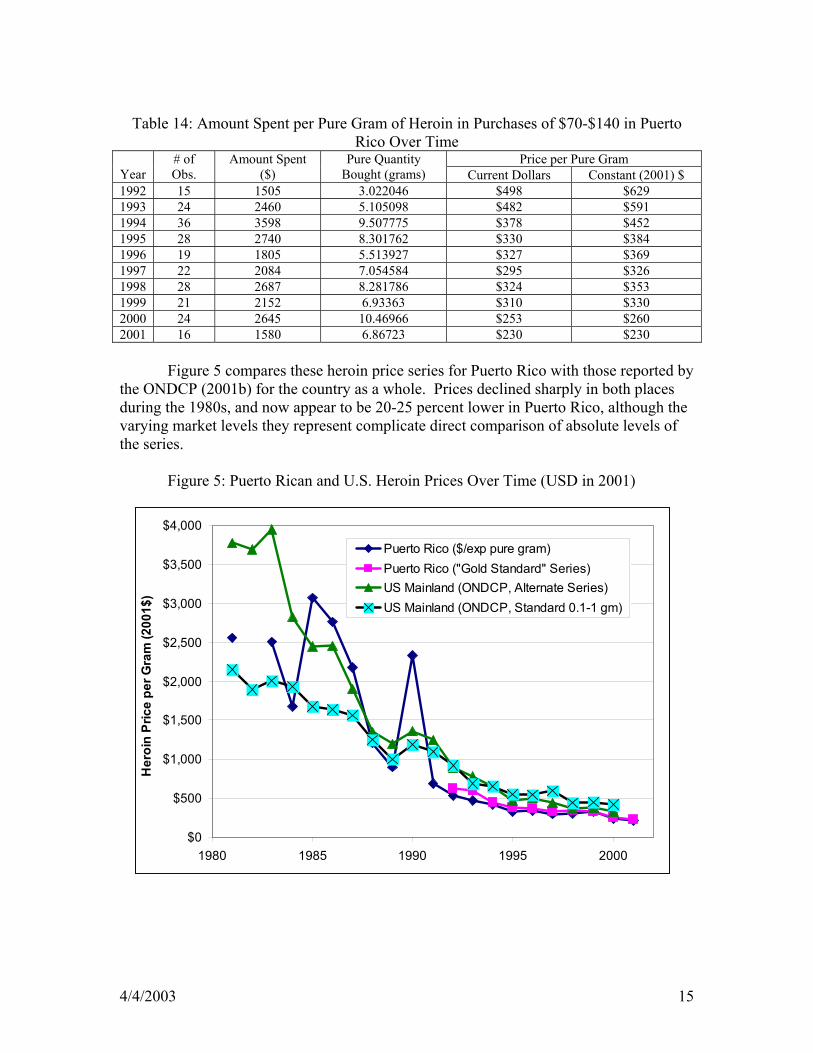
Table 14: Amount Spent per Pure Gram of Heroin in Purchases of $70-$140 in Puerto
Rico Over Time Price per Pure Gram
Year # of Obs.
Amount Spent ($)
Pure Quantity Bought (grams) Current Dollars Constant (2001) $
1992 15 1505 3.022046 $498 $629 1993 24 2460 5.105098 $482 $591 1994 36 3598 9.507775 $378 $452 1995 28 2740 8.301762 $330 $384 1996 19 1805 5.513927 $327 $369 1997 22 2084 7.054584 $295 $326 1998 28 2687 8.281786 $324 $353 1999 21 2152 6.93363 $310 $330 2000 24 2645 10.46966 $253 $260 2001 16 1580 6.86723 $230 $230
Figure 5 compares these heroin price series for Puerto Rico with those reported by
the ONDCP (2001b) for the country as a whole. Prices declined sharply in both places during the 1980s, and now appear to be 20-25 percent lower in Puerto Rico, although the varying market levels they represent complicate direct comparison of absolute levels of the series.
Figure 5: Puerto Rican and U.S. Heroin Prices Over Time (USD in 2001)
$0
$500
$1,000
$1,500
$2,000
$2,500
$3,000
$3,500
$4,000
1980 1985 1990 1995 2000
Her
oin
Pric
e pe
r Gra
m (2
001$
)
Puerto Rico ($/exp pure gram)Puerto Rico ("Gold Standard" Series)US Mainland (ONDCP, Alternate Series)US Mainland (ONDCP, Standard 0.1-1 gm)
4/4/2003 15

Analysis #5: Other International STRIDE Price Data There are 178 other observations. Excluding the 5 with COUNTRY CODE =
‘DR’ mentioned above and two for which COUNTRY CODE = ‘FS’ (unknown) left 171: seven cannabis, 7coca leaf, 14 methamphetamine, 40 cocaine, and 103 heroin.
Cannabis Observations
There is little to be learned from the seven cannabis observations. There were two “TETRAHYDROCANNABINOL (ORGANIC)” observations
(DRUGCAT = 531, DRUGCODE = 7371.000) from Bogota, Colombia, each on February 26, 1988 and for $10. One was for 0.366 grams of 14.5 percent pure; the other for 15.5 grams of 19.9 percent pure. They share the same DEA_NUM and may be part of the same buy.
Of the other five cannabis observations (DRUGCAT = 531, DRUGCODE = 7360.000 or 7360.400), four were small purchases in Mexico of $12 - $100, two in 1982 and two in 1984. The $100 observation may be an outlier, since it has the largest TCOST and the smallest quantity (1.95 grams). The other three observations range from $0.05 to $0.37 per gram, with the one DRUGCODE = 7360.400 observation (CANNABIS PLANT MATERIAL) being more expensive per gram than the two DRUGCODE = 7360.000 observations (CANNABIS, NO PLANT MATERIAL DETECTED).
The remaining observation was $15,000 paid for about 528.5 kilograms of cannabis (7360.400) in Kingston, Jamaica on August 15th, 1984.
Coca Leaf Observations
There were seven coca leaf observations, all with zero potency: two in Cuzco, Peru on September 5th, 1988 ($4.22 for 134.8 grams and $0.43 for 29.5 grams), four in Lima, Peru on February 24th, 1992 ($0.50 for 20.06 grams and $1 each for 48.3, 76.1, and 79.9 grams), and one in Santa Cruz, Bolivia on October 18, 1994 ($0.25 for 35.092 grams). These prices range from $3.23 - $14.20 per pound, moderately above the price per pound implied by the belief that coca farmers were paid $200 for a 100-pound bundle of coca leaves (Riley, 1996, 79). That would make sense if there are quantity discounts for coca leaves in South America, just as there is for cocaine powder in the United States.
Seven data points from three locations and times is not sufficient basis for inferring the extent of quantity discounts, particularly given that the highest price per pound ($14.20) was paid for the largest quantity purchased (134.8 grams) (see Figure 6).
Figure 6: STRIDE Coca Leaf Price Observations
4/4/2003 $0
$2
$4
$6
$8
$10
$12
$14
$16
0 25 50 75 100 125 150Grams Purchased
Pric
e pe
r Pou
nd
Santa Cruz, Bolivia (10/18/94)Cuzco, Peru (9/5/88)Lima, Peru (2/24/92)
16

Methamphetamine Observations
There were 14 methamphetamine observations. Five were in Pago Pago, American Samoa. Their analysis adds little to the insights derived above from the larger number of data points for Guam and Saipan.
Three were roughly half-kilogram purchases in Vienna, Austria on May 8th, 2001 ($1125 for 491 grams of 12.2 percent pure; $1100 for 481 grams of 43.2 percent pure; and $1125 for 486 grams of 43.9 percent pure). There is very little information in the literature with which to compare these observations. The European Monitoring Centre for Drugs and Drug Addiction (EMCDDA) publications for Austria do not include price data (cf. Haas et al., 2001). Those data for Germany do, but predominantly for retail purchases and much more information for MDMA and amphetamines than for methamphetamines is cited. Still, assuming 29 milligrams per consumption unit (Simon et al., 2001), this works out to a (wholesale) price of just 15-50 cents per consumption unit, and the price per pure gram is more than an order of magnitude below methamphetamine prices reported for the United States (ONDCP, 2001b).
Finally, there were six observations from Indonesia (no city indicated) from April 22-24, 1998. Four purchases were of $49 - $56 dollars for 8 grams each of 20.2 percent - 48.8 percent pure methamphetamine (i.e., $6-$7 per raw gram and $15-$20 per pure gram). One was $100 for 10 grams of 54.9 percent pure. The last was $35 for 0.25 grams of 85.5 percent pure. Including both of these raises the average price to about $8 per raw gram and $20 per pure gram. Still, these prices are clearly well below those in Guam, Saipan, and the U.S. Mainland.
Cocaine Observations
There were 40 cocaine observations. Ten were “large” purchases (315 grams and up); 30 were “smaller” purchases (one of 45.22, one of 11.96, then 5.09 grams and below). The ten large purchases tend to increase with distance from where cocaine is produced and decrease over time (see Table 15). The three Bolivian observations from 1992-93 are interesting in that they have lower potency, lower price per raw kilogram, and somewhat lower price per pure kilogram than was thought to be common in that time for kilograms ready for export from Colombia. (Riley, 1996, cites a figure of $4,000/kilogram.) Perhaps Colombian prices were actually lower than previously thought. Alternately, it could cost more to smuggle cocaine to the United States from Bolivia than from Colombia, and lower prices in Bolivia may be necessary for that cocaine to be competitive in U.S. markets.
Note that the one purchase of much more than one kilogram (24 kilograms in Bolivia) has a price per kilogram well below that of the two 2-3 kilogram purchases in
4/4/2003 17
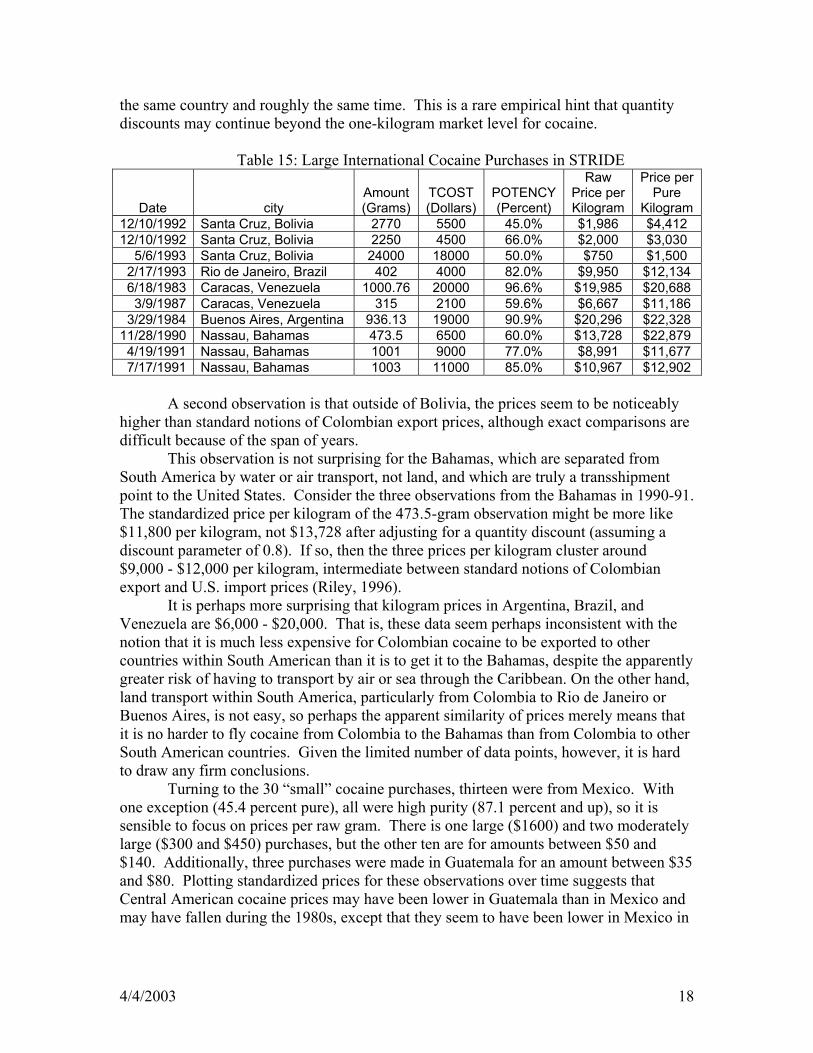
the same country and roughly the same time. This is a rare empirical hint that quantity discounts may continue beyond the one-kilogram market level for cocaine.
Table 15: Large International Cocaine Purchases in STRIDE
Date city Amount (Grams)
TCOST (Dollars)
POTENCY (Percent)
Raw Price per Kilogram
Price per Pure
Kilogram 12/10/1992 Santa Cruz, Bolivia 2770 5500 45.0% $1,986 $4,412 12/10/1992 Santa Cruz, Bolivia 2250 4500 66.0% $2,000 $3,030
5/6/1993 Santa Cruz, Bolivia 24000 18000 50.0% $750 $1,500 2/17/1993 Rio de Janeiro, Brazil 402 4000 82.0% $9,950 $12,134 6/18/1983 Caracas, Venezuela 1000.76 20000 96.6% $19,985 $20,688 3/9/1987 Caracas, Venezuela 315 2100 59.6% $6,667 $11,186
3/29/1984 Buenos Aires, Argentina 936.13 19000 90.9% $20,296 $22,328 11/28/1990 Nassau, Bahamas 473.5 6500 60.0% $13,728 $22,879 4/19/1991 Nassau, Bahamas 1001 9000 77.0% $8,991 $11,677 7/17/1991 Nassau, Bahamas 1003 11000 85.0% $10,967 $12,902
A second observation is that outside of Bolivia, the prices seem to be noticeably
higher than standard notions of Colombian export prices, although exact comparisons are difficult because of the span of years.
This observation is not surprising for the Bahamas, which are separated from South America by water or air transport, not land, and which are truly a transshipment point to the United States. Consider the three observations from the Bahamas in 1990-91. The standardized price per kilogram of the 473.5-gram observation might be more like $11,800 per kilogram, not $13,728 after adjusting for a quantity discount (assuming a discount parameter of 0.8). If so, then the three prices per kilogram cluster around $9,000 - $12,000 per kilogram, intermediate between standard notions of Colombian export and U.S. import prices (Riley, 1996).
It is perhaps more surprising that kilogram prices in Argentina, Brazil, and Venezuela are $6,000 - $20,000. That is, these data seem perhaps inconsistent with the notion that it is much less expensive for Colombian cocaine to be exported to other countries within South American than it is to get it to the Bahamas, despite the apparently greater risk of having to transport by air or sea through the Caribbean. On the other hand, land transport within South America, particularly from Colombia to Rio de Janeiro or Buenos Aires, is not easy, so perhaps the apparent similarity of prices merely means that it is no harder to fly cocaine from Colombia to the Bahamas than from Colombia to other South American countries. Given the limited number of data points, however, it is hard to draw any firm conclusions.
Turning to the 30 “small” cocaine purchases, thirteen were from Mexico. With one exception (45.4 percent pure), all were high purity (87.1 percent and up), so it is sensible to focus on prices per raw gram. There is one large ($1600) and two moderately large ($300 and $450) purchases, but the other ten are for amounts between $50 and $140. Additionally, three purchases were made in Guatemala for an amount between $35 and $80. Plotting standardized prices for these observations over time suggests that Central American cocaine prices may have been lower in Guatemala than in Mexico and may have fallen during the 1980s, except that they seem to have been lower in Mexico in
4/4/2003 18

1983 than in 1984, although it is not clear whether 1983 prices were unusually low or 1984 prices were unusually high.
Figure 7: Central American Retail Cocaine Prices
$0
$50
$100
$150
$200
$250
$300
$350
$400
1981 1982 1983 1984 1985 1986 1987 1988
Stan
dard
ized
Pric
e pe
r Raw
Gra
m MexicoGuatemala
Seven of the “small” cocaine purchases are from Kingston, Jamaica in July of
1988. All were of high purity (84.9 percent and up) and had the same DEA NUMBER. One was on the 22nd ($146.52 for 3.143 grams). Six on the 26th were each for exactly $91.58 but varied in weight from 0.083 grams to 0.284 grams. They may represent some sort of combined purchase, and in the absence of further information it seems imprudent to try to compute prices for them.
The remaining seven small cocaine observations are widely scattered (see Table 16). One noteworthy observation is that the data from Belgium are consistent with the idea that European cocaine prices have been an order of magnitude higher than those in the United States.
Table 16: Other Small Cocaine Purchases in STRIDE
Date City Amount (Grams)
TCOST (Dollars)
POTENCY (Percent)
Raw Price per Gram
Price per Pure
Gram 3/28/2000 Chiang Mai, Thailand 3.6 300 0.0% $83 NA 2/5/1987 St. Kitts 1.8 1000 82.0% $556 $678 2/5/1987 St. Kitts 1.8 200 83.0% $111 $134
11/29/1990 Manila, Philippines 1.266 35 51.8% $28 $53 4/15/1988 Antwerp, Belgium 2.069 4073.39 89.6% $1,969 $2,197 4/15/1988 Antwerp, Belgium 1.686 4073.39 95.6% $2,416 $2,527 6/2/2000 Barbados, Bridgetown 3.7 4000 70.0% $1,081 $1,544
4/4/2003 19

Heroin Observations
There were 103 other heroin observations. Thirty-eight were “large” purchases (100 grams or more), the majority of quite high purity. Standardized prices (β = 0.8) per raw kilogram for 27 of them from Pakistan, India, Burma, and Thailand are plotted over time in Figure 8. Prices are lowest in Pakistan and perhaps highest in Thailand. Two observations for Thailand with standardized prices of $225,000 and $98,000 are omitted because they would distort the scale of the figure and, more fundamentally, they are such outliers that they may be errors. For example, perhaps the amount paid for these 2–4 kilogram purchases were really $65,000 and $18,000, not $650,000 and $180,000.
Figure 8: Standardized Kilogram Prices of Large STRIDE Heroin Purchases in Asia
$0
$2,000
$4,000
$6,000
$8,000
$10,000
$12,000
1981 1986 1991 1996 2001
Stan
dard
ized
Pric
e pe
r Raw
Kilo
gram
ThailandPakistanIndiaBurma
Two other standardized kilogram prices elsewhere in Asia are also higher.
Specifically, there was a 100.9-gram purchase for $3,100 in Beirut on December 19, 1998 (standardized price: $19,420) and a 10.49 kilogram purchase for $225,000 in Kowloon, Hong Kong on November 25, 1987 (standardized price: $34,322).
With one exception, standardized prices are much higher in Latin America ($37,000 - $88,000), and the exception (a February 18, 1992 purchase in Panama) may well be a typo whose TCOST should perhaps have been $15,000 not $1,500. Purities were again high (53.7 percent - 91.0 percent) (see Table 17).
The only other large heroin purchase was 2.1 kilograms of 60.3 percent pure heroin for $15,000 in Frankfurt, Germany on April 30, 1983.
4/4/2003 20
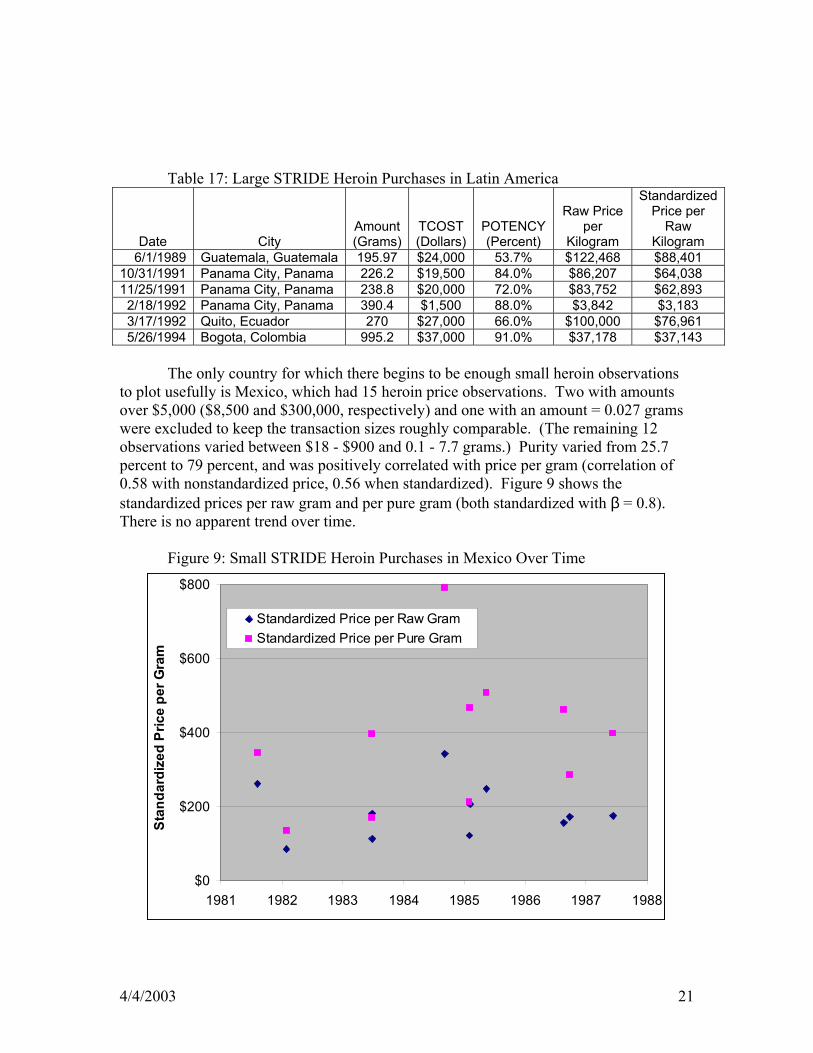
Table 17: Large STRIDE Heroin Purchases in Latin America
Date City Amount (Grams)
TCOST (Dollars)
POTENCY (Percent)
Raw Price per
Kilogram
Standardized Price per
Raw Kilogram
6/1/1989 Guatemala, Guatemala 195.97 $24,000 53.7% $122,468 $88,401 10/31/1991 Panama City, Panama 226.2 $19,500 84.0% $86,207 $64,038 11/25/1991 Panama City, Panama 238.8 $20,000 72.0% $83,752 $62,893 2/18/1992 Panama City, Panama 390.4 $1,500 88.0% $3,842 $3,183 3/17/1992 Quito, Ecuador 270 $27,000 66.0% $100,000 $76,961 5/26/1994 Bogota, Colombia 995.2 $37,000 91.0% $37,178 $37,143
The only country for which there begins to be enough small heroin observations
to plot usefully is Mexico, which had 15 heroin price observations. Two with amounts over $5,000 ($8,500 and $300,000, respectively) and one with an amount = 0.027 grams were excluded to keep the transaction sizes roughly comparable. (The remaining 12 observations varied between $18 - $900 and 0.1 - 7.7 grams.) Purity varied from 25.7 percent to 79 percent, and was positively correlated with price per gram (correlation of 0.58 with nonstandardized price, 0.56 when standardized). Figure 9 shows the standardized prices per raw gram and per pure gram (both standardized with β = 0.8). There is no apparent trend over time.
Figure 9: Small STRIDE Heroin Purchases in Mexico Over Time
$0
$200
$400
$600
$800
1981 1982 1983 1984 1985 1986 1987 1988
Stan
dard
ized
Pric
e pe
r Gra
m
Standardized Price per Raw GramStandardized Price per Pure Gram
4/4/2003 21

For some other countries small heroin purchases are insufficient to plot a trend
but sufficient to compare to the price per gram for large purchases. This fact sheds some small light on the question of the extent of quantity discounts in source countries. This question is interesting for both theoretical and practical reasons. On theoretical grounds, it is interesting to ask whether the substantial price markups as drugs move down the distribution chain in the United States are reproduced in source countries that may have less stringent enforcement directed at domestic distribution. On practical grounds, the United Nations Drug Control Program reports some international price data, but primarily for retail quantities. If there are not significant differences between high-level and retail prices in source countries, those prices might be a useful proxy for wholesale prices in source countries that ship drugs to the United States. If there are large differences, the United Nations data are less relevant for understanding the distribution system that supplies drugs to the United States.
The evidence concerning these price differences is summarized in Table 18. There seem to be clear markups as one moves down the distribution chain in Colombia, India, and Panama; evidence in Pakistan and Thailand is mixed, even recognizing the confounding effects of possible variation in prices over time.
Table 18: Comparison of Price per Raw Gram for Small and Large STRIDE Heroin
Purchases in Five Countries Large Purchases Small Purchases Country
# of Obs. TCOST $/gram # of Obs. TCOST $/gram Evidence of Mark-ups?
Thailand 10 1625-50,000 5-11 2 1200 600 Yes 10 250-275 5-5.5 No 2 175 17.5 Yes Panama 2 19,500-20,000 83-86 3 4500-9000 82-101 Yes Pakistan 9 450-3718 0.03-3.7 3 45-150 0.4-3 No 4 4-50 14-500 Yes 1 3.22 4.3 No India 3 845-3721 1.7-9.5 3 12-533 25-240 Yes Colombia 1 37,000 37.2 1 1700 57.7 Yes 3 41-283 134-2463 Yes
The remaining 19 heroin observations not yet discussed are given in Table 19. Prices in Italy are lower than in other developed countries, consistent with Italy having a relatively large heroin problem.
4/4/2003 22
Table 19: Other STRIDE International Heroin Purchase Observations
Date City Amount (Grams)
TCOST (Dollars)
POTENCY (Percent)
Raw Price per Gram
Price per Pure
Gram 6/22/1985 Vienna, Austria 8.3 17500 68.0% $2,108 $3,101 3/12/1990 Vienna, Austria 0.472 161 37.0% $341 $922 2/17/1983 Toronto, Canada 31 11500 82.5% $371 $450 3/17/1992 Quito, Ecuador 80.8 8000 0.0% $99 NA 2/19/1986 Marseille, France 0.87 319 96.6% $367 $380 9/22/1989 Marseille, France 7.968 3019.76 41.1% $379 $922 9/2/1989 Athens, Greece 2.057 900 2.1% $438 $20,835 5/17/1983 Rome, Italy 1.66 200 43.1% $120 $280 6/1/1985 Naples, Italy 2.34 180 50.1% $77 $154 5/17/1986 Rome, Italy 3 201 16.6% $67 $404 6/5/1986 Rome, Italy 4 258 14.3% $65 $451 6/22/1996 Kingston, Jamaica 8.9 850 0.0% $96 NA 7/23/1996 Montego Bay, Jamaica 20.1 1600 0.0% $80 NA 9/9/1990 Beirut, Lebanon 50 7500 0.0% $150 NA 5/26/1981 Penang, Malaysia 0.65 20 32.4% $31 $95 5/20/1985 Lagos, Nigeria 3 487 0.0% $162 NA 5/27/1985 Lagos, Nigeria 3.27 580 0.0% $177 NA 5/30/1989 Ankara, Turkey 2.569 2900 63.6% $1,129 $1,775 2/13/1992 Caracas, Venezuela 5.31 600 96.2% $113 $117
DISCUSSION
Several tentative observations can be made from the above. • STRIDE price data are much scarcer outside the United States than within,
making quantitative analysis of international prices difficult. It might be valuable to create some systematic database for collecting parallel price data from enforcement agencies in other countries and/or price quotes for individual transactions overheard by wiretaps or other sources to allow better monitoring of international prices.
• Except for heroin, STRIDE contains little price information concerning quantities associated with high-level international trafficking. The largest methamphetamine purchase observation was for 491 grams. For cannabis, there was one 528.456 kilogram purchase, but the next largest was just 436.5 grams. For cocaine there was one 24 kilogram purchase, two between two and three kilograms, and the rest were one kilogram or smaller. There are not many heroin purchases of more than one kilogram, but there are some (in descending order: 22, 10.5, 6.6, 3.8, 3.5, 3.5, 2.1, 2.1, 2.0, 1.8, and 1.4 kgs) and heroin is generally smuggled into the United States in smaller lot sizes than is the majority of cocaine and marijuana entering the United States.
• The data, such as they are, seem consistent with most conventional wisdom concerning international drug prices.
• Relative to prices on the U.S. Mainland, cocaine and heroin prices in Puerto Rico have been lower since about 1990, methamphetamine prices in Guam and Saipan are higher, and cocaine prices in the U.S. Virgin Islands are comparable.
4/4/2003 23

• There is some evidence for quantity discounts in source countries. It is not possible to say whether there is a consistent and stable relationship between wholesale and retail prices in source countries. Hence, it is not clear whether trends in retail prices in other countries, such as those collected by the UNDCP, are useful indicators of prices in the distribution chain supplying the United States.
References: Caulkins, Jonathan P. Developing Price Series for Cocaine. MR-317-DPRC, RAND, Santa Monica, CA, 1994. Caulkins, Jonathan P. “Domestic Geographic Variation in Illicit Drug Prices.” The Journal of Urban Economics, 37, no. 1, 1995, 38-56. Caulkins, Jonathan P. “Can Supply Factors Suppress Marijuana Use By Youth?” Federation of American Scientists’ Drug Policy Analysis Bulletin, Issue Number 7, 1999, 3-5. Caulkins, Jonathan P. “The Relationship Between Prices and Emergency Department Mentions for Cocaine and Heroin.” American Journal of Public Health, 91, no. 9, 2001, 1446-48. Caulkins, Jonathan P. and Rema Padman. “Quantity Discounts and Quality Premia for Illicit Drugs.” The Journal of the American Statistical Association, 88, no. 423, 1993, 748-57 Caulkins, Jonathan P. and Peter Reuter. “What Price Data Tell Us About Drug Markets.” Journal of Drug Issues, 28, no. 3, 1998, 593-612 Crane, B.D., A.R. Rivolo, and G.C. Comfort. An Empirical Examination of Counterdrug Interdiction Program Effectiveness. Alexandria, Virginia: Institute for Defense Analysis, 1997. Drug Enforcement Administration (DEA). Drug Intelligence Brief: The Forms of Methamphetamine. DEA Publication 020016, April, 2002. http://www.usdoj.gov/dea/pubs/intel/02016/index.html. Frank, Richard S. “Drugs of Abuse: Data Collection Systems of DEA and Recent Trends.” Journal of Analytical Toxicology, 11, Nov./Dec., 1987, 237–41. Haas, Sabine, Martin Busch, Klarissa Guzei, Elisabeth Turscherl, and Marion Weigl. Report on the Drug Situation in Austria, 2001. EMCDDA, Lisbon, Portugal, 2001. (http://www.emcdda.eu.int/multimedia/publications/national_reports/2001/NR_Austria_2001.pdf).
4/4/2003 24

Horowitz, Joel L. “Should the DEA’s STRIDE Data Be Used for Economic Analysis of Markets for Illegal Drugs?” Journal of the American Statistical Association, 96, no. 456, 2002, 1254-62. Manski, C; Pepper, J. and Petrie, C. Informing America’s Policy Towards Illegal Drugs Washington: National Academy Press, 2001. Office of National Drug Control Policy (ONDCP). Price and Purity of Cocaine: The Relationship to Emergency Room Visits and Deaths, and to Drug Use Among Arrestees. Washington: The White House, 1992. Office of National Drug Control Policy (ONDCP). What America’s Users Spend on Illegal Drugs. Washington: The White House, 2001a. Office of National Drug Control Policy (ONDCP). The Price of Illicit Drugs: 1981 through the Second Quarter of 2000. Washington: The White House, 2001b. Riley, Kevin Jack. Snow Job? The War Against International Cocaine Trafficking. New Brunswick, NJ: Transaction Publishers, 1996. Simon, Roland, Eva Hoch, Rulf Hullinghorst, Guido Nocker, and Marion David-Spickermann. Report on the Drug Situation in Germany, 2001. Lisbon, Portugal: EMCDDA, 2001. (http://www.emcdda.eu.int/multimedia/publications/national_reports/2001/NR_Germany_2001_EN.pdf).
4/4/2003 25


![EKF Estimation of Stride Width from Individual IMU-based ... · determining individual stride metrics (e.g. stride time, stride speed, foot clearance, stride length, etc.)[9][1],](https://img.pdfslide.net/doc/110x75/5ec0069b65be937c564c10bb/ekf-estimation-of-stride-width-from-individual-imu-based-determining-individual.jpg)