Embed Size (px)
Citation preview
S TAT E M E N T O N M O N E TA R Y P O L I C Y | N O V E M B E R 2017 5
1. International Economic Developments
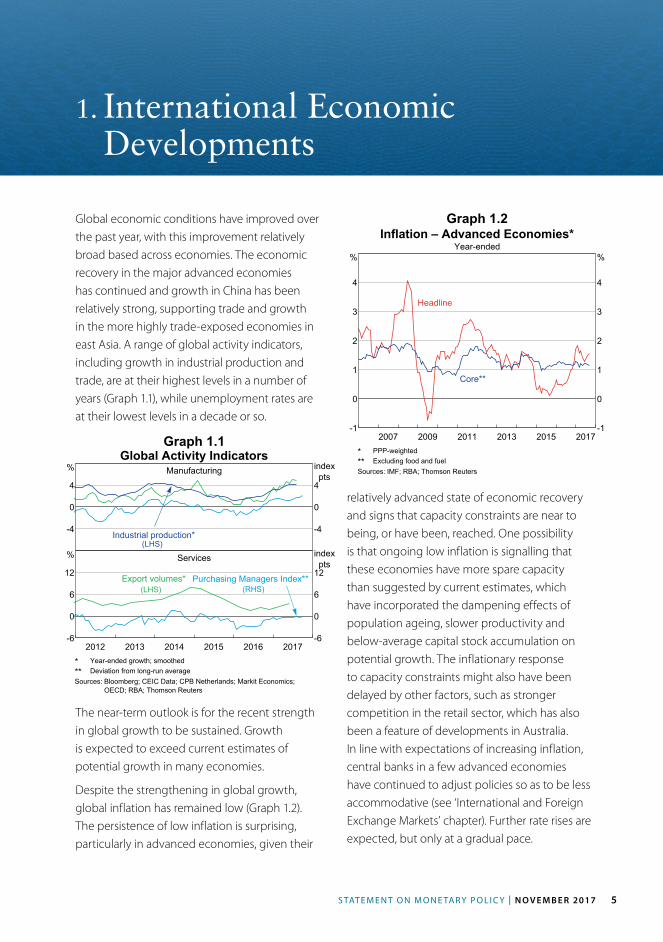
Global economic conditions have improved over the past year, with this improvement relatively broad based across economies. The economic recovery in the major advanced economies has continued and growth in China has been relatively strong, supporting trade and growth in the more highly trade-exposed economies in east Asia. A range of global activity indicators, including growth in industrial production and trade, are at their highest levels in a number of years (Graph 1.1), while unemployment rates are at their lowest levels in a decade or so.
Graph 1.1
Graph 1.2
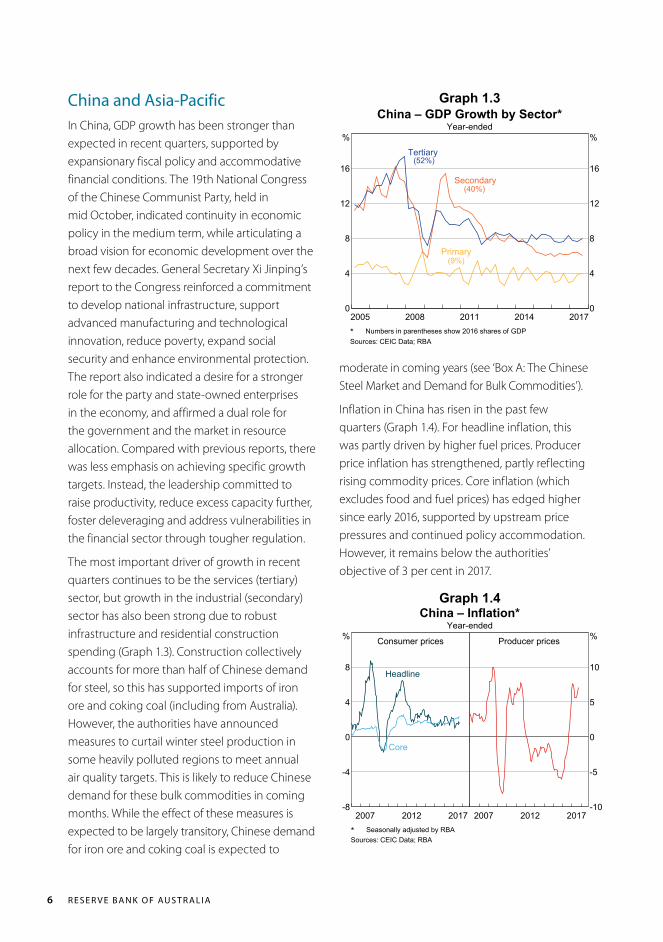
relatively advanced state of economic recovery and signs that capacity constraints are near to being, or have been, reached. One possibility is that ongoing low inflation is signalling that these economies have more spare capacity than suggested by current estimates, which have incorporated the dampening effects of population ageing, slower productivity and below-average capital stock accumulation on potential growth. The inflationary response to capacity constraints might also have been delayed by other factors, such as stronger competition in the retail sector, which has also been a feature of developments in Australia. In line with expectations of increasing inflation, central banks in a few advanced economies have continued to adjust policies so as to be less accommodative (see ‘International and Foreign Exchange Markets’ chapter). Further rate rises are expected, but only at a gradual pace.
Global Activity IndicatorsManufacturing
-4
0
4
%
-4
0
4
indexpts
Industrial production*(LHS)
Services
20162015201420132012 2017-6
0
6
12
%
-6
0
6
12
indexpts
Export volumes*(LHS) (RHS)
Purchasing Managers Index**
* Year-ended growth; smoothed** Deviation from long-run averageSources: Bloomberg; CEIC Data; CPB Netherlands; Markit Economics;
OECD; RBA; Thomson Reuters
The near-term outlook is for the recent strength in global growth to be sustained. Growth is expected to exceed current estimates of potential growth in many economies.
Despite the strengthening in global growth, global inflation has remained low (Graph 1.2). The persistence of low inflation is surprising, particularly in advanced economies, given their
20152013201120092007 2017-1
0
1
2
3
4
%
-1
0
1
2
3
4
%
Inflation – Advanced Economies*Year-ended
Headline
Core**
* PPP-weighted** Excluding food and fuelSources: IMF; RBA; Thomson Reuters
R E S E R V E B A N K O F AU S T R A L I A6
China and Asia-PacificIn China, GDP growth has been stronger than expected in recent quarters, supported by expansionary fiscal policy and accommodative financial conditions. The 19th National Congress of the Chinese Communist Party, held in mid October, indicated continuity in economic policy in the medium term, while articulating a broad vision for economic development over the next few decades. General Secretary Xi Jinping’s report to the Congress reinforced a commitment to develop national infrastructure, support advanced manufacturing and technological innovation, reduce poverty, expand social security and enhance environmental protection. The report also indicated a desire for a stronger role for the party and state-owned enterprises in the economy, and affirmed a dual role for the government and the market in resource allocation. Compared with previous reports, there was less emphasis on achieving specific growth targets. Instead, the leadership committed to raise productivity, reduce excess capacity further, foster deleveraging and address vulnerabilities in the financial sector through tougher regulation.
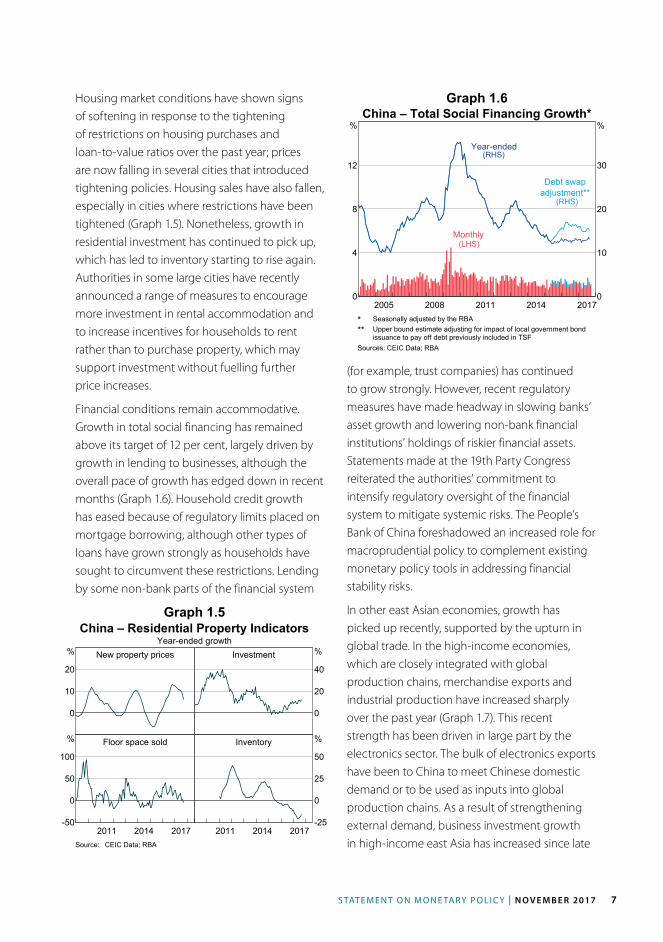
The most important driver of growth in recent quarters continues to be the services (tertiary) sector, but growth in the industrial (secondary) sector has also been strong due to robust infrastructure and residential construction spending (Graph 1.3). Construction collectively accounts for more than half of Chinese demand for steel, so this has supported imports of iron ore and coking coal (including from Australia). However, the authorities have announced measures to curtail winter steel production in some heavily polluted regions to meet annual air quality targets. This is likely to reduce Chinese demand for these bulk commodities in coming months. While the effect of these measures is expected to be largely transitory, Chinese demand for iron ore and coking coal is expected to
Graph 1.4
moderate in coming years (see ‘Box A: The Chinese Steel Market and Demand for Bulk Commodities’).
Inflation in China has risen in the past few quarters (Graph 1.4). For headline inflation, this was partly driven by higher fuel prices. Producer price inflation has strengthened, partly reflecting rising commodity prices. Core inflation (which excludes food and fuel prices) has edged higher since early 2016, supported by upstream price pressures and continued policy accommodation. However, it remains below the authorities’ objective of 3 per cent in 2017.
Graph 1.3
2014201120082005 20170
4
8
12
16
%
0
4
8
12
16
%
China – GDP Growth by Sector*Year-ended
Primary(9%)
Secondary
Tertiary(52%)
(40%)
* Numbers in parentheses show 2016 shares of GDPSources: CEIC Data; RBA
China – Inflation*Year-ended
Consumer prices
20122007 2017-8
-4
0
4
8
%
Headline
Core
Producer prices
20122007 2017-10
-5
0
5
10
%
* Seasonally adjusted by RBASources: CEIC Data; RBA
S TAT E M E N T O N M O N E TA R Y P O L I C Y | N O V E M B E R 2017 7
Graph 1.5
Graph 1.6Housing market conditions have shown signs of softening in response to the tightening of restrictions on housing purchases and loan- to- value ratios over the past year; prices are now falling in several cities that introduced tightening policies. Housing sales have also fallen, especially in cities where restrictions have been tightened (Graph 1.5). Nonetheless, growth in residential investment has continued to pick up, which has led to inventory starting to rise again. Authorities in some large cities have recently announced a range of measures to encourage more investment in rental accommodation and to increase incentives for households to rent rather than to purchase property, which may support investment without fuelling further price increases.
Financial conditions remain accommodative. Growth in total social financing has remained above its target of 12 per cent, largely driven by growth in lending to businesses, although the overall pace of growth has edged down in recent months (Graph 1.6). Household credit growth has eased because of regulatory limits placed on mortgage borrowing, although other types of loans have grown strongly as households have sought to circumvent these restrictions. Lending by some non-bank parts of the financial system
(for example, trust companies) has continued to grow strongly. However, recent regulatory measures have made headway in slowing banks’ asset growth and lowering non-bank financial institutions’ holdings of riskier financial assets. Statements made at the 19th Party Congress reiterated the authorities’ commitment to intensify regulatory oversight of the financial system to mitigate systemic risks. The People’s Bank of China foreshadowed an increased role for macroprudential policy to complement existing monetary policy tools in addressing financial stability risks.
In other east Asian economies, growth has picked up recently, supported by the upturn in global trade. In the high-income economies, which are closely integrated with global production chains, merchandise exports and industrial production have increased sharply over the past year (Graph 1.7). This recent strength has been driven in large part by the electronics sector. The bulk of electronics exports have been to China to meet Chinese domestic demand or to be used as inputs into global production chains. As a result of strengthening external demand, business investment growth in high-income east Asia has increased since late
China – Residential Property IndicatorsYear-ended growth
New property prices
0
10
20
% Investment
0
20
40
%
Floor space sold
20142011 2017-50
0
50
100
% Inventory
20142011 2017-25
0
25
50
%
Source: CEIC Data; RBA
2014201120082005 20170
4
8
12
%
0
10
20
30
%China – Total Social Financing Growth*
Monthly(LHS)
Year-ended
Debt swapadjustment**
(RHS)
(RHS)
* Seasonally adjusted by the RBA** Upper bound estimate adjusting for impact of local government bondissuance to pay off debt previously included in TSF
Sources: CEIC Data; RBA

R E S E R V E B A N K O F AU S T R A L I A8
Graph 1.9
moderated a little but is still high; merchandise export and visitor arrival growth has increased; and growth in industrial production remains solid. Across the east Asian region, growth continues to be supported by accommodative monetary and fiscal policies. Headline and core inflation have been little changed.
In India, GDP growth has moderated over the past year to less than 6 per cent (Graph 1.9). Growth in private investment has been subdued, reflecting excess capacity in the industrial sector, high corporate leverage and weak business confidence. The Indian Government recently announced a recapitalisation plan for state-owned banks over the next two years; this is expected to boost investment, which has been weighed down by the inability of state-owned banks to issue credit due to high levels of bad debt in recent years. CPI inflation has picked up since mid 2017, partly because food price inflation and housing rent allowances for public sector employees have both increased, but it remains below the Reserve Bank of India’s medium-term inflation target of 4 per cent.
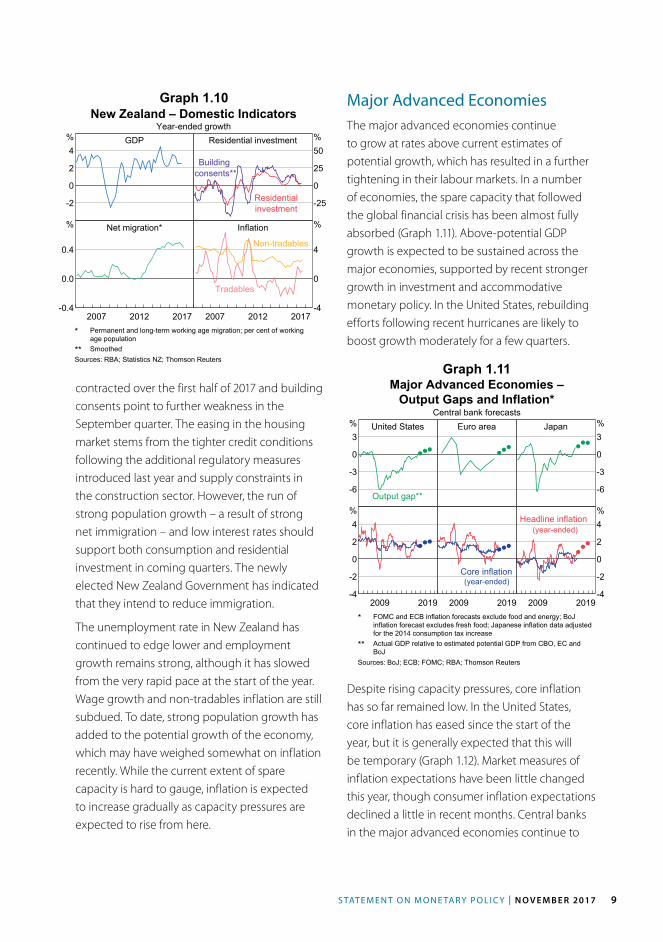
GDP growth in New Zealand has been around its long-run average (Graph 1.10). Residential investment grew at a rapid pace over 2016, but
Graph 1.8
Graph 1.7High-income East Asia – Economic Indicators
Smoothed, 2011 = 100
Total
2014 201770
100
130
160
index
Industrial production
Electronics sector
2014 201770
100
130
160
index
Export volumes
Sources: CEIC Data; IMF; RBA; Thomson Reuters; UN
East Asia – Economic IndicatorsYear-ended growth
GDP*
0
6
%
High-income**
Business investment
0
25
%
Middle-income***
Consumption
20122007 2017-5
0
5
% EmploymentSmoothed
20122007 2017-2
0
2
%
* Estimate for September quarter 2017** Hong Kong, Singapore, South Korea and Taiwan*** Indonesia, Malaysia, Philippines and ThailandSources: CEIC Data; IMF; RBA; UN
India – GDP Growth and InflationYear-ended
GDP growthGDP growth
20122007 2017-4
0
4
8
12
%
Quarterly*
Inflation
20122007 2017-5
0
5
10
15
%
Excluding foodand fuel
* Seasonally adjusted by RBASources: CEIC Data; RBA
2016 (Graph 1.8). Consumption growth has also picked up recently and consumer confidence remains around multi-year highs after increasing sharply in late 2016. Despite the strengthening of economic activity, employment growth has been relatively subdued.
In the middle-income east Asian economies, GDP growth has been resilient in recent years and above estimates of potential growth. Growth in business investment and public consumption has been robust. GDP growth is likely to remain around these rates: consumer confidence has
S TAT E M E N T O N M O N E TA R Y P O L I C Y | N O V E M B E R 2017 9
Graph 1.10
Graph 1.11contracted over the first half of 2017 and building consents point to further weakness in the September quarter. The easing in the housing market stems from the tighter credit conditions following the additional regulatory measures introduced last year and supply constraints in the construction sector. However, the run of strong population growth – a result of strong net immigration – and low interest rates should support both consumption and residential investment in coming quarters. The newly elected New Zealand Government has indicated that they intend to reduce immigration.
The unemployment rate in New Zealand has continued to edge lower and employment growth remains strong, although it has slowed from the very rapid pace at the start of the year. Wage growth and non-tradables inflation are still subdued. To date, strong population growth has added to the potential growth of the economy, which may have weighed somewhat on inflation recently. While the current extent of spare capacity is hard to gauge, inflation is expected to increase gradually as capacity pressures are expected to rise from here.
Major Advanced EconomiesThe major advanced economies continue to grow at rates above current estimates of potential growth, which has resulted in a further tightening in their labour markets. In a number of economies, the spare capacity that followed the global financial crisis has been almost fully absorbed (Graph 1.11). Above-potential GDP growth is expected to be sustained across the major economies, supported by recent stronger growth in investment and accommodative monetary policy. In the United States, rebuilding efforts following recent hurricanes are likely to boost growth moderately for a few quarters.
New Zealand – Domestic IndicatorsYear-ended growth
GDP
-2
0
2
4% Residential investment
-25
0
25
50%
Residentialinvestment
Buildingconsents**
Net migration*
20122007 2017-0.4
0.0
0.4
% Inflation
20122007 2017-4
0
4
%
Tradables
Non-tradables
* Permanent and long-term working age migration; per cent of workingage population** Smoothed
Sources: RBA; Statistics NZ; Thomson Reuters
Major Advanced Economies –Output Gaps and Inflation*
Central bank forecastsUnited States
-6
-3
0
3%
Output gap**
Euro area Japan
-6
-3
0
3%
2009 2019-4
-2
0
2
4%
2009 2019
Core inflation(year-ended)
2009 2019-4
-2
0
2
4%
(year-ended)Headline inflation
* FOMC and ECB inflation forecasts exclude food and energy; BoJinflation forecast excludes fresh food; Japanese inflation data adjustedfor the 2014 consumption tax increase** Actual GDP relative to estimated potential GDP from CBO, EC andBoJ
Sources: BoJ; ECB; FOMC; RBA; Thomson Reuters
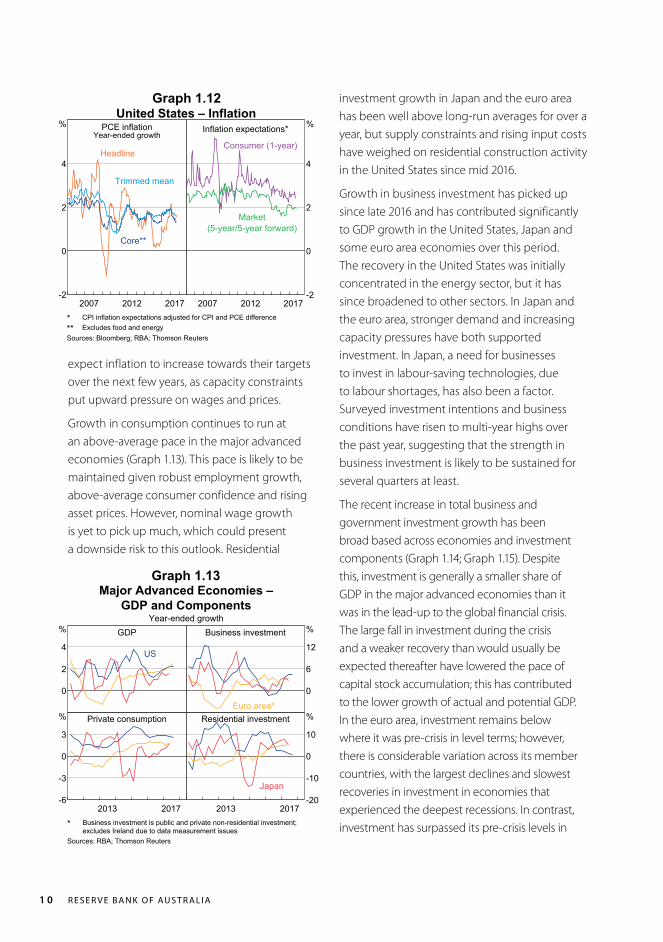
Despite rising capacity pressures, core inflation has so far remained low. In the United States, core inflation has eased since the start of the year, but it is generally expected that this will be temporary (Graph 1.12). Market measures of inflation expectations have been little changed this year, though consumer inflation expectations declined a little in recent months. Central banks in the major advanced economies continue to
R E S E R V E B A N K O F AU S T R A L I A1 0
Graph 1.13
investment growth in Japan and the euro area has been well above long-run averages for over a year, but supply constraints and rising input costs have weighed on residential construction activity in the United States since mid 2016.
Growth in business investment has picked up since late 2016 and has contributed significantly to GDP growth in the United States, Japan and some euro area economies over this period. The recovery in the United States was initially concentrated in the energy sector, but it has since broadened to other sectors. In Japan and the euro area, stronger demand and increasing capacity pressures have both supported investment. In Japan, a need for businesses to invest in labour-saving technologies, due to labour shortages, has also been a factor. Surveyed investment intentions and business conditions have risen to multi-year highs over the past year, suggesting that the strength in business investment is likely to be sustained for several quarters at least.
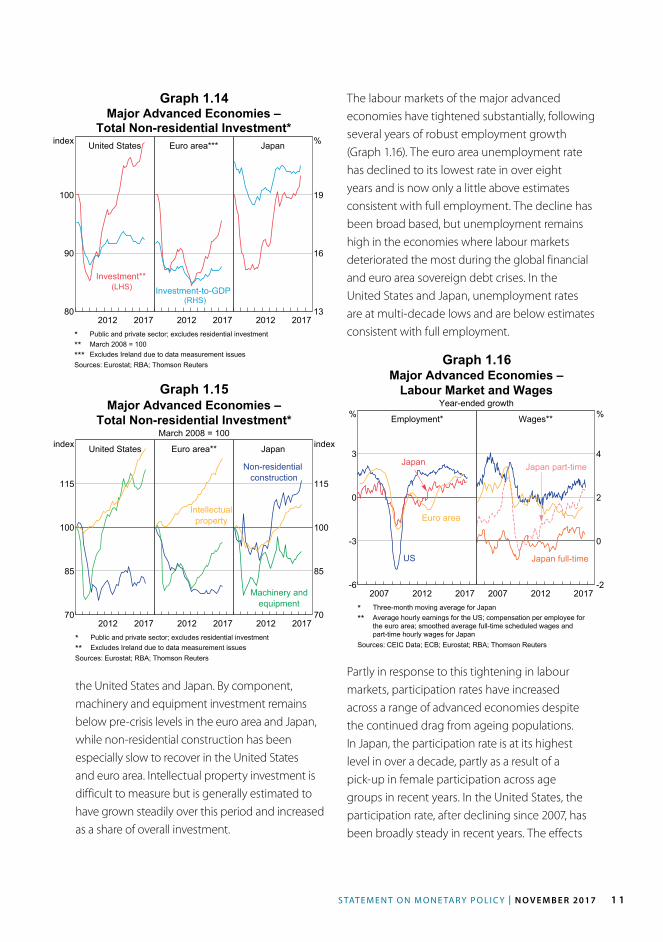
The recent increase in total business and government investment growth has been broad based across economies and investment components (Graph 1.14; Graph 1.15). Despite this, investment is generally a smaller share of GDP in the major advanced economies than it was in the lead-up to the global financial crisis. The large fall in investment during the crisis and a weaker recovery than would usually be expected thereafter have lowered the pace of capital stock accumulation; this has contributed to the lower growth of actual and potential GDP. In the euro area, investment remains below where it was pre-crisis in level terms; however, there is considerable variation across its member countries, with the largest declines and slowest recoveries in investment in economies that experienced the deepest recessions. In contrast, investment has surpassed its pre-crisis levels in
expect inflation to increase towards their targets over the next few years, as capacity constraints put upward pressure on wages and prices.
Growth in consumption continues to run at an above-average pace in the major advanced economies (Graph 1.13). This pace is likely to be maintained given robust employment growth, above-average consumer confidence and rising asset prices. However, nominal wage growth is yet to pick up much, which could present a downside risk to this outlook. Residential
Graph 1.12
Major Advanced Economies –GDP and Components
Year-ended growthGDP
0
2
4
%
US
Business investment
0
6
12
%
Euro area*Private consumption
2013 2017-6
-3
0
3
% Residential investment
2013 2017-20
-10
0
10
%
Japan
* Business investment is public and private non-residential investment;excludes Ireland due to data measurement issues
Sources: RBA; Thomson Reuters
United States – InflationPCE inflation
Year-ended growth
20122007 2017-2
0
2
4
%
Headline
Core**
Trimmed mean
Inflation expectations*
20122007 2017-2
0
2
4
%
Consumer (1-year)
Market(5-year/5-year forward)
* CPI inflation expectations adjusted for CPI and PCE difference** Excludes food and energySources: Bloomberg; RBA; Thomson Reuters
S TAT E M E N T O N M O N E TA R Y P O L I C Y | N O V E M B E R 2017 1 1
Graph 1.14
the United States and Japan. By component, machinery and equipment investment remains below pre-crisis levels in the euro area and Japan, while non-residential construction has been especially slow to recover in the United States and euro area. Intellectual property investment is difficult to measure but is generally estimated to have grown steadily over this period and increased as a share of overall investment.
Graph 1.15
Graph 1.16
Major Advanced Economies –Total Non-residential Investment*
United States
2012 201780
90
100
index
Investment**(LHS)
Euro area***
2012 2017
Investment-to-GDP(RHS)
Japan
2012 201713
16
19
%
* Public and private sector; excludes residential investment** March 2008 = 100*** Excludes Ireland due to data measurement issuesSources: Eurostat; RBA; Thomson Reuters
Major Advanced Economies –Total Non-residential Investment*
March 2008 = 100
United States
2012 201770
85
100
115
index Euro area**
2012 2017
Intellectualproperty
Japan
2012 201770
85
100
115
index
Machinery andequipment
Non-residentialconstruction
* Public and private sector; excludes residential investment** Excludes Ireland due to data measurement issuesSources: Eurostat; RBA; Thomson Reuters
The labour markets of the major advanced economies have tightened substantially, following several years of robust employment growth (Graph 1.16). The euro area unemployment rate has declined to its lowest rate in over eight years and is now only a little above estimates consistent with full employment. The decline has been broad based, but unemployment remains high in the economies where labour markets deteriorated the most during the global financial and euro area sovereign debt crises. In the United States and Japan, unemployment rates are at multi-decade lows and are below estimates consistent with full employment.
Major Advanced Economies –Labour Market and Wages
Year-ended growth
Employment*
20122007 2017-6
-3
0
3
%
Euro area
US
Japan
Wages**
20122007 2017-2
0
2
4
%
Japan part-time
Japan full-time
* Three-month moving average for Japan** Average hourly earnings for the US; compensation per employee forthe euro area; smoothed average full-time scheduled wages andpart-time hourly wages for Japan
Sources: CEIC Data; ECB; Eurostat; RBA; Thomson Reuters
Partly in response to this tightening in labour markets, participation rates have increased across a range of advanced economies despite the continued drag from ageing populations. In Japan, the participation rate is at its highest level in over a decade, partly as a result of a pick-up in female participation across age groups in recent years. In the United States, the participation rate, after declining since 2007, has been broadly steady in recent years. The effects

R E S E R V E B A N K O F AU S T R A L I A1 2
of ageing on the US labour supply have not been offset by a rising female participation rate as has been the case in a number of other advanced economies; this is because the female participation rate had already increased earlier in the United States.
Wage growth has been low across the major advanced economies in recent years, but is now showing signs of picking up in some economies as labour markets continue to tighten. In Japan, hourly wage growth in the more flexible part-time sector has increased steadily since 2010 and is around its highest rate in two decades; full-time wages have had their longest sustained increase since the early 2000s. Growth in a range of wage measures in the United States is above the post-crisis trough. Wage growth has also picked up a little in the euro area, especially in the economies closest to full employment.
Unit labour cost growth has also ticked up in the euro area and Japan; productivity growth has been above average but little changed over the year. Higher unit labour costs should put pressure on business margins and, over time, translate into higher inflation. The United States has seen a pick-up in productivity growth over the past year and, as a result, despite positive wage growth, unit labour costs have been little changed.
In the United Kingdom, growth eased in the first half of 2017, driven by weaker consumption and subdued investment growth. Inflation has increased sharply following the substantial depreciation of the pound, which followed the Brexit vote in mid 2016. Rising inflation has led to a decline in real wages and, along with average consumer confidence, this has contributed to the slower consumption growth. Business investment growth remains subdued, despite relatively strong conditions in the manufacturing sector, possibly due to uncertainty around Brexit.
Commodity PricesThe pick-up in global demand has boosted global commodity prices since the start of the year, but supply-side factors have led to different price movements across commodities since the previous Statement. Iron ore prices have fallen, while the prices of oil and base metals have increased (Table 1.1; Graph 1.17). The prices of coal and rural commodities are little changed.
Graph 1.17Commodity PricesJanuary 2012 average = 100
2013 201720
40
60
80
100
120
index
(spot prices)
Rural*
Bulk*
Base metals*
2013 201720
40
60
80
100
120
index
Brentcrude oil
LNG(spot price)
* RBA Index of Commodity Prices sub-indices; SDRSources: Bloomberg; RBA; Thomson Reuters
Over the past year or so, strong Chinese steel production has been a key driver of demand for iron ore and coking coal and has supported the prices of both of these commodities (see Graph 1.18, Graph 1.19 and ‘Box A: The Chinese Steel Market and Demand for Bulk Commodities’). Prices have also been supported by supply-side factors: global iron ore production has ramped up more slowly than expected, in part because some projects are only producing volumes near the bottom of their projected output ranges. The price of coking coal has been also driven up by supply disruptions, including those stemming from increased mine safety inspections in China and temporary supply disruptions in Australia. However, more recently, concerns about near-term Chinese demand,

S TAT E M E N T O N M O N E TA R Y P O L I C Y | N O V E M B E R 2017 1 3
Graph 1.18
2015201320112009 20170
50
100
150
US$/t
0
200
400
600
US$/tChinese Steel and Iron Ore Spot Prices
Chinese steel*
Iron ore**
(RHS)
(LHS, fines)
* Average of hot rolled steel sheet and steel rebar prices** Free on board basisSources: Bloomberg; RBA
Table 1.1: Commodity Price Growth(a)
SDR, per cent
Since previous Statement Over the past year
Bulk commodities –8 –26
– Iron ore –18 –13
– Coking coal 0 –43
– Thermal coal 3 –13
Rural –1 2
Base metals 11 24
Gold 2 –1
Brent crude oil(b) 22 41
RBA ICP –2 –4
– Using spot prices for bulk commodities –4 –15(a) Prices from the RBA Index of Commodity Prices (ICP); bulk commodity prices are spot prices(b) In US dollars Sources: Bloomberg; IHS; RBA
which have arisen ahead of planned steel production cuts during the winter months, have weighed on both iron ore and coking coal prices. In particular, a number of cities are requiring certain mills to cut steel production by 50 per cent over winter to reduce overall pollution. As a result, the prices of Chinese steel and its inputs have diverged recently; the steel price has been supported by expectations of production cuts, while expectations of lower demand for inputs
Coal PricesFree on board basis
Thermal coal
2013 20170
50
100
150
US$/t
Contract
Spot
Hard coking coal
2013 20170
100
200
300
US$/t
Sources: Department of Industry, Innovation and Science; IHS; RBA
Graph 1.19
has weighed on iron ore prices in particular. The spot price of iron ore has therefore fallen by almost 20 per cent since the previous Statement, while the spot prices of premium hard coking coal and thermal coal were little changed.
Oil prices have increased since the previous Statement following an improvement in the outlook for global demand, the possibility of an extension to production cuts by the Organization of the Petroleum Exporting Countries (OPEC)

R E S E R V E B A N K O F AU S T R A L I A1 4
and non-OPEC producers beyond March 2018 and heightened geopolitical tensions in the Middle East (Graph 1.17). The Asian liquefied natural gas (LNG) spot price has increased sharply in recent weeks, reflecting strong demand from China and South Korea. Another factor has been increased expectations by market participants that Australian LNG exports sold into the spot market by Queensland producers will be limited; to a large extent this reflects their commitment to meet the projected shortfall in domestic east coast gas. This will have little impact on Australian export revenues, however, because the bulk of Australia’s LNG exports are sold via long-term contracts.
Base metal prices have also risen in recent months and are almost 25 per cent higher over the past year. The increase has coincided with the improvement in global economic conditions, although developments in supply, in particular cuts to Chinese domestic production, have also contributed.
As discussed in the ‘Economic Outlook’ chapter, Australia’s terms of trade are still expected to decline over the forecast period, consistent with lower Chinese demand and further increases in low-cost supply of bulk commodities. However, there is a risk of some near-term volatility given the decision by Chinese authorities to implement substantial cuts to steel production for environmental reasons over the next few months. R