Embed Size (px)
Citation preview

DOE/EIA-0484(2006)
In t erna t i ona lEnergy Out look
2006
June 2006
Energy Information AdministrationOffice of Integrated Analysis and Forecasting
U.S. Department of EnergyWashington, DC 20585
This report was prepared by the Energy Information Administration, the independent statistical andanalytical agency within the Department of Energy. The information contained herein should beattributed to the Energy Information Administration and should not be construed as advocating orreflecting any policy position of the Department of Energy or of any other organization.
This publication is on the WEB at:
www.eia.doe.gov/oiaf/ieo/index.html.

Contacts
The International Energy Outlook is prepared by the Ener-gy Information Administration (EIA). General questionsconcerning the contents of the report should be referredto John J. Conti ([email protected], 202-586-2222),Director, Office of Integrated Analysis and Forecasting,
or Glen E. Sweetnam, Director, International, Economic,and Greenhouse Gases Division ([email protected], 202-586-2188). Specific questions about thereport should be referred to Linda E. Doman (202/586-1041) or the following analysts:
World Energy and Economic Outlook. . . Linda Doman ([email protected], 202-586-1041)Macroeconomic Assumptions . . . . . . Nasir Khilji ([email protected], 202-586-1294)
Energy Consumption by End-Use SectorResidential Energy Use . . . . . . . . . . . John Cymbalsky ([email protected], 202-586-4815)Commercial Energy Use. . . . . . . . . . . Erin Boedecker ([email protected], 202-586-4791)Industrial Energy Use. . . . . . . . . . . . . Brian Unruh ([email protected], 202-586-1344)Transportation Energy Use . . . . . . . . Bhima Sastri ([email protected], 202-586-2854)
World Oil Markets . . . . . . . . . . . . . . . . . . . John Staub ([email protected], 202-586-6344)Linda Doman ([email protected], 202-586-1041)
Natural Gas . . . . . . . . . . . . . . . . . . . . . . . . . Justine Barden ([email protected] 202-586-3508)Phyllis Martin ([email protected], 202-586-9592)
LNG in China. . . . . . . . . . . . . . . . . . . . Aloulou Fawzi ([email protected], 202-586-7818)Gas-to-Liquids . . . . . . . . . . . . . . . . . . . Justine Barden ([email protected] 202-586-3508)
Coal . . . . . . . . . . . . . . . . . . . . . . . . . . . . . . . . Michael Mellish ([email protected], 202-586-2136)Diane Kearney ([email protected], 202-586-2415)
Electricity . . . . . . . . . . . . . . . . . . . . . . . . . . . John Staub ([email protected], 202-586-6344)Levelized Cost Calculations . . . . . . . Robert Eynon ([email protected] 202-586-2392)
Carbon Dioxide Emissions. . . . . . . . . . . . . Perry Lindstrom ([email protected], 202-586-0934)
ii Energy Information Administration / International Energy Outlook 2006
Electronic Access and Related Reports
IEO2006 will be available on CD-ROM and on the EIA Home Page (http://www.eia.doe.gov/oiaf/ieo/index.html) by July2006, including text, forecast tables, and graphics. To download the entire publication in Portable Document Format(PDF), go to http://www.eia.doe.gov/oiaf/ieo/pdf/0484(2006).pdf.
For ordering information and questions on other energy statistics available from EIA, please contact EIA’s NationalEnergy Information Center. Addresses, telephone numbers, and hours are as follows:
National Energy Information Center, EI-30Energy Information AdministrationForrestal BuildingWashington, DC 20585
Telephone: 202/586-8800 E-mail: [email protected]: For people who are deaf World Wide Web Site: http://www.eia.doe.gov
or hard of hearing: 202/586-1181 Gopher Site: gopher://gopher.eia.doe.gov9 a.m. to 4 p.m., eastern time, M-F FTP Site: ftp://ftp.eia.doe.gov

Contents
Energy Information Administration / International Energy Outlook 2006 iii
Preface . . . . . . . . . . . . . . . . . . . . . . . . . . . . . . . . . . . . . . . . . . . . . . . . . . . . . . . . . . . . . . . . . . . . . . . . . . . . . . . . . . . . . . . . . . . . . vii
Highlights . . . . . . . . . . . . . . . . . . . . . . . . . . . . . . . . . . . . . . . . . . . . . . . . . . . . . . . . . . . . . . . . . . . . . . . . . . . . . . . . . . . . . . . . . . 1
1. World Energy and Economic Outlook . . . . . . . . . . . . . . . . . . . . . . . . . . . . . . . . . . . . . . . . . . . . . . . . . . . . . . . . . . . . . . . . 7Outlook for World Energy Consumption . . . . . . . . . . . . . . . . . . . . . . . . . . . . . . . . . . . . . . . . . . . . . . . . . . . . . . . . . . . . . . 8World Economic Outlook . . . . . . . . . . . . . . . . . . . . . . . . . . . . . . . . . . . . . . . . . . . . . . . . . . . . . . . . . . . . . . . . . . . . . . . . . . . 11Alternative Growth Cases. . . . . . . . . . . . . . . . . . . . . . . . . . . . . . . . . . . . . . . . . . . . . . . . . . . . . . . . . . . . . . . . . . . . . . . . . . . 13Trends in Energy Intensity . . . . . . . . . . . . . . . . . . . . . . . . . . . . . . . . . . . . . . . . . . . . . . . . . . . . . . . . . . . . . . . . . . . . . . . . . . 14
2. Energy Consumption by End-Use Sector . . . . . . . . . . . . . . . . . . . . . . . . . . . . . . . . . . . . . . . . . . . . . . . . . . . . . . . . . . . . . . 17Residential Sector . . . . . . . . . . . . . . . . . . . . . . . . . . . . . . . . . . . . . . . . . . . . . . . . . . . . . . . . . . . . . . . . . . . . . . . . . . . . . . . . . . 17Commercial Sector . . . . . . . . . . . . . . . . . . . . . . . . . . . . . . . . . . . . . . . . . . . . . . . . . . . . . . . . . . . . . . . . . . . . . . . . . . . . . . . . . 18Industrial Sector . . . . . . . . . . . . . . . . . . . . . . . . . . . . . . . . . . . . . . . . . . . . . . . . . . . . . . . . . . . . . . . . . . . . . . . . . . . . . . . . . . . 19Transportation Sector . . . . . . . . . . . . . . . . . . . . . . . . . . . . . . . . . . . . . . . . . . . . . . . . . . . . . . . . . . . . . . . . . . . . . . . . . . . . . . 21References . . . . . . . . . . . . . . . . . . . . . . . . . . . . . . . . . . . . . . . . . . . . . . . . . . . . . . . . . . . . . . . . . . . . . . . . . . . . . . . . . . . . . . . . 23
3. World Oil Markets . . . . . . . . . . . . . . . . . . . . . . . . . . . . . . . . . . . . . . . . . . . . . . . . . . . . . . . . . . . . . . . . . . . . . . . . . . . . . . . . . 25World Oil Demand . . . . . . . . . . . . . . . . . . . . . . . . . . . . . . . . . . . . . . . . . . . . . . . . . . . . . . . . . . . . . . . . . . . . . . . . . . . . . . . . 25Oil Reserves and Resources. . . . . . . . . . . . . . . . . . . . . . . . . . . . . . . . . . . . . . . . . . . . . . . . . . . . . . . . . . . . . . . . . . . . . . . . . . 27The Composition of World Oil Supply . . . . . . . . . . . . . . . . . . . . . . . . . . . . . . . . . . . . . . . . . . . . . . . . . . . . . . . . . . . . . . . . 28World Oil Prices . . . . . . . . . . . . . . . . . . . . . . . . . . . . . . . . . . . . . . . . . . . . . . . . . . . . . . . . . . . . . . . . . . . . . . . . . . . . . . . . . . . 32Worldwide Petroleum Trade . . . . . . . . . . . . . . . . . . . . . . . . . . . . . . . . . . . . . . . . . . . . . . . . . . . . . . . . . . . . . . . . . . . . . . . . 33References . . . . . . . . . . . . . . . . . . . . . . . . . . . . . . . . . . . . . . . . . . . . . . . . . . . . . . . . . . . . . . . . . . . . . . . . . . . . . . . . . . . . . . . . 34
4. Natural Gas . . . . . . . . . . . . . . . . . . . . . . . . . . . . . . . . . . . . . . . . . . . . . . . . . . . . . . . . . . . . . . . . . . . . . . . . . . . . . . . . . . . . . . . 37Reserves and Resources . . . . . . . . . . . . . . . . . . . . . . . . . . . . . . . . . . . . . . . . . . . . . . . . . . . . . . . . . . . . . . . . . . . . . . . . . . . . 38World Natural Gas Supply . . . . . . . . . . . . . . . . . . . . . . . . . . . . . . . . . . . . . . . . . . . . . . . . . . . . . . . . . . . . . . . . . . . . . . . . . . 39World Natural Gas Demand . . . . . . . . . . . . . . . . . . . . . . . . . . . . . . . . . . . . . . . . . . . . . . . . . . . . . . . . . . . . . . . . . . . . . . . . . 41References . . . . . . . . . . . . . . . . . . . . . . . . . . . . . . . . . . . . . . . . . . . . . . . . . . . . . . . . . . . . . . . . . . . . . . . . . . . . . . . . . . . . . . . . 49
5. World Coal Markets . . . . . . . . . . . . . . . . . . . . . . . . . . . . . . . . . . . . . . . . . . . . . . . . . . . . . . . . . . . . . . . . . . . . . . . . . . . . . . . . 51Reserves . . . . . . . . . . . . . . . . . . . . . . . . . . . . . . . . . . . . . . . . . . . . . . . . . . . . . . . . . . . . . . . . . . . . . . . . . . . . . . . . . . . . . . . . . . 51Regional Demand Forecasts . . . . . . . . . . . . . . . . . . . . . . . . . . . . . . . . . . . . . . . . . . . . . . . . . . . . . . . . . . . . . . . . . . . . . . . . . 52Trade . . . . . . . . . . . . . . . . . . . . . . . . . . . . . . . . . . . . . . . . . . . . . . . . . . . . . . . . . . . . . . . . . . . . . . . . . . . . . . . . . . . . . . . . . . . . 56References . . . . . . . . . . . . . . . . . . . . . . . . . . . . . . . . . . . . . . . . . . . . . . . . . . . . . . . . . . . . . . . . . . . . . . . . . . . . . . . . . . . . . . . . 59
6. Electricity . . . . . . . . . . . . . . . . . . . . . . . . . . . . . . . . . . . . . . . . . . . . . . . . . . . . . . . . . . . . . . . . . . . . . . . . . . . . . . . . . . . . . . . . . 63Net Electricity Consumption . . . . . . . . . . . . . . . . . . . . . . . . . . . . . . . . . . . . . . . . . . . . . . . . . . . . . . . . . . . . . . . . . . . . . . . . 63Electricity Supply . . . . . . . . . . . . . . . . . . . . . . . . . . . . . . . . . . . . . . . . . . . . . . . . . . . . . . . . . . . . . . . . . . . . . . . . . . . . . . . . . . 65References . . . . . . . . . . . . . . . . . . . . . . . . . . . . . . . . . . . . . . . . . . . . . . . . . . . . . . . . . . . . . . . . . . . . . . . . . . . . . . . . . . . . . . . . 70
7. Energy-Related Carbon Dioxide Emissions . . . . . . . . . . . . . . . . . . . . . . . . . . . . . . . . . . . . . . . . . . . . . . . . . . . . . . . . . . . 71Reference Case . . . . . . . . . . . . . . . . . . . . . . . . . . . . . . . . . . . . . . . . . . . . . . . . . . . . . . . . . . . . . . . . . . . . . . . . . . . . . . . . . . . . 72Kyoto Protocol Case. . . . . . . . . . . . . . . . . . . . . . . . . . . . . . . . . . . . . . . . . . . . . . . . . . . . . . . . . . . . . . . . . . . . . . . . . . . . . . . . 75References . . . . . . . . . . . . . . . . . . . . . . . . . . . . . . . . . . . . . . . . . . . . . . . . . . . . . . . . . . . . . . . . . . . . . . . . . . . . . . . . . . . . . . . . 78

Appendixes
Tables
Figures
iv Energy Information Administration / International Energy Outlook 2006
1. World Marketed Energy Consumption by Country Grouping, 2003-2030 . . . . . . . . . . . . . . . . . . . . . . . . . . . . . . . . 72. Average Annual Growth in World Gross Domestic Product by Selected Countries and Regions, 1978-2030 . . . . 123. World Oil Reserves by Country as of January 1, 2006 . . . . . . . . . . . . . . . . . . . . . . . . . . . . . . . . . . . . . . . . . . . . . . . . . . 284. Estimated World Oil Resources, 1995-2025 . . . . . . . . . . . . . . . . . . . . . . . . . . . . . . . . . . . . . . . . . . . . . . . . . . . . . . . . . . 295. OPEC Oil Production, 1990-2030. . . . . . . . . . . . . . . . . . . . . . . . . . . . . . . . . . . . . . . . . . . . . . . . . . . . . . . . . . . . . . . . . . . 306. Non-OPEC Oil Production, 1990-2030 . . . . . . . . . . . . . . . . . . . . . . . . . . . . . . . . . . . . . . . . . . . . . . . . . . . . . . . . . . . . . . 317. Worldwide Petroleum Trade in the Reference Case, 2003 and 2030 . . . . . . . . . . . . . . . . . . . . . . . . . . . . . . . . . . . . . . 348. World Natural Gas Reserves by Country as of January 1, 2006 . . . . . . . . . . . . . . . . . . . . . . . . . . . . . . . . . . . . . . . . . . 399. World Natural Gas Production by Region and Country, 2003-2030 . . . . . . . . . . . . . . . . . . . . . . . . . . . . . . . . . . . . . . 40
10. World Recoverable Coal Reserves . . . . . . . . . . . . . . . . . . . . . . . . . . . . . . . . . . . . . . . . . . . . . . . . . . . . . . . . . . . . . . . . . 5211. World Coal Flows by Importing and Exporting Regions, Reference Case, 2004, 2015, and 2030 . . . . . . . . . . . . . . . 5812. World Carbon Dioxide Emissions by Region, 1990-2030 . . . . . . . . . . . . . . . . . . . . . . . . . . . . . . . . . . . . . . . . . . . . . . . 7313. Carbon Dioxide Intensity by Region and Country, 1990-2030 . . . . . . . . . . . . . . . . . . . . . . . . . . . . . . . . . . . . . . . . . . . 7414. Energy Consumption and Carbon Dioxide Emissions by Fuel in Participating Annex I Countries
in Two Cases, 2010 and 2030 . . . . . . . . . . . . . . . . . . . . . . . . . . . . . . . . . . . . . . . . . . . . . . . . . . . . . . . . . . . . . . . . . . . . . . . 7615. Energy Consumption and Carbon Dioxide Emissions by Fuel in Canada in Two Cases, 2010 and 2030 . . . . . . . . 7716. Energy Consumption and Carbon Dioxide Emissions by Fuel in OECD Europe in Two Cases, 2010 and 2030 . . 7817. Energy Consumption and Carbon Dioxide Emissions by Fuel in Japan in Two Cases, 2010 and 2030 . . . . . . . . . . 79
A. Reference Case Projections. . . . . . . . . . . . . . . . . . . . . . . . . . . . . . . . . . . . . . . . . . . . . . . . . . . . . . . . . . . . . . . . . . . . . . . . 81B. High Economic Growth Case Projections . . . . . . . . . . . . . . . . . . . . . . . . . . . . . . . . . . . . . . . . . . . . . . . . . . . . . . . . . . . 99C. Low Economic Growth Case Projections . . . . . . . . . . . . . . . . . . . . . . . . . . . . . . . . . . . . . . . . . . . . . . . . . . . . . . . . . . . . 115D. Reference Case Projections by End-Use Sector and Region . . . . . . . . . . . . . . . . . . . . . . . . . . . . . . . . . . . . . . . . . . . . . 131E. Projections of Oil Production Capacity and Oil Production in Three Cases . . . . . . . . . . . . . . . . . . . . . . . . . . . . . . . 153F. Reference Case Projections for Electricity Capacity and Generation by Fuel . . . . . . . . . . . . . . . . . . . . . . . . . . . . . . 161G. Key Assumptions for the IEO2006 Kyoto Protocol Case . . . . . . . . . . . . . . . . . . . . . . . . . . . . . . . . . . . . . . . . . . . . . . . 175H. Comparisons With Other Forecasts, and Performance of Past IEO Forecasts for 1990, 1995, and 2000 . . . . . . . . . 177I. System for the Analysis of Global Energy Markets (SAGE) . . . . . . . . . . . . . . . . . . . . . . . . . . . . . . . . . . . . . . . . . . . . . 189J. Regional Definitions . . . . . . . . . . . . . . . . . . . . . . . . . . . . . . . . . . . . . . . . . . . . . . . . . . . . . . . . . . . . . . . . . . . . . . . . . . . . . 191
1. World Marketed Energy Consumption by Region, 1980-2030. . . . . . . . . . . . . . . . . . . . . . . . . . . . . . . . . . . . . . . . . . . 12. World Delivered Energy Consumption by End-Use Sector, 2003-2030 . . . . . . . . . . . . . . . . . . . . . . . . . . . . . . . . . . . 13. World Marketed Energy Use by Energy Type, 1980-2030. . . . . . . . . . . . . . . . . . . . . . . . . . . . . . . . . . . . . . . . . . . . . . . 24. Fuel Shares of World Marketed Energy Use, 2003, 2015, and 2030 . . . . . . . . . . . . . . . . . . . . . . . . . . . . . . . . . . . . . . . 25. World Energy Consumption for Electricity Generation by Fuel Type, 2003, 2015, and 2030 . . . . . . . . . . . . . . . . . . 36. World Carbon Dioxide Emissions in Two Cases, 1990, 2010, and 2030 . . . . . . . . . . . . . . . . . . . . . . . . . . . . . . . . . . . . 47. World Marketed Energy Consumption, 1980-2030 . . . . . . . . . . . . . . . . . . . . . . . . . . . . . . . . . . . . . . . . . . . . . . . . . . . . 78. World Marketed Energy Use: OECD and Non-OECD, 1980-2030. . . . . . . . . . . . . . . . . . . . . . . . . . . . . . . . . . . . . . . . 89. Marketed Energy Use in the Non-OECD Economies by Region, 1980-2030. . . . . . . . . . . . . . . . . . . . . . . . . . . . . . . . 8
10. World Marketed Energy Use by Fuel Type, 1980-2030 . . . . . . . . . . . . . . . . . . . . . . . . . . . . . . . . . . . . . . . . . . . . . . . . . 811. Comparison of IEO2005 and IEO2006 World Oil Price Projections, 1980-2030 . . . . . . . . . . . . . . . . . . . . . . . . . . . . . 912. Comparison of IEO2005 and IEO2006 Projections for World Coal Consumption, 2002-2030 . . . . . . . . . . . . . . . . . 913. World Nuclear Generating Capacity by Region, 2003 and 2030. . . . . . . . . . . . . . . . . . . . . . . . . . . . . . . . . . . . . . . . . . 1014. World Marketed Energy Consumption in Three Economic Growth Cases, 1980-2030. . . . . . . . . . . . . . . . . . . . . . . 1415. Growth in Energy Use and Gross Domestic Product for the OECD Economies, 1980-2030 . . . . . . . . . . . . . . . . . . . 1416. Growth in Energy Use and Gross Domestic Product for the Non-OECD Economies, 1980-2030 . . . . . . . . . . . . . . 1517. Growth in Energy Use and Gross Domestic Product for the Non-OECD Economies of Europe
and Eurasia, 1980-2030 . . . . . . . . . . . . . . . . . . . . . . . . . . . . . . . . . . . . . . . . . . . . . . . . . . . . . . . . . . . . . . . . . . . . . . . . . . . 1518. Energy Intensity by Region, 1980-2030 . . . . . . . . . . . . . . . . . . . . . . . . . . . . . . . . . . . . . . . . . . . . . . . . . . . . . . . . . . . . . . 1519. OECD and Non-OECD Residential Sector Delivered Energy Consumption, 2003-2030 . . . . . . . . . . . . . . . . . . . . . 1720. Growth in OECD and Non-OECD Residential Sector Delivered Energy Consumption by Fuel, 2003-2030 . . . . . 1821. OECD and Non-OECD Commercial Sector Delivered Energy Consumption, 2003-2030 . . . . . . . . . . . . . . . . . . . . 1922. Growth in OECD and Non-OECD Commercial Sector Delivered Energy Consumption by Fuel, 2003-2030 . . . . 19

Figures (Continued)
Energy Information Administration / International Energy Outlook 2006 v
23. OECD and Non-OECD Industrial Sector Delivered Energy Consumption, 2003-2030 . . . . . . . . . . . . . . . . . . . . . . 2024. Growth in OECD and Non-OECD Industrial Sector Delivered Energy Consumption by Fuel, 2003-2030 . . . . . . 2125. OECD and Non-OECD Transportation Sector Delivered Energy Consumption, 2003-2030 . . . . . . . . . . . . . . . . . . 2226. World Oil Consumption by Sector, 2003-2030 . . . . . . . . . . . . . . . . . . . . . . . . . . . . . . . . . . . . . . . . . . . . . . . . . . . . . . . . 2627. World Oil Consumption by Region and Country Group, 2003 and 2030 . . . . . . . . . . . . . . . . . . . . . . . . . . . . . . . . . . 2728. World Crude Oil Reserves, 1980-2006 . . . . . . . . . . . . . . . . . . . . . . . . . . . . . . . . . . . . . . . . . . . . . . . . . . . . . . . . . . . . . . . 2729. World Proved Oil Reserves by Geographic Region as of January 1, 2006 . . . . . . . . . . . . . . . . . . . . . . . . . . . . . . . . . . 2830. OPEC and Non-OPEC Total Petroleum Liquids Production, 1990, 2003, and 2010-2030 . . . . . . . . . . . . . . . . . . . . . 3031. OPEC, Non-OPEC, and Unconventional Oil Production, 1990, 2003, and 2010-2030 . . . . . . . . . . . . . . . . . . . . . . . . 3032. World Oil Prices in Three Cases, 1980-2030 . . . . . . . . . . . . . . . . . . . . . . . . . . . . . . . . . . . . . . . . . . . . . . . . . . . . . . . . . . 3233. Imports of Persian Gulf Oil by Importing Region, 2003 and 2030 . . . . . . . . . . . . . . . . . . . . . . . . . . . . . . . . . . . . . . . . 3534. World Natural Gas Consumption by Region, 1990-2030 . . . . . . . . . . . . . . . . . . . . . . . . . . . . . . . . . . . . . . . . . . . . . . . 3735. World Natural Gas Consumption by End-Use Sector, 2003-2030 . . . . . . . . . . . . . . . . . . . . . . . . . . . . . . . . . . . . . . . . 3736. World Natural Gas Reserves by Region, 1980-2006 . . . . . . . . . . . . . . . . . . . . . . . . . . . . . . . . . . . . . . . . . . . . . . . . . . . . 3837. World Natural Gas Reserves by Geographic Region as of January 1, 2006 . . . . . . . . . . . . . . . . . . . . . . . . . . . . . . . . . 3838. World Natural Gas Resources by Geographic Region, 2006-2025 . . . . . . . . . . . . . . . . . . . . . . . . . . . . . . . . . . . . . . . . 3939. OECD Natural Gas Supply by Source, 2003-2030 . . . . . . . . . . . . . . . . . . . . . . . . . . . . . . . . . . . . . . . . . . . . . . . . . . . . . 4140. Natural Gas Consumption in North America by Country, 2003-2030. . . . . . . . . . . . . . . . . . . . . . . . . . . . . . . . . . . . . 4141. U.S. Natural Gas Supply by Source, 1990-2030. . . . . . . . . . . . . . . . . . . . . . . . . . . . . . . . . . . . . . . . . . . . . . . . . . . . . . . . 4242. Natural Gas Consumption in OECD Europe by End-Use Sector, 2003-2030 . . . . . . . . . . . . . . . . . . . . . . . . . . . . . . . 4343. Natural Gas Consumption in OECD Asia by Country, 2003-2030 . . . . . . . . . . . . . . . . . . . . . . . . . . . . . . . . . . . . . . . . 4344. Natural Gas Consumption in Non-OECD Europe and Eurasia by End-Use Sector, 2003-2030 . . . . . . . . . . . . . . . . 4445. Natural Gas Supply in China and India by Source, 2003, 2015, and 2030 . . . . . . . . . . . . . . . . . . . . . . . . . . . . . . . . . . 4446. Natural Gas Consumption in Africa and the Middle East, 2003-2030 . . . . . . . . . . . . . . . . . . . . . . . . . . . . . . . . . . . . . 4747. Natural Gas Consumption in Brazil and Other Central and South America, 2003-2030 . . . . . . . . . . . . . . . . . . . . . . 4948. World Coal Consumption by Region, 1980-2030 . . . . . . . . . . . . . . . . . . . . . . . . . . . . . . . . . . . . . . . . . . . . . . . . . . . . . . 5149. Coal Share of World Energy Consumption by Sector, 2003, 2015, and 2030 . . . . . . . . . . . . . . . . . . . . . . . . . . . . . . . . 5150. OECD Coal Consumption by Region, 1980, 2003, 2015, and 2030 . . . . . . . . . . . . . . . . . . . . . . . . . . . . . . . . . . . . . . . . 5351. Non-OECD Coal Consumption by Region, 1980, 2003, 2015, and 2030. . . . . . . . . . . . . . . . . . . . . . . . . . . . . . . . . . . . 5452. Coal Consumption in China by Sector, 2003, 2015, and 2030 . . . . . . . . . . . . . . . . . . . . . . . . . . . . . . . . . . . . . . . . . . . . 5553. World Coal Trade, 1985, 2004, 2015, and 2030 . . . . . . . . . . . . . . . . . . . . . . . . . . . . . . . . . . . . . . . . . . . . . . . . . . . . . . . . 5754. Coal Imports by Major Importing Region, 1995-2030 . . . . . . . . . . . . . . . . . . . . . . . . . . . . . . . . . . . . . . . . . . . . . . . . . . 5955. World Net Electricity Consumption, 2003-2030. . . . . . . . . . . . . . . . . . . . . . . . . . . . . . . . . . . . . . . . . . . . . . . . . . . . . . . 6356. World Net Electricity Consumption by Region, 1980-2030. . . . . . . . . . . . . . . . . . . . . . . . . . . . . . . . . . . . . . . . . . . . . . 6357. Net Electricity Consumption in OECD Countries by End-Use Sector, 2003, 2015, and 2030 . . . . . . . . . . . . . . . . . . 6458. Net Electricity Consumption in Non-OECD Countries by End-Use Sector, 2003, 2015, and 2030 . . . . . . . . . . . . . . 6559. World Electricity Generating Capacity by Fuel Type, 2003-2030 . . . . . . . . . . . . . . . . . . . . . . . . . . . . . . . . . . . . . . . . . 6560. Shares of OECD Installed Electricity Capacity by Fuel Type, 2003-2030. . . . . . . . . . . . . . . . . . . . . . . . . . . . . . . . . . . 6761. Fuel Shares of World Electricity Generation, 2003-2030 . . . . . . . . . . . . . . . . . . . . . . . . . . . . . . . . . . . . . . . . . . . . . . . . 6762. World Installed Coal-Fired Generating Capacity, 2003-2030 . . . . . . . . . . . . . . . . . . . . . . . . . . . . . . . . . . . . . . . . . . . . 6863. Non-OECD Installed Nuclear Generating Capacity, 2003-2030. . . . . . . . . . . . . . . . . . . . . . . . . . . . . . . . . . . . . . . . . . 6964. Nuclear Shares of National Electricity Generation, 2005. . . . . . . . . . . . . . . . . . . . . . . . . . . . . . . . . . . . . . . . . . . . . . . . 6965. World Carbon Dioxide Emissions by Region, 1990-2030 . . . . . . . . . . . . . . . . . . . . . . . . . . . . . . . . . . . . . . . . . . . . . . . 7166. World Carbon Dioxide Emissions by Fuel Type, 1980-2030 . . . . . . . . . . . . . . . . . . . . . . . . . . . . . . . . . . . . . . . . . . . . . 7267. Carbon Dioxide Emissions in the OECD Economies, 1990-2030 . . . . . . . . . . . . . . . . . . . . . . . . . . . . . . . . . . . . . . . . . 7268. Carbon Dioxide Emissions in Non-OECD Europe and Eurasia, 1990-2030 . . . . . . . . . . . . . . . . . . . . . . . . . . . . . . . . 7369. Carbon Dioxide Emissions in Other Non-OECD Economies, 1990-2030 . . . . . . . . . . . . . . . . . . . . . . . . . . . . . . . . . . 7470. Carbon Dioxide Allowance Price in the European Union, March 2005–May 2006 . . . . . . . . . . . . . . . . . . . . . . . . . . 77

Appendix Tables
vi Energy Information Administration / International Energy Outlook 2006
A1. World Total Energy Consumption by Region, Reference Case, 1990-2030. . . . . . . . . . . . . . . . . . . . . . . . . . . . . . . . 83A2. World Total Energy Consumption by Region and Fuel, Reference Case, 1990-2030. . . . . . . . . . . . . . . . . . . . . . . . 84A3. World Gross Domestic Product (GDP) by Region, Reference Case, 1990-2030 . . . . . . . . . . . . . . . . . . . . . . . . . . . . 86A4. World Oil Consumption by Region, Reference Case, 1990-2030 . . . . . . . . . . . . . . . . . . . . . . . . . . . . . . . . . . . . . . . . 87A5. World Natural Gas Consumption by Region, Reference Case, 1990-2030 . . . . . . . . . . . . . . . . . . . . . . . . . . . . . . . . 88A6. World Coal Consumption by Region, Reference Case, 1990-2030 . . . . . . . . . . . . . . . . . . . . . . . . . . . . . . . . . . . . . . . 89A7. World Nuclear Energy Consumption by Region, Reference Case, 1990-2030 . . . . . . . . . . . . . . . . . . . . . . . . . . . . . 90A8. World Consumption of Hydroelectricity and Other Renewable Energy by Region, Reference Case,
1990-2030. . . . . . . . . . . . . . . . . . . . . . . . . . . . . . . . . . . . . . . . . . . . . . . . . . . . . . . . . . . . . . . . . . . . . . . . . . . . . . . . . . . . . . 91A9. World Net Electricity Consumption by Region, Reference Case, 1990-2030 . . . . . . . . . . . . . . . . . . . . . . . . . . . . . . 92
A10. World Carbon Dioxide Emissions by Region, Reference Case, 1990-2030 . . . . . . . . . . . . . . . . . . . . . . . . . . . . . . . . 93A11. World Carbon Dioxide Emissions from Oil Use by Region, Reference Case, 1990-2030 . . . . . . . . . . . . . . . . . . . . . 94A12. World Carbon Dioxide Emissions from Natural Gas Use by Region, Reference Case, 1990-2030 . . . . . . . . . . . . . 95A13. World Carbon Dioxide Emissions from Coal Use by Region, Reference Case, 1990-2030 . . . . . . . . . . . . . . . . . . . 96A14. World Population by Region, Reference Case, 1990-2030. . . . . . . . . . . . . . . . . . . . . . . . . . . . . . . . . . . . . . . . . . . . . . 97
B1. World Total Energy Consumption by Region, High Economic Growth Case, 1990-2030. . . . . . . . . . . . . . . . . . . . 101B2. World Total Energy Consumption by Region and Fuel, High Economic Growth Case, 1990-2030. . . . . . . . . . . . 102B3. World Gross Domestic Product (GDP) by Region, High Economic Growth Case, 1990-2030 . . . . . . . . . . . . . . . . 104B4. World Oil Consumption by Region, High Economic Growth Case, 1990-2030 . . . . . . . . . . . . . . . . . . . . . . . . . . . . 105B5. World Natural Gas Consumption by Region, High Economic Growth Case, 1990-2030 . . . . . . . . . . . . . . . . . . . . 106B6. World Coal Consumption by Region, High Economic Growth Case, 1990-2030 . . . . . . . . . . . . . . . . . . . . . . . . . . . 107B7. World Nuclear Energy Consumption by Region, High Economic Growth Case, 1990-2030 . . . . . . . . . . . . . . . . . 108B8. World Consumption of Hydroelectricity and Other Renewable Energy by Region,
High Economic Growth Case, 1990-2030 . . . . . . . . . . . . . . . . . . . . . . . . . . . . . . . . . . . . . . . . . . . . . . . . . . . . . . . . . . . 109B9. World Net Electricity Consumption by Region, High Economic Growth Case, 1990-2030 . . . . . . . . . . . . . . . . . . 110
B10. World Carbon Dioxide Emissions by Region, High Economic Growth Case, 1990-2030 . . . . . . . . . . . . . . . . . . . . 111B11. World Carbon Dioxide Emissions from Oil Use by Region, High Economic Growth Case, 1990-2030. . . . . . . . . 112B12. World Carbon Dioxide Emissions from Natural Gas Use by Region, High Economic Growth Case,
1990-2030. . . . . . . . . . . . . . . . . . . . . . . . . . . . . . . . . . . . . . . . . . . . . . . . . . . . . . . . . . . . . . . . . . . . . . . . . . . . . . . . . . . . . . 113B13. World Carbon Dioxide Emissions from Coal Use by Region, High Economic Growth Case, 1990-2030 . . . . . . . 114C1. World Total Energy Consumption by Region, Low Economic Growth Case, 1990-2030 . . . . . . . . . . . . . . . . . . . . 117C2. World Total Energy Consumption by Region and Fuel, Low Economic Growth Case, 1990-2030 . . . . . . . . . . . . 118C3. World Gross Domestic Product (GDP) by Region, Low Economic Growth Case, 1990-2030 . . . . . . . . . . . . . . . . . 120C4. World Oil Consumption by Region, Low Economic Growth Case, 1990-2030. . . . . . . . . . . . . . . . . . . . . . . . . . . . . 121C5. World Natural Gas Consumption by Region, Low Economic Growth Case, 1990-2030 . . . . . . . . . . . . . . . . . . . . . 122C6. World Coal Consumption by Region, Low Economic Growth Case, 1990-2030 . . . . . . . . . . . . . . . . . . . . . . . . . . . 123C7. World Nuclear Energy Consumption by Region, Low Economic Growth Case, 1990-2030. . . . . . . . . . . . . . . . . . 124C8. World Consumption of Hydroelectricity and Other Renewable Energy by Region,
High Economic Growth Case, 1990-2030 . . . . . . . . . . . . . . . . . . . . . . . . . . . . . . . . . . . . . . . . . . . . . . . . . . . . . . . . . . . 125C9. World Net Electricity Consumption by Region, Low Economic Growth Case, 1990-2030 . . . . . . . . . . . . . . . . . . . 126
C10. World Carbon Dioxide Emissions by Region, Low Economic Growth Case, 1990-2030. . . . . . . . . . . . . . . . . . . . . 127C11. World Carbon Dioxide Emissions from Oil Use by Region, Low Economic Growth Case, 1990-2030 . . . . . . . . . 128C12. World Carbon Dioxide Emissions from Natural Gas Use by Region, Low Economic Growth Case,
1990-2030. . . . . . . . . . . . . . . . . . . . . . . . . . . . . . . . . . . . . . . . . . . . . . . . . . . . . . . . . . . . . . . . . . . . . . . . . . . . . . . . . . . . . . 129C13. World Carbon Dioxide Emissions from Coal Use by Region, Low Economic Growth Case, 1990-2025 . . . . . . . . 130D1. Total World Delivered Energy Consumption by End-Use Sector and Fuel, 2003-2030. . . . . . . . . . . . . . . . . . . . . . 133D2. Total OECD Delivered Energy Consumption by End-Use Sector and Fuel, 2003-2030. . . . . . . . . . . . . . . . . . . . . . 134D3. Delivered Energy Consumption in the United States by End-Use Sector and Fuel, 2003-2030 . . . . . . . . . . . . . . . 135D4. Delivered Energy Consumption in Canada by End-Use Sector and Fuel, 2003-2030 . . . . . . . . . . . . . . . . . . . . . . . 136D5. Delivered Energy Consumption in Mexico by End-Use Sector and Fuel, 2003-2030. . . . . . . . . . . . . . . . . . . . . . . . 137D6. Delivered Energy Consumption in OECD Europe by End-Use Sector and Fuel, 2003-2030. . . . . . . . . . . . . . . . . . 138D7. Delivered Energy Consumption in Japan by End-Use Sector and Fuel, 2003-2030 . . . . . . . . . . . . . . . . . . . . . . . . . 139D8. Delivered Energy Consumption in South Korea by End-Use Sector and Fuel, 2003-2030 . . . . . . . . . . . . . . . . . . . 140D9. Delivered Energy Consumption in Australia/New Zealand by End-Use Sector and Fuel, 2003-2030 . . . . . . . . . 141
D10. Total Non-OECD Delivered Energy Consumption by End-Use Sector and Fuel, 2003-2030 . . . . . . . . . . . . . . . . . 142D11. Delivered Energy Consumption in Russia by End-Use Sector and Fuel, 2003-2030 . . . . . . . . . . . . . . . . . . . . . . . . 143

Appendix Tables (Continued)
Appendix Figures
Energy Information Administration / International Energy Outlook 2006 vii
D12. Delivered Energy Consumption in Other Non-OECD Europe and Eurasia by End-Use Sectorand Fuel, 2003-2030 . . . . . . . . . . . . . . . . . . . . . . . . . . . . . . . . . . . . . . . . . . . . . . . . . . . . . . . . . . . . . . . . . . . . . . . . . . . . . 144
D13. Delivered Energy Consumption in China by End-Use Sector and Fuel, 2003-2030 . . . . . . . . . . . . . . . . . . . . . . . . . 145D14. Delivered Energy Consumption in India by End-Use Sector and Fuel, 2003-2030 . . . . . . . . . . . . . . . . . . . . . . . . . 146D15. Delivered Energy Consumption in Other Non-OECD Asia by End-Use Sector and Fuel, 2003-2030 . . . . . . . . . . 147D16. Delivered Energy Consumption in the Middle East by End-Use Sector and Fuel, 2003-2030 . . . . . . . . . . . . . . . . 148D17. Delivered Energy Consumption in Africa by End-Use Sector and Fuel, 2003-2030. . . . . . . . . . . . . . . . . . . . . . . . . 149D18. Delivered Energy Consumption in Brazil by End-Use Sector and Fuel, 2003-2030 . . . . . . . . . . . . . . . . . . . . . . . . . 150D19. Delivered Energy Consumption in Other Central and South America by End-Use Sector
and Fuel, 2003-2030 . . . . . . . . . . . . . . . . . . . . . . . . . . . . . . . . . . . . . . . . . . . . . . . . . . . . . . . . . . . . . . . . . . . . . . . . . . . . 151E1. World Oil Production Capacity by Region and Country, Reference Case, 1990-2030 . . . . . . . . . . . . . . . . . . . . . . . 155E2. World Oil Production Capacity by Region and Country, High Oil Price Case, 1990-2030 . . . . . . . . . . . . . . . . . . . 156E3. World Oil Production Capacity by Region and Country, Low Oil Price Case, 1990-2030. . . . . . . . . . . . . . . . . . . . 157E4. World Oil Production by Region and Country, Reference Case, 1990-2030 . . . . . . . . . . . . . . . . . . . . . . . . . . . . . . . 158E5. World Oil Production by Region and Country, High Oil Price Case, 1990-2030 . . . . . . . . . . . . . . . . . . . . . . . . . . . 159E6. World Oil Production by Region and Country, Low Oil Price Case, 1990-2030 . . . . . . . . . . . . . . . . . . . . . . . . . . . . 160F1. World Total Installed Generating Capacity by Region and Country, 2003-2030 . . . . . . . . . . . . . . . . . . . . . . . . . . . 163F2. World Installed Oil-Fired Generating Capacity by Region and Country, 2003-2030. . . . . . . . . . . . . . . . . . . . . . . . 164F3. World Installed Natural-Gas-Fired Generating Capacity by Region and Country, 2003-2030 . . . . . . . . . . . . . . . 165F4. World Installed Coal-Fired Generating Capacity by Region and Country, 2003-2030 . . . . . . . . . . . . . . . . . . . . . . 166F5. World Installed Nuclear Generating Capacity by Region and Country, 2003-2030 . . . . . . . . . . . . . . . . . . . . . . . . 167F6. World Installed Renewable Generating Capacity by Region and Country, 2003-2030 . . . . . . . . . . . . . . . . . . . . . . 168F7. World Total Net Electricity Generation From Central Producers by Region and Country, 2003-2030 . . . . . . . . . 169F8. World Net Oil-Fired Electricity Generation From Central Producers by Region and Country, 2003-2030. . . . . . 170F9. World Net Natural-Gas-Fired Electricity Generation From Central Producers by Region and Country,
2003-2030. . . . . . . . . . . . . . . . . . . . . . . . . . . . . . . . . . . . . . . . . . . . . . . . . . . . . . . . . . . . . . . . . . . . . . . . . . . . . . . . . . . . . . 171F10. World Net Coal-Fired Electricity Generation From Central Producers by Region and Country, 2003-2030 . . . . 172F11. World Net Nuclear Electricity Generation From Central Producers by Region and Country, 2003-2030 . . . . . . 173F12. World Net Renewable Electricity Generation From Central Producers by Region and Country, 2003-2030 . . . . 174H1. Comparison of Energy Consumption Growth Rates by Region, 2002-2010 . . . . . . . . . . . . . . . . . . . . . . . . . . . . . . . 177H2. Comparison of Energy Consumption Growth Rates by Region, 2002-2015 . . . . . . . . . . . . . . . . . . . . . . . . . . . . . . . 178H3. Comparison of Energy Consumption Growth Rates by Region, 2002-2020 . . . . . . . . . . . . . . . . . . . . . . . . . . . . . . . 179H4. Comparison of Energy Consumption Growth Rates by Region, 2002-2025 . . . . . . . . . . . . . . . . . . . . . . . . . . . . . . . 180H5. Comparison of Energy Consumption Growth Rates by Region, 2002-2030 . . . . . . . . . . . . . . . . . . . . . . . . . . . . . . . 180H6. Comparison of World Energy Consumption Growth Rates by Fuel, 2002-2010 . . . . . . . . . . . . . . . . . . . . . . . . . . . 181H7. Comparison of World Energy Consumption Growth Rates by Fuel, 2002-2015 . . . . . . . . . . . . . . . . . . . . . . . . . . . 181H8. Comparison of World Energy Consumption Growth Rates by Fuel, 2002-2020 . . . . . . . . . . . . . . . . . . . . . . . . . . . 182H9. Comparison of World Energy Consumption Growth Rates by Fuel, 2002-2025 . . . . . . . . . . . . . . . . . . . . . . . . . . . 182
H10. Comparison of World Energy Consumption Growth Rates by Fuel, 2002-2030 . . . . . . . . . . . . . . . . . . . . . . . . . . . 183H11. Years Included in IEO Projections by Edition, 1985-2006 . . . . . . . . . . . . . . . . . . . . . . . . . . . . . . . . . . . . . . . . . . . . . . 184
H1. Comparison of IEO Forecasts with 1990 Energy Consumption in Market Economies . . . . . . . . . . . . . . . . . . . . . . 184H2. Comparison of IEO Forecasts with 1995 Energy Consumption in Market Economies . . . . . . . . . . . . . . . . . . . . . . 184H3. Comparison of IEO Forecasts with 2000 Energy Consumption in Market Economies . . . . . . . . . . . . . . . . . . . . . . 185H4. Comparison of IEO Forecasts with 1995 World Energy Consumption . . . . . . . . . . . . . . . . . . . . . . . . . . . . . . . . . . . 185H5. Comparison of IEO Forecasts with 1995 Coal Consumption in Market Economies . . . . . . . . . . . . . . . . . . . . . . . . 185H6. Comparison of IEO Forecasts with 1995 Oil Consumption in Market Economies. . . . . . . . . . . . . . . . . . . . . . . . . . 186H7. Comparison of IEO Forecasts with 1995 World Coal Consumption . . . . . . . . . . . . . . . . . . . . . . . . . . . . . . . . . . . . . 186H8. Comparison of IEO Forecasts with 1995 Energy Consumption in the Former Soviet Union by Fuel Type . . . . . 186H9. Comparison of IEO Forecasts with 1995 Energy Consumption in China by Fuel Type . . . . . . . . . . . . . . . . . . . . . 187
H10. Comparison of IEO Forecasts with 2000 World Energy Consumption . . . . . . . . . . . . . . . . . . . . . . . . . . . . . . . . . . . 187H11. Comparison of IEO97 Forecasts with 2000 Energy Consumption by Region. . . . . . . . . . . . . . . . . . . . . . . . . . . . . . 187
J1. Map of the Six Basic Country Groupings . . . . . . . . . . . . . . . . . . . . . . . . . . . . . . . . . . . . . . . . . . . . . . . . . . . . . . . . . . . 191


PrefaceThis report presents international energy projections through 2030,prepared by the Energy Information Administration, including outlooksfor major energy fuels and associated carbon dioxide emissions.
The International Energy Outlook 2006 (IEO2006) presentsan assessment by the Energy Information Administra-tion (EIA) of the outlook for international energy mar-kets through 2030. U.S. projections appearing inIEO2006 are consistent with those published in EIA’sAnnual Energy Outlook 2006 (AEO2006), which was pre-pared using the National Energy Modeling System(NEMS). IEO2006 is provided as a service to energymanagers and analysts, both in government and in theprivate sector. The projections are used by internationalagencies, Federal and State governments, trade associa-tions, and other planners and decisionmakers. They arepublished pursuant to the Department of Energy Orga-nization Act of 1977 (Public Law 95-91), Section 205(c).
IEO2006 focuses exclusively on marketed energy. Non-marketed energy sources, which continue to play animportant role in some developing countries, are notincluded in the estimates. The IEO2006 projections arebased on U.S. and foreign government laws in effect onJanuary 1, 2006. The potential impacts of pending or pro-posed legislation, regulations, and standards are notreflected in the projections, nor are the impacts of legis-lation where the mechanisms for implementing the leg-islation have not yet been announced. For example, theIEO2006 reference case does not include the potentialimpacts of the Kyoto Protocol (which entered into forceon February 16, 2005), because the treaty does not indi-cate the methods by which signatories will implementthe Protocol. The Kyoto Protocol also does not addresssignatory obligations beyond 2012, making it impossiblein the context of a reference case projection for EIA toassess the impacts of the Protocol through 2030, the endof the IEO2006 projection period.
Projections in IEO2006 are displayed according to twobasic regions or country groupings: members of theOrganization for Economic Cooperation and Develop-ment (OECD) and nonmembers (non-OECD) (seeAppendix J for complete regional definitions). Theregionalization has changed since last year’s report. TheOECD region includes three basic subgroups: NorthAmerica (United States, Canada, and Mexico); OECDEurope; and OECD Asia (Japan, South Korea, and Aus-tralia/New Zealand). The non-OECD region is dividedinto five separate regional subgroups: non-OECDEurope and Eurasia, non-OECD Asia, Africa, MiddleEast, and Central and South America. Russia is included
in non-OECD Europe and Eurasia; China and India areincluded in non-OECD Asia; and Brazil is included inCentral and South America.
The report begins with a review of world trends inenergy demand and the major macroeconomic assump-tions used in deriving the IEO2006 projections. The timeframe for historical data begins with 1980 and extends to2003, providing a 23-year historical view of energydemand. The projections extend to 2030. High economicgrowth and low economic growth cases were developedto depict a set of alternative growth paths for the energyforecast. The two cases consider higher and lowergrowth paths for regional gross domestic product (GDP)than assumed in the reference case. The resulting projec-tions—and the uncertainty associated with internationalenergy projections in general—are discussed in Chapter1, “World Energy and Economic Outlook.”
Worldwide and regional projections of end-use energyconsumption in the residential, commercial, industrial,and transportation sectors are presented in Chapter 2.Projections for energy consumption by fuel—petro-leum, natural gas, and coal—are presented in Chapters3, 4, and 5, along with reviews of the current status ofeach fuel on a worldwide basis. Chapter 6 discusses theprojections for world electricity markets—includingnuclear power, hydropower, and other commercialrenewable energy resources—and presents forecasts ofworld installed generating capacity. Finally, Chapter 7discusses the outlook for global carbon dioxide emis-sions. With the entry into force of the Kyoto Protocol onFebruary 16, 2005, this year’s outlook includes a KyotoProtocol scenario, which is also presented in Chapter 7.
Appendix A contains summary tables of the IEO2006reference case projections for world energy consump-tion, GDP, energy consumption by fuel, carbon dioxideemissions, and regional population growth. The refer-ence case projections of total foreign energy consump-tion and consumption of oil, natural gas, coal, andrenewable energy were prepared using EIA’s System forthe Analysis of Global Energy Markets (SAGE), as wereprojections of net electricity consumption, energy con-sumed by fuel and region and by end-use sector, andcarbon dioxide emissions. In addition, the NEMS CoalExport Submodule was used to derive flows in interna-tional coal trade, presented in Chapter 5.
Energy Information Administration / International Energy Outlook 2006 ix
Summary tables of projections for the high and low eco-nomic growth cases are provided in Appendixes B andC, respectively. Appendix D contains reference case pro-jections of delivered energy consumption by end-usesector and region. Appendix E contains summary tablesof projections for world oil production capacity and oilproduction in the reference case and the high and lowworld oil price cases. The projections in Appendix Ewere derived from the International Energy Moduleof NEMS. Appendix F contains summary tables ofreference case projections for installed electric power
capacity by fuel, as well as regional electricity genera-tion by fuel. Appendix G provides a summary ofassumptions underlying the IEO2006 Kyoto Protocolcase. Appendix H includes a set of comparisons of alter-native forecasts with the IEO2006 projections, as well ascomparisons of historical IEO forecasts with actual his-torical data. Comparisons of the IEO2006 and IEO2005forecasts are also presented in Appendix H. Appendix Idescribes the SAGE model, and Appendix J defines theregional designations included in the report.
x Energy Information Administration / International Energy Outlook 2006
Objectives of the IEO2006 Projections
The projections in IEO2006 are not statements of what will happen, but what might happen given the specificassumptions and methodologies used. These projections provide an objective, policy-neutral reference case that canbe used to analyze international energy markets. As a policy-neutral data and analysis organization, EIA does notpropose, advocate, or speculate on future legislative and regulatory changes. The projections are based on U.S. andforeign government laws effective as of January 1, 2006. Assuming fixed laws, even knowing that changes willoccur, will naturally result in projections that differ from the final data.
Models are abstractions of energy production and consumption activities, regulatory activities, and producer andconsumer behavior. The forecasts are highly dependent on the data, analytical methodologies, model structures,and specific assumptions used in their development. Trends depicted in the analysis are indicative of tendencies inthe real world rather than representations of specific real-world outcomes. Many events that shape energy marketsare random and cannot be anticipated, and the content and timing of policy developments, as well as assumptionsconcerning future technology characteristics, demographics, and resource availability, are inherently uncertain.

HighlightsWorld energy consumption is projected to increase by 71 percent from 2003 to 2030.Fossil fuels continue to supply much of the energy used worldwide,and oil remains the dominant energy source.
In the International Energy Outlook 2006 (IEO2006) ref-erence case, world marketed energy consumptionincreases on average by 2.0 percent per year from 2003 to2030. Although world oil prices in the reference case,which remain between $47 and $59 per barrel (in real2004 dollars), dampen the growth in demand for oil,total world energy use continues to increase as a result ofrobust economic growth. Worldwide, total energy usegrows from 421 quadrillion British thermal units (Btu) in2003 to 563 quadrillion Btu in 2015 and 722 quadrillionBtu in 2030 (Figure 1).
The most rapid growth in energy demand from 2003 to2030 is projected for nations outside the Organization forEconomic Cooperation and Development (non-OECDnations). Energy demand growth averages 3.7 percentper year for non-OECD Asia (which includes China andIndia), 2.8 percent per year for Central and South Amer-ica, 2.6 percent per year for Africa, 2.4 percent per yearfor the Middle East, and 1.8 percent per year for non-OECD Europe and Eurasia. The increases result fromprojections of strong regional economic growth. For allthe non-OECD regions combined, economic activity—asmeasured by gross domestic product (GDP) in purchas-ing power parity terms—expands by 5.0 percent peryear on average, as compared with an average of 2.6 per-cent per year for the OECD economies.
The OECD nations, for the most part, are more matureenergy consumers with well-established infrastructures,and their economies generally are moving away fromenergy-intensive industries toward services. Conse-quently, total OECD energy demand increases by anaverage of 1.0 percent per year over the projectionperiod, as compared with an average increase of 3.0 per-cent per year for total non-OECD energy demand.
Trends in end-use sector energy consumption can varywidely, according to the level and pace of economicdevelopment in a given region. On a worldwide basis,energy demand in the industrial sector grows most rap-idly, at an average rate of 2.4 percent per year (Figure 2).Slower growth is projected for the buildings sectors: res-idential energy use rises by an average of 1.7 percent peryear and commercial energy use by 1.8 percent per yearfrom 2003 to 2030 for the world as a whole. The slowestgrowth in energy demand among the end-use sectors isprojected for transportation, at 1.4 percent per year.In contrast, the International Energy Outlook 2005 (IEO-2005) reference case showed transportation energy usegrowing at the same rate as industrial energy use andfaster than energy use in the buildings sectors. Thehigher world oil prices in IEO2006 are largely responsi-ble for the slower growth in transportation sector energy
Energy Information Administration / International Energy Outlook 2006 1
283 309347 366 400 421
510563
613665
722
1980
1985
1990
1995
2000
2003
2010
2015
2020
2025
2030
0
200
400
600
800
1,000Quadrillion Btu
OECD
Non-OECD
History Projections
Figure 1. World Marketed Energy Consumption byRegion, 1980-2030
Sources: History: Energy Information Administration (EIA),International Energy Annual 2003 (May-July 2005), web sitewww.eia.doe.gov/iea/. Projections: EIA, System for the Anal-ysis of Global Energy Markets (2006).
318
380420
458498
541
2003 2010 2015 2020 2025 20300
200
400
600
Quadrillion Btu
Industrial
Transportation
Residential
Commercial
Figure 2. World Delivered Energy Consumptionby End-Use Sector, 2003-2030
Sources: 2003: Derived from Energy Information Adminis-tration (EIA), International Energy Annual 2003 (May-July2005), web site www.eia.doe.gov/iea/. 2010-2030: EIA, Sys-tem for the Analysis of Global Energy Markets (2006).

demand, in that oil dominates transportation energyuse, and there are currently no fuels that compete widelywith oil in the transportation sector.
In the OECD, where population growth generally isslow or negative in many countries over the projectionperiod, the slowest growth in energy use is projected forthe residential sector, at 0.6 percent per year; and thefastest growth is in the industrial sector, averaging 1.2percent annually. For the non-OECD regions as a whole,strong growth in demand for energy is projected forevery end-use sector, ranging from 2.3 percent per yearin the transportation sector to 3.2 percent per year in thecommercial and industrial sectors.
In the IEO2006 reference case, the use of all energysources increases through 2030 (Figure 3). Fossil fuels(oil, natural gas, and coal) continue to supply much ofthe energy used worldwide. Oil remains the dominantenergy source, given its importance in the transporta-tion and industrial end-use sectors; however, higherworld oil prices in this year’s outlook mean that oil’sshare of the world energy market is lessened in theprojection as other fuels replace oil where possible.In IEO2005, in contrast, the oil share of total energydemand was relatively stable from 2002 to 2025.Renewable energy sources become more economicallycompetitive with fossil fuels in the reference case, andrenewable energy use expands as rapidly as consump-tion of natural gas and coal. Higher fossil fuel prices alsosupport renewed interest in expanding the use ofnuclear power to generate electricity.
World oil use grows from 80 million barrels per day in2003 to 98 million barrels per day in 2015 and 118 million
barrels per day in 2030 in the reference case. TheIEO2006 projection for oil demand in 2025 is 8 millionbarrels per day lower than the 119 million barrels perday projected in IEO2005, which extended only to 2025.The slower growth in this year’s projections is in largepart explained by the substantially higher world oilprices in the IEO2006 reference case. Indeed, world oilprices in 2025—expressed as the average price ofimported low-sulfur, light crude oil to U.S. refiners (seebox on page 3)—are 35 percent higher than in IEO2005.In the IEO2006 reference case, world oil prices rise from$31 per barrel (in real 2004 dollars) in 2003 to $57 per bar-rel in 2030, and oil’s share of total world energy use fallsfrom 39 percent to 33 percent (Figure 4).
To meet the projected increase in world oil demand inthe reference case, total petroleum supply in 2030 willneed to be 38 million barrels per day higher than the2003 level of 80 million barrels per day. OPEC producersare expected to provide 14.6 million barrels per day ofthe increase. Higher oil prices cause a substantialincrease in non-OPEC oil production—23.7 million bar-rels per day, which represents 62 percent of the increasein total world oil supplies over the projection period. Inaddition, unconventional resources (including biofuels,coal-to-liquids, and gas-to-liquids) are expected tobecome more competitive. In 2003, world production ofunconventional resources totaled only 1.8 million bar-rels per day; in the IEO2006 reference case, unconven-tional resource supplies rise to 11.5 million barrels perday and account for nearly 10 percent of total worldpetroleum supply in 2030.
2 Energy Information Administration / International Energy Outlook 2006
1980 1990 2003 2015 20300
50
100
150
200
250Quadrillion Btu
History Projections
Oil
Natural Gas
Coal
Renewables
Nuclear
Figure 3. World Marketed Energy Use by EnergyType, 1980-2030
Sources: History: Energy Information Administration (EIA),International Energy Annual 2003 (May-July 2005), web sitewww.eia.doe.gov/iea/. Projections: EIA, System for the Anal-ysis of Global Energy Markets (2006).
39 35 33
24 26 27
24 25 26
8 9 96 6 5
9 9
2003 2015 20300
20
40
60
80
100Percent of Total
Oil
Coal
Natural Gas
Renewables
Nuclear
Figure 4. Fuel Shares of World Marketed EnergyUse, 2003, 2015, and 2030
Note: Fuel shares may not add to 100 percent due to inde-pendent rounding.
Sources: 2003: Energy Information Administration (EIA),International Energy Annual 2003 (May-July 2005), web sitewww.eia.doe.gov/iea/. 2015 and 2030: EIA, System for theAnalysis of Global Energy Markets (2006).

The higher oil prices in this year’s reference case raisethe projected demand for, and price of, natural gas. Nat-ural gas consumption increases on average by 2.4 per-cent per year from 2003 to 2030. The higher natural gasprices also make coal more cost-competitive, especiallyin the electric power sector. As a result, for the first timesince the Energy Information Administration (EIA)began publishing outlooks for worldwide energy use in1990, demand for coal grows faster than demand for nat-ural gas in the IEO2006 projections, albeit only slightlyfaster, at 2.5 percent per year. Among the end-use sec-tors, the industrial sector remains the largest consumerof natural gas worldwide, accounting for 52 percent ofthe total increase in demand for natural gas between2003 and 2030. Natural gas also is expected to remain animportant energy source in the electric power sector,particularly for new generating capacity.
World coal consumption is projected to increase from5,440 million short tons in 2003 to 7,792 million shorttons in 2015, at an average annual rate of 3.0 percent. Therate of growth in world coal use slows after 2015 to 2.0percent annually through 2030, when coal consumptiontotals 10,561 million short tons. Of the coal producedworldwide in 2003, 67 percent was shipped to electricityproducers and 30 percent to industrial consumers, thetwo end-use sectors that account for virtually all thegrowth in coal use in the mid-term. On a worldwidebasis coal’s share of industrial sector energy useincreases, mostly because of the substantial growth pro-jected for coal consumption in China’s industrial sector.In the IEO2006 reference case, industrial energy use inChina more than triples from 2003 to 2030 as a result ofthe country’s abundant coal reserves, its limited reservesof oil and natural gas, and its leading position in worldsteel production.
World net electricity consumption more than doubles inthe reference case, from 14,781 billion kilowatthours in2003 to 21,699 billion kilowatthours in 2015 and 30,116billion kilowatthours in 2030. Most of the growth in elec-tricity demand occurs in the non-OECD nations, whereelectricity use increases on average by 3.9 percent peryear from 2003 to 2030, as compared with 1.5 percent peryear in the OECD nations. Worldwide, increases are pro-jected for all primary energy sources in electricity gener-ation (Figure 5). Coal and natural gas remain the mostimportant fuels for electricity generation throughout theprojection period, however, accounting for more thantwo-thirds of the total increment in energy use for elec-tricity production in the reference case.
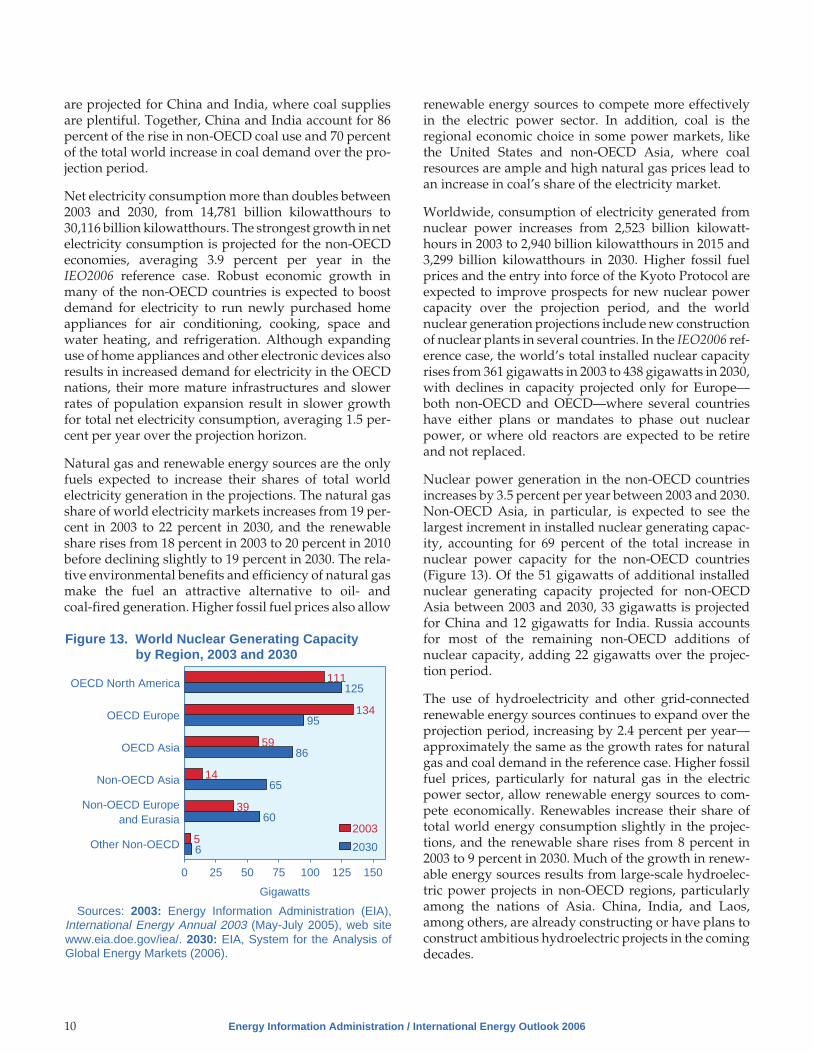
Consumption of electricity generated from nuclearpower worldwide increases from 2,523 billion kilowatt-hours in 2003 to 3,299 billion kilowatthours in 2030 in theIEO2006 reference case. Higher fossil fuel prices andconcerns about security of energy supplies are expectedto improve prospects for nuclear power capacity overthe projection period, and many countries are expectedto build new nuclear power plants. World nuclearcapacity rises from 361 gigawatts in 2003 to 438 giga-watts in 2030, with significant declines in capacity pro-jected only for Europe, where several countries haveeither plans or mandates to phase out nuclear power, orwhere old reactors are expected to be retired and notreplaced.
Non-OECD Asia accounts for 69 percent of the increasein non-OECD nuclear capacity in the reference case andleads the growth in nuclear power generation with anaverage increase of 6.3 percent per year from 2003 to
Energy Information Administration / International Energy Outlook 2006 3
2003 2015 20300
50
100
150
200
250
300Quadrillion Btu
Coal
Natural Gas
Renewables
Nuclear
Oil
Figure 5. World Energy Consumption forElectricity Generation by Fuel Type,2003, 2015, and 2030
Sources: 2003: Derived from Energy Information Adminis-tration (EIA), International Energy Annual 2003 (May-July2005), web site www.eia.doe.gov/iea/. 2010-2030: EIA, Sys-tem for the Analysis of Global Energy Markets (2006).
World Oil Prices in IEO2006
In previous IEOs, the world crude oil price wasdefined on the basis of the average imported refineracquisition cost of crude oil to the United States(IRAC), which represented the weighted average ofall imported crude oil. Historically, the IRAC pricehas tended to be a few dollars less than the widelycited prices of premium crudes, such as West TexasIntermediate (WTI) and Brent, which refiners gener-ally prefer for their low viscosity and sulfur content.In the past 2 years, the price difference between pre-mium crudes and IRAC has widened—in particular,the price spread between premium crudes andheavier, high-sulfur crudes. In an effort to provide acrude oil price that is more consistent with those gen-erally reported in the media, IEO2006 uses the aver-age price of imported low-sulfur, light crude oil toU.S. refiners.

2030. The 51 gigawatts of additional installed nucleargenerating capacity projected for non-OECD Asiaincludes 33 gigawatts in China and 12 gigawatts inIndia. Russia accounts for most of the remaining non-OECD additions, adding 22 gigawatts of nuclear capac-ity over the 2003 to 2030 period.
Rising fossil fuel prices also allow renewable energysources to compete economically in the electric powersector. Consumption of hydroelectricity and other grid-connected renewable energy sources expands by 2.4percent per year—approximately the same as the ratesof growth projected for natural gas and coal—and therenewable energy share of the world’s total energy con-sumption increases from 8 percent in 2003 to 9 percent in2030.
Much of the projected growth in renewable electricitygeneration results from the expected completion of largehydroelectric facilities in non-OECD nations, especiallyin non-OECD Asia, where the need to expand electricityproduction with associated dams and reservoirs oftenoutweighs concerns about environmental impacts andthe relocation of populations. China, India, and Laos,among other non-OECD Asian economies, already areconstructing or planning new large-scale hydroelectricfacilities.
Apart from Turkey, where development of the 7.5-giga-watt Southeast Anatolia hydroelectric system is ongo-ing, most hydroelectric resources in the OECD nationsalready have been developed or lie far from populationcenters. As a result, nonhydroelectric marketed renew-ables, such as wind, solar, geothermal, and biomass, areexpected to account for most of the growth in OECDrenewable energy use, given government programs andpolicies to encourage their expansion.
World carbon dioxide emissions continue to increasesteadily in the IEO2006 reference case, from 25.0 billionmetric tons in 2003 to 33.7 billion metric tons in 2015 and43.7 billion metric tons in 2030. Carbon dioxide is one ofthe most prevalent greenhouse gases in the atmosphere,and anthropogenic (human-caused) emissions of carbondioxide result primarily from the combustion of fossilfuels for energy. Three-fourths of the projected increasein carbon dioxide emissions results from fossil fuel con-sumption in non-OECD countries.
The Kyoto Protocol, which requires participating“Annex I” countries1 to reduce their carbon dioxideemissions collectively to an annual average of about5 percent below their 1990 level over the 2008-2012period, became a legally binding treaty on February 16,
2006, 90 days after it was ratified by Russia. The IEO2006reference case does not include the potential impacts ofthe Kyoto Protocol, because the treaty does not indicatethe methods by which ratifying parties will implementtheir obligations either in the first commitment period orafter 2012. To examine the implications of the treaty forenergy use and carbon dioxide emissions, a Kyoto Pro-tocol case was analyzed.
A number of assumptions were made in developing theIEO2006 Kyoto Protocol case. First, it was assumed thatenergy use would not vary from the reference case pro-jection for countries that are not undertaking emissionsreduction commitments. In addition, assumptions weremade about how the affected participating regionswould achieve their reductions. In OECD Europe, statedintentions that “most” of the emissions reductions willbe achieved domestically led to an assumption that 50percent of the aggregate emissions reduction for OECDEurope would be met by domestic reductions. With nostated intentions about levels of domestic reductions inJapan or in Canada, an assumption was made that a25-percent share of total reductions in both countrieswould be met domestically. Finally, it was assumed thatthe emissions commitments would remain in effect attheir 2008-2012 level through 2030.
In the Kyoto Protocol case (Figure 6), energy-related car-bon dioxide emissions in the participating nations are673 million metric tons lower than in the reference case
4 Energy Information Administration / International Energy Outlook 2006
1990 2010Reference
CaseKyoto
ProtocolCase
2030Reference
CaseKyoto
ProtocolCase
0
10
20
30
40
50Billion Metric Tons
Participating Annex I
Other
30.4
21.2
29.9
43.7 43.0
Figure 6. World Carbon Dioxide Emissions in TwoCases, 1990, 2010, and 2030
Sources: 1990: Energy Information Administration (EIA),International Energy Annual 2003 (May-July 2005), web sitewww.eia.doe.gov/iea/. 2010 and 2030: EIA, System for theAnalysis of Global Energy Markets (2006).
1Austria, Belgium, Bulgaria, Canada, Croatia, Czech Republic, Denmark, Estonia, Finland, France, Germany, Greece, Hungary, Iceland,Ireland, Italy, Japan, Latvia, Lithuania, Luxembourg, Monaco, the Netherlands, New Zealand, Norway, Poland, Portugal, Romania, Russia,Slovakia, Slovenia, Spain, Sweden, Switzerland, Ukraine, and the United Kingdom. Australia, Belarus, Turkey, and the United States areAnnex I nations that will not participate in the Protocol.

in 2030. In those countries required to make reductionsin the Kyoto Protocol case (Canada, Japan, and OECDEurope), emissions decline from 6.1 billion metric tonsin 2003 to 5.9 billion metric tons in 2010. After 2010, how-ever, their emissions begin to rise again—to 6.5 billionmetric tons in 2030—when participants find it lessexpensive to purchase permits than to make domesticreductions.
Continued heavy reliance on coal and other fossil fuelsin many parts of the world suggests that even if nationsthat have ratified the Kyoto Protocol reduce their carbondioxide emissions as required in the treaty, there stillwill be substantial increases in carbon dioxide emissionsworldwide. In the IEO2006 Kyoto Protocol case, world-wide carbon dioxide emissions rise to 29.9 billion metrictons in 2010 and 43.0 million metric tons in 2030.
Energy Information Administration / International Energy Outlook 2006 5


Chapter 1
World Energy and Economic OutlookThe IEO2006 projections indicate continued growth in world energy use, despiteworld oil prices that are 35 percent higher in 2025 than projected in last year’s outlook.Energy resources are thought to be adequate to support the growth expected through 2030.
The International Energy Outlook 2006 (IEO2006) projectsstrong growth for worldwide energy demand over the27-year projection period from 2003 to 2030. Despiteworld oil prices that are 35 percent higher in 2025 thanprojected in last year’s outlook, world economic growthcontinues to increase at an average annual rate of 3.8percent over the projection period, driving the robustincrease in world energy use. Total world consumptionof marketed energy expands from 421 quadrillion Brit-ish thermal units (Btu) in 2003 to 563 quadrillion Btu in2015 and then to 722 quadrillion Btu in 2030, or a 71-percent increase over the 2003 to 2030 period (Table 1and Figure 7).
In the IEO2006 mid-term outlook, countries outside theOrganization for Economic Cooperation and Develop-ment (non-OECD countries)2 account for three-fourthsof the increase in world energy use. Non-OECD energyuse surpasses OECD energy use by 2015 (Table 1 andFigure 8), and in 2030 total energy demand in non-OECD countries exceeds that in the OECD countries by34 percent.
Energy Information Administration / International Energy Outlook 2006 7
Table 1. World Marketed Energy Consumption by Country Grouping, 2003-2030(Quadrillion Btu)
Region 2003 2010 2015 2020 2025 2030
Average AnnualPercent Change,
2003-2030
OECD . . . . . . . . . . . . . . . . . . . . . 234.3 256.1 269.9 281.6 294.5 308.8 1.0North America . . . . . . . . . . . . . . 118.3 131.4 139.9 148.4 157.0 166.2 1.3Europe . . . . . . . . . . . . . . . . . . . . 78.9 84.4 87.2 88.7 91.3 94.5 0.7Asia . . . . . . . . . . . . . . . . . . . . . . 37.1 40.3 42.8 44.4 46.1 48.0 1.0
Non-OECD . . . . . . . . . . . . . . . . . 186.4 253.6 293.5 331.5 371.0 412.8 3.0Europe and Eurasia . . . . . . . . . . 48.5 56.5 62.8 68.7 74.0 79.0 1.8Asia . . . . . . . . . . . . . . . . . . . . . . 83.1 126.2 149.4 172.8 197.1 223.6 3.7Middle East . . . . . . . . . . . . . . . . 19.6 25.0 28.2 31.2 34.3 37.7 2.4Africa . . . . . . . . . . . . . . . . . . . . . 13.3 17.7 20.5 22.3 24.3 26.8 2.6Central and South America . . . . 21.9 28.2 32.5 36.5 41.2 45.7 2.8
Total World . . . . . . . . . . . . . . . . . 420.7 509.7 563.4 613.0 665.4 721.6 2.0
Note: Totals may not equal sum of components due to independent rounding.Sources: 2003: Energy Information Administration (EIA), International Energy Annual 2003 (May-July 2005), web site www.eia.
doe.gov/iea/. 2010-2030: EIA, System for the Analysis of Global Energy Markets (2006).
283 309347 366
421
510563
613665
722
1980
1985
1990
1995
2003
2010
2015
2020
2025
2030
0
200
400
600
800Quadrillion Btu
History Projections
Figure 7. World Marketed Energy Consumption,1980-2030
Sources: History: Energy Information Administration (EIA),International Energy Annual 2003 (May-July 2005), web sitewww.eia.doe.gov/iea/. Projections: EIA, System for the Anal-ysis of Global Energy Markets (2006).
2For consistency, OECD includes all members of the Organization for Economic Cooperation and Development as of February 1, 2006,throughout all time series presented in this publication.

Much of the growth in energy demand among the non-OECD economies occurs in non-OECD Asia, whichincludes China and India; demand in the region nearlytriples over the projection period (Table 1 and Figure 9).Total primary energy consumption in the non-OECDcountries grows at an average annual rate of 3.0 percentbetween 2003 and 2030. In contrast, for the OECD—withits more mature energy-consuming nations—energy usegrows at a much slower average rate of 1.0 percent peryear over the same period.
This chapter begins with an overview of the IEO2006outlook for energy consumption by primary energysource, followed by a discussion of the macroeconomic
projections in the context of recent economicdevelopments in key OECD and non-OECD regions.Macroeconomic growth and energy intensity are keyfactors underlying the projections of future energydemand, and different assumptions result in substan-tially different projections, underscoring the uncertaintyassociated with the IEO2006 reference case. Alternativeassumptions about economic growth and their impactson the IEO2006 projections are considered, as well as thepossible effects of future trends in energy intensity onthe reference case projections.
Outlook for World EnergyConsumptionThe IEO2006 reference case projects increased worldconsumption of marketed energy from all sources overthe next two and one-half decades. Fossil fuels continueto supply much of the increment in marketed energy useworldwide throughout the projections. Oil remains thedominant energy source over the projection period, butits share of total world energy consumption declinesfrom 38 percent in 2003 to 33 percent in 2030 (Figure 10),largely in response to higher world oil prices in thisyear’s outlook, which dampen oil demand in themid-term.
Worldwide oil consumption rises from 80 million bar-rels per day in 2003 to 98 million barrels per day in 2015and then to 118 million barrels per day in 2030. TheIEO2006 projection for oil demand in 2025 is 8 millionbarrels lower than the 119 million barrels per dayprojected in last year’s outlook, which extended only to2025. The slower growth in world oil demand thanwas projected in the International Energy Outlook 2005
8 Energy Information Administration / International Energy Outlook 2006
1980 1990 2003 2010 2020 20300
100
200
300
400
500Quadrillion Btu
History Projections
OECD
Non-OECD
Figure 8. World Marketed Energy Use: OECD andNon-OECD, 1980-2030
Sources: History: Energy Information Administration (EIA),International Energy Annual 2003 (May-July 2005), web sitewww.eia.doe.gov/iea/. Projections: EIA, System for the Anal-ysis of Global Energy Markets (2006).
106
150186
254
332
413
1980 1990 2003 2010 2020 20300
100
200
300
400
500Quadrillion Btu
Non-OECD Asia
Middle East
Africa
Central and South America
Non-OECD Europe and Eurasia
History Projections
Figure 9. Marketed Energy Use in the Non-OECDEconomies by Region, 1980-2030
Sources: History: Energy Information Administration (EIA),International Energy Annual 2003 (May-July 2005), web sitewww.eia.doe.gov/iea/. Projections: EIA, System for the Anal-ysis of Global Energy Markets (2006).
1980 1990 2003 2010 2020 20300
50
100
150
200
250Quadrillion Btu
History Projections
Oil
Natural Gas
Coal
Renewables
Nuclear
Figure 10. World Marketed Energy Use by FuelType, 1980-2030
Sources: History: Energy Information Administration (EIA),International Energy Annual 2003 (May-July 2005), web sitewww.eia.doe.gov/iea/. Projections: EIA, System for the Anal-ysis of Global Energy Markets (2006).

(IEO2005) is in large part explained by substantiallyhigher projections for world oil prices in the IEO2006reference case, which in 2025 are 35 percent higher thanprojected in IEO2005 (Figure 11).
Worldwide, transportation and industry are the majorgrowth sectors for oil demand. On a global basis, thetransportation sector—where there are currently noalternative fuels that compete widely with oil—accountsfor about one-half of the total projected increase in oiluse between 2003 and 2030, with the industrial sectoraccounting for another 39 percent of the incrementaldemand.
The higher world oil price path in the IEO2006 alsoaffects natural gas markets. For many years, the IEO hasprojected that natural gas would be the fastest growingenergy source in the mid-term; however, higher naturalgas prices in IEO2006 make coal more cost-competitive,especially in the electric power sector, and as a resultnatural gas use and coal use increase at similar rates.Natural gas demand rises by an average of 2.4 percentper year over the 2003 to 2030 period and coal use by anaverage of 2.5 percent per year. Total world natural gasconsumption rises from 95 trillion cubic feet in 2003 to134 trillion cubic feet in 2015 and 182 trillion cubic feet in2030.
The industrial sector remains the most important end-use consumer for natural gas worldwide, accounting for52 percent of the total growth in natural gas use in theprojections; however, natural gas also remains animportant energy source in the electric power sector,
particularly as a fuel for new generating capacity. Theelectric power sector accounts for 39 percent of theincrease in global natural gas demand over the 2003 to2030 period, although the higher price path in IEO2006leads to a slower growth rate for natural gas consump-tion in the electricity generation sector than was pro-jected in IEO2005. Natural gas still is seen as a desirableoption for electric power in many parts of the world,given its efficiency relative to other energy sources andits low carbon content relative to other fossil fuels, mak-ing it a more attractive choice for countries interested inreducing greenhouse gas emissions.
Coal use worldwide increases by 2.4 billion short tonsbetween 2003 and 2015 and by another 2.7 billion shorttons between 2015 and 2030. In this year’s outlook forcoal, nearly all regions of the world show some increasein coal use, except for Japan. In Japan, the electricity sec-tor continues to be dominated by natural gas andnuclear power generation. In addition, with its popula-tion growing more slowly, Japan’s electricity demand islikely to grow slowly, so that new coal-fired capacityadditions are unlikely to be needed.
With higher prices for oil and natural gas making coalmore competitive, the IEO2006 projection for world coaluse in 2025 is 16 percent higher (on a tonnage basis) thanin IEO2005 (Figure 12). Consequently, coal’s share oftotal energy use rises from 24 percent in 2003 to 27 per-cent in 2030, and world coal consumption continues toexceed world natural gas consumption throughout theprojections. The largest increases in coal use worldwide
Energy Information Administration / International Energy Outlook 2006 9
1980 1990 2003 2010 2020 20300
20
40
60
802004 Dollars per Barrel
History Projections
IEO2006
IEO2005
Figure 11. Comparison of IEO2005 and IEO2006World Oil Price Projections, 1980-2030
Sources: History: Energy Information Administration (EIA),Annual Energy Review 2004, DOE/EIA-0384(2004) (Washing-ton, DC, August 2005), web site www.eia.doe.gov/emeu/aer/contents.html. IEO2005: EIA, International Energy Outlook2005, DOE/EIA-0484(2005) (Washington, DC, July 2005), website www.eia.doe.gov/oiaf/ieo/index.html. IEO2006: EIA, Sys-tem for the Analysis of Global Energy Markets (2006).
2002 2003 2010 2015 2020 2025 20300
2
4
6
8
10
12Billion Short Tons
IEO2005 IEO2006
Figure 12. Comparison of IEO2005 and IEO2006Projections for World CoalConsumption, 2002-2030
Sources: 2002 and 2003: Energy Information Administration(EIA), International Energy Annual 2003 (May-July 2005),web site www.eia.doe.gov/iea/. IEO2005: EIA, InternationalEnergy Outlook 2005, DOE/EIA-0484(2005) (Washington, DC,July 2005), web site www.eia.doe.gov/oiaf/ieo/index.html.IEO2006: EIA, System for the Analysis of Global Energy Mar-kets (2006).
are projected for China and India, where coal suppliesare plentiful. Together, China and India account for 86percent of the rise in non-OECD coal use and 70 percentof the total world increase in coal demand over the pro-jection period.
Net electricity consumption more than doubles between2003 and 2030, from 14,781 billion kilowatthours to30,116 billion kilowatthours. The strongest growth in netelectricity consumption is projected for the non-OECDeconomies, averaging 3.9 percent per year in theIEO2006 reference case. Robust economic growth inmany of the non-OECD countries is expected to boostdemand for electricity to run newly purchased homeappliances for air conditioning, cooking, space andwater heating, and refrigeration. Although expandinguse of home appliances and other electronic devices alsoresults in increased demand for electricity in the OECDnations, their more mature infrastructures and slowerrates of population expansion result in slower growthfor total net electricity consumption, averaging 1.5 per-cent per year over the projection horizon.
Natural gas and renewable energy sources are the onlyfuels expected to increase their shares of total worldelectricity generation in the projections. The natural gasshare of world electricity markets increases from 19 per-cent in 2003 to 22 percent in 2030, and the renewableshare rises from 18 percent in 2003 to 20 percent in 2010before declining slightly to 19 percent in 2030. The rela-tive environmental benefits and efficiency of natural gasmake the fuel an attractive alternative to oil- andcoal-fired generation. Higher fossil fuel prices also allow
renewable energy sources to compete more effectivelyin the electric power sector. In addition, coal is theregional economic choice in some power markets, likethe United States and non-OECD Asia, where coalresources are ample and high natural gas prices lead toan increase in coal’s share of the electricity market.
Worldwide, consumption of electricity generated fromnuclear power increases from 2,523 billion kilowatt-hours in 2003 to 2,940 billion kilowatthours in 2015 and3,299 billion kilowatthours in 2030. Higher fossil fuelprices and the entry into force of the Kyoto Protocol areexpected to improve prospects for new nuclear powercapacity over the projection period, and the worldnuclear generation projections include new constructionof nuclear plants in several countries. In the IEO2006 ref-erence case, the world’s total installed nuclear capacityrises from 361 gigawatts in 2003 to 438 gigawatts in 2030,with declines in capacity projected only for Europe—both non-OECD and OECD—where several countrieshave either plans or mandates to phase out nuclearpower, or where old reactors are expected to be retireand not replaced.
Nuclear power generation in the non-OECD countriesincreases by 3.5 percent per year between 2003 and 2030.Non-OECD Asia, in particular, is expected to see thelargest increment in installed nuclear generating capac-ity, accounting for 69 percent of the total increase innuclear power capacity for the non-OECD countries(Figure 13). Of the 51 gigawatts of additional installednuclear generating capacity projected for non-OECDAsia between 2003 and 2030, 33 gigawatts is projectedfor China and 12 gigawatts for India. Russia accountsfor most of the remaining non-OECD additions ofnuclear capacity, adding 22 gigawatts over the projec-tion period.
The use of hydroelectricity and other grid-connectedrenewable energy sources continues to expand over theprojection period, increasing by 2.4 percent per year—approximately the same as the growth rates for naturalgas and coal demand in the reference case. Higher fossilfuel prices, particularly for natural gas in the electricpower sector, allow renewable energy sources to com-pete economically. Renewables increase their share oftotal world energy consumption slightly in the projec-tions, and the renewable share rises from 8 percent in2003 to 9 percent in 2030. Much of the growth in renew-able energy sources results from large-scale hydroelec-tric power projects in non-OECD regions, particularlyamong the nations of Asia. China, India, and Laos,among others, are already constructing or have plans toconstruct ambitious hydroelectric projects in the comingdecades.
10 Energy Information Administration / International Energy Outlook 2006
111
134
59
14
39
5
125
95
86
65
60
6
OECD North America
OECD Europe
OECD Asia
Non-OECD Asia
Non-OECD Europeand Eurasia
Other Non-OECD
0 25 50 75 100 125 150
Gigawatts
2003
2030
Figure 13. World Nuclear Generating Capacityby Region, 2003 and 2030
Sources: 2003: Energy Information Administration (EIA),International Energy Annual 2003 (May-July 2005), web sitewww.eia.doe.gov/iea/. 2030: EIA, System for the Analysis ofGlobal Energy Markets (2006).

World Economic OutlookEconomic growth is among the most important factorsto be considered in projecting changes in the world’senergy consumption. In the IEO2006 projections,assumptions about regional economic growth—mea-sured in terms of gross domestic product (GDP) in real2000 U.S. dollars at purchasing power parity rates—underlie the projections of regional energy demand.
The macroeconomic framework employed for the eco-nomic growth projections reflects the interaction ofmany economic variables and underlying relationships,both in the short term and in the medium to long term. Inthe short term, households and businesses make spend-ing decisions (the demand side) based on their expecta-tions of future movements in interest rates, prices,employment, incomes, wealth, fiscal and monetary poli-cies, exchange rates, and world developments. In thelong run, it is the ability to produce goods and services(the supply side) that ultimately determines the growthpotential for any country’s economy.
The outlook for medium- to long-term economic growthdepends on the underlying demographic and expectedproductivity trends in each economy. These in turndepend on population growth, labor force participationrates, productivity growth, and national savings andcapital accumulation. In addition, for the developingeconomies, progress in building human and physicalcapital infrastructures, establishing regulatory mecha-nisms to govern markets, and ensuring political stabilityplay equal or perhaps more important roles in determin-ing their medium- to long-term growth potential.
Over the 2003 to 2030 period, world real GDP growthaverages 3.8 percent annually (Table 2), similar to theIEO2005 projection. The projected growth in world GDPis higher than the growth rate over the past 30 years. Thereason is that most of the countries expected to see morerapid growth are developing non-OECD nations thathave undertaken significant reforms over the past sev-eral years. Improved macroeconomic policies, trade lib-eralization, more flexible exchange rate regimes, andlower fiscal deficits have lowered their national inflationrates, reduced uncertainty, and improved their overallinvestment climates. More microeconomic structuralreforms, such as privatization and regulatory reform,have also played key roles. In general, such reformshave resulted in growth rates that are above historicaltrends in most of these economies over the past 5 to 10years.
OECD Economies
In the United States, compared with the second half ofthe 1990s, GDP growth rates were lower from 2000 to2002 but rebounded to 2.7 percent in 2003 and 4.2
percent in 2004. GDP growth in 2005 is estimated at 3.6percent. Despite large increases in energy prices over thepast 2 years and damage caused by major hurricanes in2005, the U.S. economy is expected to continue growingat a robust pace in the short term, reacting to strong fiscalstimulus, the continued need of businesses to expandproductive capacity, growth in household income andwealth, and the lagged effects of declines in the value ofthe dollar since 2002, which should boost exports rela-tive to imports. In the projections, the U.S. economy sta-bilizes at its long-term growth path between 2005 and2010 as rates of interest, inflation, and unemploymentgradually revert toward their long-term averages. GDPis projected to grow by an average of 3.0 percent peryear between 2006 and 2015, with somewhat slowergrowth—2.9 percent per year—expected between 2015and 2030 as the baby boom generation retires and laborforce growth slows.
Canada has the potential to maintain strong growth inproductivity and its standard of living by increasing thelabor force participation rate, focusing on immigration,strengthening policies on education and innovation, andreducing structural unemployment. Labor force growthis projected to slow in the medium to long term, how-ever, and Canada’s overall potential economic growth isexpected to fall from the current 2.9 percent to 2.6 per-cent per year between 2006 and 2015 and 1.8 percent peryear between 2015 and 2030.
Mexico’s real GDP is projected to grow by an average of4.1 percent per year from 2003 to 2030. Global financialmarkets remain friendly to Mexico in terms of the avail-ability and cost of credit and the volume of foreign directinvestment. In general, strong trade ties with the UnitedStates are expected to help cushion Mexico from deepereconomic troubles. By the same token, Mexico’s futuregrowth is also more dependent on U.S. growth.
Over the long term, OECD Europe’s GDP is projected togrow by 2.2 percent per year between 2003 and 2030 inthe reference case. There are structural impediments toeconomic growth in many countries of OECD Europe,related to the region’s labor markets, product markets,and costly social welfare systems. Reforms to improvethe competitiveness of European labor and productmarkets could yield significant dividends in terms ofincreases in regional output.
After a decade of stagnation, the Japanese economyappears to have turned the corner, growing by 2.6 per-cent in 2004 and an estimated 2.4 percent in 2005. Japan’sGDP growth is projected to average 1.7 percent per yearfrom 2006 to 2015 and then to slow to 1.0 percent peryear from 2015 to 2030. In the short term, Japan’s highlyskilled labor force and strong work ethic are expected tosupport the projected growth rate of 1.7 percent per
Energy Information Administration / International Energy Outlook 2006 11

year, provided that more flexible labor policies allowinggreater mobility for workers are adopted.
Economic growth in the rest of OECD Asia is expected tobe somewhat stronger than in Japan. In the medium tolong term, South Korea’s growth is projected to taper offand be sustained by productivity growth as labor forcegrowth slows. South Korea’s economy is expected toexpand by 3.6 percent annually over the 2003 to 2030period, after growing by 6.7 percent per year between1978 and 2003. Prospects in both Australia and NewZealand are healthy due to a consistent track record offiscal prudence and structural reforms aimed at main-taining competitive product markets and flexible labor
markets. The two countries are expected to see GDP riseby 2.5 percent per year on average from 2003 to 2030.
Non-OECD Economies
Over the 2003 to 2030 projection period, economicgrowth in non-OECD Europe and Eurasia as a whole isprojected to average 4.4 percent annually. For the pastseveral years, the non-OECD nations of Europe and Eur-asia have largely been sheltered from global economicuncertainties, recording strong growth in each yearsince 2000, primarily as a result of robust domesticdemand, the growth bonus associated with ascension ofsome countries (including Estonia, Latvia, Lithuania,and Slovenia) to the European Union, and the impacts of
12 Energy Information Administration / International Energy Outlook 2006
Table 2. Average Annual Growth in World Gross Domestic Product by Selected Countries and Regions,1978-2030(Percent per Year)
Region
History Projections
1978-2003 2003 2004 2005 2005-2015 2015-2030 2003-2030
OECD North America . . . . . . . . . . . 2.9 2.5 4.1 3.5 3.1 2.9 3.1United States. . . . . . . . . . . . . . . . . . 2.9 2.7 4.2 3.6 3.1 2.9 3.0Canada . . . . . . . . . . . . . . . . . . . . . . 2.8 2.0 2.9 2.9 2.6 1.8 2.2Mexico . . . . . . . . . . . . . . . . . . . . . . . 2.9 1.4 4.4 3.1 4.0 4.1 4.1
OECD Europe. . . . . . . . . . . . . . . . . . 2.4 1.4 2.6 1.9 2.3 2.1 2.2
OECD Asia . . . . . . . . . . . . . . . . . . . . 3.0 1.9 3.0 2.6 2.3 1.6 1.9Japan. . . . . . . . . . . . . . . . . . . . . . . . 2.5 1.4 2.6 2.4 1.7 1.0 1.4South Korea . . . . . . . . . . . . . . . . . . 6.7 3.1 4.7 4.0 4.7 2.8 3.6Australia/New Zealand . . . . . . . . . . 3.3 3.2 3.6 2.3 2.5 2.4 2.5
Total OECD . . . . . . . . . . . . . . . . . 2.7 2.0 3.4 2.7 2.7 2.4 2.6
Non-OECD Europe and Eurasia . . . -0.3 7.7 8.1 6.5 4.9 3.7 4.4Russia . . . . . . . . . . . . . . . . . . . . . . . -0.5 7.3 7.2 6.1 4.2 3.3 3.9Other . . . . . . . . . . . . . . . . . . . . . . . . 0.2 8.0 9.5 7.0 5.9 4.0 5.1
Non-OECD Asia . . . . . . . . . . . . . . . . 6.7 7.6 7.8 7.5 5.8 4.9 5.5China . . . . . . . . . . . . . . . . . . . . . . . . 9.4 9.1 9.5 9.2 6.6 5.2 6.0India. . . . . . . . . . . . . . . . . . . . . . . . . 5.3 8.5 6.9 6.8 5.5 5.1 5.4Other . . . . . . . . . . . . . . . . . . . . . . . . 5.4 4.8 6.0 5.4 4.9 4.3 4.6
Middle East . . . . . . . . . . . . . . . . . . . 2.6 4.8 6.4 6.7 4.4 3.7 4.2
Africa . . . . . . . . . . . . . . . . . . . . . . . . 2.9 4.8 5.1 4.9 4.8 4.1 4.4
Central and South America . . . . . . 2.3 2.1 5.9 4.5 3.8 3.5 3.8Brazil . . . . . . . . . . . . . . . . . . . . . . . . 2.5 0.5 4.9 2.7 3.7 3.3 3.5
Total Non-OECD . . . . . . . . . . . . . 3.7 6.4 7.2 6.7 5.3 4.5 5.0
Total WorldPurchasing Power Parity Rates . . 3.1 4.0 5.1 4.6 4.0 3.6 3.8Market Exchange Rates . . . . . . . . 2.8 3.5 4.1 3.1 3.1 2.6 3.0
Note: All regional real GDP growth rates presented in this table are based on 2000 purchasing power parity weights for theindividual countries in each region, except for the final line of the table, which presents world GDP growth rates based on 2000market exchange rate weights for all countries.
Sources: Historical Growth Rates: Global Insight, Inc., World Overview (Lexington, MA, various issues). Projected GDPGrowth Rates: Global Insight, Inc., World Overview, Fourth Quarter 2005 (Lexington, MA, January 2006); and Energy InformationAdministration, Annual Energy Outlook 2006, DOE/EIA-0383(2006) (Washington DC, February 2006). GDP growth rates for Chinaand India were adjusted downward, based on the analyst’s judgment.

rising oil prices on the oil-exporting nations of theregion. High world oil prices have stimulated invest-ment outlays, especially in the energy sector of the Cas-pian region; however, given the volatility of energymarket prices, it is unlikely that the region’s economieswill be able to sustain the growth rates recently achieveduntil diversification from energy becomes more broadlybased. The long-term growth prospects of the Eurasian,former Soviet Republic economies hinge on their successin economic diversification, as well as further improve-ments in domestic product and financial markets.
Much of the growth in world economic activity between2003 and 2030 is expected to occur among the nations ofnon-OECD Asia, where regional GDP growth is pro-jected to average 5.5 percent per year. China, non-OECDAsia’s largest economy, is expected to continue playinga major role on both the supply and demand sides of theglobal economy. IEO2006 projects an average annualgrowth rate of approximately 6.0 percent for China’seconomy over the 2003 to 2030 period. The country’seconomic growth is expected to be the highest in theworld. In 2020, based on share of world GDP (in terms ofpurchasing power parity rates), China is expected to bethe world’s largest economy.
Structural issues that have implications for medium- tolong-term growth in China include the pace of reformaffecting inefficient state-owned companies and a bank-ing system that is carrying a significant amount ofnonperforming loans. The development of domesticcapital markets to maintain macroeconomic stabilityand ensure that China’s large savings are used effi-ciently support the medium-term growth projection.
Another Asian country with a rapidly emerging econ-omy is India. The medium-term prospects for India’seconomy are positive, as it continues to privatize stateenterprises and increasingly adopts free market policies.Average annual GDP growth in India over the 2003 to2030 projection period is 5.4 percent. Accelerating struc-tural reforms—including ending regulatory impedi-ments to the consolidation of labor-intensive industries,labor market and bankruptcy reforms, and agriculturaland trade liberalization—remain essential to stimulatepotential growth and reduce poverty in the medium tolong term. With its vast and relatively cheap labor force,India is well positioned to reap the benefits of globaliza-tion in the medium to long term. In the rest of non-OECD Asia, national economic growth rates areexpected to be roughly constant over the 2006 to 2015period, then taper off gradually, to 4.3 percent annuallyfrom 2015 to 2030, as their labor force growth ratesdecline and their economies mature.
Although the nations of Central and South America areon favorable economic growth paths, registering a com-bined 5.9-percent increase in GDP in 2004—the best
performance in 20 years—the region’s growth rateremains below potential. The weak international creditenvironment is a constraint, as are domestic economicand/or political problems in a number of countries.Growth in the region remains heavily dependent on thevolume of foreign capital flows. Beyond macroeconomicstability and commitment to sound fiscal and monetarypolicies, the countries of Central and South America willface governance issues and severe economic disparitiesbetween the wealthy and the poor in the region’ssocieties.
Rising oil production and prices have helped boostgrowth in the oil-exporting countries of the Middle East.Many of the oil-importing countries in the region havealso benefited from spillover effects on trade, tourism,and financial flows from the region’s oil exporters. RealGDP growth in the Middle East region was estimated at6.7 percent in 2005. Medium-term prospects for theregion remain favorable, given that a significant portionof the recent increase in the region’s oil revenue isexpected to be permanent.
For Africa as a whole, average annual real GDP growthof 4.4 percent is projected over the 2003 to 2030 period.This optimistic projection is supported by strong eco-nomic activity over the past 5 years, which has resultedfrom expansion of oil and non-oil primary exports androbust domestic demand in many of the region’snational economies. Nevertheless, both economic andpolitical factors—such as low savings and investmentrates, lack of strong economic and political institutions,limited quantity and quality of infrastructure andhuman capital, negative perceptions on the part of inter-national investors, and especially the impact of HIV/AIDS on population growth—present formidable obsta-cles to growth in many African countries.
Alternative Growth CasesExpectations for the future rates of economic growth area major source of uncertainty in the IEO2006 projections.To account for the uncertainties associated with eco-nomic growth trends, IEO2006 includes a high economicgrowth case and a low economic growth case in additionto the reference case. The reference case projections arebased on a set of assumptions about regional economicgrowth paths—measured by GDP—and the energy-income elasticity (the relationship between percentagechanges in energy consumption and GDP). The twoalternative growth cases are based on alternativeassumptions about possible economic growth paths;assumptions about the elasticity of energy demand areheld constant, at reference case values.
For the high and low economic growth cases, differentassumptions are made about the range of possible eco-nomic growth rates among the OECD and non-OECD
Energy Information Administration / International Energy Outlook 2006 13

regions. For the OECD, 0.5 percentage point is added tothe reference case GDP growth rates for the high eco-nomic growth case and 0.5 percentage point is sub-tracted from the reference case GDP growth rates for thelow economic growth case. Outside the OECD (exclud-ing Russia), reference case GDP growth rates areincreased and decreased by 1.0 percentage point to pro-vide the high and low economic growth case estimates.
Russia suffered a severe economic collapse in the earlypart of the 1990s and, until recently, has shown widevariation in its year-to-year economic growth. Between1990 and 2003, its annual GDP growth rate varied from-15 percent in 1992 to +10 percent in 2000. Given thiswide range, Russia can be characterized as having a con-siderably more uncertain economic future than manyother nations of the world. As a result, 1.5 percentagepoints are added and subtracted from the reference caseGDP assumptions to derive the high and low macroeco-nomic projections for Russia.
The IEO2006 reference case shows total world energyconsumption reaching 722 quadrillion Btu in 2030, withthe OECD countries projected to consume 309 quadril-lion Btu and the non-OECD countries 413 quadrillionBtu. In the high economic growth case, world energy usein 2030 totals 835 quadrillion Btu—113 quadrillion Btu(or 57 million barrels oil equivalent per day) higher thanin the reference case. In the low economic growth case,worldwide energy consumption in 2030 totals is pro-jected to be 91 quadrillion Btu (46 million barrels oilequivalent per day) lower than in the reference case, at631 quadrillion Btu. Thus, there is a substantial range of205 quadrillion Btu—nearly 30 percent of the total con-sumption projected for 2030 in the reference case—
between the projections in the high and low economicgrowth cases (Figure 14).
Trends in Energy IntensityAnother major source of uncertainty in long-term pro-jections is the relationship of energy use to GDP—orenergy intensity—over time. Economic growth andenergy demand are linked, but the strength of that linkvaries among regions over time. For the OECD coun-tries, history shows the link to be a relatively weak one,with energy demand lagging behind economic growth(Figure 15). For the non-OECD countries (excludingnon-OECD Europe and Eurasia), energy demand andeconomic growth have been closely correlated for muchof the past two decades (Figure 16). Economic growthhas only recently (that is, within the past decade or so)begun to outpace growth in energy use among theemerging economies of the world.
The historical behavior of energy intensity in non-OECDEurope and Eurasia is problematic. Since World War II,the economies of the region have had higher levels ofenergy intensity than either the OECD or the othernon-OECD economies. In non-OECD Europe and Eur-asia, however, energy consumption generally grewmore quickly than GDP until 1990 (Figure 17), when thecollapse of the Soviet Union created a situation in whichboth income and energy use declined, but GDP fell morequickly and, as a result, energy intensity increased. Onlysince the late 1990s, after the 1997 devaluation of theRussian ruble, have the Russian and Ukrainian indus-trial sectors begun to strengthen. As a result, economicgrowth in non-OECD Europe and Eurasia has begun tooutpace growth in energy use significantly, and energy
14 Energy Information Administration / International Energy Outlook 2006
1980 1990 2003 2010 2020 20300
200
400
600
800
1,000Quadrillion Btu
History Projections
LowEconomic
Growth
Reference
HighEconomic
Growth
Figure 14. World Marketed Energy Consumptionin Three Economic Growth Cases,1980-2030
Sources: History: Energy Information Administration (EIA),International Energy Annual 2003 (May-July 2005), web sitewww.eia.doe.gov/iea/. Projections: EIA, System for the Anal-ysis of Global Energy Markets (2006).
1980 1990 2003 2010 2020 20300
2
4
6
8
10
12Index, 1980 = 1
Energy Use
GrossDomesticProduct
History Projections
Figure 15. Growth in Energy Use and GrossDomestic Product for the OECDEconomies, 1980-2030
Sources: History: Energy Information Administration (EIA),International Energy Annual 2003 (May-July 2005), web sitewww.eia.doe.gov/iea/. Projections: EIA, System for the Anal-ysis of Global Energy Markets (2006).

intensity has begun to decline precipitously. Over theprojection horizon, energy intensity in the region contin-ues to decline but still remains higher than in any otherregion of the world (Figure 18).
The stage of economic development and the standard ofliving of individuals in a given region strongly influencethe link between economic growth and energy demand.Advanced economies with high living standards have arelatively high level of energy use per capita, but theyalso tend to be economies where per capita energy use isstable or changes very slowly. In the OECD economies,there is a high penetration rate of modern appliancesand motorized personal transportation equipment. Tothe extent that spending is directed to energy-consuming goods, it involves more often than not pur-chases of new equipment to replace old capital stock.The new stock is often more efficient than the equipmentit replaces, resulting in a weaker link between incomeand energy demand.
The pace of improvement in energy intensity maychange, given different assumptions of macroeconomicgrowth over time. Faster growth in income leads to afaster rate of decline in energy intensity. Worldwideenergy intensity in the IEO2006 high economic growthcase improves by 1.9 percent per year on average from2003 to 2030, compared with 1.8 percent in the referencecase. On the other hand, slower economic growth wouldresult in a slower rate of decline in energy intensity. Inthe low macroeconomic growth case, world energyintensity declines by an average of 1.5 percent per yearover the projection period.
Energy Information Administration / International Energy Outlook 2006 15
1980 1990 2003 2010 2020 20300
2
4
6
8
10
12Index, 1980 = 1
History Projections
Energy Use
GrossDomesticProduct
Figure 16. Growth in Energy Use and GrossDomestic Product for the Non-OECDEconomies, 1980-2030
Note: Non-OECD economies in this figure exclude non-OECD Europe and Eurasia.
Sources: History: Derived from Energy Information Admin-istration (EIA), International Energy Annual 2003 (May-July2005), web site www.eia.doe.gov/iea/. Projections: EIA, Sys-tem for the Analysis of Global Energy Markets (2006).
1980 1990 2003 2010 2020 20300
2
4
6
8
10
12Index, 1980 = 1
History Projections
Energy Use
GrossDomesticProduct
Figure 17. Growth in Energy Use and GrossDomestic Product for the Non-OECDEconomies of Europe and Eurasia,1980-2030
Sources: History: Derived from Energy Information Admin-istration (EIA), International Energy Annual 2003 (May-July2005), web site www.eia.doe.gov/iea/. Projections: EIA, Sys-tem for the Analysis of Global Energy Markets (2006).
1980 1990 2003 2010 2020 20300
5
10
15
20
25Thousand Btu per 2000 Dollar of GDP
History Projections
OECD
Other Non-OECD
Non-OECDEurope and
Eurasia
Figure 18. Energy Intensity by Region, 1980-2030
Sources: History: Derived from Energy Information Admin-istration (EIA), International Energy Annual 2003 (May-July2005), web site www.eia.doe.gov/iea/. Projections: EIA, Sys-tem for the Analysis of Global Energy Markets (2006).

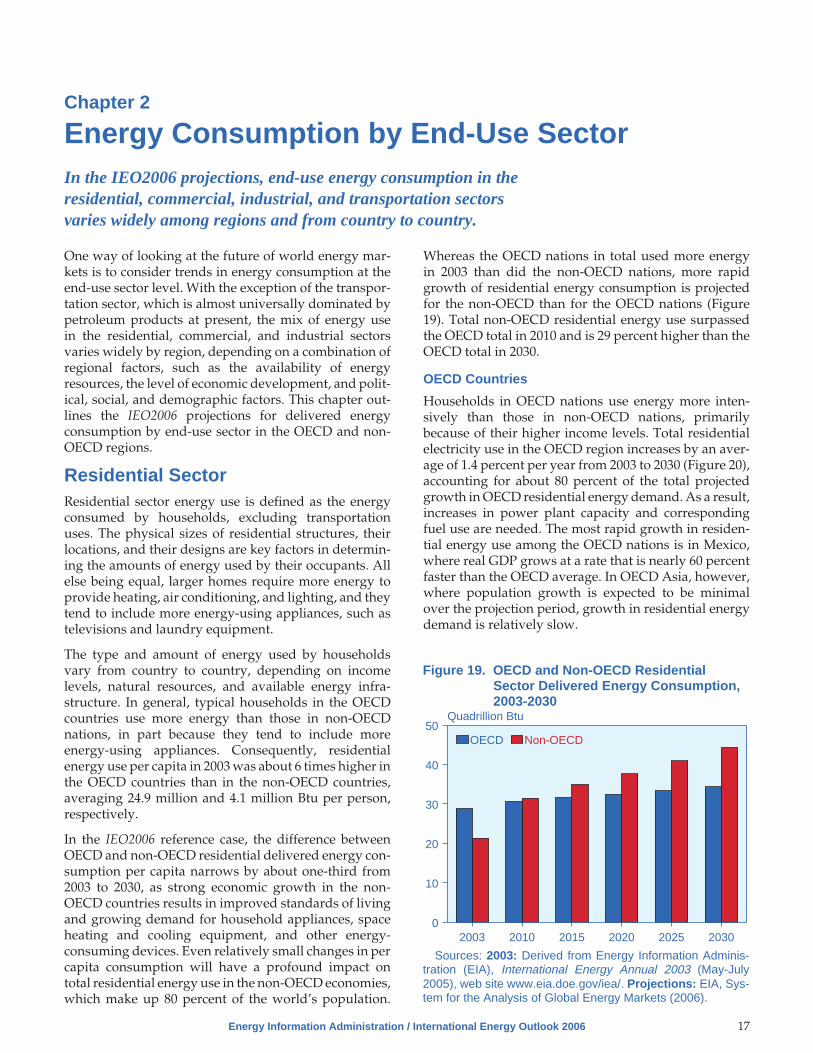
Chapter 2
Energy Consumption by End-Use SectorIn the IEO2006 projections, end-use energy consumption in theresidential, commercial, industrial, and transportation sectorsvaries widely among regions and from country to country.
One way of looking at the future of world energy mar-kets is to consider trends in energy consumption at theend-use sector level. With the exception of the transpor-tation sector, which is almost universally dominated bypetroleum products at present, the mix of energy usein the residential, commercial, and industrial sectorsvaries widely by region, depending on a combination ofregional factors, such as the availability of energyresources, the level of economic development, and polit-ical, social, and demographic factors. This chapter out-lines the IEO2006 projections for delivered energyconsumption by end-use sector in the OECD and non-OECD regions.
Residential SectorResidential sector energy use is defined as the energyconsumed by households, excluding transportationuses. The physical sizes of residential structures, theirlocations, and their designs are key factors in determin-ing the amounts of energy used by their occupants. Allelse being equal, larger homes require more energy toprovide heating, air conditioning, and lighting, and theytend to include more energy-using appliances, such astelevisions and laundry equipment.
The type and amount of energy used by householdsvary from country to country, depending on incomelevels, natural resources, and available energy infra-structure. In general, typical households in the OECDcountries use more energy than those in non-OECDnations, in part because they tend to include moreenergy-using appliances. Consequently, residentialenergy use per capita in 2003 was about 6 times higher inthe OECD countries than in the non-OECD countries,averaging 24.9 million and 4.1 million Btu per person,respectively.
In the IEO2006 reference case, the difference betweenOECD and non-OECD residential delivered energy con-sumption per capita narrows by about one-third from2003 to 2030, as strong economic growth in the non-OECD countries results in improved standards of livingand growing demand for household appliances, spaceheating and cooling equipment, and other energy-consuming devices. Even relatively small changes in percapita consumption will have a profound impact ontotal residential energy use in the non-OECD economies,which make up 80 percent of the world’s population.
Whereas the OECD nations in total used more energyin 2003 than did the non-OECD nations, more rapidgrowth of residential energy consumption is projectedfor the non-OECD than for the OECD nations (Figure19). Total non-OECD residential energy use surpassedthe OECD total in 2010 and is 29 percent higher than theOECD total in 2030.
OECD Countries
Households in OECD nations use energy more inten-sively than those in non-OECD nations, primarilybecause of their higher income levels. Total residentialelectricity use in the OECD region increases by an aver-age of 1.4 percent per year from 2003 to 2030 (Figure 20),accounting for about 80 percent of the total projectedgrowth in OECD residential energy demand. As a result,increases in power plant capacity and correspondingfuel use are needed. The most rapid growth in residen-tial energy use among the OECD nations is in Mexico,where real GDP grows at a rate that is nearly 60 percentfaster than the OECD average. In OECD Asia, however,where population growth is expected to be minimalover the projection period, growth in residential energydemand is relatively slow.
Energy Information Administration / International Energy Outlook 2006 17
2003 2010 2015 2020 2025 20300
10
20
30
40
50Quadrillion Btu
OECD Non-OECD
Figure 19. OECD and Non-OECD ResidentialSector Delivered Energy Consumption,2003-2030
Sources: 2003: Derived from Energy Information Adminis-tration (EIA), International Energy Annual 2003 (May-July2005), web site www.eia.doe.gov/iea/. Projections: EIA, Sys-tem for the Analysis of Global Energy Markets (2006).

Currently, the United States is by far the largest residen-tial energy consumer in the world. For example, in 2003,residential energy use in all of OECD Europe was onlyabout 7 percent greater than that in the United States.Moreover, with the U.S. population projected to grow atnearly 4 times the rate of OECD Europe’s populationfrom 2003 to 2030, residential energy consumption in theUnited States in 2030 is 6 percent greater than in OECDEurope.
Non-OECD Countries
Household energy use increases more rapidly in thenon-OECD countries than in the OECD countries(Figure 20). Driven by robust economic growth andexpanding populations, residential energy consumptionin the non-OECD nations exceeds that in the OECDnations by nearly one-third in 2030. Real GDP in thenon-OECD region as a whole is projected to grow bynearly 5 percent per year through 2030, and populationby more than 1 percent per year on average. As a result,household energy use grows at a robust rate of 2.7 per-cent per year on average through 2030.
In China and India, the two fastest growing economiesamong the non-OECD countries in the IEO2006 refer-ence case, urbanization and population growth areexpected to result in large increases in demand for resi-dential energy services. China and India account fornearly one-half of the total increase in residential energyuse in the non-OECD countries through 2030, as theireconomies continue to grow strongly over the projectionperiod. In 2003, GDP in China and India combined wasabout 91 percent the size of U.S. GDP on a purchasing
power parity basis; in 2030, their combined GDP is pro-jected to be almost double that of the United States.
Commercial SectorThe commercial sector—often referred to as the servicessector or the services and institutional sector—consistsof businesses, institutions, and organizations that pro-vide services, as opposed to those in manufacturing oragriculture. The sector encompasses many differenttypes of buildings and a wide range of activities andenergy-related services. Examples of commercial sectorfacilities include schools, stores, correctional institu-tions, restaurants, hotels, hospitals, museums, officebuildings, banks, and even stadiums that hold sportingevents. Most commercial energy use occurs in buildingsor structures, including services such as space heating,water heating, lighting, cooking, and cooling. Energyconsumed for services not associated with buildings,such as for traffic lights and city water and sewer ser-vices, is also categorized as commercial sector energyuse.
Economic and population growth trends drive commer-cial sector activity and the resulting energy use. Theneed for services (health, education, financial, govern-ment) increases as populations increase. The degree towhich these additional needs may be met depends inlarge measure on economic resources—whether fromdomestic or foreign sources—and economic growth.Economic growth also determines the degree to whichadditional commercial sector activities are offered andutilized. Higher levels of economic activity and dispos-able income lead to increased demand for hotels and res-taurants to meet business and leisure requirements; foroffice and retail space to house and service new andexpanding businesses; and for cultural and leisure spacesuch as theaters, galleries, and arenas.
OECD Countries
Commercial sector energy consumption in the OECDnations increases in the reference case by an average of1.1 percent per year from 2003 to 2030 (Figure 21). Slowpopulation growth in most of the OECD nations—alongwith continued efficiency improvements as energy-using equipment wears out and is replaced with newer,more efficient stock—moderates the projected growth;however, these factors are offset by economic growththat is expected to include continued growth in businessactivity, with its associated energy use, in areas such asretail and wholesale trade and business, financial, andleisure services. Although the fastest growth in commer-cial energy demand among the OECD economies isexpected to be in the countries with the fastest GDPgrowth (Mexico and South Korea), the United Statesremains the largest commercial sector energy consumerin the OECD, accounting for one-half of the 24.7
18 Energy Information Administration / International Energy Outlook 2006
Oil NaturalGas
Coal Electricity TotalDeliveredEnergy
0
2
4
6
-2
Average Annual Percent Change
OECD Non-OECD
Figure 20. Growth in OECD and Non-OECDResidential Sector Delivered EnergyConsumption by Fuel, 2003-2030
Sources: 2003: Derived from Energy Information Adminis-tration (EIA), International Energy Annual 2003 (May-July2005), web site www.eia.doe.gov/iea/. Projections: EIA, Sys-tem for the Analysis of Global Energy Markets (2006).

quadrillion Btu of commercial energy use in the OECDas a whole in 2030.
Commercial electricity demand in the OECD nationsgrows by 1.8 percent per year from 2003 to 2030, withcontinued advances in technology and the introductionof new electronic appliances and equipment (Figure 22).Electricity delivered to commercial consumers in OECDcountries, which totaled 8.5 quadrillion Btu in 2003, is11.0 quadrillion Btu in 2015 and 13.8 quadrillion Btu in2030, surpassing projected OECD residential electricityuse of 13.1 quadrillion Btu by the end of the projectionperiod. Natural gas continues to displace petroleumproducts and coal as the preferred commercial heatingfuel in the OECD region.
Non-OECD Countries
Economic growth and commerce are expected toincrease rapidly in the non-OECD nations, fueling addi-tional energy demand in the services sector. Faster pop-ulation growth is also expected, relative to that in theOECD countries, portending increases in the need foreducation, health care, and social services and theenergy required to provide them. Under these circum-stances, commercial sector energy use in non-OECDcountries nearly doubles between 2003 and 2020, to 11.6quadrillion Btu, and continues growing to 14.3 quadril-lion Btu in 2030. Over the 2003 to 2030 period, commer-cial energy use in the non-OECD region increases at anaverage annual rate of 3.2 percent.
Electricity demand for commercial applications growsrapidly in the non-OECD nations as more clinics,schools, and business gain access to electricity. Annual
growth in commercial delivered electricity use averages4.3 percent through 2030 (Figure 22), with projected con-sumption of 5.6 quadrillion Btu in 2015 and 8.8 quadril-lion Btu in 2030. The largest increases in commercialelectricity demand are projected for the nations withrapidly growing economies, particularly China andIndia, as their burgeoning economies foster increases indemand for services.
Increasing commercial activity is expected to lead togrowth in demand for fossil fuels in the non-OECDnations. In the projections, commercial demand for nat-ural gas grows by 3.0 percent per year from 2003 to 2015and by 2.2 percent from 2003 to 2030, as several countriesfocus on expanding the infrastructure necessary fordelivery of this relatively clean fuel. Commercial sectoroil consumption in the non-OECD region increases from1.4 quadrillion Btu in 2003 to 1.9 quadrillion Btu in 2015and 2.3 quadrillion Btu in 2030, with more rapidincreases in areas where the availability of natural gas islimited. Commercial sector coal use nearly doubles overthe projection period in the non-OECD region, to 0.8quadrillion Btu in 2030, with most of the growth occur-ring between 2003 and 2015. Coal remains an economi-cally attractive choice for commercial water heating,space heating, and cooking in non-OECD countries inthe projections, especially in China and India, whichtogether account for around 80 percent of non-OECDcommercial coal use from 2003 through 2030.
Industrial SectorEnergy is consumed in the industrial sector by a diversegroup of industries—including manufacturing, agricul-ture, mining, and construction—and for a wide range of
Energy Information Administration / International Energy Outlook 2006 19
2003 2010 2015 2020 2025 20300
10
20
30
40Quadrillion Btu
OECD Non-OECD
Figure 21. OECD and Non-OECD CommercialSector Delivered Energy Consumption,2003-2030
Sources: 2003: Derived from Energy Information Adminis-tration (EIA), International Energy Annual 2003 (May-July2005), web site www.eia.doe.gov/iea/. Projections: EIA, Sys-tem for the Analysis of Global Energy Markets (2006).
Oil NaturalGas
Coal Electricity TotalDeliveredEnergy
0
1
2
3
4
5
-1
Average Annual Percent Change
OECD Non-OECD
Figure 22. Growth in OECD and Non-OECDCommercial Sector Delivered EnergyConsumption by Fuel, 2003-2030
Sources: 2003: Derived from Energy Information Adminis-tration (EIA), International Energy Annual 2003 (May-July2005), web site www.eia.doe.gov/iea/. Projections: EIA, Sys-tem for the Analysis of Global Energy Markets (2006).
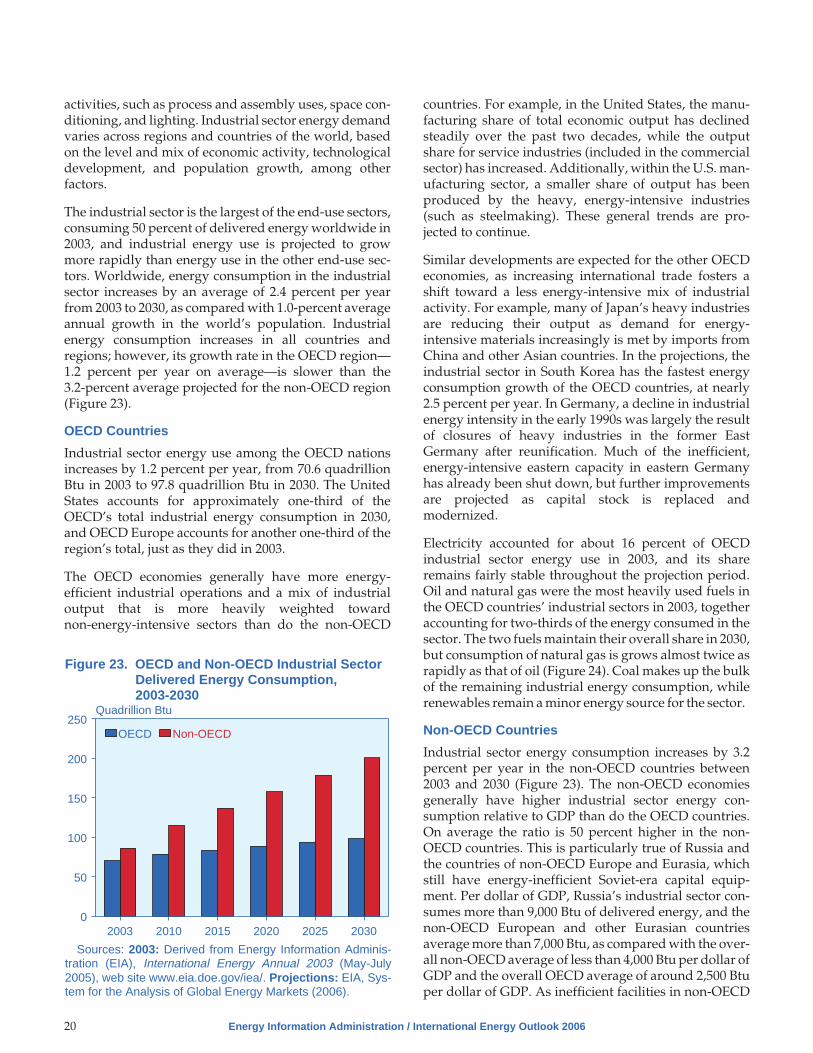
activities, such as process and assembly uses, space con-ditioning, and lighting. Industrial sector energy demandvaries across regions and countries of the world, basedon the level and mix of economic activity, technologicaldevelopment, and population growth, among otherfactors.
The industrial sector is the largest of the end-use sectors,consuming 50 percent of delivered energy worldwide in2003, and industrial energy use is projected to growmore rapidly than energy use in the other end-use sec-tors. Worldwide, energy consumption in the industrialsector increases by an average of 2.4 percent per yearfrom 2003 to 2030, as compared with 1.0-percent averageannual growth in the world’s population. Industrialenergy consumption increases in all countries andregions; however, its growth rate in the OECD region—1.2 percent per year on average—is slower than the3.2-percent average projected for the non-OECD region(Figure 23).
OECD Countries
Industrial sector energy use among the OECD nationsincreases by 1.2 percent per year, from 70.6 quadrillionBtu in 2003 to 97.8 quadrillion Btu in 2030. The UnitedStates accounts for approximately one-third of theOECD’s total industrial energy consumption in 2030,and OECD Europe accounts for another one-third of theregion’s total, just as they did in 2003.
The OECD economies generally have more energy-efficient industrial operations and a mix of industrialoutput that is more heavily weighted towardnon-energy-intensive sectors than do the non-OECD
countries. For example, in the United States, the manu-facturing share of total economic output has declinedsteadily over the past two decades, while the outputshare for service industries (included in the commercialsector) has increased. Additionally, within the U.S. man-ufacturing sector, a smaller share of output has beenproduced by the heavy, energy-intensive industries(such as steelmaking). These general trends are pro-jected to continue.
Similar developments are expected for the other OECDeconomies, as increasing international trade fosters ashift toward a less energy-intensive mix of industrialactivity. For example, many of Japan’s heavy industriesare reducing their output as demand for energy-intensive materials increasingly is met by imports fromChina and other Asian countries. In the projections, theindustrial sector in South Korea has the fastest energyconsumption growth of the OECD countries, at nearly2.5 percent per year. In Germany, a decline in industrialenergy intensity in the early 1990s was largely the resultof closures of heavy industries in the former EastGermany after reunification. Much of the inefficient,energy-intensive eastern capacity in eastern Germanyhas already been shut down, but further improvementsare projected as capital stock is replaced andmodernized.
Electricity accounted for about 16 percent of OECDindustrial sector energy use in 2003, and its shareremains fairly stable throughout the projection period.Oil and natural gas were the most heavily used fuels inthe OECD countries’ industrial sectors in 2003, togetheraccounting for two-thirds of the energy consumed in thesector. The two fuels maintain their overall share in 2030,but consumption of natural gas is grows almost twice asrapidly as that of oil (Figure 24). Coal makes up the bulkof the remaining industrial energy consumption, whilerenewables remain a minor energy source for the sector.
Non-OECD Countries
Industrial sector energy consumption increases by 3.2percent per year in the non-OECD countries between2003 and 2030 (Figure 23). The non-OECD economiesgenerally have higher industrial sector energy con-sumption relative to GDP than do the OECD countries.On average the ratio is 50 percent higher in the non-OECD countries. This is particularly true of Russia andthe countries of non-OECD Europe and Eurasia, whichstill have energy-inefficient Soviet-era capital equip-ment. Per dollar of GDP, Russia’s industrial sector con-sumes more than 9,000 Btu of delivered energy, and thenon-OECD European and other Eurasian countriesaverage more than 7,000 Btu, as compared with the over-all non-OECD average of less than 4,000 Btu per dollar ofGDP and the overall OECD average of around 2,500 Btuper dollar of GDP. As inefficient facilities in non-OECD
20 Energy Information Administration / International Energy Outlook 2006
2003 2010 2015 2020 2025 20300
50
100
150
200
250Quadrillion Btu
OECD Non-OECD
Figure 23. OECD and Non-OECD Industrial SectorDelivered Energy Consumption,2003-2030
Sources: 2003: Derived from Energy Information Adminis-tration (EIA), International Energy Annual 2003 (May-July2005), web site www.eia.doe.gov/iea/. Projections: EIA, Sys-tem for the Analysis of Global Energy Markets (2006).

Europe and Eurasia are replaced with modern capacity,industrial energy intensities in the region are expected todecline more rapidly than in most of the rest of theworld.
Of the non-OECD economies, China, the Middle East,and India have the most rapid increases in industrialsector energy consumption from 2003 to 2030. Whereasthe economies of the OECD countries have largelymoved away from heavy, energy-intensive industries(such as steel and cement) toward a greater emphasis onlight manufacturing and service activities, the econo-mies of many of the non-OECD countries and regionshave growing energy-intensive, heavy manufacturingsectors.
Although electricity is expected to become an increas-ingly important component of industrial sector deliv-ered energy demand in the non-OECD economies, oil,coal, and natural gas were the most heavily used fuels in2003, and they are projected to remain so in 2030. Oil usein the non-OECD industrial sector increases at a slowerrate than natural gas or coal use (Figure 24). The contin-ued importance of coal in the non-OECD industrial sec-tor is largely attributable to China, which accounts fortwo-thirds of industrial coal use in the non-OECD econ-omies in 2030.
Transportation SectorTransportation sector energy use includes fuels con-sumed for the purpose of moving people and goods byroad, rail, and air. The road transport component con-sists of both light-duty vehicles (automobiles, sport util-ity vehicles, minivans, small trucks, and motorcycles,among other small vehicles) and heavy-duty vehicles(large trucks used for moving freight and buses for masstransit). Economic growth and population growth arekey factors.
Petroleum products continue to dominate energy use inthe transportation sector; and barring any widespreadincrease in the penetration of new technologies, the useof alternative fuels is expected to remain relatively mod-est through 2030. The IEO2006 reference case projects a1.4-percent average annual growth rate for transporta-tion petroleum demand from 2003 to 2030. Much of theprojected growth in demand for petroleum products inthe transportation sector comes from the non-OECDeconomies (2.3 percent per year) as compared with theOECD countries (0.8 percent per year).
OECD Countries
In general, the transportation sector of the OECD econo-mies is fully established, with extensive infrastructurethat includes highways, airport facilities, and rail sys-tems. Transportation energy demand in the OECDregion grows at an average annual rate of 0.9 percent,
from 57.0 quadrillion Btu in 2003 to 64.1 quadrillion Btuin 2015 and 71.7 quadrillion Btu in 2030 (Figure 25).
In the United States, the transportation sector continuesto account for more than one-fourth of the country’stotal energy consumption; and in the IEO2006 referencecase, U.S. transportation energy demand grows from27.1 quadrillion Btu in 2003 to 33.1 quadrillion Btu in2015 and 39.7 quadrillion Btu in 2030. The United States,currently the largest user of transportation energyamong the OECD economies, accounts for 55 percent oftotal OECD transportation sector energy use in 2030.
Strong economic growth and a growing population areexpected to increase the demand for larger, more power-ful vehicles in the United States; however, advancedtechnologies and materials are expected to provideincreased performance and size while improving newvehicle fuel economy. In the projections, the U.S. fueleconomy standard for passenger cars is assumed tostay at the current level of 27.5 miles per gallon [1]. Notreflected in the projections is the new Corporate Aver-age Fuel Economy (CAFE) rule, finalized in March 2006,which requires a higher fuel economy standard for lighttrucks, including the largest sport utility vehicles [2].The new CAFE rule is expected to increase light truckfuel economy from an average of 20.7 miles per gallon in2004 to an average of 24.1 miles per gallon for modelyears 2011 and beyond.
In contrast to the United States, transportation energydemand in OECD Europe is projected to remain fairlyflat throughout the projection period. Low populationgrowth, high taxes on transportation fuels, and environ-mental policies all contribute to the slow growth in the
Energy Information Administration / International Energy Outlook 2006 21
Oil NaturalGas
Coal Electricity TotalDeliveredEnergy
0
1
2
3
4
5Average Annual Percent Change
OECD Non-OECD
Figure 24. Growth in OECD and Non-OECDIndustrial Sector Delivered EnergyConsumption by Fuel, 2003-2030
Sources: 2003: Derived from Energy Information Adminis-tration (EIA), International Energy Annual 2003 (May-July2005), web site www.eia.doe.gov/iea/. Projections: EIA, Sys-tem for the Analysis of Global Energy Markets (2006).
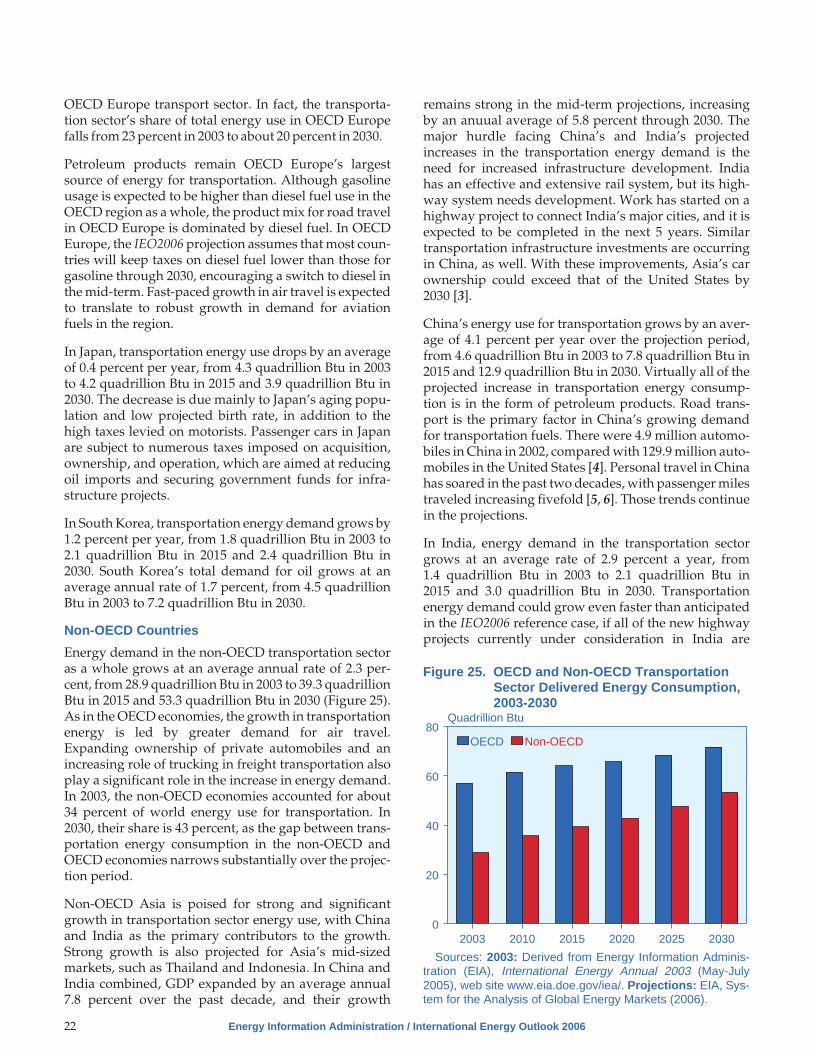
OECD Europe transport sector. In fact, the transporta-tion sector’s share of total energy use in OECD Europefalls from 23 percent in 2003 to about 20 percent in 2030.
Petroleum products remain OECD Europe’s largestsource of energy for transportation. Although gasolineusage is expected to be higher than diesel fuel use in theOECD region as a whole, the product mix for road travelin OECD Europe is dominated by diesel fuel. In OECDEurope, the IEO2006 projection assumes that most coun-tries will keep taxes on diesel fuel lower than those forgasoline through 2030, encouraging a switch to diesel inthe mid-term. Fast-paced growth in air travel is expectedto translate to robust growth in demand for aviationfuels in the region.
In Japan, transportation energy use drops by an averageof 0.4 percent per year, from 4.3 quadrillion Btu in 2003to 4.2 quadrillion Btu in 2015 and 3.9 quadrillion Btu in2030. The decrease is due mainly to Japan’s aging popu-lation and low projected birth rate, in addition to thehigh taxes levied on motorists. Passenger cars in Japanare subject to numerous taxes imposed on acquisition,ownership, and operation, which are aimed at reducingoil imports and securing government funds for infra-structure projects.
In South Korea, transportation energy demand grows by1.2 percent per year, from 1.8 quadrillion Btu in 2003 to2.1 quadrillion Btu in 2015 and 2.4 quadrillion Btu in2030. South Korea’s total demand for oil grows at anaverage annual rate of 1.7 percent, from 4.5 quadrillionBtu in 2003 to 7.2 quadrillion Btu in 2030.
Non-OECD Countries
Energy demand in the non-OECD transportation sectoras a whole grows at an average annual rate of 2.3 per-cent, from 28.9 quadrillion Btu in 2003 to 39.3 quadrillionBtu in 2015 and 53.3 quadrillion Btu in 2030 (Figure 25).As in the OECD economies, the growth in transportationenergy is led by greater demand for air travel.Expanding ownership of private automobiles and anincreasing role of trucking in freight transportation alsoplay a significant role in the increase in energy demand.In 2003, the non-OECD economies accounted for about34 percent of world energy use for transportation. In2030, their share is 43 percent, as the gap between trans-portation energy consumption in the non-OECD andOECD economies narrows substantially over the projec-tion period.
Non-OECD Asia is poised for strong and significantgrowth in transportation sector energy use, with Chinaand India as the primary contributors to the growth.Strong growth is also projected for Asia’s mid-sizedmarkets, such as Thailand and Indonesia. In China andIndia combined, GDP expanded by an average annual7.8 percent over the past decade, and their growth
remains strong in the mid-term projections, increasingby an anuual average of 5.8 percent through 2030. Themajor hurdle facing China’s and India’s projectedincreases in the transportation energy demand is theneed for increased infrastructure development. Indiahas an effective and extensive rail system, but its high-way system needs development. Work has started on ahighway project to connect India’s major cities, and it isexpected to be completed in the next 5 years. Similartransportation infrastructure investments are occurringin China, as well. With these improvements, Asia’s carownership could exceed that of the United States by2030 [3].
China’s energy use for transportation grows by an aver-age of 4.1 percent per year over the projection period,from 4.6 quadrillion Btu in 2003 to 7.8 quadrillion Btu in2015 and 12.9 quadrillion Btu in 2030. Virtually all of theprojected increase in transportation energy consump-tion is in the form of petroleum products. Road trans-port is the primary factor in China’s growing demandfor transportation fuels. There were 4.9 million automo-biles in China in 2002, compared with 129.9 million auto-mobiles in the United States [4]. Personal travel in Chinahas soared in the past two decades, with passenger milestraveled increasing fivefold [5, 6]. Those trends continuein the projections.
In India, energy demand in the transportation sectorgrows at an average rate of 2.9 percent a year, from1.4 quadrillion Btu in 2003 to 2.1 quadrillion Btu in2015 and 3.0 quadrillion Btu in 2030. Transportationenergy demand could grow even faster than anticipatedin the IEO2006 reference case, if all of the new highwayprojects currently under consideration in India are
22 Energy Information Administration / International Energy Outlook 2006
2003 2010 2015 2020 2025 20300
20
40
60
80Quadrillion Btu
OECD Non-OECD
Figure 25. OECD and Non-OECD TransportationSector Delivered Energy Consumption,2003-2030
Sources: 2003: Derived from Energy Information Adminis-tration (EIA), International Energy Annual 2003 (May-July2005), web site www.eia.doe.gov/iea/. Projections: EIA, Sys-tem for the Analysis of Global Energy Markets (2006).

completed. Diesel usage in India is expected to be muchhigher than gasoline, in contrast to the United States.Diesel is often the preferred fuel for vehicles in develop-ing economies. In the OECD countries, especially theUnited States and Europe, ultra-low-sulfur diesel is leg-islatively required for emission control purposes.Although there are similar regulations in many non-OECD countries, including in India, they are rarelyenforced, and vehicles continue to burn less expensive,lower quality fuels. Transportation energy demand inthe other non-OECD nations of Asia (the largest ofwhich are Thailand, Indonesia, Malaysia, Singapore,Taiwan, and Hong Kong) grows by 2.3 percent per year,from 5.8 quadrillion Btu in 2003 to 7.7 quadrillion Btu in2015 and 10.6 quadrillion Btu in 2030.
The Middle East region has a relatively small populationand is not a major energy consumer but rather anexporter; however, rapid population growth is expectedto result in more energy use for transportation in thefuture. The region’s energy demand for transportationgrows from 4.2 quadrillion Btu in 2003 to 5.2 quadrillionBtu in 2015 and 6.2 quadrillion Btu in 2030. Demand fortransportation fuels in traditional exporting countriessuch as Saudi Arabia, Kuwait, Iraq, Oman, the UnitedArab Emirates, Yemen, and, most notably, Iran made theregion a net importer of gasoline in 2003; however, thattrend is expected to be reversed by 2010, when plannedadditions to refinery capacity come on line.
References
Energy Information Administration / International Energy Outlook 2006 23
1. National Highway Traffic Safety Administration,Light Truck Average Fuel Economy Standards, ModelYears 2005-2007, 49 CFR Part 533 [Docket No.2002-11419; Notice 3], RIN 2127-AI70 (Washington,DC, April 2003), web site www.nhtsa.dot.gov/cars/rules/rulings/CAFE05-07/Index.html.
2. National Highway Traffic Safety Administration,Press Release, “New Light Truck Economy Stan-dards To Save 10.7 Billion Gallons of Fuel, IncludeLargest SUVs for First Time Ever, TransportationSecretary Mineta Announces,” DOT 46-06 (March29, 2006), web site www.nhtsa.dot.gov.
3. FACTS Inc., Asia-Pacific Databook 1: Supply, Demandand Prices (Honolulu, HI, Fall 2003), p. 3, web sitewww.factsinc.net/products/databooks.shtml.
4. S.C. Davis and S.W. Diegel, Transportation EnergyData Book: Edition 24, ORNL-6973 (Oak Ridge, TN:Oak Ridge National Laboratory, December 2004),Tables 3.1 and 3.2, web site http://cta.ornl.gov/data/Index.shtml.
5. International Energy Agency, World Energy Outlook2004 (Paris, France, October 2004), web site www.worldenergyoutlook.org.
6. World Markets Research Centre, “Automotive Sec-tor Analysis: India and China” (October 18, 2004),web site www.wmrc.com.


Chapter 3
World Oil MarketsIn the IEO2006 reference case, world oil demand increases by 47 percentfrom 2003 to 2030. Non-OECD Asia, including China and India,accounts for 43 percent of the increase.
In the IEO2006 reference case, world oil demand growsfrom 80 million barrels per day in 2003 to 98 million bar-rels per day in 2015 and 118 million barrels per day in2030. Demand increases strongly despite world oilprices that are 35 percent higher in 2025 than in lastyear’s outlook. Much of the growth in oil consumptionis projected for the nations of non-OECD Asia, wherestrong economic growth is expected. Non-OECD Asia(including China and India) accounts for 43 percent ofthe total increase in world oil use over the projectionperiod.
To meet the projected increase in world oil demand inthe IEO2006 reference case, total petroleum supply in2030 will need to increase by 38 million barrels per day,to 118 million barrels per day, from the 2003 level of 80million barrels per day. OPEC producers are expected toprovide 14.6 million barrels per day of the increase.Higher oil prices cause a substantial increase innon-OPEC oil production—23.7 million barrels per day,which represents 62 percent of the increase in totalworld oil supplies over the projection period. The esti-mates of production increases are based on currentproved reserves and a country-by-country assessmentof ultimately recoverable petroleum.
The oil price path in the IEO2006 reference case reflects areassessment of the willingness of oil-rich countries toexpand production capacity as aggressively as envi-sioned in last year’s projection. It does not represent achange in the assessment of the ultimate size of theworld’s petroleum resources but rather a lower level ofinvestment in oil development in key resource-richregions than was projected in IEO2005. Several factorscontribute to the expectation of lower investment and oilproduction in key oil-rich producing regions, includingcontinued strong worldwide economic growth despitehigh oil prices, and various restrictions on access andcontracting that affect oil exploration and productioncompanies’ costs.
In IEO2005, OPEC production was projected to increaseby 24.0 million barrels per day between 2002 and 2025.IEO2006 projects an increase in OPEC supply of only11.8 million barrel per day over the same period. Theresulting increase in world oil prices dampens worlddemand in the mid-term and makes previously uneco-nomical resources in non-OPEC regions more likely to
be produced. Non-OPEC supplies of both conventionaland unconventional resources (including biofuels, coal-to-liquids, and gas-to-liquids) are expected to increaseas a result. In 2003, world production of unconventionalresources totaled only 1.8 million barrels per day; in theIEO2006 reference case, unconventional resource sup-plies rise to 11.5 million barrels per day and account fornearly 10 percent of total world petroleum supply in2030.
To assess uncertainties in the reference case projections,IEO2006 includes a high world oil price case and a lowworld price case in addition to the reference case. In allthe cases, world oil prices are expressed as the averageprice of imported low-sulfur, light crude oil to U.S. refin-ers (see box on page 26). In the reference case, world oilprices increase from $41 per barrel in 2004 to $57 per bar-rel in 2030 (all prices in real 2004 dollars unless other-wise noted), and oil demand rises to 118 million barrelsper day in 2030. In the low and high world oil pricecases, prices in 2030 are $34 per barrel and $96 per barrel,respectively, accounting for the substantial range ofuncertainty in the world’s future oil markets. In 2030, oildemand in the two alternative price cases ranges from102 million barrels per day in the high price case to 128million barrels per day in the low price case.
World oil trading patterns change substantially over theprojection horizon, as China and the other countries ofnon-OECD Asia fuel their growth in oil demand by tak-ing an increasing share of the world’s oil imports.China’s petroleum imports are expected to grow four-fold from 2003 to 2030, with much of the increase comingfrom Persian Gulf suppliers. In 2003, China imported 0.9million barrels per day of oil from Persian Gulf OPECmembers, and in 2030 its Persian Gulf imports total 5.8million barrels per day. The rising dependence of Chinaon Middle Eastern oil supplies has geopolitical implica-tions both for relations between the two regions and forthe oil-consuming world as a whole.
World Oil DemandWorld oil consumption rose by about 1.2 million barrelsper day in 2005, after an increase of 2.6 million barrelsper day in 2004. The non-OECD countries accounted for1.1 million barrels per day of the 2005 increase, and theOECD as a whole accounted for 0.1 million barrels per
Energy Information Administration / International Energy Outlook 2006 25

day. Unlike in 2004, when China’s oil use increased by0.9 million barrels per day, its demand rose by only 0.4million barrels per day in 2005, despite continued strongeconomic growth. In the United States, a 0.4-percentdecline in oil demand in 2005 resulted from a combina-tion of high prices, hurricane-related disruptions, and amild winter [1]. It was the first decline in U.S. demandsince 2001.
In the IEO2006 reference case, growth in world oildemand averages 1.4 percent per year over the 2003 to2030 period, as the world continues to experience strongeconomic growth. World oil prices in 2025 are 35 percenthigher than projected in IEO2005, and as a result worldoil demand grows more slowly in this year’s referencecase, to 111 million barrels per day in 2025, as comparedwith 119 million barrels per day in the IEO2005 referencecase. In IEO2006, total demand for petroleum liquidsrises to 118 million barrels per day in 2030.
Much of the world’s incremental oil demand is projectedfor use in the transportation sector, where there are fewcompetitive alternatives to petroleum; however, severalof the technologies associated with unconventional liq-uids (gas-to-liquids, coal-to-liquids, and ethanol andbiodiesel produced from energy crops) are expected tomeet a growing share of demand for petroleum liquidsduring the projection period. Of the projected increase inoil use in the reference case over the 2003 to 2030 period,one-half occurs in the transportation sector (Figure 26).The industrial sector accounts for a 39-percent share ofthe projected increase in world oil consumption, mostlyfor chemical and petrochemical processes.
On a regional basis, two parts of the world lead the pro-jected growth in world oil demand: non-OECD Asia andOECD North America (Figure 27). Outside North Amer-ica, oil consumption in the OECD regions grows muchmore slowly (by 0.2 percent and 0.5 percent per year inEurope and Asia, respectively), reflecting expectationsof slow growth or declines in population and slow eco-nomic growth over the next 25 years.
In the non-OECD countries, strong expansion of oil useis fueled by robust economic growth, burgeoning indus-trial activity, and rapidly expanding transportation use.
26 Energy Information Administration / International Energy Outlook 2006
8092 98 104 111
118
2003 2010 2015 2020 2025 20300
50
100
150
200Million Barrels per Day
Residential
Commercial
Industrial
Transportation
Electricity
Figure 26. World Oil Consumption by Sector,2003-2030
Sources: 2003: Derived from Energy Information Adminis-tration (EIA), International Energy Annual 2003 (May-July2005), web site www.eia.doe.gov/iea/. Projections: EIA, Sys-tem for the Analysis of Global Energy Markets (2006).
World Oil Prices in IEO2006
In previous IEOs, the world crude oil price wasdefined on the basis of the average imported refineracquisition cost of crude oil to the United States(IRAC), which represented the weighted average ofall imported crude oil. Historically, the IRAC pricehas tended to be a few dollars less than the widelycited prices of premium crudes (see figure below),such as West Texas Intermediate (WTI) and Brent,which refiners generally prefer for their low viscosityand sulfur content. In the past 2 years, the price differ-ence between premium crudes and IRAC has wid-ened—in particular, the price spread betweenpremium crudes and heavier, high-sulfur crudes. Inan effort to provide a crude oil price that is more con-sistent with those generally reported in the media,IEO2006 uses the average price of imported low-sulfur, light crude oil to U.S. refiners.
1980 1995 2004 2015 20300
20
40
60
802004 Dollars per Barrel
IRAC
ILSLCO
History Projections
World Oil Prices, 1980-2030: Comparison ofIRAC and Average Price of Imported Low-Sulfur,Light Crude Oil (ILSLCO) to U.S. Refiners
Sources: History: Derived from Energy InformationAdministration (EIA), Annual Energy Review 2004, DOE/EIA-0384(2004) (Washington, DC, August 2005). Projec -tions: EIA, Annual Energy Outlook 2006, DOE/EIA-0383(2006) (Washington, DC, February 2006).

The fastest growth in oil demand is projected for theeconomies of non-OECD Asia, averaging 3.0 percent peryear from 2003 to 2030. Fast-paced increases are alsoexpected for the other non-OECD regions, includingannual growth of oil use that averages 1.4 percent innon-OECD Europe and Eurasia, 1.5 percent in the Mid-dle East, 1.8 percent in Central and South America, and2.3 percent in Africa.
Economic development in Asia will be crucial tolong-term growth in oil markets. China, India, and theother nations of non-OECD Asia are expected to experi-ence combined economic growth of 5.5 percent per yearbetween 2003 and 2030, the highest rate of growth in theworld. This robust expansion in gross domestic product(GDP) contributes to a 3.0-percent annual increase inregional oil use.
Oil Reserves and ResourcesHistorically, estimates of world oil reserves have gener-ally trended upward (Figure 28). As of January 1, 2006,proved world oil reserves, as reported by Oil & Gas Jour-nal,3 were estimated at 1,293 billion barrels—15 billionbarrels (about 1 percent) higher than the estimate for2005 [2].
The largest increase in proved oil reserve estimates wasmade in Iran. Iranian oil reserves increased by 5 percent,from 125.8 billion barrels in 2005 to 132.5 billion barrelsin 2006. Higher reserve estimates were also reported bySaudi Arabia, where reserves increased by 4.9 billionbarrels (2 percent) in 2006, and Kuwait, where reservesincreased by 2.5 billion barrels (3 percent). Venezuelaalso showed a substantive increase in reserves, with again of 2.5 billion barrels (3 percent). Chad, a countrythat previously had not been included in the Oil & GasJournal survey, reported 1.5 billion barrels of proved oilreserves in 2006. Declining oil reserves were reported inMexico (down by 1.7 billion barrels), with smaller lossesin Norway (0.8 billion barrels), the United States (0.5 bil-lion barrels), and the United Kingdom (0.5 billion bar-rels), among others.
Of the world’s total proved oil reserves (Figure 29), 71percent is located in the Middle East or Canada (wherethe Canadian Association of Petroleum Producersincludes 174.1 billion barrels of Canadian oil sands as aconventional reserve). Among the top 20 oil reserveholders, 8 are OPEC member countries that togetheraccount for 65 percent of the world’s total reserves(Table 3). It should be noted that there are sources ofpetroleum reserve estimates other than those offered inthe Oil & Gas Journal, including World Energy [3], theOPEC Secretariat [4], and BP’s Statistical Review of WorldEnergy [5].
Table 4 shows estimates of the conventional oil resourcebase by region out to the year 2025. Reserve growth andundiscovered estimates are based on the World Petro-leum Assessment 2000 by the U.S. Geological Survey(USGS). The oil resource base is defined by three catego-ries: remaining reserves (oil that has been discoveredbut not produced); reserve growth (increases in reserves
Energy Information Administration / International Energy Outlook 2006 27
North America
Non-OECD Asia
OECD Europe
OECD Asia
Central and South America
Middle East
Non-OECD Europe and Eurasia
Africa
0 10 20 30 40
Million Barrels per Day
2003
2030
Figure 27. World Oil Consumption by Region andCountry Group, 2003 and 2030
Sources: 2003: Energy Information Administration (EIA),International Energy Annual 2003 (May-July 2005), web sitewww.eia.doe.gov/iea/. 2030: EIA, System for the Analysis ofGlobal Energy Markets (2006).
1980 1985 1990 1995 2000 20060
200
400
600
800
1,000
1,200
1,400Billion Barrels
Other OPEC
Middle East OPEC
Rest of WorldEurasia
World Total
Figure 28. World Crude Oil Reserves, 1980-2006
Note: Reserves include crude oil (including lease conden-sates) and natural gas plant liquids.
Sources: 1980-1993: “Worldwide Oil and Gas at a Glance,”International Petroleum Encyclopedia (Tulsa, OK: PennWellPublishing, various issues). 1994-2006: Oil & Gas Journal(various issues).
3Proved reserves, as reported by the Oil & Gas Journal, are estimated quantities that can be recovered under present technology andprices. Oil reserves reported by the Oil & Gas Journal are compiled from voluntary survey responses and do not always reflect the mostrecent changes. Changes made to individual countries’ reserves during 2005 are not likely to be reflected in the reserves reported here.

resulting mainly from technological factors that enhancea field’s recovery rate); and undiscovered (oil thatremains to be found through exploration). The reservegrowth and undiscovered volumes in Table 4 arederived from the USGS mean estimate, which is an aver-age assessment over a wide range of uncertainty forreserve growth and undiscovered resources. The USGSprovides three point estimates of undiscovered andinferred resources: the mean, a 5-percent lower bound,and a 95-percent upper bound with no price relation-ship. The IEO2006 projections for oil production arebased on the USGS mean estimate, which is derivedfrom historical data on growth in oil and gas reserves forfields of similar size, without consideration of economicor political events [6].
The Composition of World OilSupplyAn iterative approach was used to determine the com-position of world oil supply in each of the three IEO2006oil price cases. For example, to develop the referencecase an initial world oil price path was assumed for the2010 to 2030 period. Future total world oil demand wasthen estimated on the basis of that price path andassumptions about future economic growth. Theassumed price path was also used to estimate futurenon-OPEC production of conventional oil and produc-tion of unconventional liquids from both OPEC andnon-OPEC countries, based on estimates of the totalpetroleum resource base. Finally, the level of OPEC con-ventional production that would be needed to balanceworld oil markets for the assumed reference case pricepath was calculated by subtracting non-OPEC conven-tional supplies and total unconventional supplies from
total world oil demand. The likelihood that OPEC pro-ducers would supply this residual demand at theassumed price path was then evaluated, based on esti-mates of total OPEC oil resources and the apparent pre-ferred production levels of key OPEC members.
If the OPEC production level required to balance theglobal market appeared too high, the assumed oil pricepath was adjusted upward, and a new iteration ofdemand and supply estimates was derived. Conversely,if the required OPEC production level appeared too low,the oil price path was adjusted downward for thenext iteration. The reference case oil price path andassociated composition of world oil supply represent atrajectory consistent with the IEO2006 reference caseassumptions about economic growth, supply anddemand elasticities, the ultimate size of global oilresources, and preferred production levels for OPECmembers.
Once the reference case oil price path and compositionof world oil supply were determined, the same iterativeapproach was used to develop high and low world oilprice cases. In the high world oil price case, worldwidecrude oil resources were assumed to be 15 percent
28 Energy Information Administration / International Energy Outlook 2006
Table 3. World Oil Reserves by Country as ofJanuary 1, 2006(Billion Barrels)
Country Oil ReservesSaudi Arabia . . . . . . . . . . . 264.3Canada . . . . . . . . . . . . . . . 178.8Iran. . . . . . . . . . . . . . . . . . . 132.5Iraq. . . . . . . . . . . . . . . . . . . 115.0Kuwait . . . . . . . . . . . . . . . . 101.5UAE . . . . . . . . . . . . . . . . . . 97.8Venezuela . . . . . . . . . . . . . 79.7Russia . . . . . . . . . . . . . . . . 60.0Libya . . . . . . . . . . . . . . . . . 39.1Nigeria . . . . . . . . . . . . . . . . 35.9United States . . . . . . . . . . . 21.4China . . . . . . . . . . . . . . . . . 18.3Qatar . . . . . . . . . . . . . . . . . 15.2Mexico . . . . . . . . . . . . . . . . 12.9Algeria . . . . . . . . . . . . . . . . 11.4Brazil . . . . . . . . . . . . . . . . . 11.2Kazakhstan . . . . . . . . . . . . 9.0Norway. . . . . . . . . . . . . . . . 7.7Azerbaijan . . . . . . . . . . . . . 7.0India . . . . . . . . . . . . . . . . . . 5.8Rest of World . . . . . . . . . . . 68.1
World Total . . . . . . . . . . . . 1,292.5
Source: “Worldwide Look at Reserves and Production,” Oil &Gas Journal, Vol. 103, No. 47 (December 19, 2005), pp. 24-25.
743
213
103
103
79
36
15
Middle East
North America
Central and South America
Africa
Eurasia
Asia
Europe
0 200 400 600 800
Billion Barrels
World Total:1,293 Billion Barrels
Figure 29. World Proved Oil Reservesby Geographic Region as ofJanuary 1, 2006
Source: “Worldwide Look at Reserves and Production,” Oil &Gas Journal, Vol. 103, No. 47 (December 19, 2005), pp. 24-25.

smaller, and thus more expensive to produce, than in thereference case, and the preferred production levels ofOPEC producers were reduced. In the low price case, theworldwide petroleum resource was assumed to be 15percent larger and therefore cheaper to produce than inthe reference case, and OPEC preferred production lev-els were increased.
It is important to note what this approach did and didnot assume. A business-as-usual oil market environ-ment was assumed. Disruptions in oil supply for anyreason (war, terror, weather, geopolitics) were notassumed. It was assumed that all non-OPEC oil projectsthat show a favorable rate of return on investmentwould be funded. For the period out to 2030, there is suf-ficient oil to meet worldwide demand. Peaking of worldoil production is not anticipated until after 2030.
In the IEO2006 reference case, world oil supply in 2030exceeds the 2003 level by 38 million barrels per day.Increases in production are expected for both OPEC andnon-OPEC producers; however, only 38 percent of thetotal increase is expected to come from OPEC areas. In2030, OPEC is expected to produce 45.3 million barrelsper day and non-OPEC producers 72.6 million barrelsper day in the IEO2006 reference case. Over the pasttwo decades, the growth in non-OPEC oil supply has
resulted in an OPEC market share substantially underits high of 52 percent in 1973. In 2003, OPEC produced 39percent of the world’s oil supplies. High oil prices, newexploration and production technologies, aggressivecost-reduction programs by industry, and the emer-gence of unconventional resources contribute to the out-look for continued growth in non-OPEC oil production.
The reference case projects that about 62 percent of theincrease in petroleum demand over the next 25 yearswill be met by increased production from non-OPECsuppliers. Non-OPEC production in 2030 is projected tobe almost 24 million barrels per day higher than it was in2003 (Figure 30). The IEO2006 estimates of OPEC pro-duction capacity in 2010 are slightly less than those pro-jected in IEO2005, reflecting a shift toward non-OPECsupply projects as a result of the higher prices assumedin IEO2006. The high world oil price case assumes thatOPEC members might pursue significant price escala-tion through conservative capacity expansion decisionsrather than undertake major production expansion pro-grams. Such behavior would tend to raise world oilprices, and in this scenario OPEC suppliers increasetheir production capacity by only 4 million barrels perday between 2003 and 2030, in contrast to the referencecase, where OPEC increases production capacity by 18million barrels per day.
Energy Information Administration / International Energy Outlook 2006 29
Table 4. Estimated World Oil Resources, 1995-2025 a
(Billion Barrels)
Region Proved Reserves Reserve Growth Undiscovered Total
OECDUnited States . . . . . . . . . . . . . . . . . . 21.4 76.0 83.0 180.4Canada . . . . . . . . . . . . . . . . . . . . . . 178.8 12.5 32.6 223.9Mexico . . . . . . . . . . . . . . . . . . . . . . . 12.9 25.6 45.8 84.3OECD Europe . . . . . . . . . . . . . . . . . 15.1 20.0 35.9 71.0Japan . . . . . . . . . . . . . . . . . . . . . . . . 0.1 0.1 0.3 0.5Australia/New Zealand. . . . . . . . . . . 1.5 2.7 5.9 10.1
Non-OECDRussia . . . . . . . . . . . . . . . . . . . . . . . 60.0 106.2 115.3 281.5Other Non-OECD Europe/Eurasia. . 19.1 32.3 55.6 107.0China . . . . . . . . . . . . . . . . . . . . . . . . 18.3 19.6 14.6 52.5India . . . . . . . . . . . . . . . . . . . . . . . . . 5.8 3.8 6.8 16.4Other Non-OECD Asia. . . . . . . . . . . 10.3 14.6 23.9 48.8Middle East . . . . . . . . . . . . . . . . . . . 743.4 252.5 269.2 1,265.1Africa . . . . . . . . . . . . . . . . . . . . . . . . 102.6 73.5 124.7 300.8Central and South America . . . . . . . 103.4 90.8 125.3 319.5
Total World . . . . . . . . . . . . . . . . . . . . 1,292.5 730.2 938.9 2,961.6
OPEC. . . . . . . . . . . . . . . . . . . . . . . . . 901.7 395.6 400.5 1,697.8Non-OPEC. . . . . . . . . . . . . . . . . . . . . 390.9 334.6 538.4 1,263.9
aThe U.S. Geological Survey’s assessment extends only to 2025.Note: Reserves include crude oil (including lease condensates) and natural gas plant liquids.Sources: Proved Reserves as of January 1, 2006: Oil & Gas Journal, Vol. 103, No. 47 (December 19, 2005), pp. 24-25. Reserve
Growth (Total) and Undiscovered: U.S. Geological Survey, World Petroleum Assessment 2000, web site http://pubs.usgs.gov/dds/dds-060/. Estimates of Regional Reserve Growth: Energy Information Administration, Office of Integrated Analysis and Fore-casting.

Expansion of OPEC Production Capacity
It is generally acknowledged that OPEC members withlarge reserves and relatively low costs for expandingproduction capacity can accommodate sizable increasesin petroleum demand. In the IEO2006 reference case, theproduction call on OPEC suppliers grows at an annualrate of 1.5 percent through 2030 (Figure 31 and Table 5).OPEC capacity utilization ranges between 90 and 93 per-cent for the duration of the projection period.
Amidst enormous uncertainty, Iraq’s role in OPEC inthe next several years will be of particular interest. In1999, Iraq expanded its production capacity to 2.8 mil-lion barrels per day in order to reach the slightly morethan $5.2 billion in oil exports allowed by UnitedNations Security Council resolutions. In the IEO2006 ref-erence case, Iraq is assumed to maintain its current oilproduction capacity of about 2.5 million barrels per dayinto 2006 [7]. Iraq has indicated a desire to expand itsproduction capacity aggressively, to more than 6 millionbarrels per day, once the security and political situationin the country has stabilized. Preliminary discussions ofexploration projects have already been held with a num-ber of potential outside investors. Such a significantincrease in Iraqi oil exports would ease market tightness.Iraq’s oil production reaches 5.5 million barrels per dayin 2030 in the reference case.
In the IEO2006 reference case, OPEC members outsidethe Persian Gulf increase their production capacity mod-erately, in part because of their higher capacity expan-sion costs. There is some optimism regarding Nigeria’soffshore production potential, although it is unlikely tobe developed until the later part of this decade. Exceptfor modest near-term increments to supply, Algeria andLibya are expected to experience flat productionthroughout the projections; Indonesia’s productioncapacity is expected to decline over the projectionperiod. Venezuela is expected to see some increases inproduction, especially toward the end of the projectionperiod. The lackluster increases in OPEC supply outsidethe Persian Gulf suggest that the organization’s supplywill rely even more on Persian Gulf members, whosecurrent 71-percent share of total OPEC supply increasesto nearly 73 percent in 2030. Tables E1-E6 in Appendix E
30 Energy Information Administration / International Energy Outlook 2006
Table 5. OPEC Oil Production, 1990-2030(Million Barrels per Day)
YearReference
CaseHigh
Oil PriceLow
Oil PriceHistory
1990 . . . . . . . . . . . 24.5 — —2003 . . . . . . . . . . . 30.7 — —
Projections2010 . . . . . . . . . . . 37.3 32.9 37.92015 . . . . . . . . . . . 39.7 28.7 41.02020 . . . . . . . . . . . 40.4 29.3 43.32025 . . . . . . . . . . . 42.5 29.8 46.92030 . . . . . . . . . . . 45.3 30.9 51.0
Note: Includes the production of crude oil, natural gas plantliquids, refinery gain, and other liquid fuels.
Sources: 1990 and 2003: Energy Information Administra-tion (EIA), Energy Markets and Contingency Information Divi-sion. 2010-2030: EIA, System for the Analysis of GlobalEnergy Markets (2006).
1990 2003 2010 2015 2020 2025 20300
25
50
75Million Barrels per Day
OPEC Non-OPEC
Figure 30. OPEC and Non-OPEC Total PetroleumLiquids Production, 1990, 2003, and2010-2030
Sources: 1990 and 2003: Energy Information Administration(EIA), Energy Markets and Contingency Information Division.2010-2030: EIA, System for the Analysis of Global EnergyMarkets (2006).
1990 2003 2010 2015 2020 2025 20300
25
50
75Million Barrels per Day
OPEC (Conventional)
Non-OPEC (Conventional)
Unconventional
Figure 31. OPEC, Non-OPEC, and UnconventionalOil Production, 1990, 2003, and2010-2030
Sources: 1990 and 2003: Energy Information Administration(EIA), Energy Markets and Contingency Information Division.2010-2030: EIA, System for the Analysis of Global EnergyMarkets (2006).
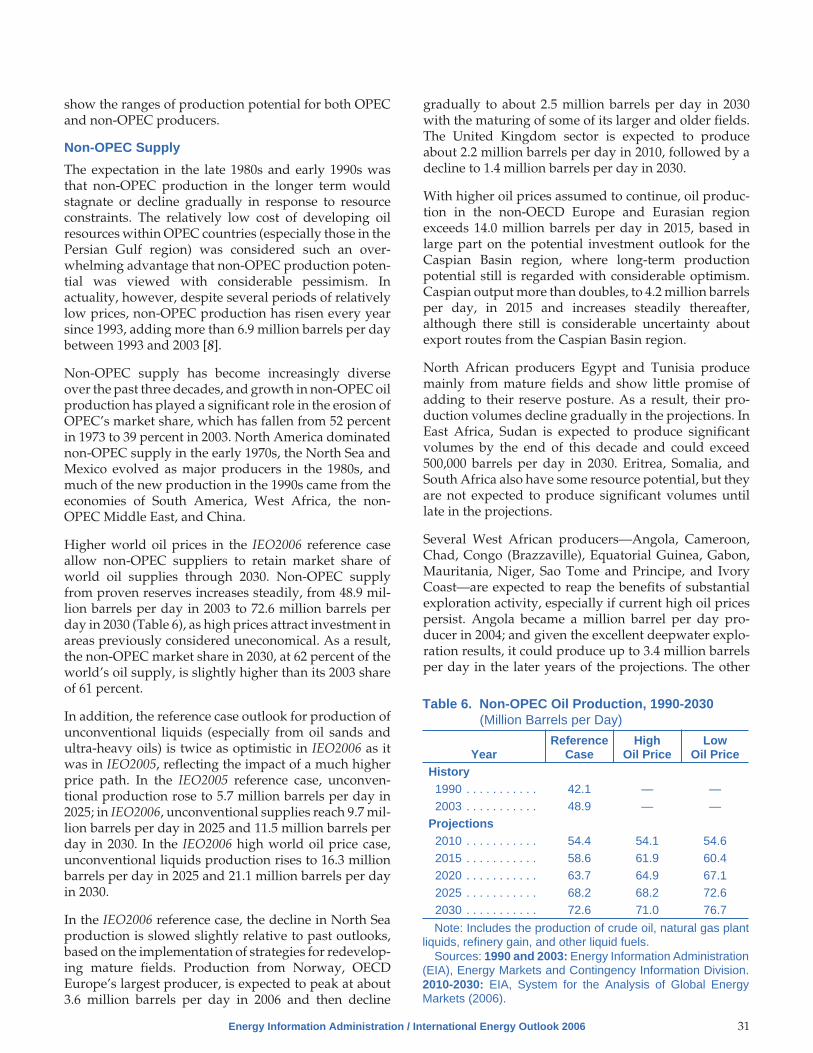
show the ranges of production potential for both OPECand non-OPEC producers.
Non-OPEC Supply
The expectation in the late 1980s and early 1990s wasthat non-OPEC production in the longer term wouldstagnate or decline gradually in response to resourceconstraints. The relatively low cost of developing oilresources within OPEC countries (especially those in thePersian Gulf region) was considered such an over-whelming advantage that non-OPEC production poten-tial was viewed with considerable pessimism. Inactuality, however, despite several periods of relativelylow prices, non-OPEC production has risen every yearsince 1993, adding more than 6.9 million barrels per daybetween 1993 and 2003 [8].
Non-OPEC supply has become increasingly diverseover the past three decades, and growth in non-OPEC oilproduction has played a significant role in the erosion ofOPEC’s market share, which has fallen from 52 percentin 1973 to 39 percent in 2003. North America dominatednon-OPEC supply in the early 1970s, the North Sea andMexico evolved as major producers in the 1980s, andmuch of the new production in the 1990s came from theeconomies of South America, West Africa, the non-OPEC Middle East, and China.
Higher world oil prices in the IEO2006 reference caseallow non-OPEC suppliers to retain market share ofworld oil supplies through 2030. Non-OPEC supplyfrom proven reserves increases steadily, from 48.9 mil-lion barrels per day in 2003 to 72.6 million barrels perday in 2030 (Table 6), as high prices attract investment inareas previously considered uneconomical. As a result,the non-OPEC market share in 2030, at 62 percent of theworld’s oil supply, is slightly higher than its 2003 shareof 61 percent.
In addition, the reference case outlook for production ofunconventional liquids (especially from oil sands andultra-heavy oils) is twice as optimistic in IEO2006 as itwas in IEO2005, reflecting the impact of a much higherprice path. In the IEO2005 reference case, unconven-tional production rose to 5.7 million barrels per day in2025; in IEO2006, unconventional supplies reach 9.7 mil-lion barrels per day in 2025 and 11.5 million barrels perday in 2030. In the IEO2006 high world oil price case,unconventional liquids production rises to 16.3 millionbarrels per day in 2025 and 21.1 million barrels per dayin 2030.
In the IEO2006 reference case, the decline in North Seaproduction is slowed slightly relative to past outlooks,based on the implementation of strategies for redevelop-ing mature fields. Production from Norway, OECDEurope’s largest producer, is expected to peak at about3.6 million barrels per day in 2006 and then decline
gradually to about 2.5 million barrels per day in 2030with the maturing of some of its larger and older fields.The United Kingdom sector is expected to produceabout 2.2 million barrels per day in 2010, followed by adecline to 1.4 million barrels per day in 2030.
With higher oil prices assumed to continue, oil produc-tion in the non-OECD Europe and Eurasian regionexceeds 14.0 million barrels per day in 2015, based inlarge part on the potential investment outlook for theCaspian Basin region, where long-term productionpotential still is regarded with considerable optimism.Caspian output more than doubles, to 4.2 million barrelsper day, in 2015 and increases steadily thereafter,although there still is considerable uncertainty aboutexport routes from the Caspian Basin region.
North African producers Egypt and Tunisia producemainly from mature fields and show little promise ofadding to their reserve posture. As a result, their pro-duction volumes decline gradually in the projections. InEast Africa, Sudan is expected to produce significantvolumes by the end of this decade and could exceed500,000 barrels per day in 2030. Eritrea, Somalia, andSouth Africa also have some resource potential, but theyare not expected to produce significant volumes untillate in the projections.
Several West African producers—Angola, Cameroon,Chad, Congo (Brazzaville), Equatorial Guinea, Gabon,Mauritania, Niger, Sao Tome and Principe, and IvoryCoast—are expected to reap the benefits of substantialexploration activity, especially if current high oil pricespersist. Angola became a million barrel per day pro-ducer in 2004; and given the excellent deepwater explo-ration results, it could produce up to 3.4 million barrelsper day in the later years of the projections. The other
Energy Information Administration / International Energy Outlook 2006 31
Table 6. Non-OPEC Oil Production, 1990-2030(Million Barrels per Day)
YearReference
CaseHigh
Oil PriceLow
Oil PriceHistory
1990 . . . . . . . . . . . 42.1 — —2003 . . . . . . . . . . . 48.9 — —
Projections2010 . . . . . . . . . . . 54.4 54.1 54.62015 . . . . . . . . . . . 58.6 61.9 60.42020 . . . . . . . . . . . 63.7 64.9 67.12025 . . . . . . . . . . . 68.2 68.2 72.62030 . . . . . . . . . . . 72.6 71.0 76.7
Note: Includes the production of crude oil, natural gas plantliquids, refinery gain, and other liquid fuels.
Sources: 1990 and 2003: Energy Information Administration(EIA), Energy Markets and Contingency Information Division.2010-2030: EIA, System for the Analysis of Global EnergyMarkets (2006).

West African producers with offshore tracts are expect-ed to increase output by up to 1.1 million barrels per dayby the end of the projection period.
Oil producers in the Pacific Rim are expected to increasetheir production volumes as a result of enhanced explo-ration and extraction technologies. India’s deepwaterprospects are expected to show some encouraging pro-duction increases in this decade, with the potential forsignificant increases near the end of the projectionperiod. Vietnam’s long-term production potential still isviewed with considerable optimism, although explora-tion activity has been slower than originally hoped. Out-put from Vietnamese fields is projected to exceed375,000 barrels per day in 2015. In China, conventionaloil production declines slightly, to about 3.2 million bar-rels per day in 2030.
Australia has continued to make additions to its provedreserves, and its oil production is expected to reach900,000 barrels per day by the end of this decade. Malay-sia shows little potential for any significant new finds,and its output is expected to peak at around 750,000 bar-rels per day in this decade and then decline gradually toless than 700,000 barrels per day in 2030. Papua NewGuinea continues to add to its reserve posture and isexpected to achieve production volumes approaching110,000 barrels per day by the end of this decade, fol-lowed by only a modest decline over the remainder ofthe projection period. Exploration and test-well activityhave pointed to some production potential for Bangla-desh and Myanmar (formerly, Burma), but significantoutput is not expected until after 2010.
In North America, moderately declining U.S. output isexpected to be supplemented by significant productionincreases in Canada and Mexico. Canada’s conventionaloil output contracts steadily in the reference case, byabout 1.0 million barrels per day over the next 25 years,but an additional 2.8 million barrels per day of uncon-ventional output from oil sands projects is added. TheIEO2006 reference case assumes in the sustained higherworld oil price environment, Mexico’s state oil com-pany, Pemex will successfully lobby to use a larger por-tion of its profits to fund exploration and productioninvestments and thereby increase production in thelong-term. Production in Mexico exceeds 4.0 million bar-rels per day by the end of the decade and continuesincreasing to 5.0 million barrels per day by 2030, despitethe anticipated decline in production of Mexico’s largestoil field at Cantarell [9].
Oil producers in South America have significant poten-tial for increasing output over the next decade. Brazilbecame a million barrel per day producer of crude oilin 1999, with considerable production potential waitingto be tapped. Brazil’s production rises throughout theprojection period, topping 3.9 million barrels per day of
conventional supply and 0.6 million barrels per day ofunconventional supply in 2030. Colombia’s current eco-nomic downturn and civil unrest have delayed develop-ment of its oil production infrastructure, but its output isexpected to exceed 610,000 barrels per day within thedecade, with continued modest increases over theremainder of the projection period. In both Brazil andColombia, the oil sector would benefit significantly fromthe creation of favorable climates for foreign investment.Argentina is expected to increase its production vol-umes by at least 65,000 barrels per day over the next 3years, and by the end of the decade it could possiblybecome a million barrel per day producer. Although thecurrent political situation in Ecuador is in transition,there is still optimism that Ecuador will double produc-tion volumes over the projection period.
World Oil PricesThe world oil price in IEO2006 is defined as the annualaverage price of imported low-sulfur, light crude oil toU.S. refiners (see box on page 26). In the low world oilprice, reference, and high world oil price cases, averageworld oil prices in 2030 are $34, $57, and $96 per barrel,respectively (Figure 32). (All prices are in real 2004 dol-lars—i.e., inflation-adjusted dollars—unless otherwisenoted.)
The IEO2006 oil price paths reflect a reassessment of thewillingness of oil-rich countries to expand productioncapacity as aggressively as envisioned last year. It doesnot represent a change in the assessment of the ultimatesize of the world’s petroleum resources but rather alower level of investment in oil development in key
32 Energy Information Administration / International Energy Outlook 2006
1980 1995 2004 2015 20300
20
40
60
80
100
2004 Dollars per Barrel
High Oil Price
Low Oil Price
Reference
History Projections
Figure 32. World Oil Prices in Three Cases,1980-2030
Sources: History: Energy Information Administration (EIA),Annual Energy Review 2004, DOE/EIA-0384(2004) (Washing-ton, DC, August 2005), web site www.eia.doe.gov/emeu/ aer/.Projections: EIA, Annual Energy Outlook 2006, DOE/EIA-0383(2006) (Washington, DC, February 2006).

resource-rich regions than was projected in IEO2005[10]. Resources are not expected to be a key constraint onworld demand to 2030. Rather more important are thepolitical, economic, and environmental circumstancesthat could shape developments in oil supply anddemand.
The IEO2006 high and low oil price cases are based ondifferent assumptions about world oil supply. The refer-ence case uses the USGS mean oil and natural gasresource estimate.4 The high price case assumes that theworldwide crude oil resource is 15 percent smaller andis more costly to produce than assumed in the referencecase. The low price case assumes that the worldwideresource is 15 percent more plentiful and is cheaper toproduce than assumed in the reference case. Thus, themajor price differences across the three cases reflectuncertainty with regard to both the supply of resources(primarily undiscovered and inferred) and the cost ofproducing them [11].
Although oil prices rose by more than $9 per barrel overthe course of 2004 and an additional $15 per barrel in2005, these developments are not indicative of thelong-term trend in the IEO2006 reference case. Fromrecord nominal high levels throughout 2006, oil prices inthe reference case decline gradually to $47 per barrel in2014, then rise by about 1.2 percent per year to $57 perbarrel in 2030. In all the IEO2006 oil price cases, oildemand rises significantly over the projection period. Inthe high and low price cases, the increases in oil con-sumption from 2003 to 2030 are 22 million barrels perday and 48 million barrels per day, respectively.
Oil prices have been highly volatile over the past 25years, and periods of price volatility can be expected inthe future principally because of unforeseen politicaland economic circumstances. It is widely recognizedthat tensions in the Middle East, for example, could giverise to serious disruptions of normal oil production andtrading patterns. On the other hand, market forces canplay a significant role in restoring balance over anextended period. High real prices deter consumptionand encourage the emergence of significant competitionfrom large marginal sources of oil, which currently areuneconomical to produce, and other energy supplies.Persistently low prices have the opposite effects.
Limits to long-term oil price escalation include substitu-tion of other fuels (such as natural gas) for oil, marginalsources of conventional oil that become reserves (i.e.,economically viable) when prices rise, and unconven-tional sources of oil that become reserves at still higherprices. Advances in exploration and production technol-ogies are likely to bring prices down when such addi-tional oil resources become part of the reserve base.
Worldwide Petroleum TradeBecause oil is fungible and traded in world commoditiesmarkets, there is much uncertainty associated with pro-jections of future patterns of oil trade; however, antici-pated changes in the world’s oil trading patterns—particularly, the shifting regional dependence of import-ing regions on producing regions—may have importantgeopolitical ramifications. In 2003, the OECD economiesimported 17.9 million barrels of oil per day from OPECproducers. Of that total, 11.3 million barrels per daycame from the Persian Gulf region. Oil movements toOECD economies represented 57 percent of the totalpetroleum exported by OPEC member nations and 50percent of all Persian Gulf exports (Table 7). By the endof the projection period, OPEC exports to OECD econo-mies in the reference case are estimated to be about 3.2million barrels per day higher than their 2003 level, andalmost 42 percent of the increase is expected to comefrom the Persian Gulf region.
Despite such a substantial increase, the share of totalpetroleum exports that goes to OECD member nationsin 2030 is more than 9 percentage points below their 2003share in the reference case, and their share of PersianGulf exports falls by more than 13 percent. The signifi-cant shift expected in the balance of OPEC export sharesbetween the OECD and non-OECD economies is a directresult of the economic growth anticipated for thenon-OECD nations, especially non-OECD Asia. OPECpetroleum exports to non-OECD economies increase by13.6 million barrels per day over the projection period,with more than 85 percent of the increase going to thenon-OECD economies of Asia. China, alone, is likely toimport about 8.4 million barrels per day from OPEC in2030, 69 percent of which is expected to come from Per-sian Gulf producers.
North America’s petroleum imports from the PersianGulf in the reference case increase by more than 40 per-cent from 2003 to 2030 (Figure 33). At the same time,more than 40 percent of North America’s total imports in2030 is expected to come from Atlantic Basin producersand refiners, with significant increases anticipated incrude oil imports from Latin American producers,including Venezuela, Brazil, Colombia, and Mexico.West African producers, including Nigeria and Angola,are also expected to increase their export volumes toNorth America. Caribbean Basin refiners are expected toaccount for most of the increase in North America’simports of refined products.
With a moderate decline in North Sea production,OECD Europe is expected to import increasing amountsfrom Persian Gulf producers and from OPEC membernations in western Africa. Substantial imports from the
Energy Information Administration / International Energy Outlook 2006 33
4The USGS provides three point estimates of undiscovered and inferred resources: the mean, a 5-percent lower bound, and a 95-percentupper bound with no price relationship.

Caspian Basin are also expected. OECD Asian nationsare expected to increase their already heavy dependenceon OPEC oil. The non-OECD economies of Asia areexpected to more than double their total petroleumimports between 2003 and 2030.
References
34 Energy Information Administration / International Energy Outlook 2006
Table 7. Worldwide Petroleum Trade in the Reference Case, 2003 and 2030(Million Barrels per Day)
Exporting Region
Importing Region
TotalExports
OECD Non-OECD
NorthAmerica Europe Asia Total China
OtherAsia
Rest ofWorld Total
2003OPEC
Persian Gulf. . . . . . . . . . . . . . 2.5 2.7 6.1 11.3 0.9 4.4 5.9 11.2 22.5North Africa . . . . . . . . . . . . . . 0.6 1.9 0.0 2.6 0.1 0.0 0.3 0.4 3.0West Africa . . . . . . . . . . . . . . 1.1 0.3 0.2 1.6 0.2 0.0 0.2 0.4 1.9South America. . . . . . . . . . . . 1.7 0.1 0.2 2.0 0.1 0.0 1.0 1.1 3.1Asia . . . . . . . . . . . . . . . . . . . . 0.0 0.0 0.4 0.5 0.3 0.4 0.0 0.8 1.2
Total OPEC . . . . . . . . . . . . . 5.9 5.1 6.9 17.9 1.6 4.8 7.4 13.8 31.7Non-OPEC
OECD Europe . . . . . . . . . . . . 0.5 0.0 0.0 0.5 0.0 0.0 0.1 0.1 0.7Brazil and Caribbean Basin. . 0.7 0.3 0.0 1.0 0.1 0.0 0.1 0.1 1.2Russia and Caspian Area . . . 0.4 2.9 0.2 3.5 0.4 1.2 0.8 2.4 5.8Other Non-OPEC . . . . . . . . . 5.9 2.5 1.0 9.4 0.7 1.1 2.2 4.0 13.4
Total Non-OPEC . . . . . . . . 7.5 5.7 1.2 14.5 1.2 2.3 3.1 6.7 21.1
Total Petroleum Imports . . . . 13.5 10.8 8.1 32.4 2.8 7.1 10.6 20.4 52.8
2030OPEC
Persian Gulf. . . . . . . . . . . . . . 3.5 3.3 5.8 12.6 5.8 8.4 7.4 21.6 34.3North Africa . . . . . . . . . . . . . . 0.6 1.9 0.2 2.6 0.4 0.5 0.6 1.5 4.1West Africa . . . . . . . . . . . . . . 1.1 0.7 0.4 2.2 1.2 0.2 0.4 1.8 4.0South America. . . . . . . . . . . . 2.3 0.3 0.5 3.0 0.4 0.3 0.6 1.4 4.4Asia . . . . . . . . . . . . . . . . . . . . 0.1 0.1 0.5 0.7 0.5 0.1 0.3 1.0 1.7
Total OPEC . . . . . . . . . . . . . 7.5 6.3 7.3 21.1 8.4 9.5 9.4 27.4 48.5Non-OPEC
OECD Europe . . . . . . . . . . . . 1.3 0.0 0.1 1.4 0.1 0.1 0.1 0.3 1.7Brazil and Caribbean Basin. . 1.6 0.9 0.4 2.9 0.2 0.3 1.0 1.5 4.4Russia and Caspian Area . . . 0.5 2.4 0.8 3.6 0.4 0.9 1.7 2.9 6.6Other Non-OPEC . . . . . . . . . 8.5 1.9 0.6 10.9 1.9 0.6 2.7 5.1 16.1
Total Non-OPEC . . . . . . . . 11.9 5.2 1.9 18.9 2.5 1.9 5.5 9.9 28.8
Total Petroleum Imports . . . . 19.4 11.5 9.2 40.1 10.9 11.4 15.0 37.3 77.3
Notes: Trade includes both crude oils and refined products. Totals may not equal sum of components due to independent round-ing.
Sources: 2003: Energy Information Administration (EIA), Energy Markets and Contingency Information Division. 2030: EIA, Officeof Integrated Analysis and Forecasting, IEO2006 WORLD Model run IEO2006.B30 (2006).
1. Energy Information Administration, Short-TermEnergy Outlook, April 2006 on-line version, web sitewww.eia.doe.gov/emeu/steo/pub/.
2. “Worldwide Look at Reserves and Production,” Oil& Gas Journal, Vol. 103, No. 47 (December 19, 2005),pp. 24-25.
3. World Oil, Vol. 226, No. 9 (September 2005).4. Organization of Petroleum Exporting Countries,
Annual Statistical Bulletin 2004, Table 10, “WorldProven Crude Oil Reserves by Region, 1969-2004”(Vienna, Austria, 2005), p. 18.
5. BP, Statistical Review of World Energy (London, UK,June 2005), p. 4.

Energy Information Administration / International Energy Outlook 2006 35
2003 2030 2003 20300
5
10
15
20
25Million Barrels per Day
OECD Non-OECD
North America
Other
Asia
Other
Figure 33. Imports of Persian Gulf Oil by ImportingRegion, 2003 and 2030
Sources: 2003: Energy Information Administration (EIA),International Energy Annual 2003 (May-July 2005), web sitewww.eia.doe.gov/iea/. 2030: EIA, System for the Analysis ofGlobal Energy Markets (2006).
6. J.W. Schmoker and T.R. Klett, “Chapter RG: Esti-mating Potential Reserve Growth of Known (Dis-covered) Fields: A Component of the USGS WorldPetroleum Assessment 2000,” in U.S. Geological Sur-vey Digital Data Series 60, web site http://energy.cr.usgs.gov/WEcont/chaps/RG.pdf.
7. International Energy Agency, Oil Market Report(Paris, France, May 2006), p. 14, web site http://omrpublic.iea.org/.
8. Energy Information Administration (EIA), Interna-tional Energy Annual 2003 (May-July 2005), web sitewww.eia.doe.gov/iea/.
9. T. Murray, “Pemex To Fund Increased Share ofCapital Spending from Operating Cashflow,” TheOil Daily, Vol. 56, No. 100 (May 25, 2006), p. 4.
10. Energy Information Administration, Annual EnergyOutlook 2006, DOE/EIA-0383(2006) (Washington,DC, February 2006), p. 33.
11. Energy Information Administration, Annual EnergyOutlook 2006, DOE/EIA-0383(2006) (Washington,DC, February 2006), p. 33.


Chapter 4
Natural GasNatural gas trails coal as the fastest growing primary energy source in IEO2006.The natural gas share of total world energy consumption increasesfrom 24 percent in 2003 to 26 percent in 2030.
Consumption of natural gas worldwide increases from95 trillion cubic feet in 2003 to 182 trillion cubic feet in2030 in the IEO2006 reference case (Figure 34). Althoughnatural gas is expected to be an important fuel source inthe electric power and industrial sectors, the annualgrowth rate for natural gas consumption in the projec-tions is slightly lower than the growth rate for coal con-sumption—in contrast to past editions of the IEO.Higher world oil prices in IEO2006 increase the demandfor and price of natural gas, making coal a more econom-ical fuel source in the projections.
Natural gas consumption worldwide increases at anaverage rate of 2.4 percent annually from 2003 to 2030, ascompared with 2.5 percent per year for coal and 1.4 per-cent per year for oil. Nevertheless, natural gas remains amore environmentally attractive energy source andburns more efficiently than coal, and it still is expected tobe the fuel of choice in many regions of the world. As aresult, the natural gas share of total world energy con-sumption (on a Btu basis) grows from 24 percent in 2003to 26 percent in 2030.
Worldwide, the industrial and electric power sectors arethe largest consumers of natural gas (Figure 35). In 2003,
the industrial sector accounted for 44 percent and theelectric power sector 31 percent of the world’s total natu-ral gas consumption. In the projections, natural gas usegrows by 2.8 percent per year in the industrial sector and2.9 percent per year in the electric power sector from2003 to 2030. In both sectors, the share of total energydemand met by natural gas grows over the projectionperiod. In the industrial sector, natural gas overtakes oilas the dominant fuel by 2030. In the electric power sec-tor, however, despite its rapid growth, natural gasremains a distant second to coal in terms of share of totalenergy use for electricity generation.
In 2003, OECD member countries accounted for justover one-half of the world’s total natural gas use, non-OECD Europe and Eurasia accounted for one-quarter,and the other non-OECD countries accounted for theremainder. The OECD countries are, by and large,mature consumers of natural gas with well-establishedinfrastructure and consuming patterns. In contrast, nat-ural gas infrastructure in the non-OECD countries, out-side of non-OECD Europe and Eurasia, is largely in itsinfancy, and natural gas demand is fairly small. TheIEO2006 reference case projects fast-paced growth in
Energy Information Administration / International Energy Outlook 2006 37
73 7988
95
116
134150
165182
1990 1995 2000 2003 2010 2015 2020 2025 20300
50
100
150
200Trillion Cubic Feet
OECD
Non-OECD Europeand Eurasia
Other Non-OECD
History Projections
Figure 34. World Natural Gas Consumptionby Region, 1990-2030
Sources: History: Energy Information Administration (EIA),International Energy Annual 2003 (May-July 2005), web sitewww.eia.doe.gov/iea/. Projections: EIA, System for the Anal-ysis of Global Energy Markets (2006).
2003 2010 2015 2020 2025 20300
20
40
60
80
100Trillion Cubic Feet
Industrial Electric Power Other
Figure 35. World Natural Gas Consumptionby End-Use Sector, 2003-2030
Sources: 2003: Derived from Energy Information Adminis-tration (EIA), International Energy Annual 2003 (May-July2005), web site www.eia.doe.gov/iea/. Projections: EIA, Sys-tem for the Analysis of Global Energy Markets (2006).
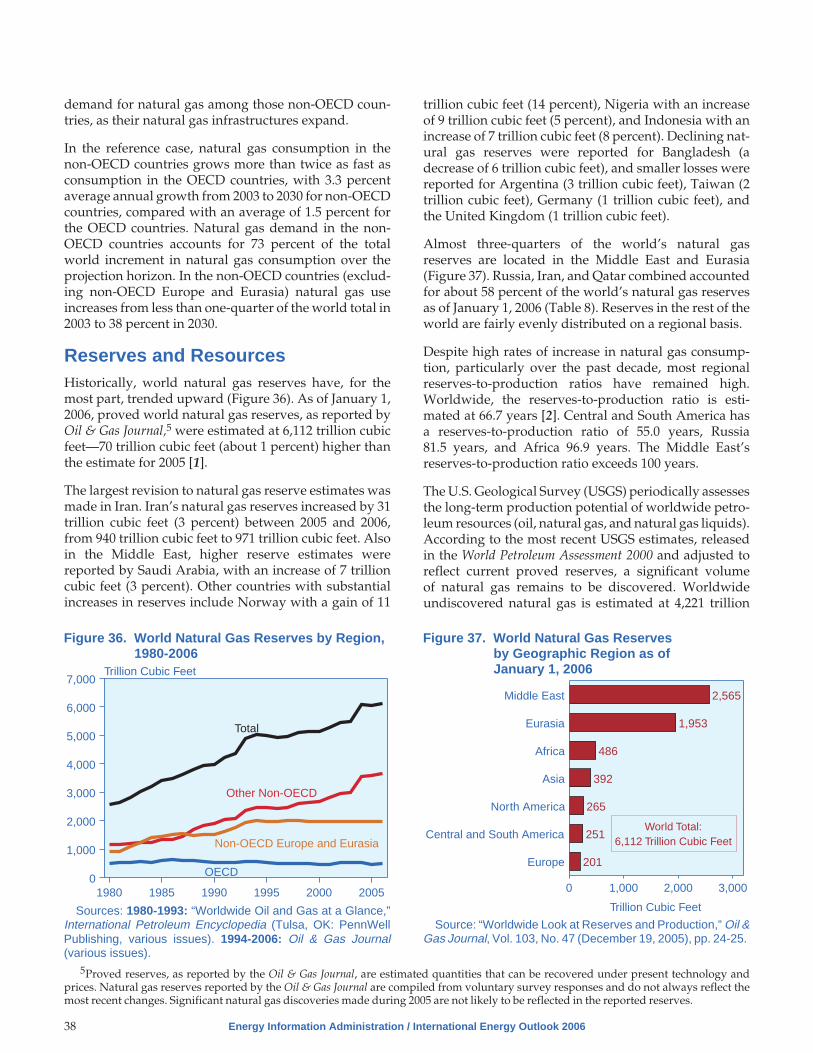
demand for natural gas among those non-OECD coun-tries, as their natural gas infrastructures expand.
In the reference case, natural gas consumption in thenon-OECD countries grows more than twice as fast asconsumption in the OECD countries, with 3.3 percentaverage annual growth from 2003 to 2030 for non-OECDcountries, compared with an average of 1.5 percent forthe OECD countries. Natural gas demand in the non-OECD countries accounts for 73 percent of the totalworld increment in natural gas consumption over theprojection horizon. In the non-OECD countries (exclud-ing non-OECD Europe and Eurasia) natural gas useincreases from less than one-quarter of the world total in2003 to 38 percent in 2030.
Reserves and ResourcesHistorically, world natural gas reserves have, for themost part, trended upward (Figure 36). As of January 1,2006, proved world natural gas reserves, as reported byOil & Gas Journal,5 were estimated at 6,112 trillion cubicfeet—70 trillion cubic feet (about 1 percent) higher thanthe estimate for 2005 [1].
The largest revision to natural gas reserve estimates wasmade in Iran. Iran’s natural gas reserves increased by 31trillion cubic feet (3 percent) between 2005 and 2006,from 940 trillion cubic feet to 971 trillion cubic feet. Alsoin the Middle East, higher reserve estimates werereported by Saudi Arabia, with an increase of 7 trillioncubic feet (3 percent). Other countries with substantialincreases in reserves include Norway with a gain of 11
trillion cubic feet (14 percent), Nigeria with an increaseof 9 trillion cubic feet (5 percent), and Indonesia with anincrease of 7 trillion cubic feet (8 percent). Declining nat-ural gas reserves were reported for Bangladesh (adecrease of 6 trillion cubic feet), and smaller losses werereported for Argentina (3 trillion cubic feet), Taiwan (2trillion cubic feet), Germany (1 trillion cubic feet), andthe United Kingdom (1 trillion cubic feet).
Almost three-quarters of the world’s natural gasreserves are located in the Middle East and Eurasia(Figure 37). Russia, Iran, and Qatar combined accountedfor about 58 percent of the world’s natural gas reservesas of January 1, 2006 (Table 8). Reserves in the rest of theworld are fairly evenly distributed on a regional basis.
Despite high rates of increase in natural gas consump-tion, particularly over the past decade, most regionalreserves-to-production ratios have remained high.Worldwide, the reserves-to-production ratio is esti-mated at 66.7 years [2]. Central and South America hasa reserves-to-production ratio of 55.0 years, Russia81.5 years, and Africa 96.9 years. The Middle East’sreserves-to-production ratio exceeds 100 years.
The U.S. Geological Survey (USGS) periodically assessesthe long-term production potential of worldwide petro-leum resources (oil, natural gas, and natural gas liquids).According to the most recent USGS estimates, releasedin the World Petroleum Assessment 2000 and adjusted toreflect current proved reserves, a significant volumeof natural gas remains to be discovered. Worldwideundiscovered natural gas is estimated at 4,221 trillion
38 Energy Information Administration / International Energy Outlook 2006
1980 1985 1990 1995 2000 20050
1,000
2,000
3,000
4,000
5,000
6,000
7,000Trillion Cubic Feet
OECD
Total
Non-OECD Europe and Eurasia
Other Non-OECD
Figure 36. World Natural Gas Reserves by Region,1980-2006
Sources: 1980-1993: “Worldwide Oil and Gas at a Glance,”International Petroleum Encyclopedia (Tulsa, OK: PennWellPublishing, various issues). 1994-2006: Oil & Gas Journal(various issues).
2,565
1,953
486
392
265
251
201
Middle East
Eurasia
Africa
Asia
North America
Central and South America
Europe
0 1,000 2,000 3,000
Trillion Cubic Feet
World Total:6,112 Trillion Cubic Feet
Figure 37. World Natural Gas Reservesby Geographic Region as ofJanuary 1, 2006
Source: “Worldwide Look at Reserves and Production,” Oil &Gas Journal, Vol. 103, No. 47 (December 19, 2005), pp. 24-25.
5Proved reserves, as reported by the Oil & Gas Journal, are estimated quantities that can be recovered under present technology andprices. Natural gas reserves reported by the Oil & Gas Journal are compiled from voluntary survey responses and do not always reflect themost recent changes. Significant natural gas discoveries made during 2005 are not likely to be reflected in the reported reserves.

cubic feet (Figure 38), slightly larger than the IEO2006projection for cumulative worldwide natural gas con-sumption from 2003 to 2030.
Of the total natural gas resource base, an estimated 3,000trillion cubic feet is in “stranded” reserves, usuallylocated too far away from pipeline infrastructure or pop-ulation centers for its transportation to be economical.Of the new natural gas resources expected to be addedthrough 2025, reserve growth accounts for 2,347 trillioncubic feet. More than one-half of the mean undiscoverednatural gas estimate is expected to come from Eurasia,the Middle East, and North Africa; and about one-fourth(1,065 trillion cubic feet) is expected to come from a com-bination of North, Central, and South America.
World Natural Gas SupplyNon-OECD Europe and Eurasia and the Middle Eastaccount for almost three-quarters of the world’s naturalgas reserves, but in 2003 they accounted for only 39 per-cent of world production. Together, these two regionsaccount for 47 percent of the projected increase in global
natural gas production from 2003 to 2030 (Table 9),much of it for export to OECD countries.
Russia is already the world’s single largest exporter ofnatural gas, with net exports of 6.3 trillion cubic feet in2003, all of it by pipeline. There are also some plans toexport natural gas from the Middle East, but much of theregion’s increase in production is projected to be useddomestically—particularly in the electric power sector,where shifts from petroleum to natural gas allow theproducing countries to monetize more of their oil assetsthrough export.
Other non-OECD regions are also expected to increasetheir natural gas production strongly. Africa, with itsrich and underdeveloped natural gas resources, has thefastest growth rate in natural gas production world-wide, with supply rising by 4.9 percent per year from2003 to 2030. A considerable amount of the incrementalproduction in Africa—from Algeria, Nigeria, Libya, andEgypt—is slated for export, both by pipeline and in theform of liquefied natural gas (LNG).
Natural gas production in non-OECD Asia also growssubstantially over the projection period, but all thegrowth in supply is required for consumption within theregion, and imports are needed to fill the shortfall. InCentral and South America, natural gas production out-paces regional demand. As a result, Trinidad andTobago continues to export LNG outside the region.Peru, and possibly Venezuela, may also begin to exportLNG outside the region over the course of the projection.
In 2003, the OECD countries accounted for 41 percent ofthe world’s total natural gas production and 52 percent
Energy Information Administration / International Energy Outlook 2006 39
Table 8. World Natural Gas Reserves by Countryas of January 1, 2006
Country
Reserves(Trillion
Cubic Feet)
Percent ofWorldTotal
World . . . . . . . . . . . . . . . . . 6,112 100.0Top 20 Countries. . . . . . . . 5,510 90.2
Russia . . . . . . . . . . . . . . . . 1,680 27.5Iran . . . . . . . . . . . . . . . . . . 971 15.9Qatar . . . . . . . . . . . . . . . . . 911 14.9Saudi Arabia . . . . . . . . . . . 241 3.9United Arab Emirates . . . . 214 3.5United States. . . . . . . . . . . 193 3.1Nigeria. . . . . . . . . . . . . . . . 185 3.0Algeria . . . . . . . . . . . . . . . . 161 2.6Venezuela . . . . . . . . . . . . . 151 2.5Iraq . . . . . . . . . . . . . . . . . . 112 1.8Indonesia. . . . . . . . . . . . . . 98 1.6Norway . . . . . . . . . . . . . . . 84 1.4Malaysia . . . . . . . . . . . . . . 75 1.2Turkmenistan . . . . . . . . . . 71 1.2Uzbekistan . . . . . . . . . . . . 66 1.1Kazakhstan . . . . . . . . . . . . 65 1.1Netherlands. . . . . . . . . . . . 62 1.0Egypt . . . . . . . . . . . . . . . . . 59 1.0Canada . . . . . . . . . . . . . . . 57 0.9Kuwait . . . . . . . . . . . . . . . . 56 0.9
Rest of World . . . . . . . . . . . 602 9.8
Source: “Worldwide Look at Reserves and Production,” Oil &Gas Journal, Vol. 103, No. 47 (December 19, 2005), pp. 24-25.
0 0 0
2,347
6,113
4,221
ProvenReserves
UndiscoveredNatural Gas
ReserveGrowth
0
1,000
2,000
3,000
4,000
5,000
6,000
7,000Trillion Cubic Feet
Middle East
Eurasia
Africa
Asia
North America
Central/South America
Europe
Figure 38. World Natural Gas Resourcesby Geographic Region, 2006-2025
Source: U.S. Geological Survey, World Petroleum Assess-ment 2000, web site http://greenwood.cr.usgs.gov/energy/WorldEnergy/DDS-60; “Worldwide Look at Reserves and Pro-duction,” Oil & Gas Journal, Vol. 103, No. 47 (December 19,2005), pp. 24-25; and Energy Information Administration esti-mates.

of total natural gas consumption; in 2030, they are pro-jected to account for only 25 percent of production and40 percent of consumption. Natural gas supply from theOECD nations increases by an average of only 0.5 per-cent per year in the IEO2006 reference case, whereasdemand increases by 1.5 percent per year. As a result,the OECD countries rely increasingly on imports to meetnatural gas demand (Figure 39), with a growing percent-age of traded natural gas coming in the form of LNG.OECD countries rely on natural gas produced in otherparts of the world to meet more than one-third of theirnatural gas consumption in 2030, up from 22 percent in2003.
LNG is expected to become an increasingly importantsource of supply to meet the world’s demand for natural
gas. Although there were only 12 LNG-exporting coun-tries in 2004,6 the number is increasing. In 2005, Egyptjoined the ranks of LNG-producing countries with thestart of two separate liquefaction projects. Russia alsoentered the LNG business in 2005, not with LNG it pro-duced but with LNG for which it traded pipeline naturalgas [3]. Not until 2008, when the Sakhalin liquefactionproject is expected to start operations, will Russiabecome an LNG-producing country. Norway and Equa-torial Guinea also have their first liquefaction terminalsunder construction, and construction on the first lique-faction terminal in South America is scheduled to beginin 2006 in Peru.
The number of countries installing the infrastructurenecessary to accept LNG imports is also increasing.
40 Energy Information Administration / International Energy Outlook 2006
Table 9. World Natural Gas Production by Region and Country, 2003-2030(Trillion Cubic Feet)
Region/Country 2003 2010 2015 2020 2025 2030
Average AnnualPercent Change,
2003-2030
OECD North America. . . . . . . . . 27.1 26.4 28.1 29.3 29.9 30.4 0.4United States . . . . . . . . . . . . . . . 19.0 18.6 20.4 21.6 21.4 21.2 0.4Canada . . . . . . . . . . . . . . . . . . . 6.5 6.1 5.8 5.5 5.8 6.2 -0.2Mexico . . . . . . . . . . . . . . . . . . . . 1.5 1.7 1.9 2.2 2.6 3.0 2.6
OECD Europe . . . . . . . . . . . . . . . 10.7 10.9 11.0 10.7 10.7 10.3 -0.2OECD Asia . . . . . . . . . . . . . . . . . 1.5 2.4 3.2 3.9 4.4 4.8 4.3
Japan . . . . . . . . . . . . . . . . . . . . . 0.1 0.1 0.1 0.1 0.1 0.1 0.6South Korea. . . . . . . . . . . . . . . . 0.0 0.0 0.0 0.0 0.0 0.0 —Australia/New Zealand. . . . . . . . 1.4 2.3 3.1 3.8 4.2 4.6 4.5
Total OECD. . . . . . . . . . . . . . . 39.3 39.7 42.3 44.0 44.9 45.4 0.5
Non-OECD Europe and Eurasia 27.9 33.9 38.2 42.0 45.7 51.1 2.3Russia . . . . . . . . . . . . . . . . . . . . 21.8 26.8 30.4 33.5 36.6 41.5 2.4Other . . . . . . . . . . . . . . . . . . . . . 6.1 7.1 7.8 8.5 9.0 9.6 1.7
Non-OECD Asia . . . . . . . . . . . . . 9.7 12.9 16.5 19.9 23.7 27.4 3.9China . . . . . . . . . . . . . . . . . . . . . 1.2 2.4 3.0 3.5 3.9 4.4 4.9India . . . . . . . . . . . . . . . . . . . . . . 1.0 1.1 1.3 1.6 1.9 2.4 3.5Other non-OECD Asia . . . . . . . . 7.5 9.3 12.2 14.8 17.8 20.6 3.8
Middle East . . . . . . . . . . . . . . . . . 9.1 14.2 17.1 19.8 23.1 26.2 4.0Africa. . . . . . . . . . . . . . . . . . . . . . 5.1 8.7 11.4 14.3 16.3 18.5 4.9Central and South America. . . . 4.2 6.7 8.4 9.6 11.4 13.0 4.3
Brazil . . . . . . . . . . . . . . . . . . . . . 0.3 0.6 0.7 0.8 0.9 1.1 4.8Other Central /South America . . 3.9 6.2 7.7 8.8 10.5 11.9 4.2
Total Non-OECD. . . . . . . . . . . 55.9 76.4 91.7 105.6 120.2 136.2 3.4
Total World . . . . . . . . . . . . . . . . . 95.2 116.1 134.0 149.6 165.1 181.6 2.4
Note: Totals may not equal sum of components due to independent rounding.Sources: 2003: Energy Information Administration (EIA), International Energy Annual 2003 (May-July 2005), web site www.eia.
doe.gov/iea/. 2010-2030: United States: EIA, Annual Energy Outlook 2006, DOE/EIA-0383 (2006) (Washington, DC, February2006), web site www.eia.doe.gov/oiaf/aeo/. Others: EIA, System for the Analysis of Global Energy Markets (2006).
6Algeria, United States, Libya, Brunei, United Arab Emirates, Indonesia, Malaysia, Australia, Qatar, Nigeria, Trinidad and Tobago, andOman.

More than 30 years had passed since the United King-dom imported LNG, but in 2005 it rejoined the ranks ofLNG importers, with the startup of its Isle of Grainregasification terminal. China, Canada, and Mexico allhave their first LNG import terminals under construc-tion; and Germany, Poland, Croatia, Singapore, andChile are among the other countries considering theirfirst regasification terminals.
World Natural Gas DemandOECD North America
North America’s natural gas consumption (Figure 40) isprojected to increase at an average annual rate of 1.1 per-cent between 2003 and 2030. The regional growth ratefor natural gas demand is somewhat slower than in pastIEOs, largely because of the impact of higher prices andsupply concerns in natural gas markets of the UnitedStates, North America’s largest consumer. The UnitedStates accounted for more than 80 percent of the 27.4 tril-lion cubic feet of natural gas consumed in the region in2003, and its share of the total in 2030 is 73 percent,despite robust growth in demand for natural gas in Can-ada and Mexico, averaging 1.9 percent per year and 3.4percent per year, respectively.
The current high levels of natural gas prices in theUnited States are expected to discourage the construc-tion of new natural-gas-fired electricity generationplants in the mid-term. As a result, only 130 gigawatts ofnew natural-gas-fired capacity is added from 2003through 2030 in the reference case, as compared with 154gigawatts of new coal-fired capacity. U.S. natural gasconsumption for electricity generation peaks in 2020 at
7.5 trillion cubic feet, followed by a decline to 6.4 trillioncubic feet in 2030.
Natural gas prices in the United States remain relativelyhigh throughout the projection period; and as a result,consumption of natural gas in the U.S. industrial sectorgrows slowly, from 8.3 trillion cubic feet in 2003 to 10.0trillion cubic feet in 2030. Natural gas consumptionincreases in all the major industrial sectors, with theexception of the refining industry. High prices also limitconsumption increases in the U.S. buildings sector (resi-dential and commercial), where natural gas use growsfrom 8.3 trillion cubic feet in 2003 to 9.6 trillion cubic feetin 2030. The net result of changes in energy use in theelectric power, industrial, and other end-use sectors isthat U.S. natural gas consumption is essentially flatbetween 2020 and 2030.
Canada, currently the source of almost 90 percent of U.S.net natural gas imports, remains the primary source ofnatural gas imported into the United States until 2010.After 2010, LNG imports replace Canadian imports asthe primary source. The decline of Canada’s largest pro-ducing basin, the Western Sedimentary Basin, coupledwith 1.9-percent projected average annual growth inCanada’s domestic consumption, leaves less Canadiannatural gas available for export to the United States.
In EIA’s Annual Energy Outlook 2006 (AEO2006) refer-ence case, rising natural gas prices make it economicalfor two major North American pipelines that have longbeen in the planning stages to come online. The first, aCanadian pipeline to transport natural gas from theMacKenzie Delta, is expected to become operational in2011. The second, an Alaska pipeline, is expected to
Energy Information Administration / International Energy Outlook 2006 41
2003 2010 2015 2020 2025 20300
20
40
60
80Trillion Cubic Feet
Production
Imports
Figure 39. OECD Natural Gas Supply by Source,2003-2030
Sources: 2003: Energy Information Administration (EIA),International Energy Annual 2003 (May-July 2005), web sitewww.eia.doe.gov/iea/. Projections: EIA, System for the Anal-ysis of Global Energy Markets (2006).
2003 2010 2015 2020 2025 20300
10
20
30
40
50Trillion Cubic Feet
United States
Canada
Mexico
Figure 40. Natural Gas Consumption inNorth America by Country, 2003-2030
Sources: 2003: Energy Information Administration (EIA),International Energy Annual 2003 (May-July 2005), web sitewww.eia.doe.gov/iea/. Projections: EIA, System for the Anal-ysis of Global Energy Markets (2006).

begin transporting natural gas from Alaska to the lower48 States in 2015, contributing significantly to U.S.domestic supply. From 2003 to 2030, Alaska’s naturalgas production accounts for most of the growth indomestic U.S. conventional natural gas production, withflows on the pipeline exceeding 2 trillion cubic feet in2030.
The other expected source of U.S. domestic incrementalsupply is unconventional natural gas production. Morethan one-third of the remaining U.S. technically recover-able resource base consists of unconventional sources,which include tight sands, shale, and coalbed methane.With most of the large onshore conventional fields in theUnited States already having been discovered, theUnited States, like Canada, must look to these costliersources of supply to make up for declines in conven-tional production.
Currently, the United States has five LNG import facili-ties in operation, with a combined peak annual capacityof 1.6 trillion cubic feet. Three additional terminalsunder construction in the Gulf of Mexico will add a com-bined peak annual regasification capacity of 2.0 trillioncubic feet, more than doubling U.S. LNG import capac-ity. AEO2006 projects peak annual U.S. LNG importcapacity in 2030 at 5.9 trillion cubic feet, with actualimports of 4.4 trillion cubic feet (Figure 41). The growthof U.S. LNG import capacity is expected to be strongthrough 2015 and then to slow as high natural gas pricesbegin to slow the growth of domestic consumption.LNG imports into Canada are also expected to contrib-ute to the supply of Canadian natural gas available forexport to the United States. LNG is expected to be a sig-nificant contributor to supply in the United States, indic-ative of the country’s growing dependence on importsand the increasing globalization of natural gas markets.
In Canada, most of the projected increase in natural gasconsumption is for industrial uses and electricity gener-ation, with only moderate growth in the other consum-ing sectors. Although natural gas use in Canada’selectric power sector more than doubles from 2003 to2030, the largest absolute increase is projected for theindustrial sector, largely because significant amounts ofnatural gas are expected to be used in the mining of Can-ada’s expansive oil sands deposits.
Canada produced more than twice as much natural gasas it consumed in 2003, and the balance was exported tothe United States. In 2030, Canada is projected to con-sume 85 percent of its own production, leaving only 15percent available for export. Increases in unconven-tional production in western Canada and conventionalproduction in the MacKenzie Delta and Eastern Canadaare expected to help reverse the decline in productionafter 2020, and net exports to the United States increasegradually from 2020 to 2030.
In Mexico, strong growth in natural gas consumption forindustry and for electricity generation is expected, withindustrial consumption doubling and consumption forelectricity generation more than tripling between 2003and 2030. Growth in Mexico’s natural gas consumptionis expected to far outpace growth in its production.Although Mexico has significant untapped natural gasreserves, the Mexican government does not have theresources needed to develop them and to date has beenrelatively unsuccessful in attracting foreign capital. Cur-rently, only the state oil and natural gas company,Petroleos Mexicanos (PEMEX), is allowed to have anyownership interest in Mexico’s oil and natural gasreserves. Mexico is thus expected to be dependent onpipeline imports from the United States and LNGimports to meet its growing supply deficit. In the refer-ence case, imports grow from 17 percent of Mexico’stotal natural gas consumption in 2003 to 33 percent in2030. Throughout the projections, Mexico remains a netimporter of natural gas from the United States.
OECD Europe
Natural gas is expected to be the fastest growing fuelsource in OECD Europe, with demand increasing at anannual average rate of 2.0 percent, from 17.8 trillioncubic feet in 2003 to 23.9 trillion cubic feet in 2015 and30.8 trillion cubic feet in 2030. Almost 60 percent of incre-mental natural gas consumption in OECD Europebetween 2003 and 2030 is expected to be used for electricpower generation (Figure 42). Natural-gas-fired genera-tion is less carbon-intensive than oil- or coal-fired gener-ation and is expected to remain more cost-competitive
42 Energy Information Administration / International Energy Outlook 2006
1990 1995 2003 2010 2020 2030
0
1
2
3
4
5
-1
Trillion Cubic Feet
Overseas LNG
Canada
Mexico
History Projections
Figure 41. U.S. Natural Gas Supply by Source,1990-2030
Sources: History: Energy Information Administration (EIA),Annual Energy Review 2004, DOE/EIA-0384(2004) (Washing-ton, DC, August 2005), web site www.eia.doe.gov/emeu/aer/.Projections: EIA, Annual Energy Outlook 2006, DOE/EIA-0383(2006) (Washington, DC, February 2006), web site www.eia.doe.gov/oiaf/aeo/.

than renewable energy, making natural gas the fuel ofchoice for new generating capacity in OECD Europe.
Natural gas consumption for electricity generation inOECD Europe increases on average by 3.9 percent peryear from 2003 to 2030, surpassing the use of renewablesfor electricity generation (on a Btu basis) by 2015 and theuse of coal or nuclear power by 2020. The share of totalelectricity sector energy demand met by natural gasincreases from 14 percent in 2003 to 24 percent in 2015and 32 percent in 2030.
OECD Europe received net imports of around 7 trillioncubic feet of natural gas in 2003, accounting for morethan one-third of the region’s total natural gas consump-tion. With domestic production declining in most of thecountries of OECD Europe, the region’s reliance onimported natural gas grows to more than one-half ofdemand in 2015 and almost two-thirds in 2030. Russia,alone, currently provides around two-thirds of Europe’simports, and much of Europe was affected in January2006 when Russia, in a dispute over contract prices, cutoff natural gas supplies to Ukraine.
Security and diversity of natural gas supply are majorconcerns for OECD Europe now and going forward.Europe is aggressively expanding LNG receiving capac-ity, and several new pipelines have been proposed thatwould link Europe to supplies in Egypt, the Middle East,and the Caspian Basin, and would increase capacityfrom North Africa and add capacity from Russia viaroutes that bypass traditional transit states.
OECD Asia
In the IEO2006 reference case, Japan has the lowestgrowth rate for natural gas consumption among theOECD countries outside North America (Figure 43),mainly because its population declines and its economicgrowth is relatively slow. Even with an average annualgrowth rate in consumption of only 0.8 percent, how-ever, natural gas still is the second fastest growing pri-mary energy source in Japan, behind nuclear power.
Total natural gas consumption in South Korea grows atan average annual rate of 1.7 percent from 2003 to 2030.In 2003, the residential sector was the country’s predom-inant consumer of natural gas, accounting for 39 percentof the total, with the electric power sector a close secondat 33 percent of total natural gas use. In the projections,natural gas use in South Korea’s industrial sectorincreases on average by 4.9 percent per year from 2003 to2030, compared with average annual growth of 0.7 per-cent in the residential sector. By 2020, natural gas con-sumption in the country’s industrial sector surpassesthat in its residential sector; and in 2030, industrial natu-ral gas use accounts for more than 45 percent of all thenatural gas consumed in South Korea.
In Australia and New Zealand, the industrial sector cur-rently is the predominant user of natural gas, and itaccounts for more than one-half of all natural gas con-sumption in the region throughout the projectionperiod. Natural gas is the fastest growing fuel in Austra-lia and New Zealand in the reference case; however,with the region’s abundance of coal reserves, and with
Energy Information Administration / International Energy Outlook 2006 43
2003 2010 2015 2020 2025 20300
5
10
15Trillion Cubic Feet
Industrial Electric Power Other
Figure 42. Natural Gas Consumption in OECDEurope by End-Use Sector, 2003-2030
Sources: 2003: Derived from Energy Information Adminis-tration (EIA), International Energy Annual 2003 (May-July2005), web site www.eia.doe.gov/iea/. Projections: EIA, Sys-tem for the Analysis of Global Energy Markets (2006).
2003 2010 2015 2020 2025 20300
2
4
6
8
10Trillion Cubic Feet
Japan
Australia/New Zealand
South Korea
Figure 43. Natural Gas Consumption in OECD Asiaby Country, 2003-2030
Sources: 2003: Energy Information Administration (EIA),International Energy Annual 2003 (May-July 2005), web sitewww.eia.doe.gov/iea/. Projections: EIA, System for the Anal-ysis of Global Energy Markets (2006).
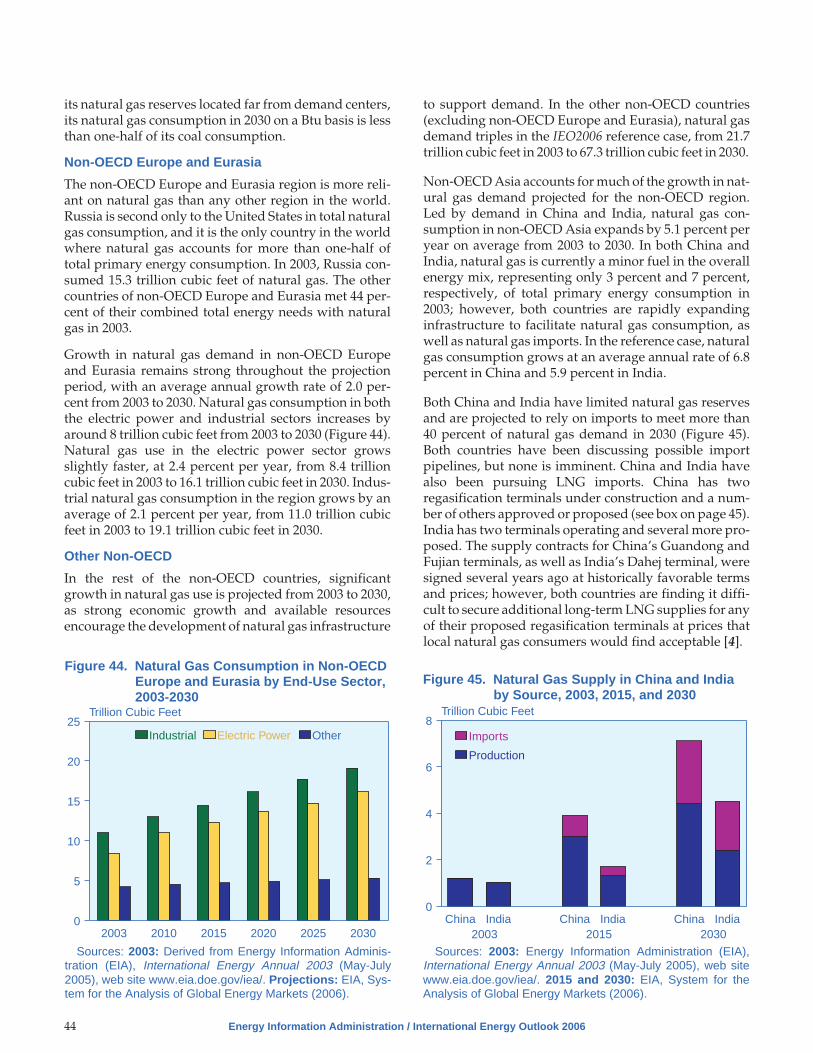
its natural gas reserves located far from demand centers,its natural gas consumption in 2030 on a Btu basis is lessthan one-half of its coal consumption.
Non-OECD Europe and Eurasia
The non-OECD Europe and Eurasia region is more reli-ant on natural gas than any other region in the world.Russia is second only to the United States in total naturalgas consumption, and it is the only country in the worldwhere natural gas accounts for more than one-half oftotal primary energy consumption. In 2003, Russia con-sumed 15.3 trillion cubic feet of natural gas. The othercountries of non-OECD Europe and Eurasia met 44 per-cent of their combined total energy needs with naturalgas in 2003.
Growth in natural gas demand in non-OECD Europeand Eurasia remains strong throughout the projectionperiod, with an average annual growth rate of 2.0 per-cent from 2003 to 2030. Natural gas consumption in boththe electric power and industrial sectors increases byaround 8 trillion cubic feet from 2003 to 2030 (Figure 44).Natural gas use in the electric power sector growsslightly faster, at 2.4 percent per year, from 8.4 trillioncubic feet in 2003 to 16.1 trillion cubic feet in 2030. Indus-trial natural gas consumption in the region grows by anaverage of 2.1 percent per year, from 11.0 trillion cubicfeet in 2003 to 19.1 trillion cubic feet in 2030.
Other Non-OECD
In the rest of the non-OECD countries, significantgrowth in natural gas use is projected from 2003 to 2030,as strong economic growth and available resourcesencourage the development of natural gas infrastructure
to support demand. In the other non-OECD countries(excluding non-OECD Europe and Eurasia), natural gasdemand triples in the IEO2006 reference case, from 21.7trillion cubic feet in 2003 to 67.3 trillion cubic feet in 2030.
Non-OECD Asia accounts for much of the growth in nat-ural gas demand projected for the non-OECD region.Led by demand in China and India, natural gas con-sumption in non-OECD Asia expands by 5.1 percent peryear on average from 2003 to 2030. In both China andIndia, natural gas is currently a minor fuel in the overallenergy mix, representing only 3 percent and 7 percent,respectively, of total primary energy consumption in2003; however, both countries are rapidly expandinginfrastructure to facilitate natural gas consumption, aswell as natural gas imports. In the reference case, naturalgas consumption grows at an average annual rate of 6.8percent in China and 5.9 percent in India.
Both China and India have limited natural gas reservesand are projected to rely on imports to meet more than40 percent of natural gas demand in 2030 (Figure 45).Both countries have been discussing possible importpipelines, but none is imminent. China and India havealso been pursuing LNG imports. China has tworegasification terminals under construction and a num-ber of others approved or proposed (see box on page 45).India has two terminals operating and several more pro-posed. The supply contracts for China’s Guandong andFujian terminals, as well as India’s Dahej terminal, weresigned several years ago at historically favorable termsand prices; however, both countries are finding it diffi-cult to secure additional long-term LNG supplies for anyof their proposed regasification terminals at prices thatlocal natural gas consumers would find acceptable [4].
44 Energy Information Administration / International Energy Outlook 2006
2003 2010 2015 2020 2025 20300
5
10
15
20
25Trillion Cubic Feet
Industrial Electric Power Other
Figure 44. Natural Gas Consumption in Non-OECDEurope and Eurasia by End-Use Sector,2003-2030
Sources: 2003: Derived from Energy Information Adminis-tration (EIA), International Energy Annual 2003 (May-July2005), web site www.eia.doe.gov/iea/. Projections: EIA, Sys-tem for the Analysis of Global Energy Markets (2006).
China2003
India China2015
India China2030
India0
2
4
6
8Trillion Cubic Feet
Production
Imports
Figure 45. Natural Gas Supply in China and Indiaby Source, 2003, 2015, and 2030
Sources: 2003: Energy Information Administration (EIA),International Energy Annual 2003 (May-July 2005), web sitewww.eia.doe.gov/iea/. 2015 and 2030: EIA, System for theAnalysis of Global Energy Markets (2006).

Energy Information Administration / International Energy Outlook 2006 45
Liquefied Natural Gas: Market Developments in China
Pressed by shortages of peak-load capacity and grow-ing concern about pollution from coal burning, Chinahas begun to turn to cleaner burning fuels—in particu-lar, LNG—for electricity generation. There is greatpotential for development of LNG within China, and anumber of regasification facilities are currently underconstruction or planned, especially in the eastern part
of the country, where access to coal resources is limited(see map below). In large part, however, the growth ofChina’s LNG market may be limited by competitionwith coal.
Rapid growth in China’s manufacturing output in-creased its electric power demand by about 15 percent
(continued on page 46)
LNG Terminal Under Construction
Beihai LNG(Guangxi)
Xinjiang
Qinghai
Sichuan
Yunnan
Guizhou
Guangxi
Hainan
Guangdong
Hunan
Fujian
Zhejiang
Shanghai
Tibet
Jiangxi
Shanxi
Heilongjiang
Shandong
Gansu
Shaanxi
Anhui
Jilin
Inner Mongolia
Jiangsu
Tianjin
Beijing
Henan
0 500 Miles
500 km0
Ningxia
Hubei
Irkutsk Russia
Liaoning
Hebei
Haikou LNG(Hainan)
Shenzhen LNG(Guangdong)
Xiuyu LNG(Fujian)
Ningbao LNG(Zhejian)
Shanghai LNG
Rudong LNG(Jiangsu)
Qingdao LNG(Shandong)
Hebei/Tianjin LNG
Dalian LNG(Liaoning)
LNG Terminal Approved
LNG Terminal ProposedNatural Gas Pipeline
Proposed Natural Gas Pipeline
Coal Port
Net Coal Exporter
Net Coal Importer
China’s Natural Gas Pipelines and Major LNG Terminals Under Construction, Approved, or Proposed
Sources: Coal: Barlow Jonker Pty. Ltd., Major Coalfields of China (Sydney, Australia, 2001). Natural Gas: Jeffrey Logan,Senior Energy Analyst and China Program Manager, International Energy Agency, “China Oil and Gas Outlook and Implicationsfor Energy Markets,” Testimony Before the U.S. Senate, Committee on Energy and Natural Resources, Hearing on EIA’s AnnualEnergy Outlook for 2005 (Washington, DC, February 3, 2005), web site http://energy.senate.gov/public/.

46 Energy Information Administration / International Energy Outlook 2006
Liquefied Natural Gas: Market Developments in China (Continued)
in 2004.a In summer 2004, China saw a 30-gigawattnationwide power deficit, with 24 provincial gridsforced to restrict power supplies,b prompting a sharpincrease in demand for fuel oil (estimated at 170,000barrels per day) to generate electricity, in addition tothe existing 300,000 barrels per day used for electricpower generation annually.c The power shortage isexpected to continue through 2006, but demand forfuel oil in the power sector is expected to fall in the sec-ond half of 2006, when new LNG projects come online.China’s LNG imports are expected to increase from 1million metric tons in 2006 to between 20.9 and 25.9million metric tons in 2015.d
Several LNG projects are underway in China. Con-struction of the country’s first LNG regasification ter-minal, in Guangdong Province, has been completed,and the facility is scheduled to receive its first cargo inJune 2006 from North West Shelf Australian LNG. Asecond LNG terminal, in the city of Xiuyu in FujianProvince, is scheduled for completion by 2008. At pres-ent, the Chinese government is reviewing more than 10additional LNG proposals up and down China’s coast-line (see table below).
Plans to build LNG terminals on China’s northeastcoast developed quickly in 2004, accelerating whennegotiations between China and Russia over a majorproposed natural gas pipeline project that would bringnatural gas from Irkutsk, Russia, to northern Chinawere stalled. Lack of progress in the negotiation
resulted mainly from China’s insistence that the priceof natural gas from Russia be indexed to domestic coalprices in China. LNG pricing in Asian contracts tradi-tionally has been linked to the price of oil, not coal, butChina has been attempting to index LNG and pipelinenatural gas imports to the price of domestic coal.
The three LNG projects most likely to be built after theGuangdong and Fujian projects are in Shanghai,Ningbao (Zhejian Province), and Qingdao (ShandongProvince). Economic growth and industrial output inthe two provinces are the highest in China, making itpossible for their regional governments to purchaserelatively expensive imported natural gas. Shanghai isboth China’s largest city and its largest port, and it isone of the most prosperous cities in China. The munici-pal government of Shanghai is planning to phase outuse of coal in the city over the course of the next 10years. At present, Shanghai consumes more than 46million short tons of coal per year, providing 70 per-cent of its energy needs.e Shandong is rich in coal, butthe provincial power companies still have coal produc-tion and deliverability problems, and there is a seriouslack of available peaking capacity.f
Most of the areas in China targeted for LNG develop-ments have large coal-fired power plants, and the gov-ernment is carefully considering the issue of naturalgas and coal prices charged to the power plants. In2004, the cost of coal from northern China was around$1.92 per million Btu, and the average cost of natural
(continued on page 47)
aCambridge Energy Research Associates, “China Market Commentary, Spring 2005: After the Peak” (April 15, 2005), web site www.cera.com.
bWorld Market Research Centre, “China: Urban Centers in China To Face Power Crunch” (April 7, 2005), web site www.worldmarketsanalysis.com.
cPersonal correspondence with Fatih Birol, Chief Economist, International Energy Agency (April 26, 2005), web site www.iea.org.dK. Wu, L. Wang, and F. Fesharaki, “China’s LNG Imports: Delayed Terminal Projects and a Less Bullish Demand Outlook,” FACTS
Gas Insights, No. 4 (January 2006), web site www.factsinc.net.eC. Bergersen, “Country Profile: China Electric Power Overview” (February 16, 2005), web site www.platts.com/coal/resources.fA.J. Minchener, “Coal in China” (July 2004), web site www.iea-coal.org.uk.
China’s Proposed LNG Imports, 2005-2015(Million Metric Tons per Year)
Year
HaikouLNG
(Hainan)
ShenzhenLNG
(Guangdong)
XiuyuLNG
(Fujian)
NingbaoLNG
(Zhejian)Shanghai
LNG
RudongLNG
(Jiangsu)
QingdaoLNG
(Shandong)
Hebei/Tianjin
LNG
DalianLNG
(Liaoning)
BeihaiLNG
(Guangxi)2005 — — — — — — — — — —2006 — 3.9 — — — — — — — —2008 — 3.9 2.6 — — — 3.0 — — —2010 1.0 9.9 2.6 4.0 4.0 3.0 5.0 — — —2012 2.0 12.9 2.6 4.0 4.0 3.0 5.0 2.0 3.0 —2015 3.0 12.9 5.0 10.0 10.0 5.0 5.0 3.0 6.0 3.0
Sources: International Gas Report, No. 522 (April 22, 2005); K. Wu and F. Fesharaki, “Natural Gas Pipelines and LNG Termi-nals in China: An Update,” FACTS Gas Insights, No. 46 (March 2005), web site www.factsinc.net; and FACTS Inc., China Oil &Gas Monthly (May 2005).

Natural gas use in the Middle East more than doublesbetween 2003 and 2030 (Figure 46). Oil-exporting coun-tries in the region have deliberately sought to expanddomestic natural gas use in order to make more oil avail-able for export. In addition, natural-gas-rich countries inthe region are developing projects to monetize theirnatural gas resources, in particular through LNG and,more recently, gas-to-liquids (GTL) projects, which havebecome an active area of interest (see box on page 48).As a result, the importance of natural gas as a source ofsupply for domestic energy demand in the Middle Eastgrows over the projection period, with its share ofregional energy use increasing from 42 percent in 2003to 54 percent in 2030 while the oil share declines from55 percent to 42 percent over the same period.
In Africa, natural gas consumption increases by an aver-age of 4.4 percent per year over the projection period,making it the most rapidly growing primary energysource in the region. In comparison, Africa’s oil demandincreases by only 2.3 percent per year and its coal
Energy Information Administration / International Energy Outlook 2006 47
Liquefied Natural Gas: Market Developments in China (Continued)
gas from China’s west-to-east pipeline was $4.22 permillion Btu. On average, coal-fired electricity genera-tion in China costs $34 per megawatthour and natural-gas-fired generation $44 per megawatthour.g Potentialusers of natural gas in the electric power sector esti-mate that prices for natural gas must be in the range of$3.30 to $3.60 per million Btu to compete economicallywith coal.h The expected price of natural gas from theGuangdong LNG terminal is $2.80 per million Btu,including freight, plus $0.40 per million Btu forregasification.i
All the Chinese provinces have some coal resources;however, those in the east and southeast, whichaccount for one-half of China’s total GDP, contain only17 percent of its coal resources.j As a result, more than60 percent of the coal produced in China is transportedby rail over an average distance of about 340 miles,under a coal pricing scheme that used to be determinedby the central government.k The Chinese governmenthas gradually relaxed its pricing control on coal since1992, and coal prices for power generation havebecome negotiable. Currently, coal prices are deter-mined by a mix of negotiated contracts between
state-run producers and large end users, and the priceof coal imports. Domestic coal prices are typically $5 to$7 per short ton higher than the international marketprice of high-quality steam coal, which makes importsmore attractive.l
Concerns about pollution from electricity generation inChina have also led to higher coal prices, as the govern-ment has incorporated a number of environmentalcontrols to limit pollution from power generation. InOctober 2003, the State Environmental ProtectionAdministration (SEPA) raised the fee assessed to gen-erators for sulfur dioxide emissions by a factor of tenand applied the same fee for the first time to nitrogenoxide emissions, in addition to banning the construc-tion or expansion of coal-fired plants in many largecities.
China’s attempts to index its import contracts for LNGand pipeline natural gas to the price of domesticallyproduced coal may or may not succeed. If they do,China will certainly be able to accommodate moreimports of natural gas.
gD. Hurd, “Global LNG: Key Themes and Choices” (April 21, 2005), web site www.db.com.hK. Wu and F. Fesharaki, “Natural Gas Pipelines and LNG Terminals in China: An Update,” FACTS Gas Insights, No. 46 (March 2005),
web site www.factsinc.net.iPetroleum Intelligence Weekly, No. 5 (July 2004), web site www.EnergyIntel.com.jFACTS Inc., Gas Databook I (Honolulu, HI, 2005).kChina National Bureau of Statistics.lA.J. Minchener, “Coal in China” (July 2004), web site www.iea-coal.org.uk.
2003 2010 2015 2020 2025 20300
5
10
15
20
25
30Trillion Cubic Feet
Africa
Middle East
Figure 46. Natural Gas Consumption in Africa andthe Middle East, 2003-2030
Sources: 2003: Energy Information Administration (EIA),International Energy Annual 2003 (May-July 2005), web sitewww.eia.doe.gov/iea/. Projections: EIA, System for the Anal-ysis of Global Energy Markets (2006).

demand by only 1.7 percent per year. The incrementalgrowth in Africa’s natural gas demand occurs mostly inthe industrial and electric power sectors. Despite contin-uing instability in some countries of the region, theinvestment climate in Africa remains fairly attractive,with massive investments planned, mostly in WestAfrica.
In Central and South America, natural gas is the fastestgrowing fuel source, with demand increasing on aver-age by 3.9 percent per year, from 3.8 trillion cubic feet in2003 to 10.8 trillion cubic feet in 2030 (Figure 47). By2010, natural gas overtakes oil as the second most preva-lent fuel for electricity generation in the region, withrenewables—particularly, hydropower—retaining their
dominant share in the sector throughout the projectionperiod.
South America’s southern cone area is already criss-crossed by pipelines linking Bolivia, Brazil, Argentina,Chile, and Uruguay. In addition, a number of new pipe-lines are under discussion, which would link Peru withEcuador and Chile, Venezuela with Colombia andBrazil, and Colombia with Panama [5]. The new linescould later be linked with each other and with existingpipelines to create a South American natural gasgrid—an idea that is being promoted by Venezuela.Even some of the more modest proposed pipelines,however, face substantial political hurdles.
48 Energy Information Administration / International Energy Outlook 2006
Current Developments in Gas-to-Liquids
The relatively high world oil prices of the past severalyears have made gas-to-liquids (GTL) a more attractiveoption for monetizing stranded natural gas reserves.Currently, only South Africa and Malaysia have com-mercial GTL operations; but new projects have beenproposed for Algeria, Australia, Egypt, Iran, Nigeria,and Qatar. Proposed plant sizes range from 20 to 160thousand barrels per day of liquids output. In addition,Russia has significant potential for GTL productionbecause of its plentiful and often remote natural gasreserves.
Natural gas use as a feedstock for GTL operations isreflected in the IEO2006 projections for industrial natu-ral gas consumption. In regions where natural gasmarkets are less developed, GTL may represent a sig-nificant share of industrial or even total natural gasuse. For example, in 2003, natural gas for the BintuluGTL plant in Malaysia, with an original design capac-ity of only 12.5 thousand barrels per day, accounted foralmost 2 percent of industrial sector natural gas useand 1 percent of total natural gas consumption in non-OECD Asia excluding China and India (”Other Non-OECD Asia”). In Africa, natural gas use for GTL opera-tions in 2003 represented some 6 percent of industrialand 3 percent of total natural gas consumption.
In IEO2006, significant quantities of GTL productionby 2030 are projected only for Russia, Africa, the Mid-dle East, and Other Non-OECD Asia. For all but Rus-sia, which already consumes large amounts of naturalgas in its industrial sector, natural gas use for GTL haspotentially significant effects on industrial and totalnatural gas consumption. The addition of a single140 thousand barrel per day GTL plant, consuming
0.5 trillion cubic feet of natural gas per year, would rep-resent an increase in total natural gas consumptionover 2003 levels: 3 percent in Russia, 6 percent in theMiddle East, 9 percent in non-OECD Asia, and 18 per-cent in Africa. In all but Russia, projected GTL opera-tions in large part drive industrial sector natural gasdemand in the reference case. The projected growthrates for industrial natural gas use in the Middle East,non-OECD Asia, and Africa are among the highest inIEO2006 (see figure below).
6.7
5.2
4.8
4.7
4.6
3.4
2.5
2.1
1.9
1.2
China
Africa
India
Middle East
Other Non-OECD Asia
Central and South America
OECD Asia
Non-OECD Europe/Eurasia
OECD Europe
North America
0 2 4 6 8
Percent per Year
Average Annual Increases in Industrial NaturalGas Consumption, 2003-2030, by Region andCountry
Sources: 2003: Energy Information Administration (EIA),International Energy Annual 2003, DOE/EIA-0219(2003)(Washington, DC, July 2005), web site www.eia.doe.gov/iea/.Projections: EIA, System for the Analysis of Global EnergyMarkets (2006).

References
Energy Information Administration / International Energy Outlook 2006 49
2003 2010 2015 2020 2025 20300
2
4
6
8
10
12Trillion Cubic Feet
Brazil
Other Central and South America
Figure 47. Natural Gas Consumption in Brazil andOther Central and South America,2003-2030
Sources: 2003: Energy Information Administration (EIA),International Energy Annual 2003 (May-July 2005), web sitewww.eia.doe.gov/iea/. Projections: EIA, System for the Anal-ysis of Global Energy Markets (2006).
1. “Worldwide Look at Reserves and Production,” Oil& Gas Journal, Vol. 103, No. 47 (December 19, 2005),pp. 24-25.
2. BP Statistical Review of World Energy 2005 (London,UK, June 2005), p. 20.
3. “Gazprom, Gaz de France Swap Pipeline Gas forLNG Cargo,” LNG Express, Vol. 15, No. 23 (Decem-ber 1, 2005), p. 13.
4. FACTS Inc., “China’s LNG Imports: Delayed Ter-minal Projects and a Less Bullish Demand Out-look,” China Energy Series: Gas Edition, No. 4(January 2006), pp. 1, 4; and “India Struggles withLNG Imports; Hazira, Ratnagiri Seek New Sup-plies,” LNG Express, Vol. 16, No. 4 (February 15,2006), pp. 3-4.
5. “Northern South America Takes First Step TowardsGas Pipeline Integration,” Platt’s International GasReport, No. 535 (November 4, 2005), p. 17.

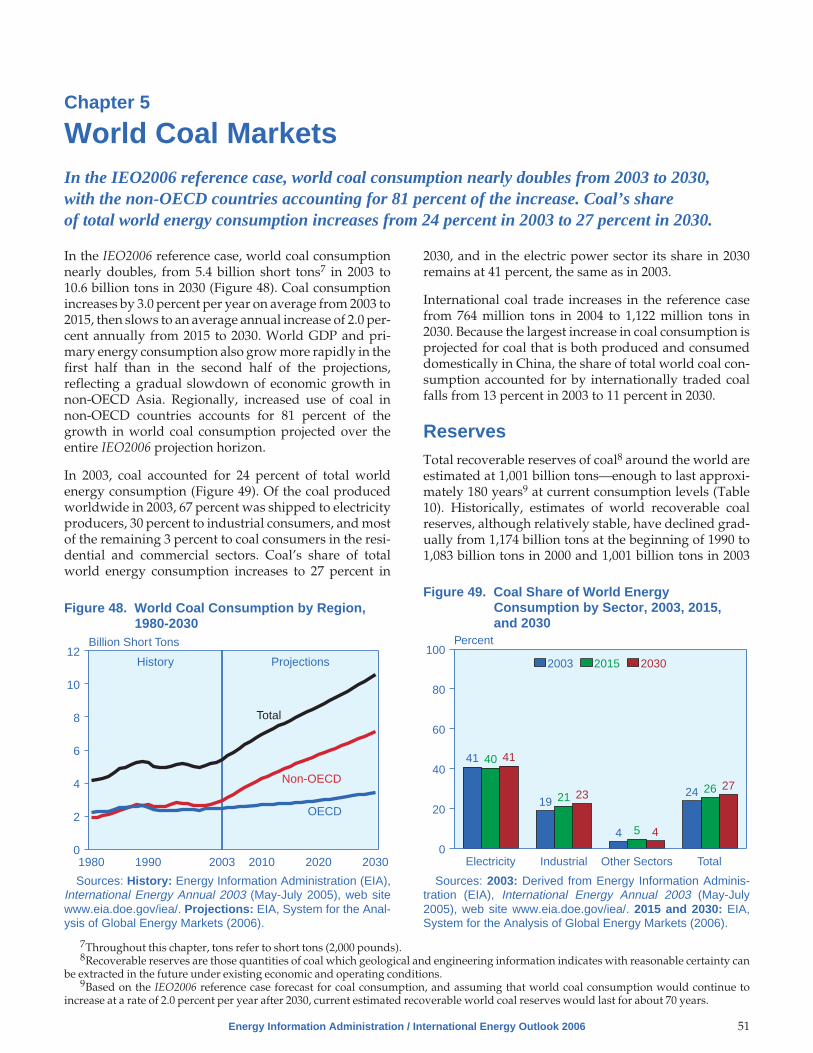
Chapter 5
World Coal MarketsIn the IEO2006 reference case, world coal consumption nearly doubles from 2003 to 2030,with the non-OECD countries accounting for 81 percent of the increase. Coal’s shareof total world energy consumption increases from 24 percent in 2003 to 27 percent in 2030.
In the IEO2006 reference case, world coal consumptionnearly doubles, from 5.4 billion short tons7 in 2003 to10.6 billion tons in 2030 (Figure 48). Coal consumptionincreases by 3.0 percent per year on average from 2003 to2015, then slows to an average annual increase of 2.0 per-cent annually from 2015 to 2030. World GDP and pri-mary energy consumption also grow more rapidly in thefirst half than in the second half of the projections,reflecting a gradual slowdown of economic growth innon-OECD Asia. Regionally, increased use of coal innon-OECD countries accounts for 81 percent of thegrowth in world coal consumption projected over theentire IEO2006 projection horizon.
In 2003, coal accounted for 24 percent of total worldenergy consumption (Figure 49). Of the coal producedworldwide in 2003, 67 percent was shipped to electricityproducers, 30 percent to industrial consumers, and mostof the remaining 3 percent to coal consumers in the resi-dential and commercial sectors. Coal’s share of totalworld energy consumption increases to 27 percent in
2030, and in the electric power sector its share in 2030remains at 41 percent, the same as in 2003.
International coal trade increases in the reference casefrom 764 million tons in 2004 to 1,122 million tons in2030. Because the largest increase in coal consumption isprojected for coal that is both produced and consumeddomestically in China, the share of total world coal con-sumption accounted for by internationally traded coalfalls from 13 percent in 2003 to 11 percent in 2030.
ReservesTotal recoverable reserves of coal8 around the world areestimated at 1,001 billion tons—enough to last approxi-mately 180 years9 at current consumption levels (Table10). Historically, estimates of world recoverable coalreserves, although relatively stable, have declined grad-ually from 1,174 billion tons at the beginning of 1990 to1,083 billion tons in 2000 and 1,001 billion tons in 2003
Energy Information Administration / International Energy Outlook 2006 51
1980 1990 2003 2010 2020 20300
2
4
6
8
10
12Billion Short Tons
History Projections
OECD
Total
Non-OECD
Figure 48. World Coal Consumption by Region,1980-2030
Sources: History: Energy Information Administration (EIA),International Energy Annual 2003 (May-July 2005), web sitewww.eia.doe.gov/iea/. Projections: EIA, System for the Anal-ysis of Global Energy Markets (2006).
41
19
4
24
40
21
5
26
41
23
4
27
Electricity Industrial Other Sectors Total0
20
40
60
80
100Percent
2003 2015 2030
Figure 49. Coal Share of World EnergyConsumption by Sector, 2003, 2015,and 2030
Sources: 2003: Derived from Energy Information Adminis-tration (EIA), International Energy Annual 2003 (May-July2005), web site www.eia.doe.gov/iea/. 2015 and 2030: EIA,System for the Analysis of Global Energy Markets (2006).
7Throughout this chapter, tons refer to short tons (2,000 pounds).8Recoverable reserves are those quantities of coal which geological and engineering information indicates with reasonable certainty can
be extracted in the future under existing economic and operating conditions.9Based on the IEO2006 reference case forecast for coal consumption, and assuming that world coal consumption would continue to
increase at a rate of 2.0 percent per year after 2030, current estimated recoverable world coal reserves would last for about 70 years.

[1]. The most recent assessment of world coal reservesincludes a substantial downward adjustment for Ger-many, from 73 billion tons of recoverable coal reserves to7 billion tons. The reassessment primarily reflects morerestrictive criteria for the depth and thickness parame-ters associated with both underground and surfaceminable seams of coal [2].
Although coal deposits are widely distributed, 67 per-cent of the world’s recoverable reserves are located infour countries: the United States (27 percent), Russia (17percent), China (13 percent), and India (10 percent). In2003, these four countries, taken together, accounted for63 percent of total world coal production [3]. By rank,anthracite and bituminous coal account for 53 percent ofthe world’s estimated recoverable coal reserves (on atonnage basis), subbituminous coal accounts for 30 per-cent, and lignite accounts for 17 percent.
Quality and geological characteristics of coal depositsare important parameters for coal reserves. Coal is a het-erogeneous source of energy, with quality (e.g., charac-teristics such as heat, sulfur, and ash content) varyingsignificantly by region and even within individual coalseams. At the top end of the quality spectrum are pre-mium-grade bituminous coals, or coking coal, used tomanufacture coke for the steelmaking process. Cokingcoals produced in the United States have an estimatedheat content of 27.4 million Btu per ton and relativelylow sulfur content of approximately 0.8 percent by
weight [4]. At the other end of the spectrum are reservesof low-Btu lignite. On a Btu basis, lignite reserves showconsiderable variation. Estimates published by the Inter-national Energy Agency for 2003 indicate that the aver-age heat content of lignite in major producing countriesvaries from a low of 4.3 million Btu per ton in Greece to ahigh of 12.3 million Btu per ton in Canada [5].
Regional Demand ForecastsOECD Countries
Coal consumption in the OECD countries rises at a rela-tively even pace in the reference case, from 2.5 billiontons in 2003 to 2.8 billion tons in 2015 and 3.4 billion tonsin 2030 (Figure 50). The increases represent averagegrowth of 1.2 percent per year over the entire period anda slightly higher rate of 1.4 percent per year from 2015 to2030.
Much of the 0.9-billion-ton increase in coal consumptionprojected for the OECD countries from 2003 to 2030 isthe result of expected strong growth in U.S. coaldemand. With the exception of OECD Europe andJapan, where coal consumption is expected to be essen-tially constant, moderate increases in coal consumptionare projected for the OECD countries, including SouthKorea, Canada, Australia/New Zealand, and Mexico. InOECD Europe, natural gas captures an increasing shareof the region’s total energy mix, displacing oil and, to alesser extent, coal and nuclear energy. In Japan, slow
52 Energy Information Administration / International Energy Outlook 2006
Table 10. World Recoverable Coal Reserves(Billion Short Tons)
Region/CountryBituminous and
Anthracite Subbituminous Lignite Total
World Total . . . . . . . . . . . . . . . . . . . . . . . . . . . . 530.4 297.0 173.4 1,000.9United States . . . . . . . . . . . . . . . . . . . . . . . . . . . 125.4 109.3 36.0 270.7Russia . . . . . . . . . . . . . . . . . . . . . . . . . . . . . . . . 54.1 107.4 11.5 173.1China . . . . . . . . . . . . . . . . . . . . . . . . . . . . . . . . . 68.6 37.1 20.5 126.2India . . . . . . . . . . . . . . . . . . . . . . . . . . . . . . . . . . 99.3 0.0 2.6 101.9Other Non-OECD Europe and Eurasia . . . . . . . 50.1 18.7 31.3 100.1Australia and New Zealand . . . . . . . . . . . . . . . . 42.6 2.7 41.9 87.2Africa . . . . . . . . . . . . . . . . . . . . . . . . . . . . . . . . . 55.3 0.2 * 55.5OECD Europe . . . . . . . . . . . . . . . . . . . . . . . . . . 19.5 5.0 18.8 43.3Other Non-OECD Asia. . . . . . . . . . . . . . . . . . . . 1.4 2.0 8.1 11.5Brazil . . . . . . . . . . . . . . . . . . . . . . . . . . . . . . . . . 0.0 11.1 0.0 11.1Other Central and South America . . . . . . . . . . . 8.5 2.2 0.1 10.8Canada . . . . . . . . . . . . . . . . . . . . . . . . . . . . . . . 3.8 1.0 2.5 7.3Othera . . . . . . . . . . . . . . . . . . . . . . . . . . . . . . . . 1.8 0.4 0.1 2.3aIncludes Mexico, Middle East, Japan, and South Korea.*Less than 0.05 billion short tons.Note: Data for the United States represent recoverable coal estimates as of January 1, 2004. Data for other countries are as of Jan-
uary 1, 2003.Sources: United States: Energy Information Administration, unpublished data from the Coal Reserves Database (August 2004).
All Other Countries: World Energy Council, 2004 Survey of Energy Resources, Eds. J. Trinnaman and A. Clarke (London, UK:Elsevier, December 2004).

economic growth results in sluggish growth in overallenergy demand in the IEO2006 projections, keeping pro-jected quantities of coal consumption near the 2003 level.
North America
In 2003, the United States consumed 1.1 billion tons ofcoal, accounting for 92 percent of total coal consumptionin North America and 44 percent of the OECD total. U.S.coal consumption rises to 1.8 billion tons in 2030 in thereference case. The United States has substantial coalreserves and has come to rely heavily on coal for electric-ity generation, a trend that continues in the projections.Coal’s share of total electricity generation in the UnitedStates (including electricity produced at combined heatand power plants in the industrial and commercial sec-tors) declines slightly, from 51 percent in 2003 to 48 per-cent in 2015, then rises to 57 percent in 2030.
Much of the projected growth in U.S. coal consumptionoccurs after 2015. Between 2005 and 2015, natural gasprices decline and remain competitive with coal pricesfor electricity generation. Although some new natural-gas-fired capacity comes on line during the period,much of the growth in electricity generation from natu-ral gas is based on increasing utilization of the nearly 200gigawatts of new natural-gas-fired capacity that wascompleted from 1999 through 2004. After 2015, risingnatural gas prices gradually tilt economic decisionstoward new coal-fired power plants. From 2015 to 2030,155 gigawatts of new coal-fired capacity is built, repre-senting 89 percent of the total coal builds from 2003 to2030.
In Canada, coal consumption increases from 69 milliontons in 2003 to 123 million tons in 2030. In the near term,Canada’s coal consumption remains relatively flat as theOntario government moves ahead with plans to shutdown all of the Province’s 7.6 gigawatts of coal-firedgenerating capacity by early 2009 [6]. The governmenthas indicated, however, that the shutdown will not becompleted until generation from alternative sources canbe secured. The decision to close the plants was basedprimarily on the premise that the adverse health andenvironmental impacts of the plants’ operation areunacceptable. In western Canada, where most of thecountry’s coal resources are located, increasing demandfor electricity is expected to result in the need for addi-tional coal-fired generating capacity.
OECD Europe
Coal consumption in OECD Europe increases by only 40million tons (5 percent) in the IEO2006 reference case;however, the region is and will continue to be a majormarket for coal. Coal consumption in OECD Europe, at887 million tons in 2003, represented 36 percent of totalOECD coal use. The major coal-consuming countries ofthe region, all with consumption of 65 million tons ormore in 2003, include Germany, Poland, Greece, Turkey,the United Kingdom, and the Czech Republic. AlthoughOECD Europe relies heavily on imports of hard coal,10
low-Btu lignite represents an important domesticallyproduced source of energy. In 2003, lignite accounted for47 percent of the region’s total coal consumption on atonnage basis and 23 percent on a Btu basis [7].
The stable outlook for coal consumption in OECDEurope represents a departure from the decline of 32percent that occurred between 1990 and 2003. In addi-tion to some planned and recently completed coal-firedcapacity additions in Turkey and Greece, renewed inter-est in coal is evidenced in a number of other countries inthe region, related to the replacement or refurbishmentof existing capacity. Electricity producers in Germany,Spain, France, Italy, Poland, the Czech Republic, andSlovakia have announced plans to upgrade or replaceexisting coal-fired generating facilities over the nexttwo decades. Power producers in Germany recentlyannounced plans to build 11.5 gigawatts of new coal-fired generating capacity by 2011, primarily as a replace-ment for existing plants [8]. A key incentive for the newcoal builds in Germany is a provision guaranteeing car-bon dioxide emission rights for the new capacity duringits first 14 years of operation.
Among the most important factors keeping OECDEurope’s coal consumption from increasing more rap-idly in the projections is the region’s relatively slowgrowth in overall energy consumption (0.7 percent per
Energy Information Administration / International Energy Outlook 2006 53
NorthAmerica
OECDEurope
OECDAsia
Total OECD0
2
4
6
8Billion Short Tons
1980 2003 2015 2030
Figure 50. OECD Coal Consumptionby Region, 1980, 2003, 2015, and 2030
Sources: 1980 and 2003: Energy Information Administration(EIA), International Energy Annual 2003 (May-July 2005), website www.eia.doe.gov/iea/. 2015 and 2030: EIA, System for theAnalysis of Global Energy Markets (2006).
10Internationally, the term “hard coal” is used to describe anthracite and bituminous coal. In data published by the International EnergyAgency, coal of subbituminous rank is classified as hard coal for some countries and as brown coal (with lignite) for others.

year). Contributing factors include continued penetra-tion of natural gas in both the electricity and industrialsectors, growing use of renewable fuels in the region,and continuing pressure on member countries of theEuropean Union to reduce subsidies that supportdomestic production of hard coal.OECD Asia
In 2003, the countries of OECD Asia (Australia, NewZealand, Japan, and South Korea) consumed 404 milliontons of coal, representing 16 percent of total OECD coalconsumption. In addition to being an important coal-consuming region, OECD Asia also plays an importantrole in the area of international coal trade. In 2003, Aus-tralia was the world’s leading coal exporter, supplying238 million tons of coal to the international market,while Japan and South Korea were the world’s leadingimporters, receiving 181 and 77 million tons of coal,respectively, from other countries [9].
In the IEO2006 reference case, coal consumption inOECD Asia increases by 156 million tons, to 560 milliontons in 2030. With little change projected for Japan’s coalconsumption, South Korea and Australia/New Zealandaccount for virtually all of the increase in the region.
Coal consumption in Australia and New Zealand in-creases by an average of 1.4 percent per year, from 147million tons in 2003 to 216 million tons in 2030. With sub-stantial coal reserves, Australia/New Zealand continuesto rely heavily on coal for electricity generation.Coal-fired power plants in the two countries supplied 73percent of their total electricity generation in 2003, andthey continue to supply more than 70 percent of genera-tion through 2030.
Electricity generation also drives the 94-million-ton ex-pansion in total coal consumption projected for SouthKorea between 2003 and 2030. South Korea’s generatingcompanies plan to add more than 8.0 gigawatts ofcoal-fired capacity from 2004 through 2010 [10], includ-ing two 800-megawatt units that came on line at KoreaSouth-East Power Company’s Yonghung plant in 2004.
Non-OECD Countries
Coal consumption in non-OECD countries increases by140 percent in the IEO2006 reference case, from 3.0 bil-lion tons in 2003 to 7.1 billion tons in 2030, led by strongeconomic growth and rising demand for energy inChina and India (Figure 51). The increase of 4.2 billiontons represents 81 percent of the projected increase intotal world coal consumption. In the non-OECD coun-tries, coal’s share of total energy consumption increasesslightly, from 29 percent in 2003 to 32 percent in 2030.
Coal consumption in non-OECD countries grows at anaverage annual rate of 4.5 percent from 2003 to 2015,
then slows to 2.4 percent per year from 2015 to 2030. Agradual slowing of economic growth in non-OECDAsia, which currently is expanding at a rapid pace,underlies the declining growth rate for non-OECD coalconsumption.
Tremendous growth in coal use is projected for Chinaand India. In total, the two countries’ coal consumptionincreases by 3.6 billion tons (3.9 percent per year) from2003 to 2030, representing 86 percent of the increase forthe non-OECD region. Coal consumption in the othernon-OECD countries grows by an average of 1.7 percentper year, expanding by 0.6 billion tons from 2003 to 2030.
Non-OECD Asia
China and India are very large countries in terms of bothpopulation and land mass, and both have substantialquantities of remaining coal reserves. Together, theyaccount for 70 percent of the projected increase in worldcoal consumption. Strong economic growth (averaging6.0 percent per year in China and 5.4 percent per year inIndia from 2003 to 2030) is projected for both countries,and much of the increase in their demand for energy,particularly in the industrial and electricity sectors, isexpected to be met by coal.
Coal use in China’s electricity sector increases from 16.3quadrillion Btu in 2003 to 50.1 quadrillion Btu in 2030, atan average rate of 4.2 percent per year (Figure 52). Incomparison, coal consumption in the U.S. power sectorgrows by 1.6 percent annually, from 20.2 quadrillion Btuin 2003 to 30.7 quadrillion Btu in 2030. At the end of 2003,China had an estimated 239 gigawatts of coal-fired
54 Energy Information Administration / International Energy Outlook 2006
Non-OECDEurope
and Eurasia
Non-OECDAsia
OtherNon-OECD
TotalNon-OECD
0
2
4
6
8Billion Short Tons
1980 2003 2015 2030
Figure 51. Non-OECD Coal Consumptionby Region, 1980, 2003, 2015, and 2030
Sources: 1980 and 2003: Energy Information Administration(EIA), International Energy Annual 2003 (May-July 2005), website www.eia.doe.gov/iea/. 2015 and 2030: EIA, System for theAnalysis of Global Energy Markets (2006).

capacity in operation. To meet the demand for electricitythat is expected to accompany its rapid economicgrowth, an additional 546 gigawatts of coal-fired capac-ity (net of retirements) is projected to be brought on linein China by 2030, requiring large financial investmentsin new coal-fired power plants and associated transmis-sion and distribution systems.
Nearly one-half (45 percent) of China’s coal use in 2003was in the non-electricity sectors, primarily in the indus-trial sector. China was the world’s leading producer ofboth steel and pig iron in 2003 [11]. Over the projectionperiod, coal demand in China’s non-electricity sectors isexpected nearly to triple, increasing by 26.1 quadrillionBtu. Despite such substantial growth, however, thenon-electricity share of total coal demand remains closeto the 2003 level. Coal remains the primary source ofenergy in China’s industrial sector, primarily becausethe country has only limited reserves of oil and naturalgas.
With a substantial portion of the increase in China’sdemand for both oil and natural gas projected to be metby imports, the Chinese government is actively promot-ing the development of a large coal-to-liquids industry.Initial production of coal-based synthetic liquids inChina is scheduled to commence in mid-2007 with thecompletion of the country’s first coal-to-liquids plant[12], located in the Inner Mongolia Autonomous Region.It is being built by the Shenhua Coal Liquefaction Cor-poration and will have an initial capacity of approxi-mately 60,000 barrels per day. In another development,China’s Shenhua and Ningxia Coal Groups have
initiated a feasibility study regarding the construction oftwo 80,000 barrel per day plants to be sited in theNingxia Autonomous Region and the Shaanxi Province.
In India, almost 70 percent of the growth in coal con-sumption is expected to be in the electric power sectorand most of the remainder in the industrial sector.In 2003, India’s coal-fired power plants consumed 5.0quadrillion Btu of coal, representing 69 percent of thecountry’s total coal demand. Coal use for electricity gen-eration in India is projected to grow by 2.7 percent peryear, to 10.3 quadrillion Btu in 2030, as an additional 94gigawatts of coal-fired capacity (net of retirements) isbrought on line. As a result, India’s coal-fired generatingcapacity more than doubles in the IEO2006 projections,from 67 gigawatts in 2003 to 161 gigawatts in 2030. Cur-rently, India’s government indicates that 16.5 gigawattsof new coal-fired generating capacity will be completedduring its tenth power plan period (a 5-year period end-ing in March 2007) and is targeting the completion ofmore than 50 gigawatts of new coal-fired capacity dur-ing its eleventh plan period (ending in March 2012) [13].
Like China, India relies heavily on imported oil to meetdemand. In 2003, approximately 65 percent of India’stotal oil supply originated from foreign producers. Cur-rently there are no coal-to-liquids projects under con-struction in India; however, a domestic coal-to-liquidsindustry would represent a viable means of increasingdomestic oil supply. The country’s Indian Oil Corpora-tion is evaluating construction of an 80,000-barrel-per-day coal liquefaction facility, which would be based onthe coal-to-liquids technology developed by the SouthAfrican company Sasol and would use both domesticand imported coal as feedstock [14]. Elsewhere in non-OECD Asia, Indonesia also is investigating the startupof a coal-to-liquids industry, primarily as a strategy tooffset declines in its petroleum production [15].
In other non-OECD Asia, coal consumption is projectedto grow by an average of 1.7 percent per year, from 206million tons in 2003 to 323 million tons in 2030, withincreases in both the industrial and electric power sec-tors. In the electric power sector, significant growth incoal consumption is expected in Taiwan, Vietnam, Indo-nesia, and Malaysia, where considerable amounts ofnew coal-fired generating capacity are either planned orunder construction.
Non-OECD Europe and Eurasia
Coal consumption in non-OECD Europe and Eurasia isprojected to increase at an average rate of 1.7 percent peryear, from 543 million tons in 2003 to 856 million tons in2030. The region contains a substantial amount of coalreserves. Russia alone has an estimated 173 billion tons
Energy Information Administration / International Energy Outlook 2006 55
1611
2
3032
23
4
59
50
37
3
89
Electricity Industrial Other Sectors Total0
20
40
60
80
100Quadrillion Btu
2003 2015 2030
Figure 52. Coal Consumption in China by Sector,2003, 2015, and 2030
Sources: 2003: Derived from Energy Information Adminis-tration (EIA), International Energy Annual 2003 (May-July2005), web site www.eia.doe.gov/iea/. 2015 and 2030: EIA,System for the Analysis of Global Energy Markets (2006).

of recoverable coal reserves (17 percent of the worldtotal), and the other countries in the region have an addi-tional 100 billion tons (10 percent of the world total).
Russia is the number one coal-consuming country in theregion. Its 2003 coal consumption, at 251 million tons,corresponded to 46 percent of total coal consumption innon-OECD Europe and Eurasia. In 2030, Russia’s coaluse is projected to total 382 million tons.
In 2003, coal supplied 16 percent of Russia’s total energyrequirements, and coal-fired power plants provided 20percent of its electricity. Although coal’s share of thecountry’s total energy consumption remains at about 16percent in the IEO2006 projections, its share of total elec-tricity generation declines to 10 percent in 2030. In mostcases, natural gas is expected to be the most economicaloption for new generating capacity in Russia. As a result,the natural gas share of Russia’s total electricity genera-tion rises from 40 percent in 2003 to 54 percent in 2030.
Although Russia’s long-term energy strategy calls forconsiderable new nuclear generating capacity, the gov-ernment maintains that fossil-fuel-fired plants will con-tinue in their role as the primary source for electricpower generation through 2020 [16]. For new fossil-firedgenerating capacity, Russia’s energy strategy promotesthe construction of advanced coal-fired capacity in thecoal-rich Siberian region (central Russia) and recom-mends a focus on efficient natural-gas-fired capacity forthe western and far eastern areas of the country.
In other non-OECD Europe and Eurasia, coal consump-tion is projected to increase from 292 million tons in 2003to 474 million tons by 2030, growing by 1.8 percent peryear on average. Plans for both new coal-fired capacityand the refurbishment of existing capacity in a numberof countries, including Bosnia and Herzegovina, Serbiaand Montenegro, Bulgaria, Romania, and Ukraine, is asignificant indicator that coal will continue to be animportant source of energy for the region [17].
Africa
Africa’s coal consumption is projected to increase by 117million tons from 2003 to 2030. South Africa currentlyaccounts for 93 percent of the coal consumed in the con-tinent and is expected to continue to account for much ofthe increase in Africa’s total coal consumption over theprojection period in both the electricity and industrialsectors.
In South Africa, increasing demand for electricity inrecent years has led to the decision by Eskom, the coun-try’s state-owned electricity supplier, to restart threelarge coal-fired plants (Camden, Grootvlei, and Komati)that have been closed for more than a decade [18]. The
individual units at the plants, with a combined generat-ing capacity of 3.8 gigawatts, are scheduled to return toservice during the years 2005 through 2011. Projectionsof power shortages for southern Africa in the latter halfof this decade have led to increased interest in newcoal-fired power projects not only in South Africa butalso in Zimbabwe, Tanzania, Swaziland, and Botswana[19].
In the industrial sector, increasing use of coal in Africa isexpected for several purposes, including the productionof steam and process heat for industrial applications,production of coke for the steel industry, and produc-tion of coal-based synthetic liquids. Currently, two com-mercial-sized coal-to-liquids plants (Sasol II and SasolIII) in South Africa supply about 28 percent of the coun-try’s total liquid fuel requirements [20]. The two plantstogether are capable of producing 150,000 barrels of syn-thetic liquids per day.
Central and South America
The countries of Central and South America consumed35 million tons of coal in 2003. Brazil, with the world’sninth largest steel industry in 2003, accounted for 68 per-cent of the region’s coal demand, and much of theremainder occurred in Colombia, Chile, Puerto Rico,Peru, and Argentina [21].
In the projections, coal consumption in Central andSouth America increases by 39 million tons from 2003 to2030, with 56 percent of the increase in Brazil, primarilyfor coke manufacture and electricity generation. Brazil’ssteel companies currently plan to expand productioncapacity by a substantial amount over the next few yearsto meet increasing domestic and international demandfor steel [22]. Brazil’s three southernmost states, RioGrande do Sul, Santa Catarina, and Parana, which con-tain most of the country’s coal reserves, are actively pro-moting the construction of several new coal-fired powerplants [23]. The new coal projects being promoted by thegovernment of Rio Grande do Sul represent a key com-ponent of its plan to become more self-sufficient in elec-tricity supply.
Middle East
Countries of the Middle East consumed 16 million tonsof coal in 2003. Israel accounted for 87 percent of the totaland Iran most of the remainder. The region’s coal con-sumption increases only slightly in the projections, to 19million tons in 2030.
TradeMost of the countries that consume significant amountsof coal have their own domestic coal resources. For thatreason, the volume of world coal trade tends to be smallrelative to worldwide coal consumption. In 2003, only 13
56 Energy Information Administration / International Energy Outlook 2006

percent of the coal consumed around the world wasimported. In the IEO2006 reference case, coal tradegrows at an average rate of 1.5 percent per year, from764 million tons in 2004 to 1,122 million tons in 2030(Figure 53 and Table 11), and its share of total world coalconsumption falls to 11 percent in 2030.
Although both steam coal and metallurgical (coking)coal are traded internationally, steam coal—used pri-marily for electricity generation but also for other indus-trial applications, including for direct heat and forpulverized coal injection in the steel industry—predom-inates, accounting for 72 percent of international coaltrade in 2030. The largest increase in steam coal importsis projected for South Korea, where economic expansionand population growth are expected to stimulate anexpansion of coal-fired electricity generation. The larg-est increase in imports of coking coal is projected forChina, from 7 million tons in 2004 to 59 million tons in2030.
Countries that import coal do so for a variety of reasons.For countries like Malaysia, which has a national fueldiversity goal, coal imports may be an important part ofa secure energy supply strategy. Others, such as Japan,South Korea, and the countries of OECD Europe, maylack, or may have depleted, their own resources. Stillothers, like China and India, may require coal importsto supplement their own domestic supplies. Coalquality may also be a factor. For example, Indonesia’slow-sulfur coal is in demand by electricity generators
required to comply with environmental regulationsin the United States. Coal-exporting countries typi-cally have large reserves of high-quality coal and pro-duction capacity exceeding their own domestic demandrequirements.
The six largest exporters of coal in 2004 were Australia,Indonesia, China, South Africa, Colombia, and theUnited States. Australia has large reserves of high-quality coal that is suitable for both electricity genera-tion and industrial applications. In the projections,Australia remains the world’s foremost coal exporterthrough 2030, while Indonesia holds a distant secondplace. Australia and Indonesia both benefit from theirhighly productive mines and proximity to Asian mar-kets. China continues to export some coal even as itsimports increase to meet domestic demand. Colombia, arelative newcomer to maritime coal trade, is the thirdlargest exporter of coal in 2030, and Vietnam increasesits share of world coal trade to 5 percent in 2030.
In anticipation of future coal trade volumes, exportingcountries are investing in their port, coal mining, andcoal transportation infrastructures. Australia has plansto expand the total export capacity of its coal terminals atAbbot Point, Dalrymple Bay, Hay Point, R G Tanna,Barney Point, and Fisherman Islands by about 55 milliontons by 2010. In addition, a feasibility study in Australiais underway for a terminal at Wiggins Island in Queens-land, with a throughput capacity of 22 million tons.Australia also plans to expand rail transportation capac-ity in Queensland to 281 million tons [24]. Richards BayCoal Terminal in South Africa aspires to reach 101 mil-lion tons of throughput capacity by 2008 [25]. Venezuelahas cumulative coal export capacity expansion plans of24 million tons by 2009 [26], and additional port expan-sions are also planned in Vietnam [27].
Asia
Primarily as a result of China’s growing demand forcoal, the largest increases in imports of both steam andmetallurgical coal are projected for Asia. Currently a netexporter of coal, China is expected to import 22 milliontons more than it exports in 2030. Lacking coal resourcesof its own, Japan is expected to remain the world’s larg-est importer of coal in 2030, despite a decline of 10 mil-lion tons from its import total in 2004. South Koreaproduces a small amount of coal domestically, but in2030 it still will import most of the coal it consumes.South Korea and Taiwan, with planned increases incoal-fired capacity, together are projected to increasetheir share of world steam coal imports from 22 percentin 2004 to 27 percent in 2030. In India, coal imports areexpected to double from 2004 to 2030.
Australia remains the largest provider of steam coalexports to Asia in the projections. In addition, Vietnam,
Energy Information Administration / International Energy Outlook 2006 57
Coking Steam Total0
200
400
600
800
1,000
1,200Million Short Tons
1985 2004 2015 2030
Figure 53. World Coal Trade, 1985, 2004, 2015,and 2030
Sources: 1985: Energy Information Administration (EIA),Annual Prospects for World Coal Trade 1987, DOE/EIA-0363(87) (Washington, DC, May 1987). 2004: SSY Consul-tancy and Research, Ltd., SSY's Coal Trade Forecast, Vol. 14,No. 3 (London, UK, September 2005); and Energy InformationAdministration, Quarterly Coal Report, October-December2004, DOE/EIA-0121(2004/4Q) (Washington, DC, March2005). 2015 and 2030: Energy Information Administration,National Energy Modeling System, run IEO2006.D041306A.

58 Energy Information Administration / International Energy Outlook 2006
Table 11. World Coal Flows by Importing and Exporting Regions, Reference Case, 2004, 2015, and 2030(Million Short Tons)
Exporters
Importers
Steam Coking Total
Europe a Asia Americas Total b Europe a Asia c Americas Total b Europe a Asia Americas Total b
2004Australia . . . . . . . . . . . 6.3 109.8 3.3 119.4 30.6 88.5 9.1 128.2 36.9 198.3 12.4 247.6
United States. . . . . . . . 3.6 2.3 16.1 22.0 13.4 5.2 7.4 26.0 17.0 7.4 23.6 48.0
South Africa. . . . . . . . . 68.6 2.4 0.7 73.7 0.8 0.0 0.4 1.2 69.3 2.4 1.1 74.9
Former Soviet Union . . 36.0 11.7 0.2 47.9 2.1 5.6 0.0 7.8 38.1 17.3 0.2 55.7
Poland . . . . . . . . . . . . . 15.1 0.0 0.1 15.2 1.0 0.1 0.0 1.1 16.0 0.1 0.2 16.3
Canada . . . . . . . . . . . . 0.0 0.6 1.6 2.2 9.2 12.8 4.4 26.6 9.2 13.3 6.1 28.8
China . . . . . . . . . . . . . . 4.2 84.2 0.8 89.2 0.0 6.3 0.0 6.3 4.2 90.4 0.8 95.5
South Americad . . . . . . 37.0 0.0 28.5 65.9 0.0 0.0 0.0 0.0 37.0 0.0 28.5 65.9
Vietnam . . . . . . . . . . . . 0.3 9.9 0.0 10.3 0.0 0.0 0.0 0.0 0.3 9.9 0.0 10.3
Indonesia/Othere . . . . . 17.6 81.7 3.4 103.5 0.2 17.3 0.1 17.6 17.8 99.0 3.5 121.2
Total . . . . . . . . . . . . . 188.8 302.5 54.8 549.2 57.3 135.7 21.5 214.8 246.0 438.3 76.3 764.0
2015
Australia . . . . . . . . . . . 5.0 112.0 0.0 116.9 30.3 124.1 10.9 165.4 35.3 236.1 10.9 282.3
United States. . . . . . . . 4.9 1.4 5.4 11.7 0.2 0.0 14.2 14.4 5.1 1.4 19.6 26.1
South Africa. . . . . . . . . 62.8 19.8 6.3 88.9 0.9 0.0 0.7 1.7 63.8 19.8 7.0 90.5
Former Soviet Union . . 44.0 23.7 0.0 67.7 3.2 9.4 0.0 12.5 47.2 33.0 0.0 80.2
Poland . . . . . . . . . . . . . 6.6 0.0 0.1 6.7 1.1 0.0 0.0 1.1 7.7 0.0 0.1 7.8
Canada . . . . . . . . . . . . 0.0 0.0 3.3 3.3 18.9 15.6 1.3 35.8 18.9 15.6 4.6 39.1
China . . . . . . . . . . . . . . 0.0 89.4 1.0 90.4 0.0 6.9 0.0 6.9 0.0 96.3 1.0 97.3
South Americad . . . . . . 59.6 0.0 43.4 103.0 0.0 0.0 0.0 0.0 59.6 0.0 43.4 103.0
Vietnam . . . . . . . . . . . . 0.0 30.9 0.0 30.9 0.0 0.0 0.0 0.0 0.0 30.9 0.0 30.9
Indonesia/Othere . . . . . 3.6 123.1 2.1 128.7 0.5 15.0 0.0 15.4 4.1 138.0 2.1 144.2
Total . . . . . . . . . . . . . 186.5 400.2 61.5 648.2 55.1 171.0 27.2 253.2 241.6 571.2 88.7 901.4
2030
Australia . . . . . . . . . . . 7.3 170.2 0.0 177.5 36.1 155.5 15.3 206.9 43.4 325.7 15.3 384.4
United States. . . . . . . . 2.8 1.4 6.1 10.3 0.6 0.0 17.9 18.6 3.4 1.4 24.1 28.9
South Africa. . . . . . . . . 64.3 23.8 11.0 99.0 0.0 0.0 0.8 0.8 64.3 23.8 11.8 99.8
Former Soviet Union . . 44.0 28.8 0.0 72.8 6.5 11.0 0.0 17.5 50.5 39.8 0.0 90.3
Poland . . . . . . . . . . . . . 4.0 0.0 0.4 4.4 0.6 0.0 0.0 0.6 4.5 0.0 0.4 5.0
Canada . . . . . . . . . . . . 0.0 0.0 3.3 3.3 18.3 21.5 1.7 41.6 18.3 21.5 5.0 44.9
China . . . . . . . . . . . . . . 0.0 94.9 3.2 98.1 0.0 7.7 0.0 7.7 0.0 102.6 3.2 105.8
South Americad . . . . . . 51.0 0.0 92.7 143.7 0.0 0.0 0.0 0.0 51.0 0.0 92.7 143.7
Vietnam . . . . . . . . . . . . 0.0 59.5 0.0 59.5 0.0 0.0 0.0 0.0 0.0 59.5 0.0 59.5
Indonesia/Othere . . . . . 0.0 137.5 7.0 144.5 0.4 15.0 0.0 15.4 0.4 152.5 7.0 159.9
Total . . . . . . . . . . . . . 173.3 516.1 123.8 813.2 62.5 210.7 35.7 309.0 235.8 726.9 159.6 1,122.2
aEurope/Mediterranean, including coal shipments to the Middle East and Africa.bIn 2004, total world coal flows include a balancing item used to reconcile discrepancies between reported exports and imports. The 2004
balancing items by coal type were 3.2 million tons (steam coal), 0.3 million tons (coking coal), and 3.4 million tons (total).cIncludes 15.4 million tons of coal for pulverized coal injection at blast furnaces shipped to Japanese steelmakers in 2004.dCoal exports from South America are projected to originate from mines in Colombia and Venezuela.eIncludes shipments from other countries not modeled for the projection period. The 2004 exports from other countries by coal type were
3.1 million tons (steam coal), 2.2 million tons (coking coal), and 5.3 million tons (total).Notes: Data exclude non-seaborne shipments of coal to Europe and Asia. Totals may not equal sum of components due to independent
rounding.Sources: 2004: SSY Consultancy and Research, Ltd., SSY's Coal Trade Forecast, Vol. 14, No. 3 (London, UK, September 2005); and
Energy Information Administration, Quarterly Coal Report, October-December 2004, DOE/EIA-0121(2004/4Q) (Washington, DC, March2005). 2015 and 2030: Energy Information Administration, National Energy Modeling System, run IEO2006.D041306A.

a relatively new competitor in international coal trade,competes strongly in the Asian market by 2030. Its prox-imity to China will be instrumental in the growth ofVietnam’s coal export volume from 10 million tons in2004 to nearly 60 million tons in 2030.
Europe, Middle East, and Africa
Total coal imports to the Europe/Mediterranean market(including the Middle East and Africa) decline in theprojections (Figure 54). For most European countries,with increasing emphasis on natural gas in the powersector, coal becomes a less significant component of thefuel mix for electricity generation. In Turkey, however,economic expansion and steel industry growth partiallyoffset the decline in Europe’s coal imports. In addition,with the phaseout of mining subsidies in Europe,imports of coal from South America and Russia increase.
The Americas
The United States is projected to import 91 million tonsof coal in 2030, 64 million tons more than in 2004.Although this is still a small share of overall U.S.consumption, at 5.0 percent, it represents a shift for theUnited States from being a net exporter to being anet importer. With declining productivity and miningdifficulties in Central Appalachia and rising demandfor coal in the Southeast, imports become increasinglycompetitive with domestic U.S. coal production.Already, plans are being made to expand U.S. ports to
accommodate coal imports. For example, Dominion Ter-minal Associates has announced plans to add 7 milliontons of coal import port capacity in Virginia by 2008 [28].In recent years, Canada has been the largest importer ofU.S. coal; however, Ontario’s plans to close its fivecoal-fired generating plants by 2009 will reduce U.S.exports of steam coal by about 10 million tons between2004 and 2030 [29].
Brazil, with rich reserves of iron ore but no coking gradecoal, will fuel the planned expansion of its steel industrywith imports from Australia, South Africa, and theUnited States. Coking coal imports to Brazil are pro-jected to grow by 16 million tons from 2004 to 2030, at anaverage rate of 2.9 percent per year. Much of the coalimported by the countries of Central and South Americais expected to come from Australia and from SouthAmerican coal producers—in particular, Colombia.Colombia is also expected to increase its coal exports tothe United States.
References
Energy Information Administration / International Energy Outlook 2006 59
1995 2004 2010 2015 2020 2025 20300
200
400
600
800
1,000
1,200Million Short Tons
History Projections
Europe/Mediterranean
Asia
Total
Americas
Figure 54. Coal Imports by Major ImportingRegion, 1995-2030
Sources: History: SSY Consultancy and Research, Ltd.,SSY's Coal Trade Forecast, Vol. 14, No. 3 (London, UK, Sep-tember 2005); International Energy Agency, Coal Information2001 (Paris, France, September 2001), and previous issues;and Energy Information Administration, Quarterly Coal Report,October-December 2004, DOE/EIA-0121(2004/4Q) (Washing-ton, DC, March 2005), and previous issues. Projections:Energy Information Administration, National Energy ModelingSystem run IEO2006.D041306A.
1. Energy Information Administration (EIA), Interna-tional Energy Annual 1989, DOE/EIA-0219(89)(Washington, DC, February 1991), Table 36; andEIA, International Energy Annual 2001, DOE/EIA-0219(2001) (Washington, DC, March 2003), Table8.2.
2. World Energy Council, 2004 Survey of EnergySources, 20th Edition (London, UK, December 2004),pp. 22-23.
3. Energy Information Administration, InternationalEnergy Annual 2003, web site www.eia.doe.gov/iea/ (May-July 2005), Table 2.5.
4. Energy Information Administration (EIA), MonthlyEnergy Review, February 2006, DOE/EIA-0035(2006/02) (Washington, DC, February 23, 2006),Table A5; and EIA, Coal Market Module of theNational Energy Modeling System, Model Documenta-tion 2005, DOE/EIA-M060(2005) (Washington, DC,April 2005), p. 64.
5. International Energy Agency, Coal Information 2005(Paris, France, August 2005), p. II.23.
6. Ontario Ministry of Energy, “Electricity Informa-tion,” web site www.energy.gov.on.ca (accessedMarch 13, 2006); S. Hooks, Platts Coal Trader (Janu-ary 25, 2006); and B. Meadows, “Coal Plants Toast,”The Chronicle Journal (June 16, 2005), web site www.chroniclejournal.com.
7. Energy Information Administration, InternationalEnergy Annual 2003, web site www.eia.doe.gov/iea(May-July 2005), Table 5.4; and InternationalEnergy Agency, Databases for the Coal Information2005, web site http://data.iea.org.

60 Energy Information Administration / International Energy Outlook 2006
8. V. Eckert, “German Generators Turn to Coal as GasPrices Soar” (Reuters, February 6, 2006), web sitehttp://today.reuters.com; and “At Least Ten NewCoal Plants Planned in Germany,” McCloskey’s CoalReport, No. 127 (January 27, 2006), pp. 22-23.
9. SSY Consultancy and Research Ltd., SSY’s CoalTrade Forecast, Vol. 14 No. 3 (London, United King-dom, September 2005).
10. C. Bergesen, “Platts UDI Country Profile: SouthKorea,“ Platts (February 10, 2005), web sitewww.platts.com; “South Korea’s Power IndustryHas Been Restructured,” Power Engineering Interna-tional, Vol. 13, No. 3 (March 1, 2005); Korea MidlandPower Company, Ltd., “Nationwide ConstructionStatus (As of the end of May 2005),” web sitewww.komipo.co.kr; “S Korea Posco To LiquidatePosenergy Unit,” Dow Jones International News (May27, 2001); Korea South-East Power Company, Ltd.,web site www.kosep.co.kr; and “Korea: 5thLong-Term Power Development Plan,” Interna-tional Market Insight Reports (February 10, 2000).
11. Web site www.worldsteel.org.12. Economic and Commercial Section of the Consulate
General of the People’s Republic of China inKuching, “Coal-to-Oil Project To Ease Energy Bot-tleneck” (November 18, 2005), web sitehttp://kuching2.mofcom.gov.cn; Theo L.K. Lee,“Coal Liquefaction Technologies-Direct and Indi-rect Routes,” presentation at APEC Clean FossilEnergy Technical and Policy Seminar (Cebu City,Philippines, January 26-28, 2005), web site www.apec-egcfe.org; and E. Ganter, “Sasol Overview andStrategic Drivers,” presentation at the Credit SuisseFirst Boston Global Oil & Gas Conference (London,United Kingdom, June 8, 2005), web site www.sasol.com.
13. Government of India, Central Electricity Authority,Monthly Report On Broad Status of Thermal Power Pro-jects in the Country (December 2005), web site www.cea.nic.in (accessed March 1, 2006); Government ofIndia, Central Electricity Authority, 11th Plan Shelfof Thermal Power Projects, web site www.cea.nic.in(accessed March 1, 2006).
14. A. Airy and S. Narayan, “IOC Plans First Commer-cial Coal-to-Liquid Project,” The Financial Express(April 13, 2006), web site www.financialexpress.com; and Global Insight, “India: Sasol TargetsIndia’s CTL Potential” (March 7, 2006), web sitehttp://myinsight.globalinsight.com.
15. N. Chatterjee, “World May Turn Back Clock for Liq-uid Coal Future,” Reuters (April 21, 2006), web sitehttp://today.reuters.com; and Global Insight,“Indonesia: Sasol Eyeing CTL Partnership WithBumi Resources in Indonesia” (March 22, 2006),web site http://myinsight.globalinsight.com.
16. Commission of the European Communities, Com-mission Staff Working Paper—Energy Dialogue withRussia, Update on Progress, SEC(2004)114 (Brussels,Belgium, January 28, 2004), pp. 37-57, web sitewww. europa.eu.int.
17. “EiEE New/Repowering Generation ProjectTracker—September 2005,” Energy in East Europe,No. 72 (September 16, 2005), pp. 9-39.
18. “Erwin Writes on Power-Generation Challenges,”Creamer Media’s Mining Weekly (February 23, 2006),web site www.miningweekly.co.za; M. Faniso,“Eskom Signs R1.8bn Deal With Siemens,” BusinessReport (July 22, 2005), web site www.eskom.co.za;World Markets Research Centre, “South Africa:Eskom Recommissions Mothballed Power PlantsTo Boost Supplies” (May 10, 2005), web sitewww.worldmarketsanalysis.com; and IEA CoalResearch, CoalPower5 Database (2005).
19. P. Nyakazeya, “Rio Tinto Seeks Partners forSengwa Coal Project,” The Herald (Harare) (April 5,2005), web site www.allafrica.com; “Tanzania NowTo Pay $2.5m Monthly to Songas,” LiquidAfricaHolding Limited (June 11, 2004); C. Baputaki,“Makwinja Takes Over as MCL Board Chair,”Mmegi/The Reporter (Gaborone) (April 29, 2005),web site www.allafrica.com; and “Swaziland: PlansTo Expand Power Production,” UN IntegratedRegional Information Networks (May 4, 2005), website www.allafrica.com.
20. E. van de Venter, “Sasol Coal-to-Liquids Develop-ments,” presentation at Gasification TechnologiesCouncil Conference (San Francisco, CA, October10-12, 2005), web site www.gasification.org.
21. Web site www.worldsteel.org; and Energy Infor-mation Administration, International Energy Annual2003, web site www.eia.doe.gov/iea/ (May-July2005), Table 1.4.
22. “Brazilian Mills Plan To Raise Capacity by 30%,”Steel Business Briefing (September 21, 2004), web sitewww.steelbb.com; and “Brazil Steel Sector ToInvest $8.0 Bln in Capacity Expansion by 2009,” Por-tuguese News Digest (August 21, 2003).
23. “Aneel Approves Transfer of Coal-Fired Project toEleja,” Business News Americas (April 29, 2005);“Czech Republic Eyes Brazil Rio Grande do SulEnergy Sector,” Latin America News Digest (March22, 2005); “Rio Grande do Sul To Hold Referendumon 650MW Coal Project,” Business News Americas(December 7, 2004); and “Rio Grande do Sul:US$5bn To Double Capacity by 2010,” BusinessNews Americas (May 24, 2004).
24. The State of Queensland, Department of NaturalResources and Mines, Queensland’s Ports (October2005), pp. 16-17, web site www.nrm.qld.gov.au/mines/coal/rail_ports.html.

Energy Information Administration / International Energy Outlook 2006 61
25. “Richards Bay To grow to 92 mt/yr,” McCloskey’sCoal Report, No. 123 (November 11, 2005), p. 1.
26. “Venezuela Moves on Socuy and Cape Port,”McCloskey’s Coal Report, Issue 117, (August 19, 2005)p. 23.
27. H. Nam, “A New and Improved Coal DevelopmentPlan,” Vietnam Economic News (February 23, 2006),web site www.ven.org.vn.
28. “Dominion Announces 7 mt/yr Import Terminal,”McCloskey’s Coal Report, No. 25 (December 9, 2005),p. 1.
29. Energy Information Administration, National Ener-gy Modeling System, run IEO2006.D041306A.


Chapter 6
ElectricityWorld electricity consumption doubles in the IEO2006 projections from 2003 to 2030.Non-OECD countries account for 71 percent of the projected growth,and OECD countries account for 29 percent.
In the IEO2006 reference case, the world’s total net elec-tricity consumption11 doubles, growing at an averagerate of 2.7 percent per year, from 14,781 billion kilowatt-hours in 2003 to 21,699 billion kilowatthours in 2015 and30,116 billion kilowatthours in 2030 (Figure 55). Non-OECD countries account for 71 percent of the projectedgrowth and OECD countries 29 percent.
This chapter examines the future of electricity demandand supply, beginning with a discussion of regionaldemand and trends anticipated over the 27-year projec-tion period. The remainder of the chapter discusses theprojections for electricity generating capacity and elec-tricity generation from competing fuel options. Detailedtables showing regional net electricity consumption,installed generating capacity, fuel use for electricity gen-eration,12 and generation are included in Appendix F.
Net Electricity ConsumptionProjected growth in net electricity consumption is mostrapid among the non-OECD economies of the world,
with annual average growth of 3.9 percent from 2003 to2030 (Figure 56), compared with 1.5 percent for OECDeconomies. China and the United States lead the growthin annual net electricity consumption with increases of4,300 and 1,963 billion kilowatthours, respectively, overthe projection period.
OECD Economies
In the OECD economies, the electricity sector is wellestablished, and equipment efficiency gains areexpected to temper growth in electricity demand. Inaddition, slower population growth is expected for theOECD economies than for the non-OECD economies;and some European countries, as well as Japan, areexpected to see their populations decline. Electricity usein the OECD economies as a whole increases relativelyslowly as a result, from 8,823 billion kilowatthours in2003 to 10,885 billion kilowatthours in 2015 and 13,208billion kilowatthours in 2030.
In 2003, nearly 60 percent of total net electricity con-sumption in the OECD economies was in the buildings
Energy Information Administration / International Energy Outlook 2006 63
14,781
19,04521,699
24,37127,133
30,116
2003 2010 2015 2020 2025 20300
5,000
10,000
15,000
20,000
25,000
30,000
35,000Billion Kilowatthours
History Projections
Figure 55. World Net Electricity Consumption,2003-2030
Sources: 2003: Energy Information Administration (EIA),International Energy Annual 2003 (May-July 2005), web sitewww.eia.doe.gov/iea/. Projections: EIA, System for the Anal-ysis of Global Energy Markets (2006).
1980 1990 2003 2010 2020 20300
5,000
10,000
15,000
20,000Billion Kilowatthours
History Projections
OECD
Non-OECD
Figure 56. World Net Electricity Consumptionby Region, 1980-2030
Sources: History: Energy Information Administration (EIA),International Energy Annual 2003 (May-July 2005), web sitewww.eia.doe.gov/iea/. Projections: EIA, System for the Anal-ysis of Global Energy Markets (2006).
11In IEO2006, “net electricity consumption” equals total electricity generation, plus electricity imports, minus electricity exports, minuselectricity used within the power station, minus electricity distribution losses as electricity flows from the power plant to the end user.
12In the SAGE model it is possible to distinguish between the electricity generated and heat produced by combined heat and power(CHP) plants; however, it is not possible to determine separately the quantities of each fuel used for electricity generation and for produc-tion of heat. Thus, “fuel for electricity generation” also includes fuel that more properly would be attributed to heat production.

sectors (residential and commercial). The remainderwas consumed in the industrial sector, except for a smallamount (1 percent) used by mass transit trains andbuses. The relative shares of electricity consumption bysector do not change by more than 2 percent in the pro-jections (Figure 57). Overall, net electricity consumptionin OECD countries increases by 50 percent from 2003 to2030, mostly as a result of increasing penetration and useof consumer electronics, office equipment, and telecom-munications technologies.
In the United States, electricity demand increases from3,669 billion kilowatthours in 2003 to 5,619 billion kilo-watthours in 2030. Demand growth in the commercialsector is particularly strong, averaging 2.2 percent peryear. Additions to commercial floorspace, the continu-ing penetration of new telecommunications technolo-gies, and increased use of office equipment offsetefficiency gains for electric equipment in the sector.Moderate increases are projected for electricity con-sumption in the industrial and residential sectors, aver-aging 0.8 percent per year and 1.5 percent per year,respectively. A similar pattern is projected for Canada,where net electricity consumption grows from 521 bil-lion kilowatthours in 2003 to 660 billion kilowatthours in2015 and 776 billion kilowatthours in 2030.
The most rapid growth in net electricity use among theOECD countries is projected for Mexico, averaging 4.1percent per year overall and 5.8 percent per year in boththe residential and commercial sectors. To date, popularopposition in Mexico’s Congress and electricity unionsto regulatory reform and incentives for private invest-ment has slowed the development of the country’s elec-tricity sector [1]; however, such changes will be needed
if growth in the demand for electricity is to be matchedby adequate growth in electricity supply.
In OECD Europe, net electricity consumption increasesfrom 2,965 billion kilowatthours in 2003 to 4,107 billionkilowatthours in 2030. OECD Europe’s drive to reducecross-border barriers throughout the regional economyis expected to increase competition in its electricity andnatural gas markets, offsetting some of the cost increasesresulting from reduced reliance on coal-fired andnuclear power plants and increased reliance on naturalgas and renewables for electricity production.
For OECD Asia, projected growth in net electricity con-sumption is slightly more rapid than it is for OECDEurope, averaging 1.3 percent per year. South Korealeads the increase, with average annual growth of 2.9percent in industrial electricity consumption, 2.7 percentin residential electricity consumption, and 2.5 percent incommercial electricity consumption.
Non-OECD Economies
Electricity consumption in the non-OECD economiesgrows at an average annual rate of 3.9 percent from 2003to 2030. Non-OECD Asia has the highest growth rate at4.7 percent per year, followed by Central and SouthAmerica at 3.7 percent, the Middle East at 3.0 percent,Africa at 2.9 percent, and non-OECD Europe and Eur-asia at 2.8 percent. The average annual growth ratestranslate to a near tripling of net electricity consumptionin the non-OECD nations over the projection period. In2003, non-OECD economies consumed 40 percent of theworld’s electricity; in 2030 their share is projected to be56 percent. Growth in net electricity consumption for thenon-OECD economies is driven in large part by assump-tions about GDP and population growth.
From 2003 to 2030, residential electricity consumptionfor the non-OECD economies as a whole grows from 23percent to 30 percent of total net electricity consumption.In absolute terms, nearly four times as much electricity isconsumed in the residential sector in 2030 than wasconsumed in 2003 (Figure 58), supporting a major trans-formation in living standards as electric lighting, appli-ances, and new technologies become available to anincreasing share of the world’s population. Electricityconsumption growth in the non-OECD industrial sectoris somewhat slower than in the buildings sectors,despite the rapid adoption of consumer electronics andcomputers for business use [2, 3]. As a result, the indus-trial sector share of total non-OECD electricity demanddeclines from 61 percent in 2003 to 54 percent in 2030,even as industrial electricity use more than doubles.
In non-OECD Europe and Eurasia, electricity demandincreases at an average annual rate of 2.8 percentfrom 2003 to 2030. Many countries in the region areattempting to reform or liberalize their electricity sec-tors—for the most part to attract much-needed private
64 Energy Information Administration / International Energy Outlook 2006
Residential Commercial Industrial Transportation0
2,000
4,000
6,000
8,000
10,000Billion Kilowatthours
2003 2015 2030
Figure 57. Net Electricity Consumptionin OECD Countries by End-UseSector, 2003, 2015, and 2030
Sources: 2003: Derived from Energy Information Adminis-tration (EIA), International Energy Annual 2003 (May-July2005), web site www.eia.doe.gov/iea/. 2015 and 2030: EIA,System for the Analysis of Global Energy Markets (2006).

and foreign investment to repair and expand aging andneglected infrastructure. Net electricity consumption innon-OECD Europe and Eurasia climbs from 1,350 billionkilowatthours in 2003 to 2,850 billion kilowatthours in2030.
Residential electricity consumption growth in the non-OECD Asia region is by far the fastest in the world, at6.5 percent per year, driven by population growth andrising living standards. In 2030, residential electricityconsumption in the region totals 3,016 billion kilowatt-hours, or nearly four times its 2003 level. In the commer-cial and industrial sectors, electricity consumptiongrows strongly, at average annual rates of 4.8 and4.0 percent to 1,291 and 5,653 billion kilowatthours,respectively, in 2030. The continuing challenge for theeconomies of non-OECD Asia will be to develop reliableelectricity supplies steadily and avoid shortages orexcess capacity.
Other non-OECD regions also show robust growth indemand for electricity in the IEO2006 reference case. InAfrica and the Middle East, annual increases averageabout 3 percent from 2003 to 2030. Total electricitydemand increases to 951 billion kilowatthours in Africaand 1,034 billion kilowatthours in the Middle East. Inboth regions, most of the demand growth is expected inthe industrial and residential sectors. In Central andSouth America, net electricity consumption increases by3.7 percent per year on average, to 2,047 billion kilo-watthours in 2030, with the residential, commercial, and
industrial sectors each accounting for approximatelyone-third of the total.
Electricity SupplyTo meet the world’s electricity demand over the 2003 to2030 projection period, an extensive expansion ofinstalled generating capacity will be required. In the ref-erence case, worldwide installed electricity generatingcapacity grows from 3,710 gigawatts in 2003 to 6,349gigawatts in 2030, at an average rate of 2.0 percent peryear (Figure 59).
The fuels used in the additional generating capacityneeded to meet the demand projection in IEO2006 varyfrom region to region, as a function of available naturalresources, energy security concerns, and market compe-tition among fuel choices (see box on page 66), as well asother factors. Electricity suppliers must decide howmuch capacity of each generation technology to build,and then they must decide when to use the differenttypes of capacity, balancing the costs and flexibility ofthe different technologies in their generation fleets.Baseload systems usually are operated over the longestperiods and produce the most electricity per unit ofinstalled capacity. For example, in the United Statescoal-fired steam plants represent 35 percent of the coun-try’s installed capacity but 52 percent of its total electric-ity production. In contrast, natural-gas- and oil-firedunits13 represent 43 percent of U.S. capacity but only 18percent of electricity production.
Energy Information Administration / International Energy Outlook 2006 65
Residential Commercial Industrial Transportation0
2,000
4,000
6,000
8,000
10,000Billion Kilowatthours
2003 2015 2030
Figure 58. Net Electricity Consumptionin Non-OECD Countries by End-UseSector, 2003, 2015, and 2030
Sources: 2003: Derived from Energy Information Adminis-tration (EIA), International Energy Annual 2003 (May-July2005), web site www.eia.doe.gov/iea/. 2015 and 2030: EIA,System for the Analysis of Global Energy Markets (2006).
2003 2010 2015 2020 2025 20300
2,000
4,000
6,000
8,000Gigawatts
Coal
Natural Gas
Renewables
Nuclear
Oil
Figure 59. World Electricity Generating Capacityby Fuel Type, 2003-2030
Sources: 2003: Derived from Energy Information Adminis-tration (EIA), International Energy Annual 2003 (May-July2005), web site www.eia.doe.gov/iea/. 2010-2030: EIA, Sys-tem for the Analysis of Global Energy Markets (2006).
13Most technologies that generate electricity from natural gas are also capable (with some mechanical modification) of burning oil, withthe exception of diesel-fired generators. Therefore, natural-gas- and oil-fired capacity are roughly interchangeable. SAGE model results areused for all regions except the United States, where natural gas and oil “capacities” have been assumed to equal their respective shares ofelectricity production. Distinctions between natural gas and oil are provided for fuel inputs and the electricity generated from the two fuels.

The mix of primary fuels used to generate electricity haschanged a great deal over the past two decades on aworldwide basis. Coal has remained the dominant fuel,although electricity generation from nuclear powerincreased rapidly from the 1970s through the mid-1980s,and natural-gas-fired generation grew rapidly in the1980s and 1990s. In contrast, in conjunction with thehigh world oil prices brought on by the oil price shocksafter the oil embargo of 1973-1974 and the Iranian revo-lution in 1979, the use of oil for electricity generation hasbeen slowing since the mid-1970s. High world oil pricesencouraged switching from oil-fired generation to natu-ral gas and nuclear power and reinforced coal’s impor-tant role in world electric power generation. Similarly,the relatively high fossil fuel prices of recent yearsare raising renewed interest in nuclear power andmaking renewable energy sources more competitiveeconomically.
Natural Gas
In the IEO2006 reference case, natural-gas-fired generat-ing capacity increases by approximately 2.7 percent peryear from 2003 to 2030 (Figure 59), as compared with 2.2percent per year for coal and 1.9 percent per year forrenewables. Between 2003 and 2030, 1,070 gigawatts of
natural gas capacity is added worldwide (net of totalcapacity additions minus capacity retirements), com-pared with 878 gigawatts of coal-fired generating capac-ity. As a result, the natural gas share of world installedgenerating capacity rises from 27 percent in 2003 to 33percent in 2030. Natural-gas-fired combined-cyclecapacity is an attractive choice for new power plantsbecause of its fuel efficiency, operating flexibility (it canbe brought on line in minutes rather than the hours ittakes for other energy sources like coal), relatively shortconstruction times (months instead of the years that coalor nuclear power plants typically require), and lowerinvestment costs. The major drawback of natural gascapacity is the potential volatility of fuel costs.
At the world level, natural gas consumption increasesfrom 19 percent of total fuel use for electricity generationin 2003 to 22 percent in 2030. Non-OECD economies, onthe whole, relied on natural gas for 24 percent of fuelinputs in 2003 and OECD economies for 15 percent. Nochange is expected for the non-OECD economies, but inthe OECD the natural gas share rises to 20 percent in2030.
In the OECD economies, natural gas and coal eachaccounted for 28 percent of installed electricity
66 Energy Information Administration / International Energy Outlook 2006
Technology Choices for New U.S. Generating Capacity: Levelized Cost Calculations
When decisionmakers are faced with the need for newcapacity, several technology types can be considered.One of the tools used by decisionmakers is a levelizedcost calculation, which incorporates all the expensesand revenues associated with a project over its lifetime.The costs include investment in plant construction,interest charges on funds borrowed to finance the con-struction, capital outlays after the plant has startedoperating, taxes, operations and maintenance costs,and fuel costs. The levelized cost calculation balancesthose expenses against estimates of revenues over thelife of the plant, including proceeds from power salesand a desired rate of return on the investment. Thestreams of expenses and revenues are expressed as areal annuity, where the payments are assumed to be forthe same dollar amount in every year of the plant’s life.
Levelized cost comparisons give investors one basis forchoosing a technology. In addition, other factors areconsidered, such as the operating characteristics of dif-ferent technologies. For example, intermittent technol-ogies like wind and solar produce less power over timethan do coal, nuclear, or combined-cycle natural gasplants. There may also be tradeoffs between capitalcosts and fuel costs. Nuclear generators are expensiveto build, but their fuel and operating costs are low;combined-cycle plants are far less expensive to build,but their fuel and operating costs are much higher.
An illustration of levelized cost calculations for a typi-cal coal plant, an advanced combined-cycle natural gasplant, a wind plant, and a nuclear plant to be built inthe United States is shown in the table below. The costestimates are based on assumptions used in EIA’sAnnual Energy Outlook 2006, expressed in 2004 dollarsper megawatthour. For U.S. plants that would beginoperation in 2015, the combined-cycle plant is theleast-cost option and the nuclear plant the mostexpensive.
Levelized Cost Comparison for New GeneratingCapacity in the United States(2004 Dollars per Megawatthour)
CostElement
Technology
CoalNatural
Gas Wind Nuclear
Capital . . . 30.4 11.4 40.7 42.7
O&M. . . . . 4.7 1.4 8.3 7.8
Fuel . . . . . 14.5 36.9 0.0 6.6
Total a. . . 53.1 52.5 55.8 59.3aIncludes transmission hookup costs.O&M = operations and maintenance.Source: Energy Information Administration, Annual Energy
Outlook 2006, DOE/EIA-0383(2006) (Washington DC, Febru-ary 2006).

generating capacity in 2003 (Figure 60). Over the projec-tion period, natural gas capacity gains share (rising to 33percent) at the expense of nuclear, renewables, andoil-fired capacity, while coal’s share remains steady.Nearly one-half of the total increment in OECD natu-ral-gas-fired generating capacity is attributed to thecountries of Europe, where the natural gas share of elec-tric power generation more than doubles, from 15 per-cent in 2003 to 39 percent in 2030. With plannedphaseouts of nuclear generators in Belgium, Germany,and Sweden and disincentives for construction of newcoal-fired capacity because of environmental restric-tions, natural gas gains the largest share of the OECDEurope electricity market.
In the United States, both the share of natural gas capac-ity and the share of electricity generated from naturalgas decline over the projection period. Natural-gas-firedplants, which provided 15 percent of total U.S. electricitysupply in 2003, increase their share to 20 percent of sup-ply in 2015 before dropping back to 15 percent in 2030.Natural-gas-fired generation (excluding generation inthe industrial sector) increases initially as the recentwave of newer, more efficient plants come online, but itdeclines toward the end of the projection period as natu-ral gas prices continue to rise [4]. A similar pattern ofexpanding natural gas capacity and generation shares,followed by declining shares relative to other fuels, isexpected in OECD Asia. In both Canada and Mexico,natural gas capacity increases steadily, and natu-ral-gas-fired generation increases by 4.5 percent per yearin Canada and 6.9 percent per year in Mexico.
In the non-OECD nations, the natural gas share of totalelectricity generation rises as oil and renewables lose
share. Natural-gas-fired capacity grows most rapidly innon-OECD Asia—especially China and India—and nat-ural gas consumption in the electric power sectorincreases by an average of 7.0 percent per year in Chinaand 7.1 percent per year in India from 2003 to 2030. Fornon-OECD Asia as a whole, natural-gas-fired electricitygeneration increases by an average of 7.2 percent peryear, as compared with 4.7 percent per year worldwide.
In non-OECD Europe and Eurasia, with access to richnatural gas resources, natural gas was used for 35 per-cent of total electricity generation in 2003. In 2030, itsshare of the region’s electricity production is projectedto be 60 percent. Africa, the Middle East, and Centraland South America also rely increasingly on natural gasto produce electricity in the reference case.
Coal
Coal retains the largest market share of the world’s elec-tricity generation (roughly 40 percent) in the IEO2006reference case, despite losing some of its share to naturalgas (Figure 61). Installed coal-fired capacity, as a share oftotal world capacity, remain at about 30 percent. World-wide, coal-fired capacity grows by 2.2 percent per year,from 1,119 gigawatts in 2003 to 1,997 gigawatts in 2030(Figure 62)—slightly faster than the 2.0-percent averageannual increase for all electricity generation capacity. In2003, non-OECD economies on the whole relied on coalfor roughly 43 percent of generation, slightly more thanthe OECD economies.
Regional differences in coal use for electricity generationarise primarily from differences in coal resources.
Energy Information Administration / International Energy Outlook 2006 67
2003 2010 2015 2020 2025 20300
10
20
30
40Percent of Total
Coal
Natural Gas
Renewables
Nuclear
Oil
Figure 60. Shares of OECD Installed ElectricityCapacity by Fuel Type, 2003-2030
Sources: 2003: Derived from Energy Information Adminis-tration (EIA), International Energy Annual 2003 (May-July2005), web site www.eia.doe.gov/iea/. 2010-2030: EIA, Sys-tem for the Analysis of Global Energy Markets (2006).
2003 2010 2015 2020 2025 20300
20
40
60
80
100Percent of Total
Coal
Natural Gas
Renewables
Nuclear
Oil
Figure 61. Fuel Shares of World ElectricityGeneration, 2003-2030
Note: Fuel shares may not add to 100 percent due to inde-pendent rounding.
Sources: 2003: Derived from Energy Information Adminis-tration (EIA), International Energy Annual 2003 (May-July2005), web site www.eia.doe.gov/iea/. 2010-2030: EIA, Sys-tem for the Analysis of Global Energy Markets (2006).

Regions with large coal resources are more likely to usecoal for electricity generation, because coal has a lowerenergy density (energy per weight) and fewer alterna-tive uses than oil or natural gas. These factors help keepcoal prices, on an energy basis, lower than oil and natu-ral gas prices. Coal reserves in the United States, China,India, and Australia are among the largest in the world,and those countries rely on coal to generate 50 to 80 per-cent of their electricity.
China and the United States lead the world in coal-firedcapacity additions in the projections, adding 546gigawatts and 154 gigawatts, respectively. In China,strong growth in natural-gas-fired capacity initiallypushes coal’s share of total capacity down to 63 percentin 2010, but it rebounds to 72 percent in 2030. In theUnited States, coal-fired power plants continue supply-ing the largest share of electricity generation through2030 [5]. Sustained high world oil and natural gas pricesin the IEO2006 reference case lead to increased relianceon coal to produce electricity in the later years of the pro-jection. The coal share of total electricity generation inthe United States increases from 53 percent in 2003 to 57percent in 2030. In non-OECD Asia excluding China, theshare of electricity generated from coal-fired capacitydeclines, despite continuing additions to coal-firedcapacity, because additions of natural-gas-fired capacityexceed additions to coal-fired capacity. In all otherregions, the coal share of electricity generation remainsstable or falls.
Oil
Although relatively little change in oil-fired generatingcapacity is expected, oil’s share of world installed capac-ity declines over the projection period, from 10 percent
in 2003 to 7 percent in 2030. Oil has more value in thetransportation sector and in limited applications for dis-tributed diesel-fired generators than in central powerplant applications. Only the Middle East and China areexpected to see sizable increases in oil-fired electricpower capacity over the projection period, adding 24and 22 gigawatts, respectively.
In recent years, China has shown fairly strong growth inoil-fired electricity generation, because peak electricitydemand continues to outpace on-grid electricity genera-tion, and Chinese industry has had to rely on diesel gen-erators to cope with annual summer power shortages.That situation is expected to continue in the short term,but as planned capacity fueled by natural gas, coal,nuclear, and hydropower comes on line and the coun-try’s national electricity grid matures, the use of oil togenerate electricity is expected to moderate.
Nuclear Power
The world’s nuclear-powered generating capacityincreases in the IEO2006 reference case from 361 giga-watts in 2003 to 438 gigawatts in 2030, in contrast to pro-jections of declines in nuclear power capacity in pastIEOs. The reference case is based on existing laws andassumes that, for the OECD economies in the long term,retirements of existing nuclear power plants as theyreach the end of their operating lives will nearly equalconstruction of new nuclear power capacity, resulting ina slight decline of installed nuclear capacity toward theend of the projection after peaking in 2020. Few newbuilds are expected in the OECD economies outside ofFinland, France, Japan, South Korea, and the UnitedStates. In the United States, nuclear capacity is expectedto increase by 3 gigawatts as a result of uprates at exist-ing plants and by 6 gigawatts as a result of new construc-tion [6].
In contrast, rapid growth in nuclear power capacity isprojected for the non-OECD economies (Figure 63). Thenon-OECD economies are expected to add 33 gigawattsof nuclear capacity between 2003 and 2015 and another42 gigawatts between 2015 and 2030. The largest addi-tions are expected in China, India, and Russia.
Prospects for nuclear power have improved in recentyears, with higher capacity utilization rates reported formany existing nuclear facilities and the expectation thatmost existing plants in the OECD nations and in non-OECD Europe and Eurasia will be granted extensions totheir operating lives. Higher fossil fuel prices, concernsabout energy supply security, and the possibility fornew, lower cost nuclear reactor designs also mayimprove prospects for new nuclear power capacity.Nevertheless, nuclear power trends can be difficult toanticipate for a variety of political and social reasons,and considerable uncertainty is associated with nuclearpower projections.
68 Energy Information Administration / International Energy Outlook 2006
1,1191,302
1,4421,590
1,763
1,997
2003 2010 2015 2020 2025 20300
500
1,000
1,500
2,000
2,500Gigawatts
History Projections
Figure 62. World Installed Coal-Fired GeneratingCapacity, 2003-2030
Sources: 2003: Derived from Energy Information Adminis-tration (EIA), International Energy Annual 2003 (May-July2005), web site www.eia.doe.gov/iea/. 2010-2030: EIA, Sys-tem for the Analysis of Global Energy Markets (2006).

Nuclear power is an important source of electricity inmany countries of the world. In 2005, 16 countriesdepended on nuclear power for at least 25 percent oftheir electricity generation (Figure 64). As of December2005, there were 443 nuclear power reactors in operationaround the world, and another 24 were under construc-tion. Despite a declining share of global electricity pro-duction, nuclear power is projected to remain animportant source of electric power through 2030. In theIEO2006 reference case, electricity generation by nuclearpower plants around the world increases from 2,523 bil-lion kilowatthours in 2003 to 2,940 billion kilowatthoursin 2015 and 3,299 billion kilowatthours in 2030.
Hydroelectricity and Other Renewables
Grid-connected hydroelectric and other generatingcapacity fueled by renewable energy resources is pro-jected to increase by 553 gigawatts from 2003 to 2030, atan average annual rate of 1.9 percent. High oil and natu-ral gas prices, which are expected to persist in the mid-term projection, encourage the penetration of renew-ables. Renewable generating capacity in 2025 is 18 per-cent higher in IEO2006 than was projected in theIEO2005 reference case (the IEO2005 projection periodended at 2025). Nonetheless, the renewable share ofworld installed capacity falls slightly, from 23 percent in2003 to 22 percent in 2030, as natural gas continues togain market share in many regions of the world.
Much of the projected growth in renewable generationresults from the expected completion of large hydroelec-tric facilities in non-OECD Asia, where the need toexpand electricity production with associated dams andreservoirs often outweighs concerns about environmen-tal impacts and the relocation of populations. China has
ambitious plans to increase hydroelectric capacity,including completion of the 5.4-gigawatt Longtanhydroelectric project by the end of 2007 and the 18.2-gigawatt Three Gorges Dam project in 2009 [7]. Indiaand several other non-OECD Asian countries, includingLaos and Vietnam, also have plans to increase hydro-electric capacity [8].
In Central and South America, many nations have plansto expand their already well-established hydroelectricresources. Brazil is the largest energy market in Centraland South America, and more than 80 percent of its elec-tricity generation comes from hydroelectric sources. Asa result, Brazil is especially vulnerable to drought-induced shortages in electricity supply. In general, thenations of Central and South America are not expectedto expand hydroelectric resources dramatically butinstead are expected to invest in other sources of electric-ity—particularly natural-gas-fired capacity—that willallow them to diversify electricity supplies and reducetheir reliance on hydropower.
Energy Information Administration / International Energy Outlook 2006 69
57
72
90
110
125132
2003 2010 2015 2020 2025 20300
25
50
75
100
125
150Gigawatts
History Projections
Figure 63. Non-OECD Installed Nuclear GeneratingCapacity, 2003-2030
Sources: 2003: Derived from Energy Information Adminis-tration (EIA), International Energy Annual 2003 (May-July2005), web site www.eia.doe.gov/iea/. 2010-2030: EIA, Sys-tem for the Analysis of Global Energy Markets (2006).
LithuaniaFrance
SlovakiaBelgiumUkraineSweden
South KoreaBulgariaArmeniaSloveniaHungaryFinland
SwitzerlandGermany
Czech RepublicJapan
United KingdomSpain
United StatesRussia
CanadaRomania
ArgentinaSouth Africa
MexicoNetherlands
IndiaPakistan
BrazilChina
0 10 20 30 40 50 60 70 80 90 100
Percent
Figure 64. Nuclear Shares of National ElectricityGeneration, 2005
Source: International Atomic Energy Agency, ReferenceData Series 2, “Power Reactor Information System,” web sitewww.iaea.org/programmes/a2/ (April 2006).

In the OECD, grid-connected installed renewable capac-ity is projected to increase by 0.8 percent per year overthe 2003 to 2030 period. Hydroelectric capacity in OECDeconomies is not expected to grow substantially, andonly Canada is expected to complete any sizable hydro-electric projects over the projection. Nonhydropowerrenewables are instead expected to lead the growth inrenewable generating capacity, especially wind inOECD Europe and the United States, where wind-powered generating capacity increased by 18 percentand 27 percent, respectively, in 2005 alone [9].
The IEO2006 projections for hydroelectricity and otherrenewable energy resources include only on-gridrenewables. Non-marketed (noncommercial) biofuelsfrom plant and animal sources are an important sourceof energy, particularly in non-OECD economies, and theInternational Energy Agency has estimated that some2.4 billion people in developing countries depend on tra-ditional biomass for heating and cooking [10]. Becausecomprehensive data on the use of non-marketed fuelsand dispersed renewables (renewable energy consumedon the site of its production, such as solar panels used toheat water) are not available, they are not included in theprojections; however, both non-marketed fuels and dis-persed renewables are considered in formulating end-use energy demands.
References
70 Energy Information Administration / International Energy Outlook 2006
1. Global Insight World Markets Research Centre,“Country Report—Mexico (Energy) Utilities: Elec-tricity and Gas” (February 09, 2006), web site www.worldmarketsanalysis.com.
2. The News Hour with Jim Lehrer, “Special Report:China Rising” (October 4, 2005), web site www.pbs.org/newshour/bb/asia/july-dec05/china_10-04.html.
3. Marketplace, American Public Media, “SpecialReport on China” (January 9-20, 2006), web sitehttp://marketplace.publicradio.org/features/china2006/.
4. Energy Information Administration, Annual EnergyOutlook 2006, DOE/EIA-0383(2006) (Washington,DC, February 2006), p. 80.
5. Energy Information Administration, Annual EnergyOutlook 2006, DOE/EIA-0383(2006) (Washington,DC, February 2006), p. 80.
6. Energy Information Administration, Annual EnergyOutlook 2006, DOE/EIA-0383(2006) (Washington,DC, February 2006), p. 7.
7. “La Meme Plus Grande Centrale Hydro-electriquede Chine Sera Mise en Service en 2007,” XinhuaNews Release, web site www.xinhuanet.com(March 12, 2005).
8. “Nam Ngum-II Project Advances,” Platts: Power inAsia, No. 447 (February 16, 2006), p. 13; “Song DaAdvances Projects,” Platts: Power in Asia, No. 447(February 16, 2006), p. 13; and “Bhel Wins HydroProject,” Platts: Power in Asia, No. 446 (February 2,2006), p. 8.
9. Wind Energy Weekly, Vol. 25, No. 1179 (February 17,2006), p. 2.
10. International Energy Agency, World Energy Outlook2004 (Paris, France, October 2004), p. 36.

Chapter 7
Energy-Related Carbon Dioxide EmissionsIn the coming decades, actions to limit greenhouse gas emissionscould affect patterns of energy use around the world and alter the leveland composition of energy-related carbon dioxide emissions by energy source.
Carbon dioxide is one of the most prevalent greenhousegases in the atmosphere. Anthropogenic (human-caused) emissions of carbon dioxide result primarilyfrom the combustion of fossil fuels for energy, and as aresult world energy use has emerged at the center of theclimate change debate. In the IEO2006 reference case,world carbon dioxide emissions increase from 25,028million metric tons in 2003 to 33,663 million metric tonsin 2015 and 43,676 million metric tons in 2030 (Figure65).14
The Kyoto Protocol, which requires participating“Annex I” countries to reduce their greenhouse gasemissions collectively to an annual average of about 5percent below their 1990 level over the 2008-2012 period,entered into force on February 16, 2005, 90 days after itwas ratified by Russia. Russia’s ratification satisfied theterms necessary to bring the treaty into force; that is, thetotal number of signatories had reached more than 55countries, including Annex I signatories that accountedfor more than 55 percent of Annex I carbon dioxide emis-sions in 1990. The Annex I countries include all theOECD countries except for Mexico and South Korea,along with the non-OECD countries Bulgaria, Estonia,Latvia, Lithuania, Monaco, Romania, Russia, Slovenia,and Ukraine.15
The IEO2006 reference case projections are based on U.S.and foreign government laws in effect on January 1,2006. The potential impacts of pending or proposed leg-islation, regulations, and standards are not reflected inthe projections, nor are the impacts of legislation forwhich implementing mechanisms have not beenannounced. The IEO2006 reference case does not includethe potential impacts of the Kyoto Protocol, because thetreaty does not indicate the methods by which ratifyingparties will implement their obligations. Moreover, theProtocol does not address signatory obligations beyond2012, making it impossible to assess its impacts onenergy markets and carbon dioxide emissions through2030 in the context of a reference case projection. In theyear since the Kyoto Protocol entered into force, therehas been little progress toward establishing goals for asecond commitment period.
Another difficulty in projecting energy-related carbondioxide emissions in the context of the Kyoto Protocol isthat, in the 5-year increments of the SAGE model, uponwhich the IEO2006 projections are based, 2010 is theonly projection year that is part of the Protocol’s firstcommitment period. While some participating countrieshave identified goals by energy-consuming sectors, notall have; and even for those that have done so, it is diffi-cult to assess how the goals will be implemented withspecific actions by the participants.
Despite the challenges, it is important to address thepossible impacts of the Kyoto Protocol, because theycould strongly influence future energy trends. Accord-ingly, this chapter begins with a presentation of theIEO2006 reference case projections for regional carbondioxide emissions, which can serve as an estimateagainst which future emissions reductions can be mea-sured. The IEO2006 Kyoto Protocol case assumes thatthe emissions goals of the Protocol will be met by thecountries that have ratified the treaty and have
Energy Information Administration / International Energy Outlook 2006 71
1990 2003 2010 2015 2020 2025 20300
10
20
30
40
50Billion Metric Tons
TotalOECD
Non-OECD Europe and Eurasia
Other Non-OECD
Figure 65. World Carbon Dioxide Emissionsby Region, 1990-2030
Sources: 1990 and 2003: Energy Information Administration(EIA), International Energy Annual 2003 (May-July 2005), website www.eia.doe.gov/iea/. 2010-2030: EIA, System for theAnalysis of Global Energy Markets (2006).
14In keeping with current international practice, IEO2006 presents data on carbon dioxide emissions in million metric tons of carbondioxide. The figures can be converted to carbon equivalent units by multiplying by 12/44.
15As of April 16, 2006, 162 countries and the European Community had ratified, accepted, acceded to, or approved the Kyoto Protocol. Alist of the 162 countries is provided in Appendix J.
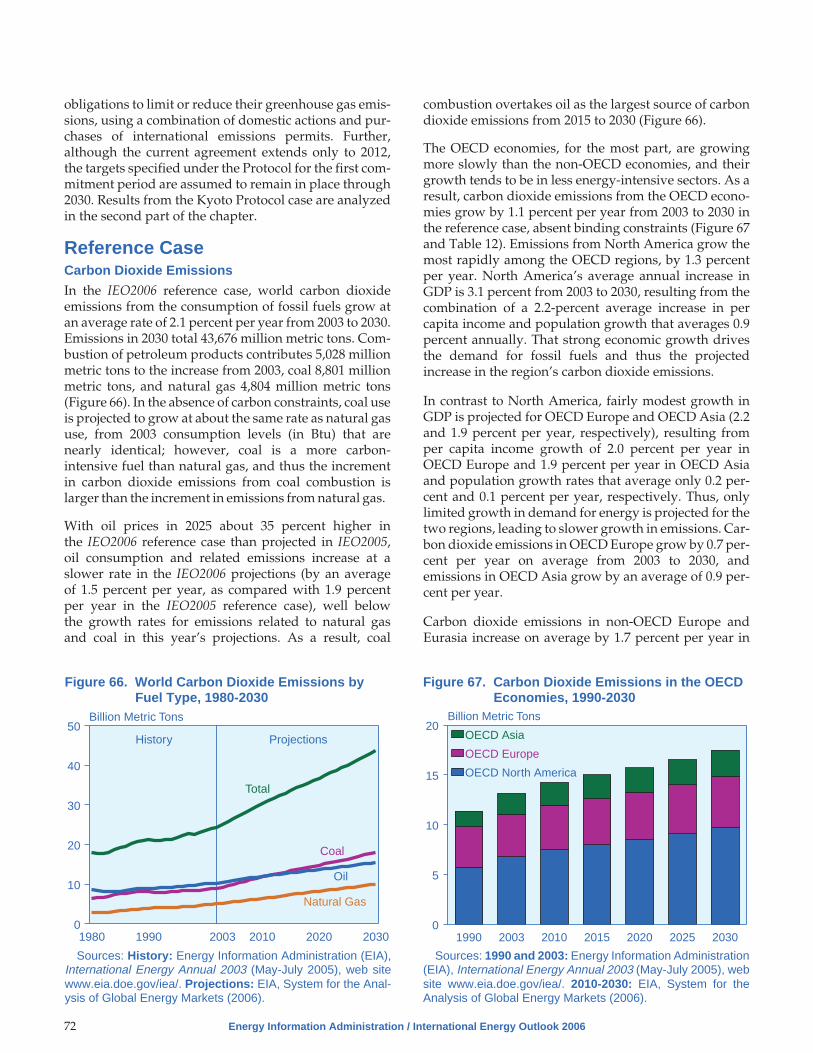
obligations to limit or reduce their greenhouse gas emis-sions, using a combination of domestic actions and pur-chases of international emissions permits. Further,although the current agreement extends only to 2012,the targets specified under the Protocol for the first com-mitment period are assumed to remain in place through2030. Results from the Kyoto Protocol case are analyzedin the second part of the chapter.
Reference CaseCarbon Dioxide Emissions
In the IEO2006 reference case, world carbon dioxideemissions from the consumption of fossil fuels grow atan average rate of 2.1 percent per year from 2003 to 2030.Emissions in 2030 total 43,676 million metric tons. Com-bustion of petroleum products contributes 5,028 millionmetric tons to the increase from 2003, coal 8,801 millionmetric tons, and natural gas 4,804 million metric tons(Figure 66). In the absence of carbon constraints, coal useis projected to grow at about the same rate as natural gasuse, from 2003 consumption levels (in Btu) that arenearly identical; however, coal is a more carbon-intensive fuel than natural gas, and thus the incrementin carbon dioxide emissions from coal combustion islarger than the increment in emissions from natural gas.
With oil prices in 2025 about 35 percent higher inthe IEO2006 reference case than projected in IEO2005,oil consumption and related emissions increase at aslower rate in the IEO2006 projections (by an averageof 1.5 percent per year, as compared with 1.9 percentper year in the IEO2005 reference case), well belowthe growth rates for emissions related to natural gasand coal in this year’s projections. As a result, coal
combustion overtakes oil as the largest source of carbondioxide emissions from 2015 to 2030 (Figure 66).
The OECD economies, for the most part, are growingmore slowly than the non-OECD economies, and theirgrowth tends to be in less energy-intensive sectors. As aresult, carbon dioxide emissions from the OECD econo-mies grow by 1.1 percent per year from 2003 to 2030 inthe reference case, absent binding constraints (Figure 67and Table 12). Emissions from North America grow themost rapidly among the OECD regions, by 1.3 percentper year. North America’s average annual increase inGDP is 3.1 percent from 2003 to 2030, resulting from thecombination of a 2.2-percent average increase in percapita income and population growth that averages 0.9percent annually. That strong economic growth drivesthe demand for fossil fuels and thus the projectedincrease in the region’s carbon dioxide emissions.
In contrast to North America, fairly modest growth inGDP is projected for OECD Europe and OECD Asia (2.2and 1.9 percent per year, respectively), resulting fromper capita income growth of 2.0 percent per year inOECD Europe and 1.9 percent per year in OECD Asiaand population growth rates that average only 0.2 per-cent and 0.1 percent per year, respectively. Thus, onlylimited growth in demand for energy is projected for thetwo regions, leading to slower growth in emissions. Car-bon dioxide emissions in OECD Europe grow by 0.7 per-cent per year on average from 2003 to 2030, andemissions in OECD Asia grow by an average of 0.9 per-cent per year.
Carbon dioxide emissions in non-OECD Europe andEurasia increase on average by 1.7 percent per year in
72 Energy Information Administration / International Energy Outlook 2006
1980 1990 2003 2010 2020 20300
10
20
30
40
50Billion Metric Tons
History Projections
Oil
Natural Gas
Coal
Total
Figure 66. World Carbon Dioxide Emissions byFuel Type, 1980-2030
Sources: History: Energy Information Administration (EIA),International Energy Annual 2003 (May-July 2005), web sitewww.eia.doe.gov/iea/. Projections: EIA, System for the Anal-ysis of Global Energy Markets (2006).
1990 2003 2010 2015 2020 2025 20300
5
10
15
20Billion Metric Tons
OECD North America
OECD Europe
OECD Asia
Figure 67. Carbon Dioxide Emissions in the OECDEconomies, 1990-2030
Sources: 1990 and 2003: Energy Information Administration(EIA), International Energy Annual 2003 (May-July 2005), website www.eia.doe.gov/iea/. 2010-2030: EIA, System for theAnalysis of Global Energy Markets (2006).

the IEO2006 reference case, from 2,725 million metrictons in 2003 to 3,444 million metric tons in 2015 and 4,352million metric tons in 2030 (Figure 68 and Table 12). Rus-sia, the region’s largest economy, accounted for 60 per-cent of regional energy consumption and 59 percent ofregional carbon dioxide emissions in 2003.
The economic collapse of the Soviet Union and the East-ern European countries in its sphere of influence—mostof which are included in non-OECD Europe and Eur-asia—slowed the growth of carbon dioxide emissionsnot only in the region but also on a worldwide basis formany years after the breakup of the Soviet Union in1991. In 2003, total carbon dioxide emissions in the
countries of non-OECD Europe and Eurasia were still 35percent below their level in 1990, and in the referencecase projection they do not return to 1990 levels untilafter 2025.
Although GDP growth in non-OECD Europe and Eur-asia averages 4.4 percent per year from 2003 to 2030 inthe reference case, improvements in energy infrastruc-ture are expected to keep the growth in energy demandat an annual average of only 1.8 percent. In addition, anincrease in the natural gas share of total energy con-sumption and a drop in coal’s share are expected tolower the carbon intensity of energy supply in theregion. Consequently, carbon dioxide emissions innon-OECD Europe and Eurasia in 2030 are only 159 mil-lion metric tons above the 1990 level.
For the other non-OECD economies, the reference caseprojects strong economic growth driven largely by theenergy-intensive industrial and transportation sectors.Accordingly, their carbon dioxide emissions grow attwice the rate projected for non-OECD Europe and Eur-asia (and three times the rate for the OECD economies),bringing the average annual increase in emissions for allnon-OECD countries to 3.0 percent per year from 2003 to2030. The most rapid increases are projected for thenations of non-OECD Asia (Figure 69).
Carbon Dioxide Intensity
World carbon dioxide intensity has improved (de-creased) substantially over the past decade, falling from629 metric tons per million 2000 U.S. dollars of GDP in1990 to 493 metric tons per million dollars in 2003.Although the pace of improvement in emissions inten-sity is expected to be slower over the 2003-2030 periodthan it has been over the past decade, a continuingdecline in intensity is projected in the reference case, to
Energy Information Administration / International Energy Outlook 2006 73
1990 2003 2010 2015 2020 2025 20300
1
2
3
4
5Billion Metric Tons
Russia
Other
Figure 68. Carbon Dioxide Emissionsin Non-OECD Europe and Eurasia,1990-2030
Sources: 1990 and 2003: Energy Information Administration(EIA), International Energy Annual 2003 (May-July 2005), website www.eia.doe.gov/iea/. 2010-2030: EIA, System for theAnalysis of Global Energy Markets (2006).
Table 12. World Carbon Dioxide Emissions by Region, 1990-2030(Million Metric Tons)
Region
History Projections Average Annual Percent Change
1990 2003 2010 2015 2020 2025 2030 1990-2003 2003-2030
OECD . . . . . . . . . . . . . . . . . . . 11,378 13,150 14,249 15,020 15,709 16,545 17,496 1.1 1.1North America . . . . . . . . . . . . 5,753 6,797 7,505 7,997 8,513 9,096 9,735 1.3 1.3Europe . . . . . . . . . . . . . . . . . 4,089 4,264 4,474 4,632 4,741 4,909 5,123 0.3 0.7Asia . . . . . . . . . . . . . . . . . . . . 1,536 2,090 2,269 2,390 2,455 2,540 2,638 2.4 0.9
Non-OECD . . . . . . . . . . . . . . . 9,846 11,878 16,113 18,643 21,039 23,500 26,180 1.5 3.0Europe and Eurasia . . . . . . . 4,193 2,725 3,113 3,444 3,758 4,047 4,352 -3.3 1.7Asia . . . . . . . . . . . . . . . . . . . . 3,626 6,072 9,079 10,753 12,407 14,113 15,984 4.0 3.6Middle East . . . . . . . . . . . . . . 704 1,182 1,463 1,647 1,811 1,987 2,177 4.1 2.3Africa. . . . . . . . . . . . . . . . . . . 649 893 1,188 1,363 1,477 1,593 1,733 2.5 2.5Central and South America. . 673 1,006 1,270 1,436 1,586 1,758 1,933 3.1 2.4
Total World . . . . . . . . . . . . . . 21,223 25,028 30,362 33,663 36,748 40,045 43,676 1.3 2.1
Sources: 1990 and 2003: Energy Information Administration (EIA), International Energy Annual 2003 (May-July 2005), web sitewww.eia.doe.gov/iea/. 2010-2030: EIA, System for the Analysis of Global Energy Markets (2006).

408 metric tons per million dollars in 2015 and 311 metrictons per million dollars in 2030 (Table 13).
On a regional basis, the most rapid rates of improvementin carbon dioxide intensity are projected for the econo-mies of non-OECD Europe and Eurasia and for the econ-omies of India and other non-OECD Asia. In Eurasia,economic recovery from the upheaval of the 1990s fol-lowing the breakup of the Soviet Union is expected tocontinue throughout the projections, and old, inefficientcapital stock is expected to be replaced as the economicrecovery progresses. Even with substantial improve-ment in efficiency, however, carbon dioxide intensity innon-OECD Europe and Eurasia is expected to be higherthan in all other non-OECD countries except those of theMiddle East.
Economic recovery has been slower in Russia than in theother nations of non-OECD Europe and Eurasia, wherestrong investment in improving the efficiency of energyuse and a push to increase the use of natural gas haveimproved carbon dioxide intensity by an average of 3.5percent annually from 1990 to 2003, as compared withan annual average of 1.1 percent for Russia. From 2003 to2030, Russia’s carbon dioxide intensity is projected toimprove by 2.4 percent per year on average, while therest of the region averages 2.8 percent per year.
74 Energy Information Administration / International Energy Outlook 2006
Table 13. Carbon Dioxide Intensity by Region and Country, 1990-2030(Metric Tons per Million 2000 U.S. Dollars of Gross Domestic Product)
Region
History ProjectionsAverage AnnualPercent Change
1990 2003 2010 2015 2020 2025 20301990-2003
2003-2030
OECD . . . . . . . . . . . . . . . . . . . . . 565 473 421 391 361 338 318 -1.4 -1.5United States . . . . . . . . . . . . . . . 701 562 488 445 406 377 351 -1.7 -1.7Canada . . . . . . . . . . . . . . . . . . . 693 611 574 561 538 520 498 -1.0 -0.8Mexico . . . . . . . . . . . . . . . . . . . . 441 415 360 337 311 286 261 -0.5 -1.7Europe . . . . . . . . . . . . . . . . . . . . 510 395 352 326 300 280 264 -1.9 -1.5Japan . . . . . . . . . . . . . . . . . . . . . 349 357 311 293 274 261 250 0.2 -1.3South Korea. . . . . . . . . . . . . . . . 711 687 629 572 529 501 475 -0.3 -1.4Australia/New Zealand. . . . . . . . 679 631 583 546 512 482 453 -0.6 -1.2
Non-OECD . . . . . . . . . . . . . . . . . 723 516 466 423 380 341 307 -2.6 -1.9Russia . . . . . . . . . . . . . . . . . . . . 1,042 903 711 637 579 522 474 -1.1 -2.4Other Europe/Eurasia . . . . . . . . 1,622 1,018 737 654 578 521 473 -3.5 -2.8Asia . . . . . . . . . . . . . . . . . . . . . . 627 449 430 390 350 314 282 -2.5 -1.7
China . . . . . . . . . . . . . . . . . . . . 1,240 591 579 517 463 414 372 -5.5 -1.7India . . . . . . . . . . . . . . . . . . . . . 343 299 265 238 208 182 156 -1.1 -2.4Other . . . . . . . . . . . . . . . . . . . . 353 368 316 293 267 245 222 0.3 -1.9
Middle East . . . . . . . . . . . . . . . . 869 871 752 693 633 581 533 0.0 -1.8Africa . . . . . . . . . . . . . . . . . . . . . 444 411 386 357 315 279 249 -0.6 -1.8Central and South America . . . . 310 327 307 290 269 251 232 0.4 -1.3
Brazil . . . . . . . . . . . . . . . . . . . . 215 252 235 220 203 189 176 1.2 -1.3Other . . . . . . . . . . . . . . . . . . . . 393 388 362 342 317 295 272 -0.1 -1.3
Total World . . . . . . . . . . . . . . . . . 629 493 444 408 372 340 311 -1.9 -1.7
Sources: 1990 and 2003: Derived from Energy Information Administration (EIA), International Energy Annual 2003 (May-July2005), web site www.eia.doe.gov/iea/. 2010-2030: EIA, System for the Analysis of Global Energy Markets (2006).
1990 2003 2010 2015 2020 2025 20300
5
10
15
20
25Billion Metric Tons
Non-OECD Asia
Middle East
Africa
Central and South America
Figure 69. Carbon Dioxide Emissions in OtherNon-OECD Economies, 1990-2030
Sources: 1990 and 2003: Energy Information Administration(EIA), International Energy Annual 2003 (May-July 2005), website www.eia.doe.gov/iea/. 2010-2030: EIA, System for theAnalysis of Global Energy Markets (2006).

Fairly rapid improvement in carbon dioxide intensity innon-OECD Asia is expected to result primarily fromrapid economic growth rather than a switch to less car-bon-intensive fuels. Although China and India, in par-ticular, are expected to remain heavily reliant on coaland other fossil fuels, their combined annual GDPgrowth averages 5.8 percent from 2003 to 2030, com-pared with a 4.0-percent annual increase in fossil fueluse. As a result, China’s carbon dioxide intensityimproves by 1.7 percent per year on average and India’sby 2.4 percent per year from 2003 to 2030.
Overall, carbon intensity in the non-OECD countries in2030 is projected to be slightly below that in the OECDcountries. For the non-OECD region as a whole, GDPgrowth averages 5.0 percent per year while emissionsgrow by 3.0 percent per year, resulting in a 1.9-percentaverage annual improvement in carbon dioxide inten-sity. For the OECD region, GDP growth averages 2.6percent per year while emissions grow by 1.1 percentper year, for an average annual improvement in carbonintensity of 1.5 percent per year.
Rates of improvement in carbon dioxide intensity couldvary considerably in the future, based on technologicaladvances, government policy initiatives, and economicgrowth rates. In the IEO2006 reference case, world car-bon dioxide intensity falls from 493 metric tons per mil-lion dollars of GDP in 2003 to 311 metric tons per milliondollars in 2030. If world economic growth expanded tothe levels projected in the IEO2006 high economicgrowth case, carbon dioxide intensity could fall morequickly, to 298 metric tons per million dollars in 2030. Incontrast, if the world economy expanded more slowly,as in the low economic growth case, carbon dioxideintensity could decline to 329 metric tons per milliondollars in 2030.
Kyoto Protocol CaseModeling Approach
Under the Kyoto Protocol, participating Annex I nationsare required to reduce or limit emissions of carbon diox-ide and other greenhouse gases over the first commit-ment period (January 2008 to December 2012) to a levelthat was determined as part of the negotiation process.The year 1990 was used as the base year for most coun-tries, although some were allowed to use other years.16
To fulfill their obligations under the treaty, the Annex Icountries must limit their emissions over the 5-yearcommitment period to an annual average that is at orbelow their commitment goals. Because the SAGEmodel projections for IEO2006 are in 5-year increments,2010 is used as the basis year for achieving commitments
in the first period.17 The targets specified under the Pro-tocol for the first commitment period are assumed toremain in place through 2030, although the currentagreement extends only to 2012.
The SAGE model comprises 16 regions. In the KyotoProtocol case, the model regions affected by the treatyare Canada, Japan, OECD Europe, and non-OECDEurope and Eurasia. Although New Zealand has ratifiedthe Protocol and intends to honor the terms of the treaty,Australia has not. In SAGE, New Zealand and Australiaare treated as a single entity; and Australia’s energy usefar exceeds New Zealand’s. Therefore, projections forAustralia/New Zealand are not included in the resultsof the Kyoto Protocol case. On the other hand, Turkey,which is included in OECD Europe, has not agreed tobinding constraints. Because Turkey is not a participantin the Protocol, its emissions are allowed to grow in theKyoto Protocol case, and the total goal for OECD Europeis adjusted accordingly.
For non-OECD Europe and Eurasia, countries otherthan Russia are split almost evenly between Kyoto par-ticipants and nonparticipants. The participants (such asUkraine) have their emissions capped, whereas thenonparticipants have no emissions caps. Emissions inthe participating countries of non-OECD Europe andEurasia are expected to remain below the level of theiremissions commitments through 2030; however,demand for credits by Kyoto participants in otherregions are expected to absorb the difference betweentheir projected emissions and commitments by the endof the projection period.
For the IEO2006 Kyoto Protocol case, assumptions weremade about how participating countries in the affectedregions would achieve their reductions, based wheneverpossible on official government statements. Forinstance, the European Union (EU) has stated that“most” of its greenhouse gas emissions reductions mustbe achieved domestically. The Kyoto Protocol casetherefore assumes that 50 percent of the aggregate emis-sions reduction for OECD Europe will be met by domes-tic reductions, as opposed to the use of internationalmarket mechanisms, such as permit trading. For Japanand Canada, which are expected to have higher domes-tic reduction costs than OECD Europe, both countriesare assumed to achieve 25 percent of their total reduc-tions domestically.
In the Kyoto Protocol case, a country or region is firstrequired to achieve its domestic reduction goal. Afterthe domestic requirement has been met, the country orregion is free to seek other means of meeting its overallreduction goal—for example, by trading carbon permits
Energy Information Administration / International Energy Outlook 2006 75
16The countries using a base year other than 1990 are Bulgaria (1988), Hungary (1985-1987), Poland (1988), and Romania (1989).17For key assumptions in the Kyoto Protocol case, see Appendix G.

internationally. In SAGE, the marginal cost (also knownas the “shadow price”) of reducing carbon dioxide emis-sions by 1 metric ton in a given country or region is usedto determine the price that the country or region will bewilling to pay for the next additional reduction of 1 met-ric ton. If the price of a carbon permit traded internation-ally exceeds the shadow price of the domestic reduction,then the country or region will be better off achievingthat reduction domestically. If the price of a purchasedpermit is less than the shadow price, then the country orregion is expected to choose the trading option.
In order to find a “clearing price” for internationallytraded emissions permits, various price levels weretested. It was determined that, at approximately $42 permetric ton, the supply of credits (2.1 billion metric tons)equaled the demand over the projection period. At aprice higher than $42, countries could find additionaldomestic actions to reduce emissions, and some of thecredits would not be purchased. At prices lower than$42, the demand for credits would be greater than thesupply, and the available credits would be exhaustedbefore the end of the projection period.
SAGE does not explicitly model Clean DevelopmentMechanisms (credits purchased by Annex I countries ofreductions made by non-Annex I countries), becausethey can involve factors such as carbon storage in treesthat are outside the current model structure. Also, thegeneration of additional permits from non-OECDEurope and Eurasia or elsewhere was not allowed indetermining the market clearing price for permits.Therefore, the $42 price probably represents an upperbound, assuming that the Kyoto Protocol goals remainin place until 2030. If the goals were relaxed, the permitprice would be likely to fall; if they were made morestringent, the price would be likely to rise.
Summary
The Kyoto Protocol case assumes that energy use willnot vary from the reference case projections for Annex I
countries that are not expected to participate in thetreaty (the United States and Australia, for example) orfor countries that are not required to make reductionsaccording to the terms of the treaty (China and India, forexample). As a result, only the projections for energy usein the Annex I nations committed to participating areaffected in the Kyoto Protocol case. For the participatingAnnex I group, total energy demand in the Kyoto Proto-col case is about 3 quadrillion Btu lower than in the refer-ence case in 2010 and 2 quadrillion Btu lower in 2030,assuming that the Kyoto targets remain constant overthe entire projection period (Table 14). Energy-relatedcarbon dioxide emissions in the participating nations are422 million metric tons lower than in the reference casein 2010 and 675 million metric tons lower in 2030. Totalcoal use among the participating Annex I nations in 2030is about 27 percent lower than in the reference case in2030.
Total petroleum consumption in the participatingnations is just under 1 quadrillion Btu lower in the KyotoProtocol case than in the reference case in 2030, and theassociated emissions are 58 million metric tons lower. Inthe short term, natural gas is expected to displace coaluse among the participating Annex I nations, becausenatural gas is cleaner than coal and has an economicadvantage over nuclear and renewable energy sources,which produce no net carbon dioxide emissions. In thelonger term, as the marginal costs of carbon dioxidereductions increase, natural gas becomes less attractivethan the non-fossil fuels (especially nuclear power),which begin to displace natural gas by 2030.
The projection for natural gas consumption in the KyotoProtocol case is 1 quadrillion Btu higher than the refer-ence case projection in 2010 but 2 quadrillion Btu lowerin 2030, when non-fossil fuel use is almost 6 quadrillionBtu higher in the Kyoto Protocol case than in the refer-ence case. Renewables account for about 1.6 quadrillionBtu of the increase and nuclear power 4.3 quadrillionBtu.
76 Energy Information Administration / International Energy Outlook 2006
Table 14. Energy Consumption and Carbon Dioxide Emissions by Fuel in Participating Annex I Countriesin Two Cases, 2010 and 2030
Fuel
Energy Consumption (Quadrillion Btu) Carbon Dioxide Emissions (Million Metric Tons)
2010 2030 2010 2030
ReferenceCase
KyotoProtocol
CaseReference
Case
KyotoProtocol
CaseReference
Case
KyotoProtocol
CaseReference
Case
KyotoProtocol
CaseOil . . . . . . . . . . 48.4 47.6 49.7 48.8 3,090 3,039 3,174 3,116Natural Gas . . . 29.3 30.5 41.0 38.9 1,548 1,610 2,167 2,054Coal . . . . . . . . . 18.5 14.2 20.2 15.5 1,719 1,285 1,874 1,370Nuclear . . . . . . 13.4 13.7 12.5 16.8 — — — —Renewables . . . 13.1 13.4 14.6 16.2 — — — —
Total . . . . . . . 122.7 119.4 138.0 136.2 6,357 5,935 7,216 6,541
Source: Energy Information Administration, System for the Analysis of Global Energy Markets (2006).

Regional Projections
Canada
In April 2005, Canada unveiled its plan for compliancewith the Kyoto Protocol, based on multiple approaches.The plan includes binding constraints on the country’selectric power sector and large-scale industrial emitters,subsidies for wind power, a “partnership fund”between government and industry, soil managementgoals, and programs in consumer awareness and volun-tary reductions by automakers. The Canadian govern-ment also has budgeted $3.2 billion to $4.0 billion forpurchases of carbon credits, depending on the permitprice [1].
In January 2006, Canada elected Conservatives to 124 of308 Parliament seats, versus 103 for the Liberal party,resulting in a change to a Conservative government.Although the new government may reevaluate and rein-terpret Canada’s Kyoto commitment, the Kyoto Protocolcase nevertheless assumes that Canada will remain aparticipant in the Protocol, and that it will achieve itsgoals through a combination of domestic actions andpurchases of emissions credits.
At the permit price of $42 per metric ton, Canadaachieves some reductions domestically below that pricein all years of the projection period. Canada’s energydemand in 2010 is 0.4 quadrillion Btu (2.6 percent) lowerin the Kyoto Protocol case than in the reference case, andits energy-related carbon dioxide emissions in 2010 are63 million metric tons (9.2 percent) lower (Table 15).
In 2010, Canada’s coal consumption and associated car-bon dioxide emissions both are about 43 percent lowerin the Kyoto Protocol case than in the reference case. In2030, its coal consumption is 32 percent lower than in thereference case, but emissions from coal are about 44 per-cent lower. The difference results from the introductionof technology that allows for the consumption of coalwith 90 percent of the carbon dioxide sequestered. Emis-sions associated with oil consumption are about the
same in the two cases in 2010 and 2030. Emissions fromnatural gas use are about the same in 2010 and 6 percentlower in the Kyoto Protocol case in 2030. Canada’s con-sumption of non-fossil energy (nuclear and renewables)in 2030 is about 24 percent higher in the Kyoto Protocolcase than in the reference case.
OECD Europe
The EU has developed its own plan for emissions trad-ing in the 2005 to 2007 period, in preparation for the firstKyoto commitment period in 2008 [2]. The EU Green-house Gas Emission Trading Scheme (EU ETS) allocatesemissions to more than 12,000 specific installationsacross 25 member countries and requires reductions orEuropean Union Allowances (EUAs) to meet the allo-cated goals.
As of publication of this report, more than a year’s worthof data has been accumulated since the EU ETS begantrading in January 2005 (Figure 70). When tradingbegan, the market price of an EUA for 1 metric ton of
Energy Information Administration / International Energy Outlook 2006 77
Table 15. Energy Consumption and Carbon DioxideEmissions by Fuel in Canada in Two Cases, 2010 and 2030
Fuel
Energy Consumption (Quadrillion Btu) Carbon Dioxide Emissions (Million Metric Tons)
2010 2030 2010 2030
ReferenceCase
KyotoProtocol
CaseReference
Case
KyotoProtocol
CaseReference
Case
KyotoProtocol
CaseReference
Case
KyotoProtocol
CaseOil . . . . . . . . . . 4.8 4.8 5.1 5.1 305 306 327 325Natural Gas . . . 4.2 4.2 5.4 5.1 224 222 286 269Coal . . . . . . . . . 1.7 1.0 2.8 1.9 154 92 260 146Nuclear . . . . . . 1.2 1.2 1.2 1.6 — — — —Renewables . . . 3.8 4.0 4.6 5.6 — — — —
Total . . . . . . . 15.6 15.2 19.2 19.3 683 620 873 741
Source: Energy Information Administration, System for the Analysis of Global Energy Markets (2006).
March2005
July2005
October2005
January2006
May2006
0
10
20
30
40Dollars per Metric Ton
Figure 70. Carbon Dioxide Allowance Price in theEuropean Union, March 2005–May 2006
Sources: Deutsche Bank Commodities Research, e-maildated May 17, 2006.

carbon dioxide was around $12,18 with prices fluctuat-ing between $25 and $35 for most of 2005 and into theearly part of 2006. The market did, however, experiencemarked volatility with the release of official estimates ofindustry emissions by country—which initially indi-cated that in 2005 Europe’s major industries emitted 44million metric tons less carbon dioxide than permitted.As a result, in late April 2006 the EUA price droppedprecipitously, from about $36 per metric ton to recordlow of $11 per ton on May 12, 2006, but then recovered tonearly $20 per metric ton on May 16, one day after theUnited Kingdom and Spain were among the countriesthat reported exceeding their emissions limits [3].
The next trading period will begin in 2008, coincidingwith the Kyoto Protocol’s first commitment period. Inthe 2008-2012 commitment period, the price of EUAswill depend on the availability of credits from Russiaand elsewhere, on the rules that ultimately apply toEuropean domestic reductions by country, and on therules governing European actions in total. As the SAGEmodel is currently configured, OECD Europe includesthe Czech Republic, Hungary, Poland, and Slovakia—countries that in last year’s report were part of the sepa-rate “Eastern Europe” region. This inclusion helps tomitigate the cost of achieving Kyoto goals for the OECDEurope region. To the extent that sharing of emissionsreduction obligations across OECD Europe is restrictedby provisions included in the Kyoto Protocol, the resultsof the Kyoto Protocol case may understate the chal-lenges faced by countries of OECD Europe that were notincluded in the old “Eastern Europe” region.
OECD Europe’s total projected energy demand is 2.2quadrillion Btu lower in the Kyoto Protocol case than inthe reference case in 2010 and 1.7 quadrillion Btu lowerin 2030, and its energy-related carbon dioxide emissionsare 284 million metric tons lower in 2010 and 446 millionmetric tons lower in 2030 (Table 16). Its coal consump-tion and associated emissions are 27 percent lower in
2010 in the Kyoto Protocol case than in the reference caseand 25 percent lower in 2030. Oil consumption andrelated emissions are about 2.4 percent lower in theKyoto Protocol case in 2030, natural gas consumptionand associated emissions are 4.4 percent lower, and con-sumption of non-fossil fuels is 24 percent higher than inthe reference case in 2030.
Japan
Japan’s plan for compliance relies heavily on carbonsinks and Clean Development Mechanisms for most ofthe required emissions reductions to meet its Kyoto goal[4]. In 2010, Japan’s energy demand is 0.7 quadrillionBtu lower in the Kyoto Protocol case than in the refer-ence case, and emissions are 72 million metric tons lower(Table 17). Assuming that the country’s goals for the firstcommitment period remain in place at the same levelthrough 2030, its total energy demand in 2030 is 0.2 qua-drillion Btu lower than in the reference case, and itsenergy-related carbon dioxide emissions are 94 millionmetric tons lower in 2030.
Japan’s coal consumption in 2030 is 10 percent lower inthe Kyoto Protocol case than in the reference case, and itsoil consumption is 1 percent lower. Electricity genera-tion from its nuclear power plants in 2030 is almost 0.7quadrillion Btu higher than in the reference case, andwith lower total energy demand, its natural gas con-sumption is 10 percent lower in the Kyoto Protocol casethan in the reference case.
References
78 Energy Information Administration / International Energy Outlook 2006
Table 16. Energy Consumption and Carbon Dioxide Emissions by Fuel in OECD Europe in Two Cases,2010 and 2030
Fuel
Energy Consumption (Quadrillion Btu) Carbon Dioxide Emissions (Million Metric Tons)
2010 2030 2010 2030
ReferenceCase
KyotoProtocol
CaseReference
Case
KyotoProtocol
CaseReference
Case
KyotoProtocol
CaseReference
Case
KyotoProtocol
CaseOil . . . . . . . . . . 32.6 32.0 33.5 32.7 2,135 2,096 2,194 2,142Natural Gas . . . 21.7 23.1 31.6 30.2 1,146 1,220 1,668 1,595Coal . . . . . . . . . 12.7 9.3 13.4 10.0 1,191 872 1,257 938Nuclear . . . . . . 9.5 9.7 7.5 10.7 — — — —Renewables . . . 7.9 8.1 8.5 9.2 — — — —
Total . . . . . . . 84.4 82.2 94.5 92.8 4,472 4,188 5,120 4,674
Source: Energy Information Administration, System for the Analysis of Global Energy Markets (2006).
1. C. Holly, “Canada Unveils Kyoto CompliancePlan,” The Energy Daily, Vol. 33, No. 74 (April 20,2005), pp. 1 and 4; and Government of Canada, Pro-ject Green: Moving Forward on Climate Change(Ottawa, Canada, April 2005), web site www.climatechange.gc.ca/kyoto_commitments/report_e.pdf.
18Credits are traded in Euros. The conversion rate used here is 1.19 U.S. dollars per Euro.

Energy Information Administration / International Energy Outlook 2006 79
Table 17. Energy Consumption and Carbon Dioxide Emissions by Fuel in Japan in Two Cases,2010 and 2030
Fuel
Energy Consumption (Quadrillion Btu) Carbon Dioxide Emissions (Million Metric Tons)
2010 2030 2010 2030
ReferenceCase
KyotoProtocol
CaseReference
Case
KyotoProtocol
CaseReference
Case
KyotoProtocol
CaseReference
Case
KyotoProtocol
CaseOil . . . . . . . . . . 11.0 10.8 11.1 11.0 648 637 652 649Natural Gas . . . 3.4 3.2 4.0 3.6 179 169 211 190Coal . . . . . . . . . 4.1 3.9 4.0 3.6 373 321 356 286Nuclear . . . . . . 2.8 2.8 3.8 4.5 — — — —Renewables . . . 1.4 1.3 1.6 1.4 — — — —
Total . . . . . . . 22.7 22.0 24.3 24.1 1,200 1,128 1,219 1,125
Source: Energy Information Administration, System for the Analysis of Global Energy Markets (2006).
2. European Commission, “Emissions Trading: Com-mission Sets Out Guidance on National Allocationsfor 2008-2012,” Press Release (January 9, 2006), website http://europa.eu.int/press_room/index_en.htm, Reference Number IP/06/9.
3. Q. Schiermeier, “Europe Fails on Carbon Limits:Industry Emitted Less Than Allowed in 2005; ButThat Isn’t Good News,” [email protected] (May 15,2006), web site www.nature.com/news/.
4. H. Yamagata, “Japan’s Climate Change Policy andKyoto Mechanisms.” Presentation at the ClimatePolicy in the U.S. and Japan: Prospects in 2005 andBeyond workshop (Tokyo, Japan, May 11-12, 2005),sponsored by Resources for the Future, web sitewww.rff.org/rff/Events/conferences.


Appendix A
Reference Case Projections:• World Energy Consumption
• Gross Domestic Product• Carbon Dioxide Emissions
• World Population


Table A1. World Total Energy Consumption by Region, Reference Case, 1990-2030(Quadrillion Btu)
Reference Case Projections
Energy Information Administration / International Energy Outlook 2006 83
Region/Country
History Projections Average AnnualPercent Change,
2003-20301990 2002 2003 2010 2015 2020 2025 2030
OECDOECD North America . . . . . . . . . . . 100.8 117.5 118.3 131.4 139.9 148.4 157.0 166.2 1.3
United Statesa. . . . . . . . . . . . . . . . . 84.6 98.1 98.1 107.9 114.2 120.6 127.0 133.9 1.2Canada . . . . . . . . . . . . . . . . . . . . . . 11.1 13.1 13.5 15.6 16.6 17.5 18.4 19.2 1.3Mexico. . . . . . . . . . . . . . . . . . . . . . . 5.0 6.2 6.8 7.9 9.1 10.3 11.7 13.2 2.5
OECD Europe . . . . . . . . . . . . . . . . . 69.9 77.9 78.9 84.4 87.2 88.7 91.3 94.5 0.7OECD Asia . . . . . . . . . . . . . . . . . . . . 26.7 36.5 37.1 40.3 42.8 44.4 46.1 48.0 1.0
Japan . . . . . . . . . . . . . . . . . . . . . . . 18.4 22.2 22.4 22.7 23.4 23.6 24.0 24.3 0.3South Korea . . . . . . . . . . . . . . . . . . 3.8 8.4 8.6 10.9 12.3 13.3 14.4 15.5 2.2Australia/New Zealand . . . . . . . . . . 4.4 6.0 6.0 6.6 7.0 7.4 7.8 8.2 1.2
Total OECD . . . . . . . . . . . . . . . . . 197.4 231.9 234.3 256.1 269.9 281.6 294.5 308.8 1.0
Non-OECDNon-OECD Europe and Eurasia. . . 67.2 46.9 48.5 56.5 62.8 68.7 74.0 79.0 1.8
Russia . . . . . . . . . . . . . . . . . . . . . . . 39.0 28.1 29.1 33.3 36.5 39.6 42.4 44.8 1.6Other . . . . . . . . . . . . . . . . . . . . . . . . 28.3 18.8 19.4 23.2 26.3 29.1 31.6 34.1 2.1
Non-OECD Asia. . . . . . . . . . . . . . . . 47.5 78.4 83.1 126.2 149.4 172.8 197.1 223.6 3.7China. . . . . . . . . . . . . . . . . . . . . . . . 27.0 42.1 45.5 77.0 91.8 106.6 121.7 139.1 4.2India . . . . . . . . . . . . . . . . . . . . . . . . 8.0 13.8 14.0 19.4 22.5 25.7 29.0 32.5 3.2Other Non-OECD Asia . . . . . . . . . . 12.5 22.5 23.6 29.8 35.1 40.6 46.4 52.0 3.0
Middle East . . . . . . . . . . . . . . . . . . . 11.3 19.1 19.6 25.0 28.2 31.2 34.3 37.7 2.4Africa . . . . . . . . . . . . . . . . . . . . . . . . 9.5 12.8 13.3 17.7 20.5 22.3 24.3 26.8 2.6Central and South America . . . . . . 14.5 21.3 21.9 28.2 32.5 36.5 41.2 45.7 2.8
Brazil . . . . . . . . . . . . . . . . . . . . . . . . 5.8 8.6 8.8 10.8 12.4 13.8 15.5 17.2 2.5Other Central and South America. . 8.8 12.7 13.1 17.4 20.1 22.7 25.7 28.5 2.9
Total Non-OECD . . . . . . . . . . . . . 150.0 178.4 186.4 253.6 293.5 331.5 371.0 412.8 3.0
Total World . . . . . . . . . . . . . . . . . . . . 347.3 410.3 420.7 509.7 563.4 613.0 665.4 721.6 2.0aIncludes the 50 States and the District of Columbia.Notes: Energy totals include net imports of coal coke and electricity generated from biomass in the United States. Totals may not
equal sum of components due to independent rounding. The electricity portion of the national fuel consumption values consists ofgeneration for domestic use plus an adjustment for electricity trade based on a fuel’s share of total generation in the exporting coun-try.
Sources: History: Energy Information Administration (EIA), International Energy Annual 2003 (May-July 2005), web site www.eia.doe.gov/iea/. Projections: EIA, Annual Energy Outlook 2006, DOE/EIA-0383(2006) (Washington, DC, February 2006), AEO2006National Energy Modeling System, run AEO2006.D111905A, web site www.eia.doe.gov/oiaf/aeo/; and System for the Analysis ofGlobal Energy Markets (2006).

Table A2. World Total Energy Consumption by Region and Fuel, Reference Case, 1990-2030(Quadrillion Btu)
Appendix A
84 Energy Information Administration / International Energy Outlook 2006
Region/Country
History Projections Average AnnualPercent Change,
2003-20301990 2002 2003 2010 2015 2020 2025 2030
OECDOECD North America
Oil . . . . . . . . . . . . . . . . . . . . . . . . . 40.5 46.3 47.2 52.3 55.5 58.3 61.4 65.0 1.2Natural Gas . . . . . . . . . . . . . . . . . 23.2 28.4 28.3 30.6 33.8 35.8 37.0 37.9 1.1Coal . . . . . . . . . . . . . . . . . . . . . . . 20.7 24.0 24.4 27.3 28.5 31.0 34.4 38.2 1.7Nuclear. . . . . . . . . . . . . . . . . . . . . 6.9 9.0 8.9 9.7 10.0 10.5 10.4 10.4 0.6Other . . . . . . . . . . . . . . . . . . . . . . 9.5 9.8 9.5 11.5 12.0 12.8 13.9 14.7 1.6
Total. . . . . . . . . . . . . . . . . . . . . . 100.8 117.5 118.3 131.4 139.9 148.4 157.0 166.2 1.3OECD Europe
Oil . . . . . . . . . . . . . . . . . . . . . . . . . 28.4 31.6 32.0 32.6 32.8 32.5 33.0 33.5 0.2Natural Gas . . . . . . . . . . . . . . . . . 11.2 17.7 18.3 21.7 24.5 26.6 29.0 31.6 2.0Coal . . . . . . . . . . . . . . . . . . . . . . . 17.6 12.8 12.8 12.7 12.7 12.9 12.9 13.4 0.2Nuclear. . . . . . . . . . . . . . . . . . . . . 7.9 9.7 9.8 9.5 9.3 8.5 7.9 7.5 -1.0Other . . . . . . . . . . . . . . . . . . . . . . 4.8 6.1 6.0 7.9 8.0 8.3 8.4 8.5 1.3
Total. . . . . . . . . . . . . . . . . . . . . . 69.9 77.9 78.9 84.4 87.2 88.7 91.3 94.5 0.7OECD Asia
Oil . . . . . . . . . . . . . . . . . . . . . . . . . 14.5 17.5 17.8 18.5 19.2 19.6 20.1 20.6 0.5Natural Gas . . . . . . . . . . . . . . . . . 2.9 5.1 5.3 5.7 6.3 6.7 6.9 7.2 1.2Coal . . . . . . . . . . . . . . . . . . . . . . . 5.2 8.2 8.4 9.7 10.2 10.5 10.9 11.5 1.2Nuclear. . . . . . . . . . . . . . . . . . . . . 2.5 4.0 3.7 4.2 4.7 5.3 5.8 6.2 2.0Other . . . . . . . . . . . . . . . . . . . . . . 1.6 1.7 1.9 2.2 2.3 2.4 2.4 2.5 0.9
Total. . . . . . . . . . . . . . . . . . . . . . 26.7 36.5 37.1 40.3 42.8 44.4 46.1 48.0 1.0Total OECD
Oil . . . . . . . . . . . . . . . . . . . . . . . . . 83.4 95.4 97.0 103.3 107.5 110.3 114.5 119.1 0.8Natural Gas . . . . . . . . . . . . . . . . . 37.2 51.2 51.9 58.0 64.7 69.1 72.9 76.8 1.5Coal . . . . . . . . . . . . . . . . . . . . . . . 43.5 44.9 45.6 49.7 51.4 54.3 58.3 63.1 1.2Nuclear. . . . . . . . . . . . . . . . . . . . . 17.3 22.7 22.3 23.4 24.0 24.3 24.1 24.1 0.3Other . . . . . . . . . . . . . . . . . . . . . . 15.9 17.6 17.4 21.7 22.3 23.5 24.7 25.7 1.5
Total. . . . . . . . . . . . . . . . . . . . . . 197.4 231.9 234.3 256.1 269.9 281.6 294.5 308.8 1.0
Non-OECDNon-OECD Europe and Eurasia
Oil . . . . . . . . . . . . . . . . . . . . . . . . . 19.5 9.9 10.1 11.4 12.4 13.0 14.0 14.8 1.4Natural Gas . . . . . . . . . . . . . . . . . 27.5 23.0 24.3 29.4 32.4 35.8 38.6 41.7 2.0Coal . . . . . . . . . . . . . . . . . . . . . . . 15.1 8.3 8.4 8.7 9.8 10.8 11.7 12.6 1.5Nuclear. . . . . . . . . . . . . . . . . . . . . 2.5 2.8 2.8 3.1 3.5 4.3 4.8 4.9 2.0Other . . . . . . . . . . . . . . . . . . . . . . 2.8 3.0 3.0 4.0 4.6 4.7 4.9 5.0 1.9
Total. . . . . . . . . . . . . . . . . . . . . . 67.2 46.9 48.5 56.5 62.8 68.7 74.0 79.0 1.8Non-OECD Asia
Oil . . . . . . . . . . . . . . . . . . . . . . . . . 13.9 26.7 27.9 38.3 43.5 49.3 55.2 61.7 3.0Natural Gas . . . . . . . . . . . . . . . . . 3.0 7.3 7.9 12.4 16.6 20.8 25.5 30.6 5.2Coal . . . . . . . . . . . . . . . . . . . . . . . 27.2 38.7 41.2 63.7 75.7 87.0 98.6 111.3 3.8Nuclear. . . . . . . . . . . . . . . . . . . . . 0.4 0.9 1.0 2.0 2.9 3.8 4.6 5.3 6.3Other . . . . . . . . . . . . . . . . . . . . . . 3.0 4.9 5.1 9.8 10.8 11.9 13.2 14.8 4.0
Total. . . . . . . . . . . . . . . . . . . . . . 47.5 78.4 83.1 126.2 149.4 172.8 197.1 223.6 3.7
See notes at end of table.

Table A2. World Total Energy Consumption by Region and Fuel, Reference Case, 1990-2030 (Continued)(Quadrillion Btu)
Reference Case Projections
Energy Information Administration / International Energy Outlook 2006 85
Region/Country
History Projections Average AnnualPercent Change,
2002-20251990 2002 2003 2010 2015 2020 2025 2030
Non-OECD (Continued)Middle East
Oil . . . . . . . . . . . . . . . . . . . . . . . . . 7.2 10.5 10.8 12.4 13.5 14.3 15.2 16.0 1.5Natural Gas . . . . . . . . . . . . . . . . . 3.8 8.0 8.2 11.6 13.7 15.7 18.0 20.5 3.4Coal . . . . . . . . . . . . . . . . . . . . . . . 0.1 0.4 0.4 0.4 0.4 0.4 0.4 0.5 0.8Nuclear. . . . . . . . . . . . . . . . . . . . . 0.0 0.0 0.0 0.1 0.1 0.1 0.1 0.1 —Other . . . . . . . . . . . . . . . . . . . . . . 0.1 0.2 0.2 0.6 0.6 0.7 0.7 0.8 4.5
Total. . . . . . . . . . . . . . . . . . . . . . 11.3 19.1 19.6 25.0 28.2 31.2 34.3 37.7 2.4Africa
Oil . . . . . . . . . . . . . . . . . . . . . . . . . 4.3 5.4 5.5 7.6 8.3 8.8 9.3 10.1 2.3Natural Gas . . . . . . . . . . . . . . . . . 1.5 2.6 2.7 3.5 4.9 6.1 7.4 8.7 4.4Coal . . . . . . . . . . . . . . . . . . . . . . . 3.0 3.7 4.1 5.3 5.9 6.1 6.2 6.4 1.7Nuclear. . . . . . . . . . . . . . . . . . . . . 0.1 0.1 0.1 0.1 0.2 0.2 0.2 0.2 0.7Other . . . . . . . . . . . . . . . . . . . . . . 0.6 0.9 0.9 1.2 1.3 1.3 1.3 1.5 1.9
Total. . . . . . . . . . . . . . . . . . . . . . 9.5 12.8 13.3 17.7 20.5 22.3 24.3 26.8 2.6Central and South America
Oil . . . . . . . . . . . . . . . . . . . . . . . . . 7.7 10.8 10.8 12.6 13.9 15.0 16.2 17.5 1.8Natural Gas . . . . . . . . . . . . . . . . . 2.2 3.8 4.1 6.3 7.6 8.7 10.2 11.6 3.9Coal . . . . . . . . . . . . . . . . . . . . . . . 0.6 0.7 0.8 1.0 1.1 1.4 1.5 1.6 2.9Nuclear. . . . . . . . . . . . . . . . . . . . . 0.1 0.2 0.2 0.2 0.4 0.3 0.4 0.3 0.5Other . . . . . . . . . . . . . . . . . . . . . . 3.9 5.7 6.0 8.1 9.5 11.1 12.9 14.7 3.3
Total. . . . . . . . . . . . . . . . . . . . . . 14.5 21.3 21.9 28.2 32.5 36.5 41.2 45.7 2.8Total Non-OECD
Oil . . . . . . . . . . . . . . . . . . . . . . . . . 52.7 63.3 65.1 82.3 91.6 100.4 109.8 120.0 2.3Natural Gas . . . . . . . . . . . . . . . . . 38.0 44.7 47.2 63.1 75.1 87.0 99.6 113.1 3.3Coal . . . . . . . . . . . . . . . . . . . . . . . 45.9 51.8 54.8 79.1 92.9 105.7 118.4 132.4 3.3Nuclear. . . . . . . . . . . . . . . . . . . . . 3.1 4.0 4.2 5.5 7.0 8.7 10.0 10.6 3.5Other . . . . . . . . . . . . . . . . . . . . . . 10.3 14.6 15.2 23.6 26.8 29.6 33.1 36.7 3.3
Total. . . . . . . . . . . . . . . . . . . . . . 150.0 178.4 186.4 253.6 293.5 331.5 371.0 412.8 3.0
Total WorldOil . . . . . . . . . . . . . . . . . . . . . . . . . 136.1 158.7 162.1 185.6 199.1 210.8 224.3 239.1 1.4Natural Gas . . . . . . . . . . . . . . . . . 75.2 95.9 99.1 121.1 139.8 156.1 172.5 189.9 2.4Coal . . . . . . . . . . . . . . . . . . . . . . . 89.4 96.8 100.4 128.8 144.4 160.1 176.7 195.5 2.5Nuclear. . . . . . . . . . . . . . . . . . . . . 20.4 26.7 26.5 28.9 31.0 32.9 34.0 34.7 1.0Other . . . . . . . . . . . . . . . . . . . . . . 26.3 32.2 32.7 45.2 49.1 53.1 57.8 62.4 2.4
Total. . . . . . . . . . . . . . . . . . . . . . 347.3 410.3 420.7 509.7 563.4 613.0 665.4 721.6 2.0
Notes: Energy totals include net imports of coal coke and electricity generated from biomass in the United States. Totals may notequal sum of components due to independent rounding. The electricity portion of the national fuel consumption values consists ofgeneration for domestic use plus an adjustment for electricity trade based on a fuel’s share of total generation in the exporting coun-try.
Sources: History: Energy Information Administration (EIA), International Energy Annual 2003 (May-July 2005), web site www.eia.doe.gov/iea/. Projections: EIA, Annual Energy Outlook 2006, DOE/EIA-0383(2006) (Washington, DC, February 2006), AEO2006National Energy Modeling System, run AEO2006.D111905A, web site www.eia.doe.gov/oiaf/aeo/; and System for the Analysis ofGlobal Energy Markets (2006).

Table A3. World Gross Domestic Product (GDP) by Region Using Purchasing Power Parity,Reference Case, 1990-2030(Billion 2000 Dollars)
Appendix A
86 Energy Information Administration / International Energy Outlook 2006
Region/Country
History Projections Average AnnualPercent Change,
2003-20301990 2002 2003 2010 2015 2020 2025 2030
OECDOECD North America . . . . . . . . . . . 8,477 11,968 12,273 15,503 17,986 20,940 24,083 27,733 3.1
United Statesa. . . . . . . . . . . . . . . . . 7,113 10,049 10,321 13,043 15,082 17,541 20,123 23,112 3.0Canada . . . . . . . . . . . . . . . . . . . . . . 684 957 977 1,190 1,343 1,484 1,614 1,753 2.2Mexico. . . . . . . . . . . . . . . . . . . . . . . 680 962 976 1,271 1,561 1,916 2,346 2,868 4.1
OECD Europe . . . . . . . . . . . . . . . . . 8,017 10,647 10,799 12,713 14,194 15,799 17,508 19,394 2.2OECD Asia . . . . . . . . . . . . . . . . . . . . 3,655 4,628 4,716 5,615 6,265 6,811 7,343 7,924 1.9
Japan . . . . . . . . . . . . . . . . . . . . . . . 2,898 3,329 3,375 3,858 4,192 4,438 4,653 4,878 1.4South Korea . . . . . . . . . . . . . . . . . . 330 663 683 966 1,180 1,368 1,560 1,776 3.6Australia/New Zealand . . . . . . . . . . 428 637 657 791 893 1,005 1,130 1,270 2.5Total OECD . . . . . . . . . . . . . . . . . 20,150 27,243 27,788 33,832 38,445 43,550 48,934 55,051 2.6
Non-OECDNon-OECD Europe and Eurasia. . . 3,387 2,672 2,878 4,315 5,345 6,494 7,759 9,190 4.4
Russia . . . . . . . . . . . . . . . . . . . . . . . 2,241 1,658 1,780 2,531 3,059 3,656 4,304 5,005 3.9Other . . . . . . . . . . . . . . . . . . . . . . . . 1,146 1,013 1,099 1,784 2,286 2,837 3,455 4,185 5.1
Non-OECD Asia. . . . . . . . . . . . . . . . 5,780 12,559 13,516 21,134 27,606 35,422 44,905 56,707 5.5China. . . . . . . . . . . . . . . . . . . . . . . . 1,807 5,494 5,994 10,116 13,538 17,615 22,592 28,833 6.0India . . . . . . . . . . . . . . . . . . . . . . . . 1,684 3,160 3,429 5,162 6,694 8,644 11,059 14,102 5.4Other Non-OECD Asia . . . . . . . . . . 2,289 3,905 4,093 5,856 7,374 9,162 11,255 13,772 4.6
Middle East . . . . . . . . . . . . . . . . . . . 810 1,295 1,357 1,946 2,376 2,863 3,423 4,085 4.2Africa . . . . . . . . . . . . . . . . . . . . . . . . 1,461 2,074 2,173 3,073 3,815 4,684 5,717 6,970 4.4Central and South America . . . . . . 2,174 3,011 3,075 4,136 4,956 5,904 7,015 8,328 3.8
Brazil . . . . . . . . . . . . . . . . . . . . . . . . 1,022 1,370 1,378 1,796 2,127 2,510 2,951 3,462 3.5Other Central and South America. . 1,153 1,641 1,697 2,340 2,828 3,395 4,064 4,866 4.0Total Non-OECD . . . . . . . . . . . . . 13,612 21,611 22,999 34,603 44,098 55,366 68,820 85,281 5.0
Total World . . . . . . . . . . . . . . . . . . . . 33,761 48,854 50,786 68,435 82,544 98,917 117,754 140,331 3.8aIncludes the 50 States and the District of Columbia.Notes: Totals may not equal sum of components due to independent rounding. GDP growth rates for China and India were
adjusted, based on the analyst’s judgment.Sources: History: Global Insight, Inc., World Overview (Lexington, MA, various issues). Projections: Global Insight, Inc., World
Overview, Fourth Quarter 2005 (Lexington, MA, January 2006); and Energy Information Administration, Annual Energy Outlook2006, DOE/EIA-0383(2006) (Washington DC, February 2006), Table A19.

Table A4. World Oil Consumption by Region, Reference Case, 1990-2030(Million Barrels per Day)
Reference Case Projections
Energy Information Administration / International Energy Outlook 2006 87
Region/Country
History Projections Average AnnualPercent Change,
2003-20301990 2002 2003 2010 2015 2020 2025 2030
OECDOECD North America . . . . . . . . . . . 20.5 23.8 24.3 26.8 28.5 30.0 31.5 33.4 1.2
United Statesa. . . . . . . . . . . . . . . . . 17.0 19.8 20.1 22.2 23.5 24.8 26.1 27.6 1.2Canada . . . . . . . . . . . . . . . . . . . . . . 1.7 2.1 2.2 2.4 2.5 2.5 2.6 2.6 0.6Mexico. . . . . . . . . . . . . . . . . . . . . . . 1.8 1.9 2.0 2.2 2.5 2.7 2.9 3.2 1.7
OECD Europe . . . . . . . . . . . . . . . . . 13.7 15.3 15.5 15.8 15.9 15.8 16.0 16.3 0.2OECD Asia . . . . . . . . . . . . . . . . . . . . 7.1 8.6 8.8 9.1 9.4 9.6 9.9 10.1 0.5
Japan . . . . . . . . . . . . . . . . . . . . . . . 5.2 5.5 5.6 5.4 5.5 5.4 5.5 5.4 -0.1South Korea . . . . . . . . . . . . . . . . . . 1.0 2.1 2.2 2.6 2.9 3.0 3.2 3.5 1.7Australia/New Zealand . . . . . . . . . . 0.8 1.0 1.0 1.1 1.1 1.1 1.2 1.2 0.6
Total OECD . . . . . . . . . . . . . . . . . 41.3 47.7 48.5 51.7 53.9 55.3 57.4 59.7 0.8
Non-OECDNon-OECD Europe and Eurasia. . . 9.3 4.8 4.9 5.5 6.0 6.3 6.7 7.1 1.4
Russia . . . . . . . . . . . . . . . . . . . . . . . 5.4 2.6 2.7 2.8 3.1 3.1 3.3 3.4 0.9Other . . . . . . . . . . . . . . . . . . . . . . . . 3.9 2.1 2.2 2.6 2.9 3.2 3.5 3.8 2.0
Non-OECD Asia. . . . . . . . . . . . . . . . 6.6 12.9 13.5 18.5 21.0 23.8 26.7 29.8 3.0China. . . . . . . . . . . . . . . . . . . . . . . . 2.3 5.2 5.6 8.7 10.0 11.7 13.2 15.0 3.8India . . . . . . . . . . . . . . . . . . . . . . . . 1.2 2.3 2.3 2.9 3.3 3.7 4.1 4.5 2.4Other Non-OECD Asia . . . . . . . . . . 3.1 5.5 5.6 6.9 7.7 8.5 9.4 10.3 2.3
Middle East . . . . . . . . . . . . . . . . . . . 3.5 5.1 5.3 6.1 6.6 7.0 7.4 7.8 1.5Africa . . . . . . . . . . . . . . . . . . . . . . . . 2.1 2.7 2.7 3.7 4.0 4.3 4.5 4.9 2.3Central and South America . . . . . . 3.8 5.3 5.3 6.2 6.8 7.3 7.9 8.5 1.8
Brazil . . . . . . . . . . . . . . . . . . . . . . . . 1.5 2.1 2.1 2.4 2.6 2.8 3.1 3.3 1.7Other Central and South America. . 2.3 3.1 3.2 3.8 4.2 4.5 4.8 5.2 1.9
Total Non-OECD . . . . . . . . . . . . . 25.3 30.7 31.6 39.9 44.5 48.7 53.3 58.2 2.3
Total World . . . . . . . . . . . . . . . . . . . . 66.6 78.5 80.1 91.6 98.3 104.1 110.7 118.0 1.4aIncludes the 50 States and the District of Columbia.Note: Totals may not equal sum of components due to independent rounding.Sources: History: Energy Information Administration (EIA), International Energy Annual 2003 (May-July 2005), web site www.eia.
doe.gov/iea/. Projections: EIA, Annual Energy Outlook 2006, DOE/EIA-0383(2006) (Washington, DC, February 2006), AEO2006National Energy Modeling System, run AEO2006.D111905A, web site www.eia.doe.gov/oiaf/aeo/; and System for the Analysis ofGlobal Energy Markets (2006).

Table A5. World Natural Gas Consumption by Region, Reference Case, 1990-2030(Trillion Cubic Feet)
Appendix A
88 Energy Information Administration / International Energy Outlook 2006
Region/Country
History Projections Average AnnualPercent Change,
2003-20301990 2002 2003 2010 2015 2020 2025 2030
OECDOECD North America . . . . . . . . . . . 22.5 27.6 27.4 29.6 32.7 34.7 35.7 36.6 1.1
United Statesa. . . . . . . . . . . . . . . . . 19.2 23.0 22.3 23.4 25.9 26.9 27.0 26.9 0.7Canada . . . . . . . . . . . . . . . . . . . . . . 2.4 3.1 3.2 4.2 4.2 4.7 5.0 5.3 1.9Mexico. . . . . . . . . . . . . . . . . . . . . . . 0.9 1.5 1.8 2.1 2.6 3.1 3.8 4.5 3.4
OECD Europe . . . . . . . . . . . . . . . . . 11.6 17.2 17.8 21.1 23.9 25.8 28.2 30.8 2.0OECD Asia . . . . . . . . . . . . . . . . . . . . 2.8 4.8 5.0 5.4 5.9 6.3 6.5 6.8 1.2
Japan . . . . . . . . . . . . . . . . . . . . . . . 1.9 2.9 3.1 3.2 3.5 3.6 3.6 3.8 0.8South Korea . . . . . . . . . . . . . . . . . . 0.1 0.8 0.9 1.0 1.2 1.3 1.3 1.3 1.7Australia/New Zealand . . . . . . . . . . 0.8 1.1 1.1 1.1 1.3 1.5 1.6 1.7 1.7
Total OECD . . . . . . . . . . . . . . . . . 36.8 49.6 50.2 56.1 62.6 66.8 70.5 74.2 1.5
Non-OECDNon-OECD Europe and Eurasia. . . 26.7 22.3 23.6 28.6 31.5 34.8 37.5 40.5 2.0
Russia . . . . . . . . . . . . . . . . . . . . . . . 17.3 14.6 15.3 18.1 19.3 21.2 22.4 23.6 1.6Other . . . . . . . . . . . . . . . . . . . . . . . . 9.5 7.8 8.3 10.5 12.2 13.6 15.1 16.9 2.7
Non-OECD Asia. . . . . . . . . . . . . . . . 2.9 6.9 7.5 11.7 15.6 19.6 24.0 28.8 5.1China. . . . . . . . . . . . . . . . . . . . . . . . 0.5 1.1 1.2 3.0 3.9 5.1 6.2 7.0 6.8India . . . . . . . . . . . . . . . . . . . . . . . . 0.4 0.9 1.0 1.5 1.7 2.2 3.1 4.5 5.9Other Non-OECD Asia . . . . . . . . . . 2.0 4.9 5.4 7.3 10.0 12.3 14.7 17.3 4.4
Middle East . . . . . . . . . . . . . . . . . . . 3.6 7.6 7.9 11.0 13.0 15.0 17.1 19.6 3.4Africa . . . . . . . . . . . . . . . . . . . . . . . . 1.4 2.4 2.6 3.3 4.6 5.6 6.8 8.1 4.4Central and South America . . . . . . 2.0 3.6 3.8 5.8 7.0 8.1 9.5 10.8 3.9
Brazil . . . . . . . . . . . . . . . . . . . . . . . . 0.1 0.5 0.5 1.0 1.1 1.2 1.4 1.7 4.6Other Central and South America. . 1.9 3.1 3.3 4.8 6.0 6.9 8.1 9.1 3.8
Total Non-OECD . . . . . . . . . . . . . 36.5 42.9 45.3 60.4 71.8 83.1 94.9 107.8 3.3
Total World . . . . . . . . . . . . . . . . . . . . 73.4 92.5 95.5 116.5 134.3 149.9 165.5 182.0 2.4aIncludes the 50 States and the District of Columbia.Note: Totals may not equal sum of components due to independent rounding.Sources: History: Energy Information Administration (EIA), International Energy Annual 2003 (May-July 2005), web site www.eia.
doe.gov/iea/. Projections: EIA, Annual Energy Outlook 2006, DOE/EIA-0383(2006) (Washington, DC, February 2006), AEO2006National Energy Modeling System, run AEO2006.D111905A, web site www.eia.doe.gov/oiaf/aeo/; and System for the Analysis ofGlobal Energy Markets (2006).
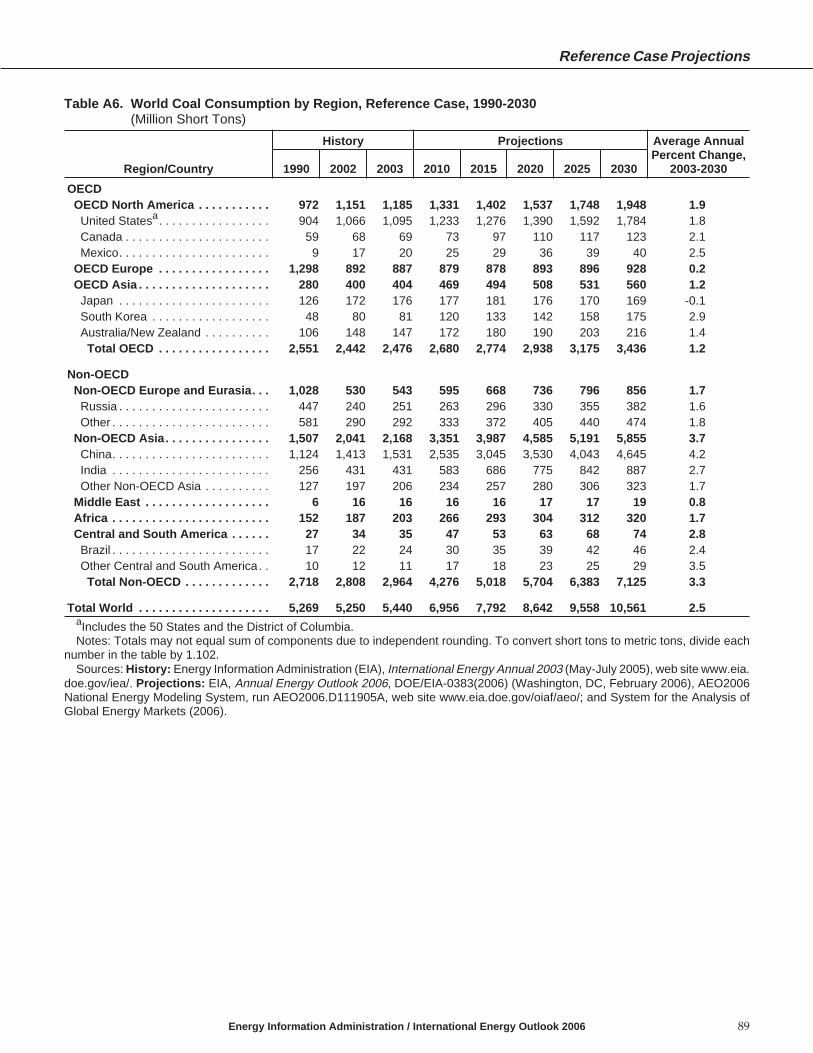
Table A6. World Coal Consumption by Region, Reference Case, 1990-2030(Million Short Tons)
Reference Case Projections
Energy Information Administration / International Energy Outlook 2006 89
Region/Country
History Projections Average AnnualPercent Change,
2003-20301990 2002 2003 2010 2015 2020 2025 2030
OECDOECD North America . . . . . . . . . . . 972 1,151 1,185 1,331 1,402 1,537 1,748 1,948 1.9
United Statesa. . . . . . . . . . . . . . . . . 904 1,066 1,095 1,233 1,276 1,390 1,592 1,784 1.8Canada . . . . . . . . . . . . . . . . . . . . . . 59 68 69 73 97 110 117 123 2.1Mexico. . . . . . . . . . . . . . . . . . . . . . . 9 17 20 25 29 36 39 40 2.5
OECD Europe . . . . . . . . . . . . . . . . . 1,298 892 887 879 878 893 896 928 0.2OECD Asia . . . . . . . . . . . . . . . . . . . . 280 400 404 469 494 508 531 560 1.2
Japan . . . . . . . . . . . . . . . . . . . . . . . 126 172 176 177 181 176 170 169 -0.1South Korea . . . . . . . . . . . . . . . . . . 48 80 81 120 133 142 158 175 2.9Australia/New Zealand . . . . . . . . . . 106 148 147 172 180 190 203 216 1.4
Total OECD . . . . . . . . . . . . . . . . . 2,551 2,442 2,476 2,680 2,774 2,938 3,175 3,436 1.2
Non-OECDNon-OECD Europe and Eurasia. . . 1,028 530 543 595 668 736 796 856 1.7
Russia . . . . . . . . . . . . . . . . . . . . . . . 447 240 251 263 296 330 355 382 1.6Other . . . . . . . . . . . . . . . . . . . . . . . . 581 290 292 333 372 405 440 474 1.8
Non-OECD Asia. . . . . . . . . . . . . . . . 1,507 2,041 2,168 3,351 3,987 4,585 5,191 5,855 3.7China. . . . . . . . . . . . . . . . . . . . . . . . 1,124 1,413 1,531 2,535 3,045 3,530 4,043 4,645 4.2India . . . . . . . . . . . . . . . . . . . . . . . . 256 431 431 583 686 775 842 887 2.7Other Non-OECD Asia . . . . . . . . . . 127 197 206 234 257 280 306 323 1.7
Middle East . . . . . . . . . . . . . . . . . . . 6 16 16 16 16 17 17 19 0.8Africa . . . . . . . . . . . . . . . . . . . . . . . . 152 187 203 266 293 304 312 320 1.7Central and South America . . . . . . 27 34 35 47 53 63 68 74 2.8
Brazil . . . . . . . . . . . . . . . . . . . . . . . . 17 22 24 30 35 39 42 46 2.4Other Central and South America. . 10 12 11 17 18 23 25 29 3.5
Total Non-OECD . . . . . . . . . . . . . 2,718 2,808 2,964 4,276 5,018 5,704 6,383 7,125 3.3
Total World . . . . . . . . . . . . . . . . . . . . 5,269 5,250 5,440 6,956 7,792 8,642 9,558 10,561 2.5aIncludes the 50 States and the District of Columbia.Notes: Totals may not equal sum of components due to independent rounding. To convert short tons to metric tons, divide each
number in the table by 1.102.Sources: History: Energy Information Administration (EIA), International Energy Annual 2003 (May-July 2005), web site www.eia.
doe.gov/iea/. Projections: EIA, Annual Energy Outlook 2006, DOE/EIA-0383(2006) (Washington, DC, February 2006), AEO2006National Energy Modeling System, run AEO2006.D111905A, web site www.eia.doe.gov/oiaf/aeo/; and System for the Analysis ofGlobal Energy Markets (2006).

Table A7. World Nuclear Energy Consumption by Region, Reference Case, 1990-2030(Billion Kilowatthours)
Appendix A
90 Energy Information Administration / International Energy Outlook 2006
Region/Country
History Projections Average AnnualPercent Change,
2003-20301990 2002 2003 2010 2015 2020 2025 2030
OECDOECD North America . . . . . . . . . . . 649 861 844 923 953 994 989 989 0.6
United Statesa. . . . . . . . . . . . . . . . . 577 780 764 809 829 871 871 871 0.5Canada . . . . . . . . . . . . . . . . . . . . . . 69 72 71 104 113 113 108 108 1.6Mexico. . . . . . . . . . . . . . . . . . . . . . . 3 9 10 11 11 11 11 11 0.2
OECD Europe . . . . . . . . . . . . . . . . . 743 923 930 896 877 807 748 707 -1.0OECD Asia . . . . . . . . . . . . . . . . . . . . 242 393 360 416 464 518 567 610 2.0
Japan . . . . . . . . . . . . . . . . . . . . . . . 192 280 237 274 289 318 350 371 1.7South Korea . . . . . . . . . . . . . . . . . . 50 113 123 142 175 200 217 239 2.5Australia/New Zealand . . . . . . . . . . 0 0 0 0 0 0 0 0 —
Total OECD . . . . . . . . . . . . . . . . . 1,635 2,178 2,135 2,234 2,294 2,320 2,304 2,307 0.3
Non-OECDNon-OECD Europe and Eurasia. . . 219 254 258 278 323 393 441 443 2.0
Russia . . . . . . . . . . . . . . . . . . . . . . . 115 134 138 151 190 233 286 321 3.2Other . . . . . . . . . . . . . . . . . . . . . . . . 104 120 120 127 133 160 155 122 0.1
Non-OECD Asia. . . . . . . . . . . . . . . . 38 83 97 187 268 356 434 504 6.3China. . . . . . . . . . . . . . . . . . . . . . . . 0 25 42 79 130 171 230 304 7.6India . . . . . . . . . . . . . . . . . . . . . . . . 6 18 16 56 76 99 106 112 7.4Other Non-OECD Asia . . . . . . . . . . 32 40 39 52 62 85 98 89 3.1
Middle East . . . . . . . . . . . . . . . . . . . 0 0 0 6 6 6 6 6 —Africa . . . . . . . . . . . . . . . . . . . . . . . . 8 12 13 14 15 15 15 15 0.7Central and South America . . . . . . 9 19 20 21 35 32 33 24 0.6
Brazil . . . . . . . . . . . . . . . . . . . . . . . . 2 14 13 13 22 23 23 19 1.2Other Central and South America. . 7 5 7 7 12 10 10 5 -1.1
Total Non-OECD . . . . . . . . . . . . . 274 368 388 505 647 802 929 993 3.5
Total World . . . . . . . . . . . . . . . . . . . . 1,909 2,546 2,523 2,739 2,940 3,122 3,233 3,299 1.0aIncludes the 50 States and the District of Columbia.Note: Totals may not equal sum of components due to independent rounding.Sources: History: Energy Information Administration (EIA), International Energy Annual 2003 (May-July 2005), web site www.eia.
doe.gov/iea/. Projections: EIA, Annual Energy Outlook 2006, DOE/EIA-0383(2006) (Washington, DC, February 2006), AEO2006National Energy Modeling System, run AEO2006.D111905A, web site www.eia.doe.gov/oiaf/aeo/; and System for the Analysis ofGlobal Energy Markets (2006).

Table A8. World Consumption of Hydroelectricity and Other Renewable Energy by Region, Reference Case,1990-2030(Quadrillion Btu)
Reference Case Projections
Energy Information Administration / International Energy Outlook 2006 91
Region/Country
History Projections Average AnnualPercent Change,
2003-20301990 2002 2003 2010 2015 2020 2025 2030
OECDOECD North America . . . . . . . . . . . 9.5 9.8 9.5 11.5 12.0 12.8 13.9 14.7 1.6
United Statesa. . . . . . . . . . . . . . . . . 6.1 5.9 5.7 7.2 7.5 8.1 8.7 9.1 1.7Canada . . . . . . . . . . . . . . . . . . . . . . 3.1 3.6 3.5 3.8 3.8 4.0 4.3 4.6 1.0Mexico. . . . . . . . . . . . . . . . . . . . . . . 0.3 0.4 0.3 0.6 0.7 0.8 0.9 1.1 4.5
OECD Europe . . . . . . . . . . . . . . . . . 4.8 6.1 6.0 7.9 8.0 8.3 8.4 8.5 1.3OECD Asia . . . . . . . . . . . . . . . . . . . . 1.6 1.7 1.9 2.2 2.3 2.4 2.4 2.5 0.9
Japan . . . . . . . . . . . . . . . . . . . . . . . 1.1 1.1 1.4 1.4 1.5 1.5 1.5 1.6 0.4South Korea . . . . . . . . . . . . . . . . . . 0.0 0.0 0.1 0.2 0.3 0.3 0.3 0.3 6.7Australia/New Zealand . . . . . . . . . . 0.4 0.5 0.5 0.6 0.6 0.6 0.6 0.6 0.8
Total OECD . . . . . . . . . . . . . . . . . 15.9 17.6 17.4 21.7 22.3 23.5 24.7 25.7 1.5
Non-OECDNon-OECD Europe and Eurasia. . . 2.8 3.0 3.0 4.0 4.6 4.7 4.9 5.0 1.9
Russia . . . . . . . . . . . . . . . . . . . . . . . 1.8 1.9 1.8 2.4 2.9 2.9 3.0 3.1 2.0Other . . . . . . . . . . . . . . . . . . . . . . . . 1.0 1.1 1.2 1.6 1.7 1.9 1.9 1.9 1.8
Non-OECD Asia. . . . . . . . . . . . . . . . 3.0 4.9 5.1 9.8 10.8 11.9 13.2 14.8 4.0China. . . . . . . . . . . . . . . . . . . . . . . . 1.3 2.8 2.9 6.1 6.8 7.1 7.3 7.6 3.7India . . . . . . . . . . . . . . . . . . . . . . . . 0.7 0.7 0.7 1.3 1.3 1.5 1.8 2.2 4.2Other Non-OECD Asia . . . . . . . . . . 0.9 1.4 1.5 2.4 2.6 3.3 4.1 4.9 4.5
Middle East . . . . . . . . . . . . . . . . . . . 0.1 0.2 0.2 0.6 0.6 0.7 0.7 0.8 4.5Africa . . . . . . . . . . . . . . . . . . . . . . . . 0.6 0.9 0.9 1.2 1.3 1.3 1.3 1.5 1.9Central and South America . . . . . . 3.9 5.7 6.0 8.1 9.5 11.1 12.9 14.7 3.3
Brazil . . . . . . . . . . . . . . . . . . . . . . . . 2.2 3.0 3.3 4.2 5.0 5.8 6.7 7.6 3.2Other Central and South America. . 1.7 2.7 2.8 3.9 4.5 5.3 6.3 7.1 3.6
Total Non-OECD . . . . . . . . . . . . . 10.3 14.6 15.2 23.6 26.8 29.6 33.1 36.7 3.3
Total World . . . . . . . . . . . . . . . . . . . . 26.3 32.2 32.7 45.2 49.1 53.1 57.8 62.4 2.4aIncludes the 50 States and the District of Columbia.Notes: Totals may not equal sum of components due to independent rounding. U.S. totals include net electricity imports, methanol,
and liquid hydrogen.Sources: History: Energy Information Administration (EIA), International Energy Annual 2003 (May-July 2005), web site www.eia.
doe.gov/iea/. Projections: EIA, Annual Energy Outlook 2006, DOE/EIA-0383(2006) (Washington, DC, February 2006), AEO2006National Energy Modeling System, run AEO2006.D111905A, web site www.eia.doe.gov/oiaf/aeo/; and System for the Analysis ofGlobal Energy Markets (2006).

Table A9. World Net Electricity Consumption by Region, Reference Case, 1990-2030(Billion Kilowatthours)
Appendix A
92 Energy Information Administration / International Energy Outlook 2006
Region/Country
History Projections Average AnnualPercent Change,
2003-20301990 2002 2003 2010 2015 2020 2025 2030
OECDOECD North America . . . . . . . . . . . 3,379 4,337 4,384 5,036 5,495 5,969 6,444 6,969 1.7
United Statesa. . . . . . . . . . . . . . . . . 2,837 3,629 3,669 4,155 4,491 4,844 5,208 5,619 1.6Canada . . . . . . . . . . . . . . . . . . . . . . 435 518 521 605 660 706 740 776 1.5Mexico. . . . . . . . . . . . . . . . . . . . . . . 107 190 194 277 344 419 496 574 4.1
OECD Europe . . . . . . . . . . . . . . . . . 2,355 2,916 2,965 3,343 3,519 3,692 3,890 4,107 1.2OECD Asia . . . . . . . . . . . . . . . . . . . . 1,024 1,463 1,487 1,749 1,870 1,956 2,041 2,132 1.3
Japan . . . . . . . . . . . . . . . . . . . . . . . 764 964 946 1,054 1,092 1,112 1,131 1,151 0.7South Korea . . . . . . . . . . . . . . . . . . 93 268 303 424 487 534 578 625 2.7Australia/New Zealand . . . . . . . . . . 166 231 238 271 291 311 333 356 1.5
Total OECD . . . . . . . . . . . . . . . . . 6,758 8,715 8,836 10,129 10,885 11,618 12,375 13,208 1.5
Non-OECDNon-OECD Europe and Eurasia. . . 1,672 1,318 1,350 1,836 2,123 2,396 2,629 2,850 2.8
Russia . . . . . . . . . . . . . . . . . . . . . . . 955 796 812 1,082 1,236 1,394 1,523 1,641 2.6Other . . . . . . . . . . . . . . . . . . . . . . . . 717 522 539 755 887 1,002 1,106 1,208 3.0
Non-OECD Asia. . . . . . . . . . . . . . . . 1,150 2,655 2,917 4,713 5,896 7,154 8,513 10,027 4.7China. . . . . . . . . . . . . . . . . . . . . . . . 551 1,452 1,671 2,783 3,504 4,256 5,062 5,971 4.8India . . . . . . . . . . . . . . . . . . . . . . . . 257 525 519 845 1,042 1,251 1,474 1,730 4.6Other Non-OECD Asia . . . . . . . . . . 342 678 726 1,085 1,350 1,646 1,978 2,326 4.4
Middle East . . . . . . . . . . . . . . . . . . . 214 457 471 681 782 872 955 1,034 3.0Africa . . . . . . . . . . . . . . . . . . . . . . . . 286 420 436 561 660 750 846 951 2.9Central and South America . . . . . . 463 736 772 1,125 1,353 1,582 1,815 2,047 3.7
Brazil . . . . . . . . . . . . . . . . . . . . . . . . 229 353 371 520 610 698 784 871 3.2Other Central and South America. . 234 383 400 605 743 884 1,031 1,176 4.1
Total Non-OECD . . . . . . . . . . . . . 3,785 5,586 5,944 8,916 10,814 12,753 14,758 16,908 3.9
Total World . . . . . . . . . . . . . . . . . . . . 10,543 14,301 14,781 19,045 21,699 24,371 27,133 30,116 2.7aIncludes the 50 States and the District of Columbia.Note: Totals may not equal sum of components due to independent rounding.Sources: History: Energy Information Administration (EIA), International Energy Annual 2003 (May-July 2005), web site www.eia.
doe.gov/iea/. Projections: EIA, Annual Energy Outlook 2006, DOE/EIA-0383(2006) (Washington, DC, February 2006), AEO2006National Energy Modeling System, run AEO2006.D111905A, web site www.eia.doe.gov/oiaf/aeo/; and System for the Analysis ofGlobal Energy Markets (2006).

Table A10. World Carbon Dioxide Emissions by Region, Reference Case, 1990-2030(Million Metric Tons Carbon Dioxide)
Reference Case Projections
Energy Information Administration / International Energy Outlook 2006 93
Region/Country
History Projections Average AnnualPercent Change,
2003-20301990 2002 2003 2010 2015 2020 2025 2030
OECDOECD North America . . . . . . . . . . . 5,753 6,687 6,797 7,505 7,997 8,513 9,096 9,735 1.3
United Statesa. . . . . . . . . . . . . . . . . 4,978 5,748 5,796 6,365 6,718 7,119 7,587 8,115 1.3Canada . . . . . . . . . . . . . . . . . . . . . . 474 570 596 683 753 799 839 873 1.4Mexico. . . . . . . . . . . . . . . . . . . . . . . 300 369 405 457 526 595 670 747 2.3
OECD Europe . . . . . . . . . . . . . . . . . 4,089 4,203 4,264 4,474 4,632 4,741 4,909 5,123 0.7OECD Asia . . . . . . . . . . . . . . . . . . . . 1,536 2,063 2,090 2,269 2,390 2,455 2,540 2,638 0.9
Japan . . . . . . . . . . . . . . . . . . . . . . . 1,011 1,191 1,206 1,200 1,228 1,218 1,214 1,219 0.0South Korea . . . . . . . . . . . . . . . . . . 234 462 470 608 675 723 781 843 2.2Australia/New Zealand . . . . . . . . . . 291 410 415 462 487 515 545 576 1.2
Total OECD . . . . . . . . . . . . . . . . . 11,378 12,952 13,150 14,249 15,020 15,709 16,545 17,496 1.1
Non-OECDNon-OECD Europe and Eurasia. . . 4,193 2,634 2,725 3,113 3,444 3,758 4,047 4,352 1.7
Russia . . . . . . . . . . . . . . . . . . . . . . . 2,334 1,546 1,606 1,799 1,949 2,117 2,246 2,374 1.5Other . . . . . . . . . . . . . . . . . . . . . . . . 1,859 1,088 1,118 1,314 1,495 1,641 1,801 1,978 2.1
Non-OECD Asia. . . . . . . . . . . . . . . . 3,626 5,733 6,072 9,079 10,753 12,407 14,113 15,984 3.6China. . . . . . . . . . . . . . . . . . . . . . . . 2,241 3,273 3,541 5,857 7,000 8,159 9,349 10,716 4.2India . . . . . . . . . . . . . . . . . . . . . . . . 578 1,011 1,023 1,369 1,592 1,799 2,008 2,205 2.9Other Non-OECD Asia . . . . . . . . . . 807 1,449 1,508 1,853 2,161 2,449 2,756 3,062 2.7
Middle East . . . . . . . . . . . . . . . . . . . 704 1,152 1,182 1,463 1,647 1,811 1,987 2,177 2.3Africa . . . . . . . . . . . . . . . . . . . . . . . . 649 850 893 1,188 1,363 1,477 1,593 1,733 2.5Central and South America . . . . . . 673 993 1,006 1,270 1,436 1,586 1,758 1,933 2.4
Brazil . . . . . . . . . . . . . . . . . . . . . . . . 220 347 348 423 469 508 559 610 2.1Other Central and South America. . 453 645 659 847 967 1,078 1,199 1,323 2.6
Total Non-OECD . . . . . . . . . . . . . 9,846 11,362 11,878 16,113 18,643 21,039 23,500 26,180 3.0
Total World . . . . . . . . . . . . . . . . . . . . 21,223 24,314 25,028 30,362 33,663 36,748 40,045 43,676 2.1aIncludes the 50 States and the District of Columbia.Note: The U.S. numbers include carbon dioxide emissions attributable to renewable energy sources.Sources: History: Energy Information Administration (EIA), International Energy Annual 2003 (May-July 2005), web site www.eia.
doe.gov/iea/. Projections: EIA, Annual Energy Outlook 2006, DOE/EIA-0383(2006) (Washington, DC, February 2006), AEO2006National Energy Modeling System, run AEO2006.D111905A, web site www.eia.doe.gov/oiaf/aeo/; and System for the Analysis ofGlobal Energy Markets (2006).

Table A11. World Carbon Dioxide Emissions from Oil Use by Region, Reference Case, 1990-2030(Million Metric Tons Carbon Dioxide)
Appendix A
94 Energy Information Administration / International Energy Outlook 2006
Region/Country
History Projections Average AnnualPercent Change,
2003-20301990 2002 2003 2010 2015 2020 2025 2030
OECDOECD North America . . . . . . . . . . . 2,636 2,969 3,034 3,331 3,538 3,721 3,922 4,160 1.2
United Statesa. . . . . . . . . . . . . . . . . 2,181 2,456 2,498 2,740 2,900 3,061 3,221 3,421 1.2Canada . . . . . . . . . . . . . . . . . . . . . . 224 262 276 305 320 314 323 327 0.6Mexico. . . . . . . . . . . . . . . . . . . . . . . 231 250 260 286 318 346 378 412 1.7
OECD Europe . . . . . . . . . . . . . . . . . 1,864 2,069 2,094 2,137 2,147 2,129 2,162 2,196 0.2OECD Asia . . . . . . . . . . . . . . . . . . . . 913 1,035 1,052 1,086 1,127 1,147 1,179 1,208 0.5
Japan . . . . . . . . . . . . . . . . . . . . . . . 663 654 667 648 655 649 653 652 -0.1South Korea . . . . . . . . . . . . . . . . . . 140 244 246 292 324 345 367 392 1.7Australia/New Zealand . . . . . . . . . . 110 137 138 145 148 153 158 164 0.6
Total OECD . . . . . . . . . . . . . . . . . 5,412 6,073 6,180 6,554 6,811 6,996 7,263 7,563 0.8
Non-OECDNon-OECD Europe and Eurasia. . . 1,350 657 669 757 829 870 932 989 1.5
Russia . . . . . . . . . . . . . . . . . . . . . . . 782 351 356 379 407 415 437 452 0.9Other . . . . . . . . . . . . . . . . . . . . . . . . 568 306 312 377 422 455 495 538 2.0
Non-OECD Asia. . . . . . . . . . . . . . . . 949 1,775 1,853 2,536 2,879 3,261 3,650 4,074 3.0China. . . . . . . . . . . . . . . . . . . . . . . . 325 686 737 1,153 1,327 1,549 1,760 1,999 3.8India . . . . . . . . . . . . . . . . . . . . . . . . 160 298 305 387 437 481 535 586 2.4Other Non-OECD Asia . . . . . . . . . . 464 791 810 997 1,114 1,231 1,355 1,488 2.3
Middle East . . . . . . . . . . . . . . . . . . . 492 695 714 818 890 945 1,002 1,053 1.5Africa . . . . . . . . . . . . . . . . . . . . . . . . 298 372 379 518 567 603 637 692 2.3Central and South America . . . . . . 503 721 719 845 930 1,001 1,082 1,170 1.8
Brazil . . . . . . . . . . . . . . . . . . . . . . . . 180 280 276 315 346 370 406 433 1.7Other Central and South America. . 323 441 443 530 585 631 676 737 1.9
Total Non-OECD . . . . . . . . . . . . . 3,592 4,219 4,333 5,474 6,095 6,680 7,303 7,978 2.3
Total World . . . . . . . . . . . . . . . . . . . . 9,005 10,291 10,513 12,029 12,907 13,675 14,566 15,541 1.5aIncludes the 50 States and the District of Columbia.Sources: History: Energy Information Administration (EIA), International Energy Annual 2003 (May-July 2005), web site www.eia.
doe.gov/iea/. Projections: EIA, Annual Energy Outlook 2006, DOE/EIA-0383(2006) (Washington, DC, February 2006), AEO2006National Energy Modeling System, run AEO2006.D111905A, web site www.eia.doe.gov/oiaf/aeo/; and System for the Analysis ofGlobal Energy Markets (2006).

Table A12. World Carbon Dioxide Emissions from Natural Gas Use by Region, Reference Case, 1990-2030(Million Metric Tons Carbon Dioxide)
Reference Case Projections
Energy Information Administration / International Energy Outlook 2006 95
Region/Country
History Projections Average AnnualPercent Change,
2003-20301990 2002 2003 2010 2015 2020 2025 2030
OECDOECD North America . . . . . . . . . . . 1,207 1,479 1,474 1,608 1,779 1,885 1,944 1,995 1.1
United Statesa. . . . . . . . . . . . . . . . . 1,026 1,228 1,196 1,262 1,400 1,455 1,459 1,452 0.7Canada . . . . . . . . . . . . . . . . . . . . . . 127 165 173 224 227 252 270 286 1.9Mexico. . . . . . . . . . . . . . . . . . . . . . . 54 86 105 122 151 178 216 257 3.4
OECD Europe . . . . . . . . . . . . . . . . . 590 934 967 1,145 1,296 1,402 1,533 1,670 2.0OECD Asia . . . . . . . . . . . . . . . . . . . . 152 270 277 300 333 354 365 381 1.2
Japan . . . . . . . . . . . . . . . . . . . . . . . 102 163 169 179 192 198 202 211 0.8South Korea . . . . . . . . . . . . . . . . . . 6 48 50 60 68 75 78 79 1.7Australia/New Zealand . . . . . . . . . . 44 59 58 62 73 81 86 92 1.7
Total OECD . . . . . . . . . . . . . . . . . 1,949 2,683 2,718 3,053 3,407 3,641 3,843 4,046 1.5
Non-OECDNon-OECD Europe and Eurasia. . . 1,450 1,213 1,281 1,551 1,710 1,888 2,036 2,201 2.0
Russia . . . . . . . . . . . . . . . . . . . . . . . 928 789 828 978 1,044 1,147 1,212 1,280 1.6Other . . . . . . . . . . . . . . . . . . . . . . . . 521 424 452 573 666 742 824 921 2.7
Non-OECD Asia. . . . . . . . . . . . . . . . 160 384 415 657 875 1,097 1,344 1,613 5.2China. . . . . . . . . . . . . . . . . . . . . . . . 30 69 72 183 241 313 378 431 6.8India . . . . . . . . . . . . . . . . . . . . . . . . 24 48 52 82 95 120 170 247 5.9Other Non-OECD Asia . . . . . . . . . . 106 267 290 393 540 663 796 935 4.4
Middle East . . . . . . . . . . . . . . . . . . . 199 422 435 611 721 830 948 1,082 3.4Africa . . . . . . . . . . . . . . . . . . . . . . . . 80 139 145 185 260 320 388 459 4.4Central and South America . . . . . . 116 203 217 330 400 459 540 614 3.9
Brazil . . . . . . . . . . . . . . . . . . . . . . . . 6 26 27 53 59 66 75 92 4.6Other Central and South America. . 110 177 190 277 341 394 465 521 3.8
Total Non-OECD . . . . . . . . . . . . . 2,005 2,361 2,493 3,334 3,967 4,595 5,257 5,969 3.3
Total World . . . . . . . . . . . . . . . . . . . . 3,954 5,044 5,211 6,387 7,374 8,236 9,099 10,015 2.4aIncludes the 50 States and the District of Columbia.Sources: History: Energy Information Administration (EIA), International Energy Annual 2003 (May-July 2005), web site www.eia.
doe.gov/iea/. Projections: EIA, Annual Energy Outlook 2006, DOE/EIA-0383(2006) (Washington, DC, February 2006), AEO2006National Energy Modeling System, run AEO2006.D111905A, web site www.eia.doe.gov/oiaf/aeo/; and System for the Analysis ofGlobal Energy Markets (2006).

Table A13. World Carbon Dioxide Emissions from Coal Use by Region, Reference Case, 1990-2030(Million Metric Tons Carbon Dioxide)
Appendix A
96 Energy Information Administration / International Energy Outlook 2006
Region/Country
History Projections Average AnnualPercent Change,
2003-20301990 2002 2003 2010 2015 2020 2025 2030
OECDOECD North America . . . . . . . . . . . 1,910 2,239 2,287 2,553 2,667 2,893 3,215 3,565 1.7
United Statesa. . . . . . . . . . . . . . . . . 1,772 2,064 2,100 2,350 2,404 2,589 2,892 3,226 1.6Canada . . . . . . . . . . . . . . . . . . . . . . 123 143 147 154 206 233 247 260 2.1Mexico. . . . . . . . . . . . . . . . . . . . . . . 15 32 40 49 57 71 76 78 2.5
OECD Europe . . . . . . . . . . . . . . . . . 1,635 1,199 1,203 1,192 1,190 1,211 1,214 1,258 0.2OECD Asia . . . . . . . . . . . . . . . . . . . . 471 758 761 883 931 954 995 1,049 1.2
Japan . . . . . . . . . . . . . . . . . . . . . . . 245 375 369 373 380 371 359 356 -0.1South Korea . . . . . . . . . . . . . . . . . . 88 170 173 256 283 303 336 373 2.9Australia/New Zealand . . . . . . . . . . 137 213 218 254 267 281 301 320 1.4
Total OECD . . . . . . . . . . . . . . . . . 4,016 4,196 4,251 4,628 4,787 5,058 5,424 5,871 1.2
Non-OECDNon-OECD Europe and Eurasia. . . 1,393 764 775 806 905 999 1,079 1,161 1.5
Russia . . . . . . . . . . . . . . . . . . . . . . . 624 406 422 442 498 556 597 642 1.6Other . . . . . . . . . . . . . . . . . . . . . . . . 770 359 353 364 407 444 482 519 1.4
Non-OECD Asia. . . . . . . . . . . . . . . . 2,517 3,574 3,805 5,886 7,000 8,049 9,119 10,297 3.8China. . . . . . . . . . . . . . . . . . . . . . . . 1,886 2,518 2,731 4,521 5,432 6,297 7,212 8,286 4.2India . . . . . . . . . . . . . . . . . . . . . . . . 394 665 666 901 1,060 1,198 1,302 1,372 2.7Other Non-OECD Asia . . . . . . . . . . 237 391 408 464 508 554 605 639 1.7
Middle East . . . . . . . . . . . . . . . . . . . 14 35 33 34 35 36 37 42 0.8Africa . . . . . . . . . . . . . . . . . . . . . . . . 271 339 369 485 535 555 568 583 1.7Central and South America . . . . . . 54 69 70 95 106 126 136 150 2.9
Brazil . . . . . . . . . . . . . . . . . . . . . . . . 34 41 44 55 64 73 79 85 2.4Other Central and South America. . 20 28 25 39 42 53 57 65 3.5
Total Non-OECD . . . . . . . . . . . . . 4,248 4,782 5,052 7,305 8,581 9,764 10,940 12,233 3.3
Total World . . . . . . . . . . . . . . . . . . . . 8,264 8,978 9,303 11,933 13,368 14,822 16,364 18,104 2.5aIncludes the 50 States and the District of Columbia.Sources: History: Energy Information Administration (EIA), International Energy Annual 2003 (May-July 2005), web site www.eia.
doe.gov/iea/. Projections: EIA, Annual Energy Outlook 2006, DOE/EIA-0383(2006) (Washington, DC, February 2006), AEO2006National Energy Modeling System, run AEO2006.D111905A, web site www.eia.doe.gov/oiaf/aeo/; and System for the Analysis ofGlobal Energy Markets (2006).

Table A14. World Population by Region, Reference Case, 1990-2030(Millions)
Reference Case Projections
Energy Information Administration / International Energy Outlook 2006 97
Region/Country
History Projections Average AnnualPercent Change,
2003-20301990 2002 2003 2010 2015 2020 2025 2030
OECDOECD North America . . . . . . . . . . . 366 424 427 457 478 498 518 537 0.9
United Statesa. . . . . . . . . . . . . . . . . 254 289 291 310 324 337 351 365 0.8Canada . . . . . . . . . . . . . . . . . . . . . . 28 32 32 34 35 36 38 39 0.8Mexico. . . . . . . . . . . . . . . . . . . . . . . 84 104 104 113 119 125 129 133 0.9
OECD Europe . . . . . . . . . . . . . . . . . 497 529 530 543 550 555 559 562 0.2OECD Asia . . . . . . . . . . . . . . . . . . . . 187 198 199 202 204 204 203 202 0.1
Japan . . . . . . . . . . . . . . . . . . . . . . . 124 128 128 128 128 127 125 123 -0.2South Korea . . . . . . . . . . . . . . . . . . 43 47 47 49 49 49 49 49 0.1Australia/New Zealand . . . . . . . . . . 20 24 24 25 27 28 29 30 0.9
Total OECD . . . . . . . . . . . . . . . . . 1,050 1,151 1,156 1,203 1,232 1,257 1,280 1,300 0.4
Non-OECDNon-OECD Europe and Eurasia. . . 348 343 343 338 334 330 325 319 -0.3
Russia . . . . . . . . . . . . . . . . . . . . . . . 148 145 145 140 137 133 129 125 -0.5Other . . . . . . . . . . . . . . . . . . . . . . . . 200 198 198 198 198 197 196 193 -0.1
Non-OECD Asia. . . . . . . . . . . . . . . . 2,748 3,300 3,316 3,592 3,783 3,958 4,108 4,231 0.9China. . . . . . . . . . . . . . . . . . . . . . . . 1,155 1,296 1,299 1,355 1,393 1,424 1,441 1,446 0.4India . . . . . . . . . . . . . . . . . . . . . . . . 849 1,064 1,070 1,183 1,260 1,332 1,395 1,449 1.1Other Non-OECD Asia . . . . . . . . . . 743 940 946 1,054 1,129 1,202 1,271 1,335 1.3
Middle East . . . . . . . . . . . . . . . . . . . 137 185 187 216 238 260 281 301 1.8Africa . . . . . . . . . . . . . . . . . . . . . . . . 636 861 869 1,007 1,115 1,228 1,344 1,463 2.0Central and South America . . . . . . 360 439 442 486 515 542 567 589 1.1
Brazil . . . . . . . . . . . . . . . . . . . . . . . . 149 180 181 198 209 219 228 236 1.0Other Central and South America. . 210 259 260 287 306 323 339 354 1.1
Total Non-OECD . . . . . . . . . . . . . 4,228 5,129 5,156 5,638 5,986 6,319 6,626 6,903 1.1
Total World . . . . . . . . . . . . . . . . . . . . 5,278 6,280 6,312 6,841 7,217 7,576 7,906 8,203 1.0aIncludes the 50 States and the District of Columbia.Sources: United States: Annual Energy Outlook 2006, DOE/EIA-0383(2006) (Washington, DC, February 2006), AEO2006
National Energy Modeling System, run AEO2006.D111905A, web site www.eia.doe.gov/oiaf/aeo/. Other Countries: UnitedNations, Population Division of the Department of Economic and Social Affairs of the United Nations Secretariat, World PopulationProspects: The 2004 Revision and World Urbanization Prospects (February 25, 2005), web site http://esa.un.org/unpp.


Appendix B
High Economic Growth Case Projections:• World Energy Consumption
• Gross Domestic Product• Carbon Dioxide Emissions


Table B1. World Total Energy Consumption by Region, High Economic Growth Case, 1990-2030(Quadrillion Btu)
High Economic Growth Case Projections
Energy Information Administration / International Energy Outlook 2006 101
Region/Country
History Projections Average AnnualPercent Change,
2003-20301990 2002 2003 2010 2015 2020 2025 2030
OECDOECD North America . . . . . . . . . . . 100.8 117.5 118.3 134.1 145.3 156.5 168.7 181.5 1.6
United Statesa. . . . . . . . . . . . . . . . . 84.6 98.1 98.1 110.2 118.7 127.2 136.6 146.4 1.5Canada . . . . . . . . . . . . . . . . . . . . . . 11.1 13.1 13.5 15.8 17.1 18.2 19.4 20.6 1.6Mexico. . . . . . . . . . . . . . . . . . . . . . . 5.0 6.2 6.8 8.1 9.5 11.0 12.7 14.5 2.8
OECD Europe . . . . . . . . . . . . . . . . . 69.9 77.9 78.9 85.5 89.4 92.2 96.1 101.2 0.9OECD Asia . . . . . . . . . . . . . . . . . . . . 26.7 36.5 37.1 40.9 44.2 46.6 49.2 52.0 1.3
Japan . . . . . . . . . . . . . . . . . . . . . . . 18.4 22.2 22.4 23.1 24.1 24.7 25.5 26.2 0.6South Korea . . . . . . . . . . . . . . . . . . 3.8 8.4 8.6 11.1 12.8 14.1 15.4 16.9 2.5Australia/New Zealand . . . . . . . . . . 4.4 6.0 6.0 6.7 7.2 7.7 8.3 8.8 1.4
Total OECD . . . . . . . . . . . . . . . . . 197.4 231.9 234.3 260.5 278.9 295.3 314.0 334.6 1.3
Non-OECDNon-OECD Europe and Eurasia. . . 67.2 46.9 48.5 58.5 67.4 76.5 85.4 94.5 2.5
Russia . . . . . . . . . . . . . . . . . . . . . . . 39.0 28.1 29.1 34.6 39.4 44.4 49.4 54.6 2.4Other . . . . . . . . . . . . . . . . . . . . . . . . 28.3 18.8 19.4 23.9 28.0 32.1 36.0 40.0 2.7
Non-OECD Asia. . . . . . . . . . . . . . . . 47.5 78.4 83.1 131.8 160.7 194.0 231.3 275.2 4.5China. . . . . . . . . . . . . . . . . . . . . . . . 27.0 42.1 45.5 79.9 99.0 119.8 142.5 169.8 5.0India . . . . . . . . . . . . . . . . . . . . . . . . 8.0 13.8 14.0 20.0 24.0 28.4 33.1 38.7 3.8Other Non-OECD Asia . . . . . . . . . . 12.5 22.5 23.6 31.8 37.7 45.7 55.7 66.7 3.9
Middle East . . . . . . . . . . . . . . . . . . . 11.3 19.1 19.6 25.9 30.4 34.5 39.4 44.6 3.1Africa . . . . . . . . . . . . . . . . . . . . . . . . 9.5 12.8 13.3 18.3 22.1 25.0 28.3 32.6 3.4Central and South America . . . . . . 14.5 21.3 21.9 29.2 34.8 40.7 47.2 53.9 3.4
Brazil . . . . . . . . . . . . . . . . . . . . . . . . 5.8 8.6 8.8 11.1 13.0 14.7 16.8 18.9 2.9Other Central and South America. . 8.8 12.7 13.1 18.1 21.8 26.0 30.4 35.0 3.7
Total Non-OECD . . . . . . . . . . . . . 150.0 178.4 186.4 263.7 315.3 370.7 431.6 500.8 3.7
Total World . . . . . . . . . . . . . . . . . . . . 347.3 410.3 420.7 524.2 594.2 666.0 745.6 835.4 2.6aIncludes the 50 States and the District of Columbia.Notes: Energy totals include net imports of coal coke and electricity generated from biomass in the United States. Totals may not
equal sum of components due to independent rounding. The electricity portion of the national fuel consumption values consists ofgeneration for domestic use plus an adjustment for electricity trade based on a fuel’s share of total generation in the exporting coun-try.
Sources: History: Energy Information Administration (EIA), International Energy Annual 2003 (May-July 2005), web site www.eia.doe.gov/iea/. Projections: EIA, Annual Energy Outlook 2006, DOE/EIA-0383(2006) (Washington, DC, February 2006), AEO2006National Energy Modeling System, run HM2006.D112505B, web site www.eia.doe.gov/oiaf/aeo/; and System for the Analysis ofGlobal Energy Markets (2006).

Table B2. World Total Energy Consumption by Region and Fuel, High Economic Growth Case, 1990-2030(Quadrillion Btu)
Appendix B
102 Energy Information Administration / International Energy Outlook 2006
Region/Country
History Projections Average AnnualPercent Change,
2003-20301990 2002 2003 2010 2015 2020 2025 2030
OECDOECD North America
Oil . . . . . . . . . . . . . . . . . . . . . . . . . 40.5 46.3 47.2 53.6 58.1 62.2 66.8 71.7 1.6Natural Gas . . . . . . . . . . . . . . . . . 23.2 28.4 28.3 31.3 35.0 37.3 38.8 40.5 1.3Coal . . . . . . . . . . . . . . . . . . . . . . . 20.7 24.0 24.4 27.8 29.7 32.9 37.8 42.7 2.1Nuclear. . . . . . . . . . . . . . . . . . . . . 6.9 9.0 8.9 9.7 10.2 10.5 10.4 10.4 0.6Other . . . . . . . . . . . . . . . . . . . . . . 9.5 9.8 9.5 11.6 12.3 13.6 15.0 16.1 2.0
Total. . . . . . . . . . . . . . . . . . . . . . 100.8 117.5 118.3 134.1 145.3 156.5 168.7 181.5 1.6OECD Europe
Oil . . . . . . . . . . . . . . . . . . . . . . . . . 28.4 31.6 32.0 33.0 33.6 33.7 34.6 35.5 0.4Natural Gas . . . . . . . . . . . . . . . . . 11.2 17.7 18.3 22.3 25.8 28.5 31.2 34.6 2.4Coal . . . . . . . . . . . . . . . . . . . . . . . 17.6 12.8 12.8 12.8 12.8 13.1 13.9 14.2 0.4Nuclear. . . . . . . . . . . . . . . . . . . . . 7.9 9.7 9.8 9.5 9.3 8.5 7.9 7.5 -1.0Other . . . . . . . . . . . . . . . . . . . . . . 4.8 6.1 6.0 7.9 8.0 8.3 8.5 9.4 1.7
Total. . . . . . . . . . . . . . . . . . . . . . 69.9 77.9 78.9 85.5 89.4 92.2 96.1 101.2 0.9OECD Asia
Oil . . . . . . . . . . . . . . . . . . . . . . . . . 14.5 17.5 17.8 18.7 19.5 20.1 20.9 21.6 0.7Natural Gas . . . . . . . . . . . . . . . . . 2.9 5.1 5.3 5.9 6.8 7.3 7.8 8.5 1.8Coal . . . . . . . . . . . . . . . . . . . . . . . 5.2 8.2 8.4 9.9 10.7 11.4 12.1 13.0 1.6Nuclear. . . . . . . . . . . . . . . . . . . . . 2.5 4.0 3.7 4.2 4.7 5.3 5.8 6.2 2.0Other . . . . . . . . . . . . . . . . . . . . . . 1.6 1.7 1.9 2.2 2.4 2.5 2.6 2.7 1.3
Total. . . . . . . . . . . . . . . . . . . . . . 26.7 36.5 37.1 40.9 44.2 46.6 49.2 52.0 1.3Total OECD
Oil . . . . . . . . . . . . . . . . . . . . . . . . . 83.4 95.4 97.0 105.4 111.2 116.1 122.2 128.8 1.1Natural Gas . . . . . . . . . . . . . . . . . 37.2 51.2 51.9 59.5 67.6 73.1 77.8 83.7 1.8Coal . . . . . . . . . . . . . . . . . . . . . . . 43.5 44.9 45.6 50.5 53.2 57.4 63.8 69.9 1.6Nuclear. . . . . . . . . . . . . . . . . . . . . 17.3 22.7 22.3 23.4 24.1 24.3 24.1 24.1 0.3Other . . . . . . . . . . . . . . . . . . . . . . 15.9 17.6 17.4 21.8 22.7 24.4 26.0 28.2 1.8
Total. . . . . . . . . . . . . . . . . . . . . . 197.4 231.9 234.3 260.5 278.9 295.3 314.0 334.6 1.3
Non-OECDNon-OECD Europe and Eurasia
Oil . . . . . . . . . . . . . . . . . . . . . . . . . 19.5 9.9 10.1 11.8 13.4 14.8 19.2 18.0 2.2Natural Gas . . . . . . . . . . . . . . . . . 27.5 23.0 24.3 30.5 35.1 39.4 41.2 49.4 2.7Coal . . . . . . . . . . . . . . . . . . . . . . . 15.1 8.3 8.4 8.9 10.4 12.4 14.0 15.4 2.3Nuclear. . . . . . . . . . . . . . . . . . . . . 2.5 2.8 2.8 3.1 3.5 4.3 4.8 4.9 2.0Other . . . . . . . . . . . . . . . . . . . . . . 2.8 3.0 3.0 4.2 5.1 5.6 6.2 6.8 3.1
Total. . . . . . . . . . . . . . . . . . . . . . 67.2 46.9 48.5 58.5 67.4 76.5 85.4 94.5 2.5Non-OECD Asia
Oil . . . . . . . . . . . . . . . . . . . . . . . . . 13.9 26.7 27.9 39.8 47.0 55.5 64.6 76.4 3.8Natural Gas . . . . . . . . . . . . . . . . . 3.0 7.3 7.9 14.4 18.4 23.9 30.9 37.7 6.0Coal . . . . . . . . . . . . . . . . . . . . . . . 27.2 38.7 41.2 66.0 81.5 98.2 115.7 136.3 4.5Nuclear. . . . . . . . . . . . . . . . . . . . . 0.4 0.9 1.0 2.0 2.9 3.8 4.6 5.3 6.3Other . . . . . . . . . . . . . . . . . . . . . . 3.0 4.9 5.1 9.6 11.0 12.6 15.5 19.4 5.1
Total. . . . . . . . . . . . . . . . . . . . . . 47.5 78.4 83.1 131.8 160.7 194.0 231.3 275.2 4.5
See notes at end of table.

Table B2. World Total Energy Consumption by Region and Fuel, High Economic Growth Case, 1990-2030(Continued)(Quadrillion Btu)
High Economic Growth Case Projections
Energy Information Administration / International Energy Outlook 2006 103
Region/Country
History Projections Average AnnualPercent Change,
2002-20251990 2002 2003 2010 2015 2020 2025 2030
Non-OECD (Continued)Middle East
Oil . . . . . . . . . . . . . . . . . . . . . . . . . 7.2 10.5 10.8 12.9 14.7 16.1 17.7 19.6 2.2Natural Gas . . . . . . . . . . . . . . . . . 3.8 8.0 8.2 12.0 14.6 17.2 20.3 23.3 3.9Coal . . . . . . . . . . . . . . . . . . . . . . . 0.1 0.4 0.4 0.4 0.4 0.4 0.4 0.5 1.0Nuclear. . . . . . . . . . . . . . . . . . . . . 0.0 0.0 0.0 0.1 0.1 0.1 0.1 0.1 —Other . . . . . . . . . . . . . . . . . . . . . . 0.1 0.2 0.2 0.6 0.7 0.8 1.0 1.2 6.1
Total. . . . . . . . . . . . . . . . . . . . . . 11.3 19.1 19.6 25.9 30.4 34.5 39.4 44.6 3.1Africa
Oil . . . . . . . . . . . . . . . . . . . . . . . . . 4.3 5.4 5.5 7.9 9.0 9.9 10.9 12.3 3.0Natural Gas . . . . . . . . . . . . . . . . . 1.5 2.6 2.7 3.7 5.5 6.7 8.3 10.3 5.0Coal . . . . . . . . . . . . . . . . . . . . . . . 3.0 3.7 4.1 5.4 6.2 6.8 7.3 7.8 2.4Nuclear. . . . . . . . . . . . . . . . . . . . . 0.1 0.1 0.1 0.1 0.2 0.2 0.2 0.2 0.7Other . . . . . . . . . . . . . . . . . . . . . . 0.6 0.9 0.9 1.2 1.3 1.4 1.7 2.0 3.1
Total. . . . . . . . . . . . . . . . . . . . . . 9.5 12.8 13.3 18.3 22.1 25.0 28.3 32.6 3.4Central and South America
Oil . . . . . . . . . . . . . . . . . . . . . . . . . 7.7 10.8 10.8 13.2 15.3 17.5 20.3 22.3 2.7Natural Gas . . . . . . . . . . . . . . . . . 2.2 3.8 4.1 6.6 7.9 9.7 11.3 14.0 4.6Coal . . . . . . . . . . . . . . . . . . . . . . . 0.6 0.7 0.8 1.0 1.2 1.4 1.5 1.6 2.9Nuclear. . . . . . . . . . . . . . . . . . . . . 0.1 0.2 0.2 0.2 0.4 0.3 0.4 0.3 0.5Other . . . . . . . . . . . . . . . . . . . . . . 3.9 5.7 6.0 8.1 10.0 11.8 13.7 15.7 3.6
Total. . . . . . . . . . . . . . . . . . . . . . 14.5 21.3 21.9 29.2 34.8 40.7 47.2 53.9 3.4Total Non-OECD
Oil . . . . . . . . . . . . . . . . . . . . . . . . . 52.7 63.3 65.1 85.6 99.3 113.8 132.7 148.7 3.1Natural Gas . . . . . . . . . . . . . . . . . 38.0 44.7 47.2 67.1 81.5 97.0 111.9 134.8 4.0Coal . . . . . . . . . . . . . . . . . . . . . . . 45.9 51.8 54.8 81.7 99.6 119.1 138.9 161.6 4.1Nuclear. . . . . . . . . . . . . . . . . . . . . 3.1 4.0 4.2 5.5 7.0 8.7 10.0 10.6 3.5Other . . . . . . . . . . . . . . . . . . . . . . 10.3 14.6 15.2 23.8 28.0 32.2 38.0 45.0 4.1
Total. . . . . . . . . . . . . . . . . . . . . . 150.0 178.4 186.4 263.7 315.3 370.7 431.6 500.8 3.7
Total WorldOil . . . . . . . . . . . . . . . . . . . . . . . . . 136.1 158.7 162.1 191.0 210.5 229.8 254.9 277.5 2.0Natural Gas . . . . . . . . . . . . . . . . . 75.2 95.9 99.1 126.6 149.1 170.1 189.8 218.5 3.0Coal . . . . . . . . . . . . . . . . . . . . . . . 89.4 96.8 100.4 132.2 152.9 176.5 202.8 231.5 3.1Nuclear. . . . . . . . . . . . . . . . . . . . . 20.4 26.7 26.5 28.9 31.1 32.9 34.0 34.7 1.0Other . . . . . . . . . . . . . . . . . . . . . . 26.3 32.2 32.7 45.6 50.6 56.6 64.1 73.2 3.0
Total. . . . . . . . . . . . . . . . . . . . . . 347.3 410.3 420.7 524.2 594.2 666.0 745.6 835.4 2.6
Notes: Energy totals include net imports of coal coke and electricity generated from biomass in the United States. Totals may notequal sum of components due to independent rounding. The electricity portion of the national fuel consumption values consists ofgeneration for domestic use plus an adjustment for electricity trade based on a fuel’s share of total generation in the exporting coun-try.
Sources: History: Energy Information Administration (EIA), International Energy Annual 2003 (May-July 2005), web site www.eia.doe.gov/iea/. Projections: EIA, Annual Energy Outlook 2006, DOE/EIA-0383(2006) (Washington, DC, February 2006), AEO2006National Energy Modeling System, run HM2006.D112505B, web site www.eia.doe.gov/oiaf/aeo/; and System for the Analysis ofGlobal Energy Markets (2006).

Table B3. World Gross Domestic Product (GDP) by Region Using Purchasing Power Parity,High Economic Growth Case, 1990-2030(Billion 2000 Dollars)
Appendix B
104 Energy Information Administration / International Energy Outlook 2006
Region/Country
History Projections Average AnnualPercent Change,
2003-20301990 2002 2003 2010 2015 2020 2025 2030
OECDOECD North America . . . . . . . . . . . 8,477 11,968 12,273 16,082 19,159 22,728 26,964 31,684 3.6
United Statesa. . . . . . . . . . . . . . . . . 7,113 10,049 10,321 13,561 16,110 19,073 22,603 26,471 3.6Canada . . . . . . . . . . . . . . . . . . . . . . 684 957 977 1,219 1,410 1,597 1,779 1,980 2.7Mexico. . . . . . . . . . . . . . . . . . . . . . . 680 962 976 1,301 1,638 2,058 2,582 3,233 4.5
OECD Europe . . . . . . . . . . . . . . . . . 8,017 10,647 10,799 13,027 14,903 16,999 19,303 21,911 2.7OECD Asia . . . . . . . . . . . . . . . . . . . . 3,655 4,628 4,716 5,754 6,578 7,328 8,097 8,955 2.4
Japan . . . . . . . . . . . . . . . . . . . . . . . 2,898 3,329 3,375 3,954 4,403 4,777 5,134 5,517 1.8South Korea . . . . . . . . . . . . . . . . . . 330 663 683 989 1,238 1,469 1,718 2,003 4.1Australia/New Zealand . . . . . . . . . . 428 637 657 811 937 1,081 1,246 1,435 2.9Total OECD . . . . . . . . . . . . . . . . . 20,150 27,243 27,788 34,862 40,640 47,055 54,364 62,550 3.1
Non-OECDNon-OECD Europe and Eurasia. . . 3,387 2,672 2,878 4,587 6,041 7,801 9,910 12,473 5.6
Russia . . . . . . . . . . . . . . . . . . . . . . . 2,241 1,658 1,780 2,718 3,529 4,532 5,734 7,167 5.3Other . . . . . . . . . . . . . . . . . . . . . . . . 1,146 1,013 1,099 1,869 2,511 3,269 4,176 5,306 6.0
Non-OECD Asia. . . . . . . . . . . . . . . . 5,780 12,559 13,516 22,148 30,328 40,800 54,236 71,821 6.4China. . . . . . . . . . . . . . . . . . . . . . . . 1,807 5,494 5,994 10,597 14,863 20,274 27,263 36,484 6.9India . . . . . . . . . . . . . . . . . . . . . . . . 1,684 3,160 3,429 5,410 7,356 9,960 13,359 17,863 6.3Other Non-OECD Asia . . . . . . . . . . 2,289 3,905 4,093 6,140 8,108 10,566 13,614 17,474 5.5
Middle East . . . . . . . . . . . . . . . . . . . 810 1,295 1,357 2,040 2,614 3,304 4,145 5,190 5.1Africa . . . . . . . . . . . . . . . . . . . . . . . . 1,461 2,074 2,173 3,222 4,195 5,402 6,917 8,846 5.3Central and South America . . . . . . 2,174 3,011 3,075 4,339 5,454 6,818 8,500 10,588 4.7
Brazil . . . . . . . . . . . . . . . . . . . . . . . . 1,022 1,370 1,378 1,884 2,342 2,899 3,577 4,403 4.4Other Central and South America. . 1,153 1,641 1,697 2,454 3,113 3,919 4,923 6,185 4.9Total Non-OECD . . . . . . . . . . . . . 13,612 21,611 22,999 36,335 48,631 64,125 83,708 108,918 5.9
Total World . . . . . . . . . . . . . . . . . . . . 33,761 48,854 50,786 71,198 89,271 111,180 138,072 171,468 4.6aIncludes the 50 States and the District of Columbia.Notes: Totals may not equal sum of components due to independent rounding. GDP growth rates for China and India were
adjusted, based on the analyst’s judgment.Sources: History: Global Insight, Inc., World Overview (Lexington, MA, various issues). Projections: Global Insight, Inc., World
Overview, Fourth Quarter 2005 (Lexington, MA, January 2006); and Energy Information Administration, Annual Energy Outlook2006, DOE/EIA-0383(2006) (Washington DC, February 2006), Table B4.

Table B4. World Oil Consumption by Region, High Economic Growth Case, 1990-2030(Million Barrels per Day)
High Economic Growth Case Projections
Energy Information Administration / International Energy Outlook 2006 105
Region/Country
History Projections Average AnnualPercent Change,
2003-20301990 2002 2003 2010 2015 2020 2025 2030
OECDOECD North America . . . . . . . . . . . 20.5 23.8 24.3 27.5 29.9 32.0 34.3 36.8 1.6
United Statesa. . . . . . . . . . . . . . . . . 17.0 19.8 20.1 22.8 24.7 26.5 28.4 30.5 1.6Canada . . . . . . . . . . . . . . . . . . . . . . 1.7 2.1 2.2 2.4 2.5 2.6 2.7 2.8 0.9Mexico. . . . . . . . . . . . . . . . . . . . . . . 1.8 1.9 2.0 2.3 2.6 2.9 3.2 3.5 2.1
OECD Europe . . . . . . . . . . . . . . . . . 13.7 15.3 15.5 16.0 16.3 16.4 16.8 17.2 0.4OECD Asia . . . . . . . . . . . . . . . . . . . . 7.1 8.6 8.8 9.2 9.6 9.9 10.2 10.6 0.7
Japan . . . . . . . . . . . . . . . . . . . . . . . 5.2 5.5 5.6 5.5 5.5 5.5 5.5 5.5 -0.1South Korea . . . . . . . . . . . . . . . . . . 1.0 2.1 2.2 2.6 3.0 3.2 3.5 3.8 2.1Australia/New Zealand . . . . . . . . . . 0.8 1.0 1.0 1.1 1.1 1.2 1.2 1.3 0.8
Total OECD . . . . . . . . . . . . . . . . . 41.3 47.7 48.5 52.7 55.7 58.2 61.3 64.6 1.1
Non-OECDNon-OECD Europe and Eurasia. . . 9.3 4.8 4.9 5.7 6.4 7.2 9.3 8.7 2.2
Russia . . . . . . . . . . . . . . . . . . . . . . . 5.4 2.6 2.7 3.0 3.3 3.7 5.4 4.3 1.8Other . . . . . . . . . . . . . . . . . . . . . . . . 3.9 2.1 2.2 2.7 3.1 3.5 3.9 4.4 2.6
Non-OECD Asia. . . . . . . . . . . . . . . . 6.6 12.9 13.5 19.2 22.7 26.8 31.2 37.0 3.8China. . . . . . . . . . . . . . . . . . . . . . . . 2.3 5.2 5.6 9.0 10.7 13.1 15.5 18.3 4.5India . . . . . . . . . . . . . . . . . . . . . . . . 1.2 2.3 2.3 3.0 3.6 4.1 4.7 5.3 3.1Other Non-OECD Asia . . . . . . . . . . 3.1 5.5 5.6 7.2 8.4 9.7 11.1 13.4 3.3
Middle East . . . . . . . . . . . . . . . . . . . 3.5 5.1 5.3 6.3 7.2 7.9 8.6 9.6 2.2Africa . . . . . . . . . . . . . . . . . . . . . . . . 2.1 2.7 2.7 3.9 4.4 4.8 5.3 6.0 3.0Central and South America . . . . . . 3.8 5.3 5.3 6.5 7.5 8.5 9.9 10.9 2.7
Brazil . . . . . . . . . . . . . . . . . . . . . . . . 1.5 2.1 2.1 2.5 2.8 3.1 3.5 3.8 2.3Other Central and South America. . 2.3 3.1 3.2 4.0 4.7 5.4 6.4 7.0 3.0
Total Non-OECD . . . . . . . . . . . . . 25.3 30.7 31.6 41.5 48.2 55.2 64.4 72.2 3.1
Total World . . . . . . . . . . . . . . . . . . . . 66.6 78.5 80.1 94.3 103.9 113.4 125.7 136.8 2.0aIncludes the 50 States and the District of Columbia.Note: Totals may not equal sum of components due to independent rounding.Sources: History: Energy Information Administration (EIA), International Energy Annual 2003 (May-July 2005), web site www.eia.
doe.gov/iea/. Projections: EIA, Annual Energy Outlook 2006, DOE/EIA-0383(2006) (Washington, DC, February 2006), AEO2006National Energy Modeling System, run HM2006.D112505B, web site www.eia.doe.gov/oiaf/aeo/; and System for the Analysis ofGlobal Energy Markets (2006).

Table B5. World Natural Gas Consumption by Region, High Economic Growth Case, 1990-2030(Trillion Cubic Feet)
Appendix B
106 Energy Information Administration / International Energy Outlook 2006
Region/Country
History Projections Average AnnualPercent Change,
2003-20301990 2002 2003 2010 2015 2020 2025 2030
OECDOECD North America . . . . . . . . . . . 22.5 27.6 27.4 30.3 33.9 36.1 37.4 39.1 1.3
United Statesa. . . . . . . . . . . . . . . . . 19.2 23.0 22.3 24.0 26.8 27.9 28.0 28.4 0.9Canada . . . . . . . . . . . . . . . . . . . . . . 2.4 3.1 3.2 4.2 4.4 4.9 5.3 5.7 2.2Mexico. . . . . . . . . . . . . . . . . . . . . . . 0.9 1.5 1.8 2.2 2.7 3.3 4.1 5.0 3.8
OECD Europe . . . . . . . . . . . . . . . . . 11.6 17.2 17.8 21.7 25.1 27.7 30.4 33.6 2.4OECD Asia . . . . . . . . . . . . . . . . . . . . 2.8 4.8 5.0 5.5 6.4 6.9 7.4 8.0 1.8
Japan . . . . . . . . . . . . . . . . . . . . . . . 1.9 2.9 3.1 3.4 3.9 4.1 4.4 4.8 1.7South Korea . . . . . . . . . . . . . . . . . . 0.1 0.8 0.9 1.0 1.2 1.3 1.3 1.4 1.9Australia/New Zealand . . . . . . . . . . 0.8 1.1 1.1 1.2 1.4 1.5 1.7 1.8 1.9
Total OECD . . . . . . . . . . . . . . . . . 36.8 49.6 50.2 57.5 65.4 70.7 75.2 80.8 1.8
Non-OECDNon-OECD Europe and Eurasia. . . 26.7 22.3 23.6 29.7 34.1 38.3 40.0 48.1 2.7
Russia . . . . . . . . . . . . . . . . . . . . . . . 17.3 14.6 15.3 18.8 21.3 23.9 23.7 29.5 2.5Other . . . . . . . . . . . . . . . . . . . . . . . . 9.5 7.8 8.3 10.9 12.9 14.4 16.3 18.6 3.0
Non-OECD Asia. . . . . . . . . . . . . . . . 2.9 6.9 7.5 13.6 17.4 22.6 29.2 35.7 5.9China. . . . . . . . . . . . . . . . . . . . . . . . 0.5 1.1 1.2 3.1 4.3 5.5 6.6 8.0 7.3India . . . . . . . . . . . . . . . . . . . . . . . . 0.4 0.9 1.0 1.8 2.2 2.8 4.5 6.7 7.5Other Non-OECD Asia . . . . . . . . . . 2.0 4.9 5.4 8.8 10.9 14.3 18.1 21.0 5.2
Middle East . . . . . . . . . . . . . . . . . . . 3.6 7.6 7.9 11.4 13.9 16.4 19.3 22.2 3.9Africa . . . . . . . . . . . . . . . . . . . . . . . . 1.4 2.4 2.6 3.4 5.1 6.2 7.7 9.6 5.0Central and South America . . . . . . 2.0 3.6 3.8 6.1 7.4 9.0 10.5 13.0 4.7
Brazil . . . . . . . . . . . . . . . . . . . . . . . . 0.1 0.5 0.5 1.0 1.2 1.3 1.6 2.0 5.3Other Central and South America. . 1.9 3.1 3.3 5.1 6.2 7.7 8.9 11.0 4.5
Total Non-OECD . . . . . . . . . . . . . 36.5 42.9 45.3 64.2 77.9 92.6 106.8 128.6 3.9
Total World . . . . . . . . . . . . . . . . . . . . 73.4 92.5 95.5 121.8 143.3 163.3 182.0 209.4 3.0aIncludes the 50 States and the District of Columbia.Note: Totals may not equal sum of components due to independent rounding.Sources: History: Energy Information Administration (EIA), International Energy Annual 2003 (May-July 2005), web site www.eia.
doe.gov/iea/. Projections: EIA, Annual Energy Outlook 2006, DOE/EIA-0383(2006) (Washington, DC, February 2006), AEO2006National Energy Modeling System, run HM2006.D112505B, web site www.eia.doe.gov/oiaf/aeo/; and System for the Analysis ofGlobal Energy Markets (2006).

Table B6. World Coal Consumption by Region, High Economic Growth Case, 1990-2030(Million Short Tons)
High Economic Growth Case Projections
Energy Information Administration / International Energy Outlook 2006 107
Region/Country
History Projections Average AnnualPercent Change,
2003-20301990 2002 2003 2010 2015 2020 2025 2030
OECDOECD North America . . . . . . . . . . . 972 1,151 1,185 1,358 1,462 1,635 1,934 2,194 2.3
United Statesa. . . . . . . . . . . . . . . . . 904 1,066 1,095 1,250 1,321 1,486 1,774 2,025 2.3Canada . . . . . . . . . . . . . . . . . . . . . . 59 68 69 82 109 113 120 127 2.3Mexico. . . . . . . . . . . . . . . . . . . . . . . 9 17 20 25 31 36 40 42 2.7
OECD Europe . . . . . . . . . . . . . . . . . 1,298 892 887 883 888 909 961 986 0.4OECD Asia . . . . . . . . . . . . . . . . . . . . 280 400 404 478 517 550 587 630 1.7
Japan . . . . . . . . . . . . . . . . . . . . . . . 126 172 176 181 189 190 190 190 0.3South Korea . . . . . . . . . . . . . . . . . . 48 80 81 124 142 159 182 204 3.5Australia/New Zealand . . . . . . . . . . 106 148 147 174 187 201 216 237 1.8
Total OECD . . . . . . . . . . . . . . . . . 2,551 2,442 2,476 2,719 2,866 3,094 3,482 3,810 1.6
Non-OECDNon-OECD Europe and Eurasia. . . 1,028 530 543 605 713 865 986 1,085 2.6
Russia . . . . . . . . . . . . . . . . . . . . . . . 447 240 251 264 299 331 367 401 1.8Other . . . . . . . . . . . . . . . . . . . . . . . . 581 290 292 341 415 534 619 684 3.2
Non-OECD Asia. . . . . . . . . . . . . . . . 1,507 2,041 2,168 3,472 4,290 5,168 6,086 7,159 4.5China. . . . . . . . . . . . . . . . . . . . . . . . 1,124 1,413 1,531 2,649 3,317 4,042 4,859 5,826 5.1India . . . . . . . . . . . . . . . . . . . . . . . . 256 431 431 586 710 837 902 969 3.0Other Non-OECD Asia . . . . . . . . . . 127 197 206 237 263 290 324 364 2.1
Middle East . . . . . . . . . . . . . . . . . . . 6 16 16 16 17 17 18 20 1.0Africa . . . . . . . . . . . . . . . . . . . . . . . . 152 187 203 271 310 341 364 389 2.4Central and South America . . . . . . 27 34 35 47 53 63 68 74 2.8
Brazil . . . . . . . . . . . . . . . . . . . . . . . . 17 22 24 30 35 39 42 45 2.4Other Central and South America. . 10 12 11 17 18 23 25 29 3.5
Total Non-OECD . . . . . . . . . . . . . 2,718 2,808 2,964 4,411 5,384 6,454 7,521 8,728 4.1
Total World . . . . . . . . . . . . . . . . . . . . 5,269 5,250 5,440 7,131 8,250 9,548 11,003 12,538 3.1aIncludes the 50 States and the District of Columbia.Notes: Totals may not equal sum of components due to independent rounding. To convert short tons to metric tons, divide each
number in the table by 1.102.Sources: History: Energy Information Administration (EIA), International Energy Annual 2003 (May-July 2005), web site www.eia.
doe.gov/iea/. Projections: EIA, Annual Energy Outlook 2006, DOE/EIA-0383(2006) (Washington, DC, February 2006), AEO2006National Energy Modeling System, run HM2006.D112505B, web site www.eia.doe.gov/oiaf/aeo/; and System for the Analysis ofGlobal Energy Markets (2006).

Table B7. World Nuclear Energy Consumption by Region, High Economic Growth Case, 1990-2030(Billion Kilowatthours)
Appendix B
108 Energy Information Administration / International Energy Outlook 2006
Region/Country
History Projections Average AnnualPercent Change,
2003-20301990 2002 2003 2010 2015 2020 2025 2030
OECDOECD North America . . . . . . . . . . . 649 861 844 923 964 994 989 989 0.6
United Statesa. . . . . . . . . . . . . . . . . 577 780 764 809 840 871 871 871 0.5Canada . . . . . . . . . . . . . . . . . . . . . . 69 72 71 104 113 113 108 108 1.6Mexico. . . . . . . . . . . . . . . . . . . . . . . 3 9 10 11 11 11 11 11 0.2
OECD Europe . . . . . . . . . . . . . . . . . 743 923 930 896 877 807 748 707 -1.0OECD Asia . . . . . . . . . . . . . . . . . . . . 242 393 360 416 464 518 567 610 2.0
Japan . . . . . . . . . . . . . . . . . . . . . . . 192 280 237 274 289 318 350 371 1.7South Korea . . . . . . . . . . . . . . . . . . 50 113 123 142 175 200 217 239 2.5Australia/New Zealand . . . . . . . . . . 0 0 0 0 0 0 0 0 —
Total OECD . . . . . . . . . . . . . . . . . 1,635 2,178 2,135 2,234 2,304 2,320 2,304 2,307 0.3
Non-OECDNon-OECD Europe and Eurasia. . . 219 254 258 278 323 393 441 443 2.0
Russia . . . . . . . . . . . . . . . . . . . . . . . 115 134 138 151 190 233 286 321 3.2Other . . . . . . . . . . . . . . . . . . . . . . . . 104 120 120 127 133 160 155 122 0.1
Non-OECD Asia. . . . . . . . . . . . . . . . 38 83 97 187 268 356 434 504 6.3China. . . . . . . . . . . . . . . . . . . . . . . . 0 25 42 79 130 171 230 304 7.6India . . . . . . . . . . . . . . . . . . . . . . . . 6 18 16 56 76 99 106 112 7.4Other Non-OECD Asia . . . . . . . . . . 32 40 39 52 62 85 98 89 3.1
Middle East . . . . . . . . . . . . . . . . . . . 0 0 0 6 6 6 6 6 —Africa . . . . . . . . . . . . . . . . . . . . . . . . 8 12 13 14 15 15 15 15 0.7Central and South America . . . . . . 9 19 20 21 35 32 33 24 0.6
Brazil . . . . . . . . . . . . . . . . . . . . . . . . 2 14 13 13 22 23 23 19 1.2Other Central and South America. . 7 5 7 7 12 10 10 5 -1.1
Total Non-OECD . . . . . . . . . . . . . 274 368 388 505 647 802 929 993 3.5
Total World . . . . . . . . . . . . . . . . . . . . 1,909 2,546 2,523 2,739 2,951 3,122 3,233 3,299 1.0aIncludes the 50 States and the District of Columbia.Note: Totals may not equal sum of components due to independent rounding.Sources: History: Energy Information Administration (EIA), International Energy Annual 2003 (May-July 2005), web site www.eia.
doe.gov/iea/. Projections: EIA, Annual Energy Outlook 2006, DOE/EIA-0383(2006) (Washington, DC, February 2006), AEO2006National Energy Modeling System, run HM2006.D112505B, web site www.eia.doe.gov/oiaf/aeo/; and System for the Analysis ofGlobal Energy Markets (2006).
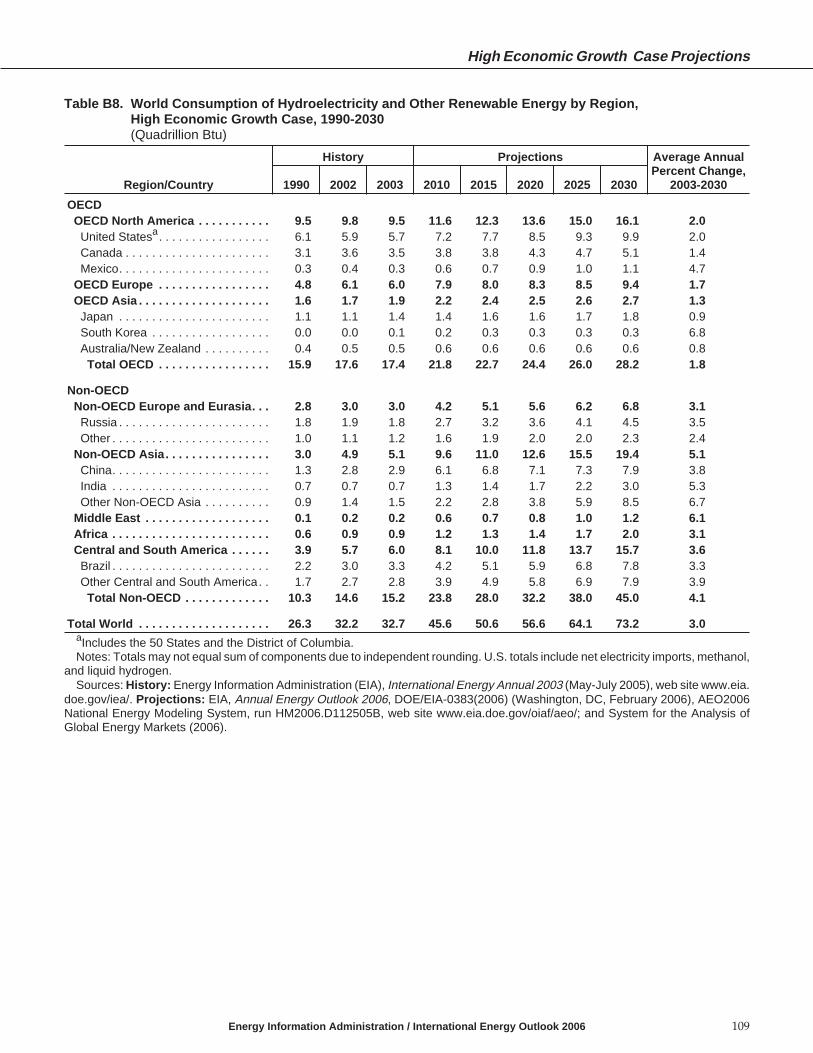
Table B8. World Consumption of Hydroelectricity and Other Renewable Energy by Region,High Economic Growth Case, 1990-2030(Quadrillion Btu)
High Economic Growth Case Projections
Energy Information Administration / International Energy Outlook 2006 109
Region/Country
History Projections Average AnnualPercent Change,
2003-20301990 2002 2003 2010 2015 2020 2025 2030
OECDOECD North America . . . . . . . . . . . 9.5 9.8 9.5 11.6 12.3 13.6 15.0 16.1 2.0
United Statesa. . . . . . . . . . . . . . . . . 6.1 5.9 5.7 7.2 7.7 8.5 9.3 9.9 2.0Canada . . . . . . . . . . . . . . . . . . . . . . 3.1 3.6 3.5 3.8 3.8 4.3 4.7 5.1 1.4Mexico. . . . . . . . . . . . . . . . . . . . . . . 0.3 0.4 0.3 0.6 0.7 0.9 1.0 1.1 4.7
OECD Europe . . . . . . . . . . . . . . . . . 4.8 6.1 6.0 7.9 8.0 8.3 8.5 9.4 1.7OECD Asia . . . . . . . . . . . . . . . . . . . . 1.6 1.7 1.9 2.2 2.4 2.5 2.6 2.7 1.3
Japan . . . . . . . . . . . . . . . . . . . . . . . 1.1 1.1 1.4 1.4 1.6 1.6 1.7 1.8 0.9South Korea . . . . . . . . . . . . . . . . . . 0.0 0.0 0.1 0.2 0.3 0.3 0.3 0.3 6.8Australia/New Zealand . . . . . . . . . . 0.4 0.5 0.5 0.6 0.6 0.6 0.6 0.6 0.8
Total OECD . . . . . . . . . . . . . . . . . 15.9 17.6 17.4 21.8 22.7 24.4 26.0 28.2 1.8
Non-OECDNon-OECD Europe and Eurasia. . . 2.8 3.0 3.0 4.2 5.1 5.6 6.2 6.8 3.1
Russia . . . . . . . . . . . . . . . . . . . . . . . 1.8 1.9 1.8 2.7 3.2 3.6 4.1 4.5 3.5Other . . . . . . . . . . . . . . . . . . . . . . . . 1.0 1.1 1.2 1.6 1.9 2.0 2.0 2.3 2.4
Non-OECD Asia. . . . . . . . . . . . . . . . 3.0 4.9 5.1 9.6 11.0 12.6 15.5 19.4 5.1China. . . . . . . . . . . . . . . . . . . . . . . . 1.3 2.8 2.9 6.1 6.8 7.1 7.3 7.9 3.8India . . . . . . . . . . . . . . . . . . . . . . . . 0.7 0.7 0.7 1.3 1.4 1.7 2.2 3.0 5.3Other Non-OECD Asia . . . . . . . . . . 0.9 1.4 1.5 2.2 2.8 3.8 5.9 8.5 6.7
Middle East . . . . . . . . . . . . . . . . . . . 0.1 0.2 0.2 0.6 0.7 0.8 1.0 1.2 6.1Africa . . . . . . . . . . . . . . . . . . . . . . . . 0.6 0.9 0.9 1.2 1.3 1.4 1.7 2.0 3.1Central and South America . . . . . . 3.9 5.7 6.0 8.1 10.0 11.8 13.7 15.7 3.6
Brazil . . . . . . . . . . . . . . . . . . . . . . . . 2.2 3.0 3.3 4.2 5.1 5.9 6.8 7.8 3.3Other Central and South America. . 1.7 2.7 2.8 3.9 4.9 5.8 6.9 7.9 3.9
Total Non-OECD . . . . . . . . . . . . . 10.3 14.6 15.2 23.8 28.0 32.2 38.0 45.0 4.1
Total World . . . . . . . . . . . . . . . . . . . . 26.3 32.2 32.7 45.6 50.6 56.6 64.1 73.2 3.0aIncludes the 50 States and the District of Columbia.Notes: Totals may not equal sum of components due to independent rounding. U.S. totals include net electricity imports, methanol,
and liquid hydrogen.Sources: History: Energy Information Administration (EIA), International Energy Annual 2003 (May-July 2005), web site www.eia.
doe.gov/iea/. Projections: EIA, Annual Energy Outlook 2006, DOE/EIA-0383(2006) (Washington, DC, February 2006), AEO2006National Energy Modeling System, run HM2006.D112505B, web site www.eia.doe.gov/oiaf/aeo/; and System for the Analysis ofGlobal Energy Markets (2006).

Table B9. World Net Electricity Consumption by Region, High Economic Growth Case, 1990-2030(Billion Kilowatthours)
Appendix B
110 Energy Information Administration / International Energy Outlook 2006
Region/Country
History Projections Average AnnualPercent Change,
2003-20301990 2002 2003 2010 2015 2020 2025 2030
OECDOECD North America . . . . . . . . . . . 3,379 4,337 4,384 5,055 5,539 6,045 6,559 7,127 1.8
United Statesa. . . . . . . . . . . . . . . . . 2,837 3,629 3,669 4,155 4,491 4,844 5,208 5,619 1.6Canada . . . . . . . . . . . . . . . . . . . . . . 435 518 521 616 685 745 795 848 1.8Mexico. . . . . . . . . . . . . . . . . . . . . . . 107 190 194 284 364 456 556 660 4.6
OECD Europe . . . . . . . . . . . . . . . . . 2,355 2,916 2,965 3,397 3,636 3,881 4,162 4,475 1.5OECD Asia . . . . . . . . . . . . . . . . . . . . 1,024 1,463 1,487 1,781 1,938 2,063 2,190 2,328 1.7
Japan . . . . . . . . . . . . . . . . . . . . . . . 764 964 946 1,071 1,129 1,167 1,206 1,246 1.0South Korea . . . . . . . . . . . . . . . . . . 93 268 303 433 507 567 626 690 3.1Australia/New Zealand . . . . . . . . . . 166 231 238 277 303 329 359 391 1.9
Total OECD . . . . . . . . . . . . . . . . . 6,758 8,715 8,836 10,233 11,114 11,989 12,911 13,930 1.7
Non-OECDNon-OECD Europe and Eurasia. . . 1,672 1,318 1,350 1,926 2,337 2,733 3,128 3,551 3.6
Russia . . . . . . . . . . . . . . . . . . . . . . . 955 796 812 1,141 1,375 1,635 1,876 2,135 3.6Other . . . . . . . . . . . . . . . . . . . . . . . . 717 522 539 785 962 1,098 1,253 1,416 3.6
Non-OECD Asia. . . . . . . . . . . . . . . . 1,150 2,655 2,917 4,930 6,449 8,211 10,242 12,620 5.6China. . . . . . . . . . . . . . . . . . . . . . . . 551 1,452 1,671 2,910 3,822 4,863 6,044 7,449 5.7India . . . . . . . . . . . . . . . . . . . . . . . . 257 525 519 879 1,127 1,406 1,724 2,108 5.3Other Non-OECD Asia . . . . . . . . . . 342 678 726 1,141 1,500 1,942 2,474 3,063 5.5
Middle East . . . . . . . . . . . . . . . . . . . 214 457 471 707 842 971 1,100 1,230 3.6Africa . . . . . . . . . . . . . . . . . . . . . . . . 286 420 436 588 725 862 1,020 1,208 3.9Central and South America . . . . . . 463 736 772 1,184 1,502 1,857 2,246 2,653 4.7
Brazil . . . . . . . . . . . . . . . . . . . . . . . . 229 353 371 541 662 790 924 1,064 4.0Other Central and South America. . 234 383 400 643 841 1,067 1,322 1,589 5.2
Total Non-OECD . . . . . . . . . . . . . 3,785 5,586 5,944 9,336 11,856 14,634 17,737 21,262 4.8
Total World . . . . . . . . . . . . . . . . . . . . 10,543 14,301 14,781 19,568 22,970 26,623 30,648 35,192 3.3aIncludes the 50 States and the District of Columbia.Note: Totals may not equal sum of components due to independent rounding.Sources: History: Energy Information Administration (EIA), International Energy Annual 2003 (May-July 2005), web site www.eia.
doe.gov/iea/. Projections: EIA, Annual Energy Outlook 2006, DOE/EIA-0383(2006) (Washington, DC, February 2006), AEO2006National Energy Modeling System, run HM2006.D112505B, web site www.eia.doe.gov/oiaf/aeo/; and System for the Analysis ofGlobal Energy Markets (2006).
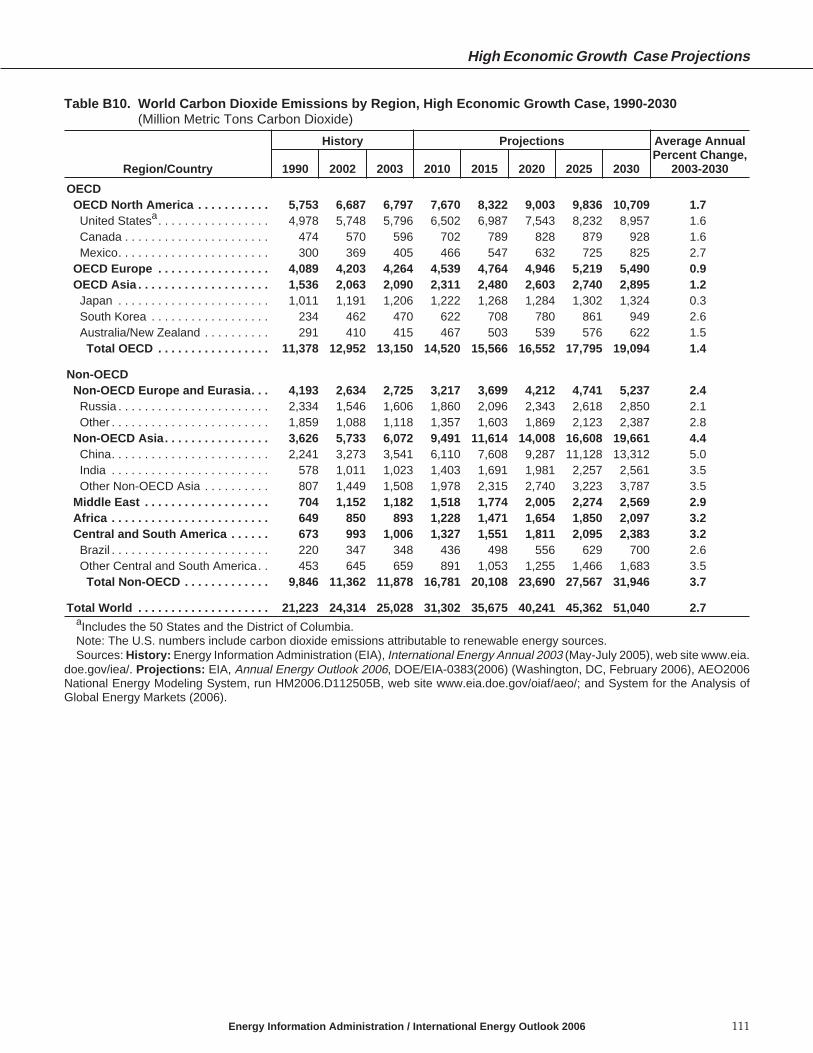
Table B10. World Carbon Dioxide Emissions by Region, High Economic Growth Case, 1990-2030(Million Metric Tons Carbon Dioxide)
High Economic Growth Case Projections
Energy Information Administration / International Energy Outlook 2006 111
Region/Country
History Projections Average AnnualPercent Change,
2003-20301990 2002 2003 2010 2015 2020 2025 2030
OECDOECD North America . . . . . . . . . . . 5,753 6,687 6,797 7,670 8,322 9,003 9,836 10,709 1.7
United Statesa. . . . . . . . . . . . . . . . . 4,978 5,748 5,796 6,502 6,987 7,543 8,232 8,957 1.6Canada . . . . . . . . . . . . . . . . . . . . . . 474 570 596 702 789 828 879 928 1.6Mexico. . . . . . . . . . . . . . . . . . . . . . . 300 369 405 466 547 632 725 825 2.7
OECD Europe . . . . . . . . . . . . . . . . . 4,089 4,203 4,264 4,539 4,764 4,946 5,219 5,490 0.9OECD Asia . . . . . . . . . . . . . . . . . . . . 1,536 2,063 2,090 2,311 2,480 2,603 2,740 2,895 1.2
Japan . . . . . . . . . . . . . . . . . . . . . . . 1,011 1,191 1,206 1,222 1,268 1,284 1,302 1,324 0.3South Korea . . . . . . . . . . . . . . . . . . 234 462 470 622 708 780 861 949 2.6Australia/New Zealand . . . . . . . . . . 291 410 415 467 503 539 576 622 1.5
Total OECD . . . . . . . . . . . . . . . . . 11,378 12,952 13,150 14,520 15,566 16,552 17,795 19,094 1.4
Non-OECDNon-OECD Europe and Eurasia. . . 4,193 2,634 2,725 3,217 3,699 4,212 4,741 5,237 2.4
Russia . . . . . . . . . . . . . . . . . . . . . . . 2,334 1,546 1,606 1,860 2,096 2,343 2,618 2,850 2.1Other . . . . . . . . . . . . . . . . . . . . . . . . 1,859 1,088 1,118 1,357 1,603 1,869 2,123 2,387 2.8
Non-OECD Asia. . . . . . . . . . . . . . . . 3,626 5,733 6,072 9,491 11,614 14,008 16,608 19,661 4.4China. . . . . . . . . . . . . . . . . . . . . . . . 2,241 3,273 3,541 6,110 7,608 9,287 11,128 13,312 5.0India . . . . . . . . . . . . . . . . . . . . . . . . 578 1,011 1,023 1,403 1,691 1,981 2,257 2,561 3.5Other Non-OECD Asia . . . . . . . . . . 807 1,449 1,508 1,978 2,315 2,740 3,223 3,787 3.5
Middle East . . . . . . . . . . . . . . . . . . . 704 1,152 1,182 1,518 1,774 2,005 2,274 2,569 2.9Africa . . . . . . . . . . . . . . . . . . . . . . . . 649 850 893 1,228 1,471 1,654 1,850 2,097 3.2Central and South America . . . . . . 673 993 1,006 1,327 1,551 1,811 2,095 2,383 3.2
Brazil . . . . . . . . . . . . . . . . . . . . . . . . 220 347 348 436 498 556 629 700 2.6Other Central and South America. . 453 645 659 891 1,053 1,255 1,466 1,683 3.5
Total Non-OECD . . . . . . . . . . . . . 9,846 11,362 11,878 16,781 20,108 23,690 27,567 31,946 3.7
Total World . . . . . . . . . . . . . . . . . . . . 21,223 24,314 25,028 31,302 35,675 40,241 45,362 51,040 2.7aIncludes the 50 States and the District of Columbia.Note: The U.S. numbers include carbon dioxide emissions attributable to renewable energy sources.Sources: History: Energy Information Administration (EIA), International Energy Annual 2003 (May-July 2005), web site www.eia.
doe.gov/iea/. Projections: EIA, Annual Energy Outlook 2006, DOE/EIA-0383(2006) (Washington, DC, February 2006), AEO2006National Energy Modeling System, run HM2006.D112505B, web site www.eia.doe.gov/oiaf/aeo/; and System for the Analysis ofGlobal Energy Markets (2006).

Table B11. World Carbon Dioxide Emissions from Oil Use by Region, High Economic Growth Case,1990-2030(Million Metric Tons Carbon Dioxide)
Appendix B
112 Energy Information Administration / International Energy Outlook 2006
Region/Country
History Projections Average AnnualPercent Change,
2003-20301990 2002 2003 2010 2015 2020 2025 2030
OECDOECD North America . . . . . . . . . . . 2,636 2,969 3,034 3,410 3,692 3,954 4,251 4,578 1.5
United Statesa. . . . . . . . . . . . . . . . . 2,181 2,456 2,498 2,814 3,039 3,258 3,502 3,773 1.5Canada . . . . . . . . . . . . . . . . . . . . . . 224 262 276 305 321 326 340 351 0.9Mexico. . . . . . . . . . . . . . . . . . . . . . . 231 250 260 291 333 370 410 454 2.1
OECD Europe . . . . . . . . . . . . . . . . . 1,864 2,069 2,094 2,165 2,201 2,210 2,268 2,328 0.4OECD Asia . . . . . . . . . . . . . . . . . . . . 913 1,035 1,052 1,100 1,145 1,181 1,221 1,261 0.7
Japan . . . . . . . . . . . . . . . . . . . . . . . 663 654 667 656 657 658 662 658 -0.1South Korea . . . . . . . . . . . . . . . . . . 140 244 246 297 336 365 395 430 2.1Australia/New Zealand . . . . . . . . . . 110 137 138 146 152 158 164 173 0.8
Total OECD . . . . . . . . . . . . . . . . . 5,412 6,073 6,180 6,675 7,039 7,345 7,740 8,167 1.0
Non-OECDNon-OECD Europe and Eurasia. . . 1,350 657 669 787 890 989 1,273 1,203 2.2
Russia . . . . . . . . . . . . . . . . . . . . . . . 782 351 356 398 443 490 715 578 1.8Other . . . . . . . . . . . . . . . . . . . . . . . . 568 306 312 389 447 499 558 625 2.6
Non-OECD Asia. . . . . . . . . . . . . . . . 949 1,775 1,853 2,631 3,106 3,668 4,272 5,057 3.8China. . . . . . . . . . . . . . . . . . . . . . . . 325 686 737 1,196 1,428 1,739 2,058 2,430 4.5India . . . . . . . . . . . . . . . . . . . . . . . . 160 298 305 400 470 535 615 695 3.1Other Non-OECD Asia . . . . . . . . . . 464 791 810 1,036 1,208 1,394 1,600 1,931 3.3
Middle East . . . . . . . . . . . . . . . . . . . 492 695 714 853 967 1,060 1,167 1,297 2.2Africa . . . . . . . . . . . . . . . . . . . . . . . . 298 372 379 540 615 679 748 844 3.0Central and South America . . . . . . 503 721 719 885 1,026 1,172 1,361 1,493 2.7
Brazil . . . . . . . . . . . . . . . . . . . . . . . . 180 280 276 326 370 409 463 505 2.3Other Central and South America. . 323 441 443 560 657 762 899 987 3.0
Total Non-OECD . . . . . . . . . . . . . 3,592 4,219 4,333 5,696 6,605 7,568 8,821 9,893 3.1
Total World . . . . . . . . . . . . . . . . . . . . 9,005 10,291 10,513 12,371 13,644 14,913 16,562 18,060 2.0aIncludes the 50 States and the District of Columbia.Sources: History: Energy Information Administration (EIA), International Energy Annual 2003 (May-July 2005), web site www.eia.
doe.gov/iea/. Projections: EIA, Annual Energy Outlook 2006, DOE/EIA-0383(2006) (Washington, DC, February 2006), AEO2006National Energy Modeling System, run HM2006.D112505B, web site www.eia.doe.gov/oiaf/aeo/; and System for the Analysis ofGlobal Energy Markets (2006).

Table B12. World Carbon Dioxide Emissions from Natural Gas Use by Region, High Economic Growth Case,1990-2030(Million Metric Tons Carbon Dioxide)
High Economic Growth Case Projections
Energy Information Administration / International Energy Outlook 2006 113
Region/Country
History Projections Average AnnualPercent Change,
2003-20301990 2002 2003 2010 2015 2020 2025 2030
OECDOECD North America . . . . . . . . . . . 1,207 1,479 1,474 1,645 1,840 1,963 2,037 2,131 1.4
United Statesa. . . . . . . . . . . . . . . . . 1,026 1,228 1,196 1,295 1,450 1,508 1,514 1,534 0.9Canada . . . . . . . . . . . . . . . . . . . . . . 127 165 173 224 237 263 286 309 2.2Mexico. . . . . . . . . . . . . . . . . . . . . . . 54 86 105 126 153 191 237 288 3.8
OECD Europe . . . . . . . . . . . . . . . . . 590 934 967 1,177 1,360 1,504 1,649 1,826 2.4OECD Asia . . . . . . . . . . . . . . . . . . . . 152 270 277 310 359 385 413 450 1.8
Japan . . . . . . . . . . . . . . . . . . . . . . . 102 163 169 185 214 226 241 268 1.7South Korea . . . . . . . . . . . . . . . . . . 6 48 50 60 70 76 79 85 1.9Australia/New Zealand . . . . . . . . . . 44 59 58 64 75 84 93 98 1.9
Total OECD . . . . . . . . . . . . . . . . . 1,949 2,683 2,718 3,131 3,559 3,853 4,100 4,407 1.8
Non-OECDNon-OECD Europe and Eurasia. . . 1,450 1,213 1,281 1,613 1,853 2,081 2,174 2,610 2.7
Russia . . . . . . . . . . . . . . . . . . . . . . . 928 789 828 1,017 1,151 1,296 1,286 1,597 2.5Other . . . . . . . . . . . . . . . . . . . . . . . . 521 424 452 595 702 785 888 1,013 3.0
Non-OECD Asia. . . . . . . . . . . . . . . . 160 384 415 759 972 1,264 1,631 1,992 6.0China. . . . . . . . . . . . . . . . . . . . . . . . 30 69 72 188 262 338 403 490 7.3India . . . . . . . . . . . . . . . . . . . . . . . . 24 48 52 97 122 152 247 367 7.5Other Non-OECD Asia . . . . . . . . . . 106 267 290 474 587 773 981 1,135 5.2
Middle East . . . . . . . . . . . . . . . . . . . 199 422 435 631 771 908 1,069 1,229 3.9Africa . . . . . . . . . . . . . . . . . . . . . . . . 80 139 145 194 291 354 438 544 5.0Central and South America . . . . . . 116 203 217 347 418 513 597 741 4.6
Brazil . . . . . . . . . . . . . . . . . . . . . . . . 6 26 27 55 64 74 88 111 5.3Other Central and South America. . 110 177 190 292 354 440 510 630 4.5
Total Non-OECD . . . . . . . . . . . . . 2,005 2,361 2,493 3,544 4,305 5,120 5,910 7,117 4.0
Total World . . . . . . . . . . . . . . . . . . . . 3,954 5,044 5,211 6,675 7,864 8,972 10,009 11,524 3.0aIncludes the 50 States and the District of Columbia.Sources: History: Energy Information Administration (EIA), International Energy Annual 2003 (May-July 2005), web site www.eia.
doe.gov/iea/. Projections: EIA, Annual Energy Outlook 2006, DOE/EIA-0383(2006) (Washington, DC, February 2006), AEO2006National Energy Modeling System, run HM2006.D112505B, web site www.eia.doe.gov/oiaf/aeo/; and System for the Analysis ofGlobal Energy Markets (2006).
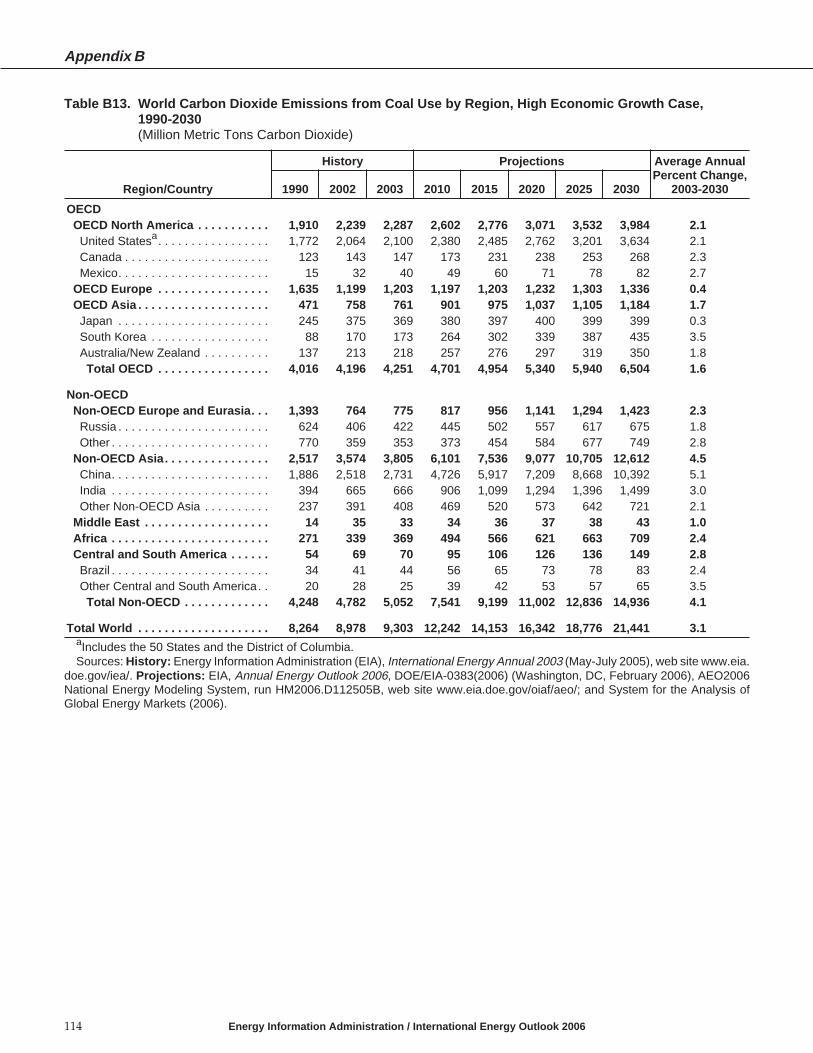
Table B13. World Carbon Dioxide Emissions from Coal Use by Region, High Economic Growth Case,1990-2030(Million Metric Tons Carbon Dioxide)
Appendix B
114 Energy Information Administration / International Energy Outlook 2006
Region/Country
History Projections Average AnnualPercent Change,
2003-20301990 2002 2003 2010 2015 2020 2025 2030
OECDOECD North America . . . . . . . . . . . 1,910 2,239 2,287 2,602 2,776 3,071 3,532 3,984 2.1
United Statesa. . . . . . . . . . . . . . . . . 1,772 2,064 2,100 2,380 2,485 2,762 3,201 3,634 2.1Canada . . . . . . . . . . . . . . . . . . . . . . 123 143 147 173 231 238 253 268 2.3Mexico. . . . . . . . . . . . . . . . . . . . . . . 15 32 40 49 60 71 78 82 2.7
OECD Europe . . . . . . . . . . . . . . . . . 1,635 1,199 1,203 1,197 1,203 1,232 1,303 1,336 0.4OECD Asia . . . . . . . . . . . . . . . . . . . . 471 758 761 901 975 1,037 1,105 1,184 1.7
Japan . . . . . . . . . . . . . . . . . . . . . . . 245 375 369 380 397 400 399 399 0.3South Korea . . . . . . . . . . . . . . . . . . 88 170 173 264 302 339 387 435 3.5Australia/New Zealand . . . . . . . . . . 137 213 218 257 276 297 319 350 1.8
Total OECD . . . . . . . . . . . . . . . . . 4,016 4,196 4,251 4,701 4,954 5,340 5,940 6,504 1.6
Non-OECDNon-OECD Europe and Eurasia. . . 1,393 764 775 817 956 1,141 1,294 1,423 2.3
Russia . . . . . . . . . . . . . . . . . . . . . . . 624 406 422 445 502 557 617 675 1.8Other . . . . . . . . . . . . . . . . . . . . . . . . 770 359 353 373 454 584 677 749 2.8
Non-OECD Asia. . . . . . . . . . . . . . . . 2,517 3,574 3,805 6,101 7,536 9,077 10,705 12,612 4.5China. . . . . . . . . . . . . . . . . . . . . . . . 1,886 2,518 2,731 4,726 5,917 7,209 8,668 10,392 5.1India . . . . . . . . . . . . . . . . . . . . . . . . 394 665 666 906 1,099 1,294 1,396 1,499 3.0Other Non-OECD Asia . . . . . . . . . . 237 391 408 469 520 573 642 721 2.1
Middle East . . . . . . . . . . . . . . . . . . . 14 35 33 34 36 37 38 43 1.0Africa . . . . . . . . . . . . . . . . . . . . . . . . 271 339 369 494 566 621 663 709 2.4Central and South America . . . . . . 54 69 70 95 106 126 136 149 2.8
Brazil . . . . . . . . . . . . . . . . . . . . . . . . 34 41 44 56 65 73 78 83 2.4Other Central and South America. . 20 28 25 39 42 53 57 65 3.5
Total Non-OECD . . . . . . . . . . . . . 4,248 4,782 5,052 7,541 9,199 11,002 12,836 14,936 4.1
Total World . . . . . . . . . . . . . . . . . . . . 8,264 8,978 9,303 12,242 14,153 16,342 18,776 21,441 3.1aIncludes the 50 States and the District of Columbia.Sources: History: Energy Information Administration (EIA), International Energy Annual 2003 (May-July 2005), web site www.eia.
doe.gov/iea/. Projections: EIA, Annual Energy Outlook 2006, DOE/EIA-0383(2006) (Washington, DC, February 2006), AEO2006National Energy Modeling System, run HM2006.D112505B, web site www.eia.doe.gov/oiaf/aeo/; and System for the Analysis ofGlobal Energy Markets (2006).

Appendix C
Low Economic Growth Case Projections:• World Energy Consumption
• Gross Domestic Product• Carbon Dioxide Emissions

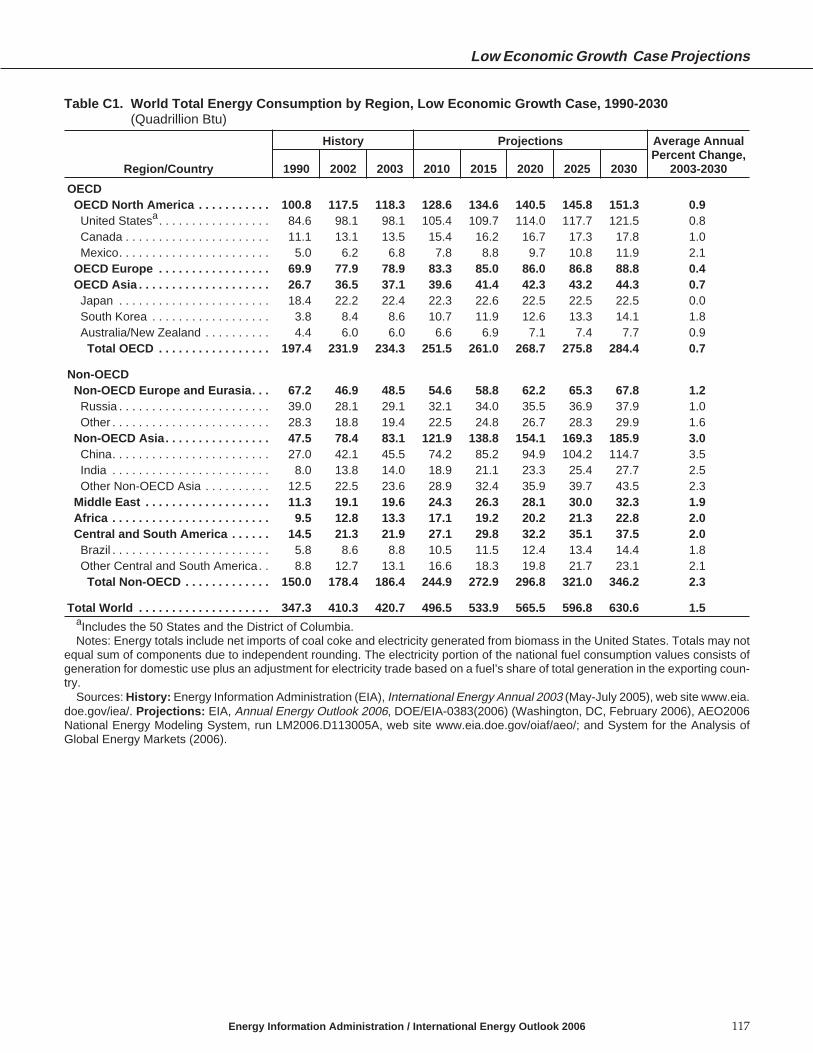
Table C1. World Total Energy Consumption by Region, Low Economic Growth Case, 1990-2030(Quadrillion Btu)
Low Economic Growth Case Projections
Energy Information Administration / International Energy Outlook 2006 117
Region/Country
History Projections Average AnnualPercent Change,
2003-20301990 2002 2003 2010 2015 2020 2025 2030
OECDOECD North America . . . . . . . . . . . 100.8 117.5 118.3 128.6 134.6 140.5 145.8 151.3 0.9
United Statesa. . . . . . . . . . . . . . . . . 84.6 98.1 98.1 105.4 109.7 114.0 117.7 121.5 0.8Canada . . . . . . . . . . . . . . . . . . . . . . 11.1 13.1 13.5 15.4 16.2 16.7 17.3 17.8 1.0Mexico. . . . . . . . . . . . . . . . . . . . . . . 5.0 6.2 6.8 7.8 8.8 9.7 10.8 11.9 2.1
OECD Europe . . . . . . . . . . . . . . . . . 69.9 77.9 78.9 83.3 85.0 86.0 86.8 88.8 0.4OECD Asia . . . . . . . . . . . . . . . . . . . . 26.7 36.5 37.1 39.6 41.4 42.3 43.2 44.3 0.7
Japan . . . . . . . . . . . . . . . . . . . . . . . 18.4 22.2 22.4 22.3 22.6 22.5 22.5 22.5 0.0South Korea . . . . . . . . . . . . . . . . . . 3.8 8.4 8.6 10.7 11.9 12.6 13.3 14.1 1.8Australia/New Zealand . . . . . . . . . . 4.4 6.0 6.0 6.6 6.9 7.1 7.4 7.7 0.9
Total OECD . . . . . . . . . . . . . . . . . 197.4 231.9 234.3 251.5 261.0 268.7 275.8 284.4 0.7
Non-OECDNon-OECD Europe and Eurasia. . . 67.2 46.9 48.5 54.6 58.8 62.2 65.3 67.8 1.2
Russia . . . . . . . . . . . . . . . . . . . . . . . 39.0 28.1 29.1 32.1 34.0 35.5 36.9 37.9 1.0Other . . . . . . . . . . . . . . . . . . . . . . . . 28.3 18.8 19.4 22.5 24.8 26.7 28.3 29.9 1.6
Non-OECD Asia. . . . . . . . . . . . . . . . 47.5 78.4 83.1 121.9 138.8 154.1 169.3 185.9 3.0China. . . . . . . . . . . . . . . . . . . . . . . . 27.0 42.1 45.5 74.2 85.2 94.9 104.2 114.7 3.5India . . . . . . . . . . . . . . . . . . . . . . . . 8.0 13.8 14.0 18.9 21.1 23.3 25.4 27.7 2.5Other Non-OECD Asia . . . . . . . . . . 12.5 22.5 23.6 28.9 32.4 35.9 39.7 43.5 2.3
Middle East . . . . . . . . . . . . . . . . . . . 11.3 19.1 19.6 24.3 26.3 28.1 30.0 32.3 1.9Africa . . . . . . . . . . . . . . . . . . . . . . . . 9.5 12.8 13.3 17.1 19.2 20.2 21.3 22.8 2.0Central and South America . . . . . . 14.5 21.3 21.9 27.1 29.8 32.2 35.1 37.5 2.0
Brazil . . . . . . . . . . . . . . . . . . . . . . . . 5.8 8.6 8.8 10.5 11.5 12.4 13.4 14.4 1.8Other Central and South America. . 8.8 12.7 13.1 16.6 18.3 19.8 21.7 23.1 2.1
Total Non-OECD . . . . . . . . . . . . . 150.0 178.4 186.4 244.9 272.9 296.8 321.0 346.2 2.3
Total World . . . . . . . . . . . . . . . . . . . . 347.3 410.3 420.7 496.5 533.9 565.5 596.8 630.6 1.5aIncludes the 50 States and the District of Columbia.Notes: Energy totals include net imports of coal coke and electricity generated from biomass in the United States. Totals may not
equal sum of components due to independent rounding. The electricity portion of the national fuel consumption values consists ofgeneration for domestic use plus an adjustment for electricity trade based on a fuel’s share of total generation in the exporting coun-try.
Sources: History: Energy Information Administration (EIA), International Energy Annual 2003 (May-July 2005), web site www.eia.doe.gov/iea/. Projections: EIA, Annual Energy Outlook 2006, DOE/EIA-0383(2006) (Washington, DC, February 2006), AEO2006National Energy Modeling System, run LM2006.D113005A, web site www.eia.doe.gov/oiaf/aeo/; and System for the Analysis ofGlobal Energy Markets (2006).

Table C2. World Total Energy Consumption by Region and Fuel, Low Economic Growth Case, 1990-2030(Quadrillion Btu)
Appendix C
118 Energy Information Administration / International Energy Outlook 2006
Region/Country
History Projections Average AnnualPercent Change,
2003-20301990 2002 2003 2010 2015 2020 2025 2030
OECDOECD North America
Oil . . . . . . . . . . . . . . . . . . . . . . . . . 40.5 46.3 47.2 51.0 52.8 54.7 56.3 58.6 0.8Natural Gas . . . . . . . . . . . . . . . . . 23.2 28.4 28.3 29.8 32.5 34.2 34.9 35.4 0.8Coal . . . . . . . . . . . . . . . . . . . . . . . 20.7 24.0 24.4 26.7 27.9 29.1 31.6 33.7 1.2Nuclear. . . . . . . . . . . . . . . . . . . . . 6.9 9.0 8.9 9.7 9.8 10.3 10.3 10.3 0.5Other . . . . . . . . . . . . . . . . . . . . . . 9.5 9.8 9.5 11.4 11.7 12.1 12.8 13.3 1.2
Total. . . . . . . . . . . . . . . . . . . . . . 100.8 117.5 118.3 128.6 134.6 140.5 145.8 151.3 0.9OECD Europe
Oil . . . . . . . . . . . . . . . . . . . . . . . . . 28.4 31.6 32.0 32.2 32.0 31.3 31.5 31.7 0.0Natural Gas . . . . . . . . . . . . . . . . . 11.2 17.7 18.3 21.1 23.3 25.6 26.4 28.6 1.7Coal . . . . . . . . . . . . . . . . . . . . . . . 17.6 12.8 12.8 12.7 12.5 12.6 12.7 12.6 -0.1Nuclear. . . . . . . . . . . . . . . . . . . . . 7.9 9.7 9.8 9.5 9.3 8.5 7.9 7.5 -1.0Other . . . . . . . . . . . . . . . . . . . . . . 4.8 6.1 6.0 7.9 8.0 8.0 8.4 8.4 1.3
Total. . . . . . . . . . . . . . . . . . . . . . 69.9 77.9 78.9 83.3 85.0 86.0 86.8 88.8 0.4OECD Asia
Oil . . . . . . . . . . . . . . . . . . . . . . . . . 14.5 17.5 17.8 18.3 18.7 18.8 18.9 19.2 0.3Natural Gas . . . . . . . . . . . . . . . . . 2.9 5.1 5.3 5.5 6.0 6.2 6.3 6.5 0.8Coal . . . . . . . . . . . . . . . . . . . . . . . 5.2 8.2 8.4 9.5 9.7 9.7 9.9 10.1 0.7Nuclear. . . . . . . . . . . . . . . . . . . . . 2.5 4.0 3.7 4.2 4.7 5.3 5.8 6.2 2.0Other . . . . . . . . . . . . . . . . . . . . . . 1.6 1.7 1.9 2.1 2.3 2.3 2.3 2.3 0.7
Total. . . . . . . . . . . . . . . . . . . . . . 26.7 36.5 37.1 39.6 41.4 42.3 43.2 44.3 0.7Total OECD
Oil . . . . . . . . . . . . . . . . . . . . . . . . . 83.4 95.4 97.0 101.5 103.5 104.8 106.7 109.5 0.4Natural Gas . . . . . . . . . . . . . . . . . 37.2 51.2 51.9 56.4 61.7 66.0 67.7 70.6 1.1Coal . . . . . . . . . . . . . . . . . . . . . . . 43.5 44.9 45.6 48.8 50.1 51.4 54.1 56.4 0.8Nuclear. . . . . . . . . . . . . . . . . . . . . 17.3 22.7 22.3 23.4 23.8 24.1 23.9 23.9 0.3Other . . . . . . . . . . . . . . . . . . . . . . 15.9 17.6 17.4 21.5 21.9 22.4 23.4 24.1 1.2
Total. . . . . . . . . . . . . . . . . . . . . . 197.4 231.9 234.3 251.5 261.0 268.7 275.8 284.4 0.7
Non-OECDNon-OECD Europe and Eurasia
Oil . . . . . . . . . . . . . . . . . . . . . . . . . 19.5 9.9 10.1 10.7 11.4 11.7 12.1 12.5 0.8Natural Gas . . . . . . . . . . . . . . . . . 27.5 23.0 24.3 28.5 30.4 32.4 34.0 35.6 1.4Coal . . . . . . . . . . . . . . . . . . . . . . . 15.1 8.3 8.4 8.6 9.6 10.0 10.4 10.9 1.0Nuclear. . . . . . . . . . . . . . . . . . . . . 2.5 2.8 2.8 3.1 3.5 4.3 4.8 4.9 2.0Other . . . . . . . . . . . . . . . . . . . . . . 2.8 3.0 3.0 3.7 3.9 3.9 3.9 3.9 1.0
Total. . . . . . . . . . . . . . . . . . . . . . 67.2 46.9 48.5 54.6 58.8 62.2 65.3 67.8 1.2Non-OECD Asia
Oil . . . . . . . . . . . . . . . . . . . . . . . . . 13.9 26.7 27.9 37.0 40.5 44.5 47.5 51.2 2.3Natural Gas . . . . . . . . . . . . . . . . . 3.0 7.3 7.9 11.9 14.7 17.7 21.1 24.5 4.3Coal . . . . . . . . . . . . . . . . . . . . . . . 27.2 38.7 41.2 61.2 70.0 76.9 84.0 91.5 3.0Nuclear. . . . . . . . . . . . . . . . . . . . . 0.4 0.9 1.0 2.0 2.9 3.8 4.6 5.3 6.3Other . . . . . . . . . . . . . . . . . . . . . . 3.0 4.9 5.1 9.8 10.8 11.2 12.2 13.4 3.6
Total. . . . . . . . . . . . . . . . . . . . . . 47.5 78.4 83.1 121.9 138.8 154.1 169.3 185.9 3.0
See notes at end of table.

Table C2. World Total Energy Consumption by Region and Fuel, Low Economic Growth Case, 1990-2030(Continued)(Quadrillion Btu)
Low Economic Growth Case Projections
Energy Information Administration / International Energy Outlook 2006 119
Region/Country
History Projections Average AnnualPercent Change,
2002-20251990 2002 2003 2010 2015 2020 2025 2030
Non-OECD (Continued)Middle East
Oil . . . . . . . . . . . . . . . . . . . . . . . . . 7.2 10.5 10.8 11.9 12.4 12.7 12.8 13.2 0.7Natural Gas . . . . . . . . . . . . . . . . . 3.8 8.0 8.2 11.4 12.8 14.3 16.0 18.0 2.9Coal . . . . . . . . . . . . . . . . . . . . . . . 0.1 0.4 0.4 0.4 0.4 0.4 0.4 0.4 0.7Nuclear. . . . . . . . . . . . . . . . . . . . . 0.0 0.0 0.0 0.1 0.1 0.1 0.1 0.1 —Other . . . . . . . . . . . . . . . . . . . . . . 0.1 0.2 0.2 0.6 0.6 0.7 0.7 0.7 4.0
Total. . . . . . . . . . . . . . . . . . . . . . 11.3 19.1 19.6 24.3 26.3 28.1 30.0 32.3 1.9Africa
Oil . . . . . . . . . . . . . . . . . . . . . . . . . 4.3 5.4 5.5 7.3 7.6 7.7 7.9 8.3 1.5Natural Gas . . . . . . . . . . . . . . . . . 1.5 2.6 2.7 3.5 4.6 5.5 6.3 7.2 3.7Coal . . . . . . . . . . . . . . . . . . . . . . . 3.0 3.7 4.1 5.1 5.7 5.8 5.8 5.9 1.4Nuclear. . . . . . . . . . . . . . . . . . . . . 0.1 0.1 0.1 0.1 0.2 0.2 0.2 0.2 0.7Other . . . . . . . . . . . . . . . . . . . . . . 0.6 0.9 0.9 1.1 1.1 1.1 1.1 1.1 0.9
Total. . . . . . . . . . . . . . . . . . . . . . 9.5 12.8 13.3 17.1 19.2 20.2 21.3 22.8 2.0Central and South America
Oil . . . . . . . . . . . . . . . . . . . . . . . . . 7.7 10.8 10.8 12.1 12.9 13.3 14.0 14.7 1.2Natural Gas . . . . . . . . . . . . . . . . . 2.2 3.8 4.1 5.8 6.9 7.7 8.7 9.6 3.2Coal . . . . . . . . . . . . . . . . . . . . . . . 0.6 0.7 0.8 1.0 1.1 1.2 1.3 1.3 2.1Nuclear. . . . . . . . . . . . . . . . . . . . . 0.1 0.2 0.2 0.2 0.4 0.3 0.4 0.3 0.5Other . . . . . . . . . . . . . . . . . . . . . . 3.9 5.7 6.0 7.8 8.6 9.6 10.7 11.7 2.5
Total. . . . . . . . . . . . . . . . . . . . . . 14.5 21.3 21.9 27.1 29.8 32.2 35.1 37.5 2.0Total Non-OECD
Oil . . . . . . . . . . . . . . . . . . . . . . . . . 52.7 63.3 65.1 79.0 84.8 89.9 94.4 99.9 1.6Natural Gas . . . . . . . . . . . . . . . . . 38.0 44.7 47.2 61.1 69.4 77.6 86.1 94.8 2.6Coal . . . . . . . . . . . . . . . . . . . . . . . 45.9 51.8 54.8 76.4 86.7 94.2 101.9 110.1 2.6Nuclear. . . . . . . . . . . . . . . . . . . . . 3.1 4.0 4.2 5.5 7.0 8.7 10.0 10.6 3.5Other . . . . . . . . . . . . . . . . . . . . . . 10.3 14.6 15.2 23.0 24.9 26.4 28.6 30.8 2.6
Total. . . . . . . . . . . . . . . . . . . . . . 150.0 178.4 186.4 244.9 272.9 296.8 321.0 346.2 2.3
Total WorldOil . . . . . . . . . . . . . . . . . . . . . . . . . 136.1 158.7 162.1 180.5 188.3 194.7 201.1 209.4 1.0Natural Gas . . . . . . . . . . . . . . . . . 75.2 95.9 99.1 117.5 131.2 143.6 153.8 165.4 1.9Coal . . . . . . . . . . . . . . . . . . . . . . . 89.4 96.8 100.4 125.2 136.8 145.7 156.0 166.4 1.9Nuclear. . . . . . . . . . . . . . . . . . . . . 20.4 26.7 26.5 28.9 30.8 32.8 33.9 34.6 1.0Other . . . . . . . . . . . . . . . . . . . . . . 26.3 32.2 32.7 44.5 46.8 48.8 52.0 54.9 1.9
Total. . . . . . . . . . . . . . . . . . . . . . 347.3 410.3 420.7 496.5 533.9 565.5 596.8 630.6 1.5
Notes: Energy totals include net imports of coal coke and electricity generated from biomass in the United States. Totals may notequal sum of components due to independent rounding. The electricity portion of the national fuel consumption values consists ofgeneration for domestic use plus an adjustment for electricity trade based on a fuel’s share of total generation in the exporting coun-try.
Sources: History: Energy Information Administration (EIA), International Energy Annual 2003 (May-July 2005), web site www.eia.doe.gov/iea/. Projections: EIA, Annual Energy Outlook 2006, DOE/EIA-0383(2006) (Washington, DC, February 2006), AEO2006National Energy Modeling System, run LM2006.D113005A, web site www.eia.doe.gov/oiaf/aeo/; and System for the Analysis ofGlobal Energy Markets (2006).

Table C3. World Gross Domestic Product (GDP) by Region Using Purchasing Power Parity,Low Economic Growth Case, 1990-2030
Appendix C
120 Energy Information Administration / International Energy Outlook 2006
Region/Country
History Projections Average AnnualPercent Change,
2003-20301990 2002 2003 2010 2015 2020 2025 2030
OECDOECD North America . . . . . . . . . . . 8,477 11,968 12,273 14,931 16,825 19,183 21,262 23,864 2.5
United Statesa. . . . . . . . . . . . . . . . . 7,113 10,049 10,321 12,529 14,058 16,022 17,668 19,771 2.4Canada . . . . . . . . . . . . . . . . . . . . . . 684 957 977 1,161 1,279 1,379 1,463 1,550 1.7Mexico. . . . . . . . . . . . . . . . . . . . . . . 680 962 976 1,240 1,488 1,782 2,131 2,543 3.6
OECD Europe . . . . . . . . . . . . . . . . . 8,017 10,647 10,799 12,406 13,515 14,680 15,872 17,156 1.7OECD Asia . . . . . . . . . . . . . . . . . . . . 3,655 4,628 4,716 5,480 5,966 6,327 6,656 7,008 1.5
Japan . . . . . . . . . . . . . . . . . . . . . . . 2,898 3,329 3,375 3,764 3,991 4,121 4,214 4,311 0.9South Korea . . . . . . . . . . . . . . . . . . 330 663 683 943 1,125 1,272 1,416 1,573 3.1Australia/New Zealand . . . . . . . . . . 428 637 657 772 850 934 1,025 1,124 2.0Total OECD . . . . . . . . . . . . . . . . . 20,150 27,243 27,788 32,817 36,306 40,190 43,790 48,028 2.0
Non-OECDNon-OECD Europe and Eurasia. . . 3,387 2,672 2,878 4,056 4,726 5,400 6,071 6,770 3.2
Russia . . . . . . . . . . . . . . . . . . . . . . . 2,241 1,658 1,780 2,355 2,647 2,941 3,218 3,477 2.5Other . . . . . . . . . . . . . . . . . . . . . . . . 1,146 1,013 1,099 1,702 2,079 2,459 2,853 3,293 4.1
Non-OECD Asia. . . . . . . . . . . . . . . . 5,780 12,559 13,516 20,158 25,106 30,711 37,113 44,673 4.5China. . . . . . . . . . . . . . . . . . . . . . . . 1,807 5,494 5,994 9,653 12,320 15,284 18,687 22,736 5.1India . . . . . . . . . . . . . . . . . . . . . . . . 1,684 3,160 3,429 4,922 6,086 7,493 9,138 11,108 4.4Other Non-OECD Asia . . . . . . . . . . 2,289 3,905 4,093 5,583 6,701 7,934 9,287 10,829 3.7
Middle East . . . . . . . . . . . . . . . . . . . 810 1,295 1,357 1,855 2,158 2,477 2,822 3,209 3.2Africa . . . . . . . . . . . . . . . . . . . . . . . . 1,461 2,074 2,173 2,929 3,466 4,055 4,716 5,479 3.5Central and South America . . . . . . 2,174 3,011 3,075 3,941 4,499 5,106 5,779 6,536 2.8
Brazil . . . . . . . . . . . . . . . . . . . . . . . . 1,022 1,370 1,378 1,712 1,931 2,170 2,430 2,716 2.5Other Central and South America. . 1,153 1,641 1,697 2,229 2,568 2,936 3,349 3,820 3.1Total Non-OECD . . . . . . . . . . . . . 13,612 21,611 22,999 32,939 39,955 47,749 56,501 66,666 4.0
Total World . . . . . . . . . . . . . . . . . . . . 33,761 48,854 50,786 65,755 76,261 87,939 100,291 114,694 3.1aIncludes the 50 States and the District of Columbia.Notes: Totals may not equal sum of components due to independent rounding. GDP growth rates for China and India were
adjusted, based on the analyst’s judgment.Sources: History: Global Insight, Inc., World Overview (Lexington, MA, various issues). Projections: Global Insight, Inc., World
Overview, Fourth Quarter 2005 (Lexington, MA, January 2006); and Energy Information Administration, Annual Energy Outlook2006, DOE/EIA-0383(2006) (Washington DC, February 2006), Table B4.

Table C4. World Oil Consumption by Region, Low Economic Growth Case, 1990-2030(Million Barrels per Day)
Low Economic Growth Case Projections
Energy Information Administration / International Energy Outlook 2006 121
Region/Country
History Projections Average AnnualPercent Change,
2003-20301990 2002 2003 2010 2015 2020 2025 2030
OECDOECD North America . . . . . . . . . . . 20.5 23.8 24.3 26.2 27.1 28.2 28.9 30.1 0.8
United Statesa. . . . . . . . . . . . . . . . . 17.0 19.8 20.1 21.5 22.4 23.3 23.8 24.7 0.8Canada . . . . . . . . . . . . . . . . . . . . . . 1.7 2.1 2.2 2.4 2.4 2.4 2.4 2.6 0.6Mexico. . . . . . . . . . . . . . . . . . . . . . . 1.8 1.9 2.0 2.2 2.4 2.5 2.7 2.9 1.3
OECD Europe . . . . . . . . . . . . . . . . . 13.7 15.3 15.5 15.6 15.5 15.2 15.3 15.4 0.0OECD Asia . . . . . . . . . . . . . . . . . . . . 7.1 8.6 8.8 9.0 9.2 9.2 9.3 9.4 0.3
Japan . . . . . . . . . . . . . . . . . . . . . . . 5.2 5.5 5.6 5.4 5.4 5.2 5.2 5.1 -0.3South Korea . . . . . . . . . . . . . . . . . . 1.0 2.1 2.2 2.5 2.8 2.9 3.0 3.2 1.4Australia/New Zealand . . . . . . . . . . 0.8 1.0 1.0 1.1 1.1 1.1 1.1 1.2 0.5
Total OECD . . . . . . . . . . . . . . . . . 41.3 47.7 48.5 50.8 51.8 52.6 53.5 54.9 0.5
Non-OECDNon-OECD Europe and Eurasia. . . 9.3 4.8 4.9 5.2 5.5 5.7 5.8 6.0 0.8
Russia . . . . . . . . . . . . . . . . . . . . . . . 5.4 2.6 2.7 2.6 2.7 2.7 2.8 2.8 0.2Other . . . . . . . . . . . . . . . . . . . . . . . . 3.9 2.1 2.2 2.6 2.8 2.9 3.1 3.2 1.5
Non-OECD Asia. . . . . . . . . . . . . . . . 6.6 12.9 13.5 17.9 19.6 21.5 23.0 24.7 2.3China. . . . . . . . . . . . . . . . . . . . . . . . 2.3 5.2 5.6 8.4 9.3 10.4 11.3 12.4 3.0India . . . . . . . . . . . . . . . . . . . . . . . . 1.2 2.3 2.3 2.8 3.1 3.3 3.5 3.8 1.8Other Non-OECD Asia . . . . . . . . . . 3.1 5.5 5.6 6.6 7.2 7.8 8.1 8.6 1.6
Middle East . . . . . . . . . . . . . . . . . . . 3.5 5.1 5.3 5.8 6.1 6.2 6.3 6.4 0.7Africa . . . . . . . . . . . . . . . . . . . . . . . . 2.1 2.7 2.7 3.6 3.7 3.8 3.9 4.1 1.5Central and South America . . . . . . 3.8 5.3 5.3 5.9 6.3 6.5 6.8 7.2 1.2
Brazil . . . . . . . . . . . . . . . . . . . . . . . . 1.5 2.1 2.1 2.3 2.5 2.5 2.7 2.8 1.1Other Central and South America. . 2.3 3.1 3.2 3.6 3.8 4.0 4.1 4.3 1.2
Total Non-OECD . . . . . . . . . . . . . 25.3 30.7 31.6 38.3 41.2 43.6 45.8 48.5 1.6
Total World . . . . . . . . . . . . . . . . . . . . 66.6 78.5 80.1 89.1 93.0 96.2 99.3 103.4 0.9aIncludes the 50 States and the District of Columbia.Note: Totals may not equal sum of components due to independent rounding.Sources: History: Energy Information Administration (EIA), International Energy Annual 2003 (May-July 2005), web site www.eia.
doe.gov/iea/. Projections: EIA, Annual Energy Outlook 2006, DOE/EIA-0383(2006) (Washington, DC, February 2006), AEO2006National Energy Modeling System, run LM2006.D113005A, web site www.eia.doe.gov/oiaf/aeo/; and System for the Analysis ofGlobal Energy Markets (2006).

Table C5. World Natural Gas Consumption by Region, Low Economic Growth Case, 1990-2030(Trillion Cubic Feet)
Appendix C
122 Energy Information Administration / International Energy Outlook 2006
Region/Country
History Projections Average AnnualPercent Change,
2003-20301990 2002 2003 2010 2015 2020 2025 2030
OECDOECD North America . . . . . . . . . . . 22.5 27.6 27.4 28.9 31.4 33.1 33.8 34.2 0.8
United Statesa. . . . . . . . . . . . . . . . . 19.2 23.0 22.3 22.8 24.6 25.5 25.6 25.5 0.5Canada . . . . . . . . . . . . . . . . . . . . . . 2.4 3.1 3.2 4.0 4.2 4.5 4.7 4.7 1.4Mexico. . . . . . . . . . . . . . . . . . . . . . . 0.9 1.5 1.8 2.1 2.6 3.1 3.5 4.1 3.0
OECD Europe . . . . . . . . . . . . . . . . . 11.6 17.2 17.8 20.5 22.6 24.9 25.7 27.9 1.7OECD Asia . . . . . . . . . . . . . . . . . . . . 2.8 4.8 5.0 5.2 5.6 5.8 6.0 6.1 0.8
Japan . . . . . . . . . . . . . . . . . . . . . . . 1.9 2.9 3.1 3.1 3.3 3.3 3.3 3.3 0.3South Korea . . . . . . . . . . . . . . . . . . 0.1 0.8 0.9 1.0 1.1 1.2 1.3 1.3 1.6Australia/New Zealand . . . . . . . . . . 0.8 1.1 1.1 1.1 1.3 1.3 1.4 1.5 1.3
Total OECD . . . . . . . . . . . . . . . . . 36.8 49.6 50.2 54.5 59.7 63.8 65.5 68.2 1.1
Non-OECDNon-OECD Europe and Eurasia. . . 26.7 22.3 23.6 27.7 29.6 31.4 33.0 34.6 1.4
Russia . . . . . . . . . . . . . . . . . . . . . . . 17.3 14.6 15.3 17.6 18.2 19.1 19.6 19.9 1.0Other . . . . . . . . . . . . . . . . . . . . . . . . 9.5 7.8 8.3 10.1 11.4 12.4 13.4 14.7 2.1
Non-OECD Asia. . . . . . . . . . . . . . . . 2.9 6.9 7.5 11.2 13.8 16.6 19.8 23.0 4.2China. . . . . . . . . . . . . . . . . . . . . . . . 0.5 1.1 1.2 3.0 3.7 4.8 5.6 6.1 6.3India . . . . . . . . . . . . . . . . . . . . . . . . 0.4 0.9 1.0 1.3 1.6 2.0 2.4 3.0 4.4Other Non-OECD Asia . . . . . . . . . . 2.0 4.9 5.4 6.9 8.6 9.9 11.8 13.9 3.6
Middle East . . . . . . . . . . . . . . . . . . . 3.6 7.6 7.9 10.8 12.2 13.7 15.3 17.2 2.9Africa . . . . . . . . . . . . . . . . . . . . . . . . 1.4 2.4 2.6 3.3 4.3 5.1 5.9 6.7 3.7Central and South America . . . . . . 2.0 3.6 3.8 5.4 6.4 7.2 8.1 8.9 3.2
Brazil . . . . . . . . . . . . . . . . . . . . . . . . 0.1 0.5 0.5 0.9 1.0 1.1 1.2 1.4 3.8Other Central and South America. . 1.9 3.1 3.3 4.5 5.4 6.1 6.9 7.5 3.1
Total Non-OECD . . . . . . . . . . . . . 36.5 42.9 45.3 58.4 66.3 74.0 82.1 90.4 2.6
Total World . . . . . . . . . . . . . . . . . . . . 73.4 92.5 95.5 113.0 126.0 137.8 147.5 158.6 1.9aIncludes the 50 States and the District of Columbia.Note: Totals may not equal sum of components due to independent rounding.Sources: History: Energy Information Administration (EIA), International Energy Annual 2003 (May-July 2005), web site www.eia.
doe.gov/iea/. Projections: EIA, Annual Energy Outlook 2006, DOE/EIA-0383(2006) (Washington, DC, February 2006), AEO2006National Energy Modeling System, run LM2006.D113005A, web site www.eia.doe.gov/oiaf/aeo/; and System for the Analysis ofGlobal Energy Markets (2006).
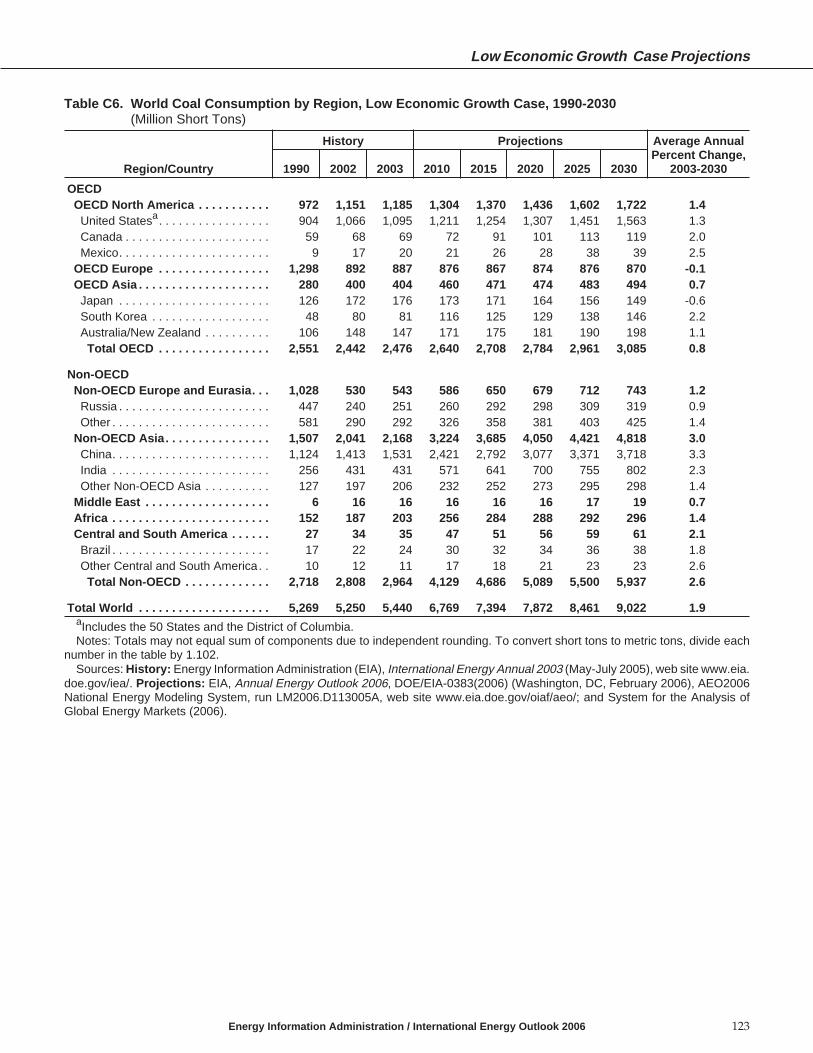
Table C6. World Coal Consumption by Region, Low Economic Growth Case, 1990-2030(Million Short Tons)
Low Economic Growth Case Projections
Energy Information Administration / International Energy Outlook 2006 123
Region/Country
History Projections Average AnnualPercent Change,
2003-20301990 2002 2003 2010 2015 2020 2025 2030
OECDOECD North America . . . . . . . . . . . 972 1,151 1,185 1,304 1,370 1,436 1,602 1,722 1.4
United Statesa. . . . . . . . . . . . . . . . . 904 1,066 1,095 1,211 1,254 1,307 1,451 1,563 1.3Canada . . . . . . . . . . . . . . . . . . . . . . 59 68 69 72 91 101 113 119 2.0Mexico. . . . . . . . . . . . . . . . . . . . . . . 9 17 20 21 26 28 38 39 2.5
OECD Europe . . . . . . . . . . . . . . . . . 1,298 892 887 876 867 874 876 870 -0.1OECD Asia . . . . . . . . . . . . . . . . . . . . 280 400 404 460 471 474 483 494 0.7
Japan . . . . . . . . . . . . . . . . . . . . . . . 126 172 176 173 171 164 156 149 -0.6South Korea . . . . . . . . . . . . . . . . . . 48 80 81 116 125 129 138 146 2.2Australia/New Zealand . . . . . . . . . . 106 148 147 171 175 181 190 198 1.1
Total OECD . . . . . . . . . . . . . . . . . 2,551 2,442 2,476 2,640 2,708 2,784 2,961 3,085 0.8
Non-OECDNon-OECD Europe and Eurasia. . . 1,028 530 543 586 650 679 712 743 1.2
Russia . . . . . . . . . . . . . . . . . . . . . . . 447 240 251 260 292 298 309 319 0.9Other . . . . . . . . . . . . . . . . . . . . . . . . 581 290 292 326 358 381 403 425 1.4
Non-OECD Asia. . . . . . . . . . . . . . . . 1,507 2,041 2,168 3,224 3,685 4,050 4,421 4,818 3.0China. . . . . . . . . . . . . . . . . . . . . . . . 1,124 1,413 1,531 2,421 2,792 3,077 3,371 3,718 3.3India . . . . . . . . . . . . . . . . . . . . . . . . 256 431 431 571 641 700 755 802 2.3Other Non-OECD Asia . . . . . . . . . . 127 197 206 232 252 273 295 298 1.4
Middle East . . . . . . . . . . . . . . . . . . . 6 16 16 16 16 16 17 19 0.7Africa . . . . . . . . . . . . . . . . . . . . . . . . 152 187 203 256 284 288 292 296 1.4Central and South America . . . . . . 27 34 35 47 51 56 59 61 2.1
Brazil . . . . . . . . . . . . . . . . . . . . . . . . 17 22 24 30 32 34 36 38 1.8Other Central and South America. . 10 12 11 17 18 21 23 23 2.6
Total Non-OECD . . . . . . . . . . . . . 2,718 2,808 2,964 4,129 4,686 5,089 5,500 5,937 2.6
Total World . . . . . . . . . . . . . . . . . . . . 5,269 5,250 5,440 6,769 7,394 7,872 8,461 9,022 1.9aIncludes the 50 States and the District of Columbia.Notes: Totals may not equal sum of components due to independent rounding. To convert short tons to metric tons, divide each
number in the table by 1.102.Sources: History: Energy Information Administration (EIA), International Energy Annual 2003 (May-July 2005), web site www.eia.
doe.gov/iea/. Projections: EIA, Annual Energy Outlook 2006, DOE/EIA-0383(2006) (Washington, DC, February 2006), AEO2006National Energy Modeling System, run LM2006.D113005A, web site www.eia.doe.gov/oiaf/aeo/; and System for the Analysis ofGlobal Energy Markets (2006).

Table C7. World Nuclear Energy Consumption by Region, Low Economic Growth Case, 1990-2030(Billion Kilowatthours)
Appendix C
124 Energy Information Administration / International Energy Outlook 2006
Region/Country
History Projections Average AnnualPercent Change,
2003-20301990 2002 2003 2010 2015 2020 2025 2030
OECDOECD North America . . . . . . . . . . . 649 861 844 923 930 980 975 975 0.5
United Statesa. . . . . . . . . . . . . . . . . 577 780 764 809 807 856 856 856 0.4Canada . . . . . . . . . . . . . . . . . . . . . . 69 72 71 104 113 113 108 108 1.6Mexico. . . . . . . . . . . . . . . . . . . . . . . 3 9 10 11 11 11 11 11 0.2
OECD Europe . . . . . . . . . . . . . . . . . 743 923 930 896 877 807 748 707 -1.0OECD Asia . . . . . . . . . . . . . . . . . . . . 242 393 360 416 464 518 567 610 2.0
Japan . . . . . . . . . . . . . . . . . . . . . . . 192 280 237 274 289 318 350 371 1.7South Korea . . . . . . . . . . . . . . . . . . 50 113 123 142 175 200 217 239 2.5Australia/New Zealand . . . . . . . . . . 0 0 0 0 0 0 0 0 —
Total OECD . . . . . . . . . . . . . . . . . 1,635 2,178 2,135 2,234 2,271 2,305 2,290 2,292 0.3
Non-OECDNon-OECD Europe and Eurasia. . . 219 254 258 278 323 393 441 443 2.0
Russia . . . . . . . . . . . . . . . . . . . . . . . 115 134 138 151 190 233 286 321 3.2Other . . . . . . . . . . . . . . . . . . . . . . . . 104 120 120 127 133 160 155 122 0.1
Non-OECD Asia. . . . . . . . . . . . . . . . 38 83 97 187 268 356 434 504 6.3China. . . . . . . . . . . . . . . . . . . . . . . . 0 25 42 79 130 171 230 304 7.6India . . . . . . . . . . . . . . . . . . . . . . . . 6 18 16 56 76 99 106 112 7.4Other Non-OECD Asia . . . . . . . . . . 32 40 39 52 62 85 98 89 3.1
Middle East . . . . . . . . . . . . . . . . . . . 0 0 0 6 6 6 6 6 —Africa . . . . . . . . . . . . . . . . . . . . . . . . 8 12 13 14 15 15 15 15 0.7Central and South America . . . . . . 9 19 20 21 35 32 33 24 0.6
Brazil . . . . . . . . . . . . . . . . . . . . . . . . 2 14 13 13 22 23 23 19 1.2Other Central and South America. . 7 5 7 7 12 10 10 5 -1.1
Total Non-OECD . . . . . . . . . . . . . 274 368 388 505 647 802 929 993 3.5
Total World . . . . . . . . . . . . . . . . . . . . 1,909 2,546 2,523 2,739 2,918 3,108 3,218 3,285 1.0aIncludes the 50 States and the District of Columbia.Note: Totals may not equal sum of components due to independent rounding.Sources: History: Energy Information Administration (EIA), International Energy Annual 2003 (May-July 2005), web site www.eia.
doe.gov/iea/. Projections: EIA, Annual Energy Outlook 2006, DOE/EIA-0383(2006) (Washington, DC, February 2006), AEO2006National Energy Modeling System, run LM2006.D113005A, web site www.eia.doe.gov/oiaf/aeo/; and System for the Analysis ofGlobal Energy Markets (2006).

Table C8. World Consumption of Hydroelectricity and Other Renewable Energy by Region,Low Economic Growth Case, 1990-2030(Quadrillion Btu)
Low Economic Growth Case Projections
Energy Information Administration / International Energy Outlook 2006 125
Region/Country
History Projections Average AnnualPercent Change,
2003-20301990 2002 2003 2010 2015 2020 2025 2030
OECDOECD North America . . . . . . . . . . . 9.5 9.8 9.5 11.4 11.7 12.1 12.8 13.3 1.2
United Statesa. . . . . . . . . . . . . . . . . 6.1 5.9 5.7 7.0 7.2 7.6 8.1 8.4 1.4Canada . . . . . . . . . . . . . . . . . . . . . . 3.1 3.6 3.5 3.7 3.8 3.7 3.9 4.1 0.6Mexico. . . . . . . . . . . . . . . . . . . . . . . 0.3 0.4 0.3 0.6 0.7 0.8 0.8 0.9 3.8
OECD Europe . . . . . . . . . . . . . . . . . 4.8 6.1 6.0 7.9 8.0 8.0 8.4 8.4 1.3OECD Asia . . . . . . . . . . . . . . . . . . . . 1.6 1.7 1.9 2.1 2.3 2.3 2.3 2.3 0.7
Japan . . . . . . . . . . . . . . . . . . . . . . . 1.1 1.1 1.4 1.4 1.4 1.4 1.4 1.4 0.0South Korea . . . . . . . . . . . . . . . . . . 0.0 0.0 0.1 0.2 0.3 0.3 0.3 0.3 6.6Australia/New Zealand . . . . . . . . . . 0.4 0.5 0.5 0.6 0.6 0.6 0.6 0.6 0.8
Total OECD . . . . . . . . . . . . . . . . . 15.9 17.6 17.4 21.5 21.9 22.4 23.4 24.1 1.2
Non-OECDNon-OECD Europe and Eurasia. . . 2.8 3.0 3.0 3.7 3.9 3.9 3.9 3.9 1.0
Russia . . . . . . . . . . . . . . . . . . . . . . . 1.8 1.9 1.8 2.2 2.3 2.3 2.3 2.3 0.9Other . . . . . . . . . . . . . . . . . . . . . . . . 1.0 1.1 1.2 1.6 1.6 1.6 1.6 1.7 1.2
Non-OECD Asia. . . . . . . . . . . . . . . . 3.0 4.9 5.1 9.8 10.8 11.2 12.2 13.4 3.6China. . . . . . . . . . . . . . . . . . . . . . . . 1.3 2.8 2.9 6.2 6.8 7.1 7.3 7.6 3.7India . . . . . . . . . . . . . . . . . . . . . . . . 0.7 0.7 0.7 1.3 1.4 1.4 1.5 1.8 3.2Other Non-OECD Asia . . . . . . . . . . 0.9 1.4 1.5 2.4 2.6 2.7 3.4 4.0 3.8
Middle East . . . . . . . . . . . . . . . . . . . 0.1 0.2 0.2 0.6 0.6 0.7 0.7 0.7 4.0Africa . . . . . . . . . . . . . . . . . . . . . . . . 0.6 0.9 0.9 1.1 1.1 1.1 1.1 1.1 0.9Central and South America . . . . . . 3.9 5.7 6.0 7.8 8.6 9.6 10.7 11.7 2.5
Brazil . . . . . . . . . . . . . . . . . . . . . . . . 2.2 3.0 3.3 4.0 4.6 5.1 5.7 6.2 2.4Other Central and South America. . 1.7 2.7 2.8 3.8 4.0 4.5 5.0 5.4 2.5
Total Non-OECD . . . . . . . . . . . . . 10.3 14.6 15.2 23.0 24.9 26.4 28.6 30.8 2.6
Total World . . . . . . . . . . . . . . . . . . . . 26.3 32.2 32.7 44.5 46.8 48.8 52.0 54.9 1.9aIncludes the 50 States and the District of Columbia.Notes: Totals may not equal sum of components due to independent rounding. U.S. totals include net electricity imports, methanol,
and liquid hydrogen.Sources: History: Energy Information Administration (EIA), International Energy Annual 2003 (May-July 2005), web site www.eia.
doe.gov/iea/. Projections: EIA, Annual Energy Outlook 2006, DOE/EIA-0383(2006) (Washington, DC, February 2006), AEO2006National Energy Modeling System, run LM2006.D113005A, web site www.eia.doe.gov/oiaf/aeo/; and System for the Analysis ofGlobal Energy Markets (2006).

Table C9. World Net Electricity Consumption by Region, Low Economic Growth Case, 1990-2030(Billion Kilowatthours)
Appendix C
126 Energy Information Administration / International Energy Outlook 2006
Region/Country
History Projections Average AnnualPercent Change,
2003-20301990 2002 2003 2010 2015 2020 2025 2030
OECDOECD North America . . . . . . . . . . . 3,379 4,337 4,384 4,953 5,298 5,639 5,955 6,294 1.3
United Statesa. . . . . . . . . . . . . . . . . 2,837 3,629 3,669 4,084 4,334 4,585 4,820 5,080 1.2Canada . . . . . . . . . . . . . . . . . . . . . . 435 518 521 594 637 670 691 712 1.2Mexico. . . . . . . . . . . . . . . . . . . . . . . 107 190 194 276 326 384 444 502 3.6
OECD Europe . . . . . . . . . . . . . . . . . 2,355 2,916 2,965 3,289 3,407 3,520 3,641 3,779 0.9OECD Asia . . . . . . . . . . . . . . . . . . . . 1,024 1,463 1,487 1,718 1,805 1,856 1,904 1,956 1.0
Japan . . . . . . . . . . . . . . . . . . . . . . . 764 964 946 1,036 1,057 1,059 1,061 1,064 0.4South Korea . . . . . . . . . . . . . . . . . . 93 268 303 416 467 502 534 566 2.3Australia/New Zealand . . . . . . . . . . 166 231 238 266 281 294 309 325 1.2
Total OECD . . . . . . . . . . . . . . . . . 6,758 8,715 8,836 9,961 10,509 11,014 11,500 12,028 1.1
Non-OECDNon-OECD Europe and Eurasia. . . 1,672 1,318 1,350 1,753 1,936 2,088 2,196 2,283 2.0
Russia . . . . . . . . . . . . . . . . . . . . . . . 955 796 812 1,027 1,115 1,194 1,244 1,279 1.7Other . . . . . . . . . . . . . . . . . . . . . . . . 717 522 539 725 821 893 951 1,004 2.3
Non-OECD Asia. . . . . . . . . . . . . . . . 1,150 2,655 2,917 4,503 5,385 6,237 7,092 8,006 3.8China. . . . . . . . . . . . . . . . . . . . . . . . 551 1,452 1,671 2,661 3,208 3,724 4,238 4,794 4.0India . . . . . . . . . . . . . . . . . . . . . . . . 257 525 519 811 962 1,112 1,263 1,427 3.8Other Non-OECD Asia . . . . . . . . . . 342 678 726 1,032 1,214 1,401 1,592 1,785 3.4
Middle East . . . . . . . . . . . . . . . . . . . 214 457 471 656 727 784 831 873 2.3Africa . . . . . . . . . . . . . . . . . . . . . . . . 286 420 436 534 601 653 703 754 2.1Central and South America . . . . . . 463 736 772 1,071 1,222 1,355 1,484 1,605 2.8
Brazil . . . . . . . . . . . . . . . . . . . . . . . . 229 353 371 500 563 619 672 723 2.5Other Central and South America. . 234 383 400 572 659 736 812 883 3.0
Total Non-OECD . . . . . . . . . . . . . 3,785 5,586 5,944 8,518 9,871 11,117 12,307 13,522 3.1
Total World . . . . . . . . . . . . . . . . . . . . 10,543 14,301 14,781 18,479 20,380 22,131 23,807 25,551 2.0aIncludes the 50 States and the District of Columbia.Note: Totals may not equal sum of components due to independent rounding.Sources: History: Energy Information Administration (EIA), International Energy Annual 2003 (May-July 2005), web site www.eia.
doe.gov/iea/. Projections: EIA, Annual Energy Outlook 2006, DOE/EIA-0383(2006) (Washington, DC, February 2006), AEO2006National Energy Modeling System, run LM2006.D113005A, web site www.eia.doe.gov/oiaf/aeo/; and System for the Analysis ofGlobal Energy Markets (2006).

Table C10. World Carbon Dioxide Emissions by Region, Low Economic Growth Case, 1990-2030(Million Metric Tons Carbon Dioxide)
Low Economic Growth Case Projections
Energy Information Administration / International Energy Outlook 2006 127
Region/Country
History Projections Average AnnualPercent Change,
2003-20301990 2002 2003 2010 2015 2020 2025 2030
OECDOECD North America . . . . . . . . . . . 5,753 6,687 6,797 7,339 7,702 8,036 8,412 8,793 1.0
United Statesa. . . . . . . . . . . . . . . . . 4,978 5,748 5,796 6,219 6,476 6,720 6,991 7,284 0.9Canada . . . . . . . . . . . . . . . . . . . . . . 474 570 596 673 722 760 799 825 1.2Mexico. . . . . . . . . . . . . . . . . . . . . . . 300 369 405 446 503 555 622 684 2.0
OECD Europe . . . . . . . . . . . . . . . . . 4,089 4,203 4,264 4,409 4,498 4,584 4,646 4,767 0.4OECD Asia . . . . . . . . . . . . . . . . . . . . 1,536 2,063 2,090 2,230 2,300 2,317 2,347 2,388 0.5
Japan . . . . . . . . . . . . . . . . . . . . . . . 1,011 1,191 1,206 1,178 1,182 1,151 1,125 1,109 -0.3South Korea . . . . . . . . . . . . . . . . . . 234 462 470 594 644 673 709 746 1.7Australia/New Zealand . . . . . . . . . . 291 410 415 458 474 493 513 534 0.9
Total OECD . . . . . . . . . . . . . . . . . 11,378 12,952 13,150 13,977 14,499 14,937 15,405 15,948 0.7
Non-OECDNon-OECD Europe and Eurasia. . . 4,193 2,634 2,725 3,015 3,248 3,408 3,564 3,717 1.2
Russia . . . . . . . . . . . . . . . . . . . . . . . 2,334 1,546 1,606 1,742 1,839 1,900 1,951 1,989 0.8Other . . . . . . . . . . . . . . . . . . . . . . . . 1,859 1,088 1,118 1,273 1,409 1,508 1,612 1,728 1.6
Non-OECD Asia. . . . . . . . . . . . . . . . 3,626 5,733 6,072 8,737 9,926 10,987 12,016 13,135 2.9China. . . . . . . . . . . . . . . . . . . . . . . . 2,241 3,273 3,541 5,614 6,442 7,164 7,862 8,652 3.4India . . . . . . . . . . . . . . . . . . . . . . . . 578 1,011 1,023 1,331 1,484 1,625 1,766 1,903 2.3Other Non-OECD Asia . . . . . . . . . . 807 1,449 1,508 1,792 2,001 2,198 2,389 2,580 2.0
Middle East . . . . . . . . . . . . . . . . . . . 704 1,152 1,182 1,418 1,531 1,629 1,727 1,859 1.7Africa . . . . . . . . . . . . . . . . . . . . . . . . 649 850 893 1,149 1,285 1,346 1,410 1,492 1.9Central and South America . . . . . . 673 993 1,006 1,214 1,325 1,409 1,516 1,610 1.8
Brazil . . . . . . . . . . . . . . . . . . . . . . . . 220 347 348 409 437 457 487 517 1.5Other Central and South America. . 453 645 659 805 888 952 1,029 1,093 1.9
Total Non-OECD . . . . . . . . . . . . . 9,846 11,362 11,878 15,533 17,316 18,780 20,233 21,813 2.3
Total World . . . . . . . . . . . . . . . . . . . . 21,223 24,314 25,028 29,511 31,815 33,716 35,639 37,761 1.5aIncludes the 50 States and the District of Columbia.Note: The U.S. numbers include carbon dioxide emissions attributable to renewable energy sources.Sources: History: Energy Information Administration (EIA), International Energy Annual 2003 (May-July 2005), web site www.eia.
doe.gov/iea/. Projections: EIA, Annual Energy Outlook 2006, DOE/EIA-0383(2006) (Washington, DC, February 2006), AEO2006National Energy Modeling System, run LM2006.D113005A, web site www.eia.doe.gov/oiaf/aeo/; and System for the Analysis ofGlobal Energy Markets (2006).

Table C11. World Carbon Dioxide Emissions from Oil Use by Region, Low Economic Growth Case,1990-2030(Million Metric Tons Carbon Dioxide)
Appendix C
128 Energy Information Administration / International Energy Outlook 2006
Region/Country
History Projections Average AnnualPercent Change,
2003-20301990 2002 2003 2010 2015 2020 2025 2030
OECDOECD North America . . . . . . . . . . . 2,636 2,969 3,034 3,264 3,376 3,506 3,610 3,766 0.8
United Statesa. . . . . . . . . . . . . . . . . 2,181 2,456 2,498 2,674 2,768 2,880 2,957 3,072 0.8Canada . . . . . . . . . . . . . . . . . . . . . . 224 262 276 305 303 301 306 322 0.6Mexico. . . . . . . . . . . . . . . . . . . . . . . 231 250 260 285 304 324 347 372 1.3
OECD Europe . . . . . . . . . . . . . . . . . 1,864 2,069 2,094 2,110 2,095 2,050 2,063 2,075 0.0OECD Asia . . . . . . . . . . . . . . . . . . . . 913 1,035 1,052 1,073 1,099 1,102 1,111 1,127 0.3
Japan . . . . . . . . . . . . . . . . . . . . . . . 663 654 667 642 641 625 616 611 -0.3South Korea . . . . . . . . . . . . . . . . . . 140 244 246 287 312 326 342 358 1.4Australia/New Zealand . . . . . . . . . . 110 137 138 144 146 151 153 157 0.5
Total OECD . . . . . . . . . . . . . . . . . 5,412 6,073 6,180 6,448 6,569 6,658 6,784 6,968 0.4
Non-OECDNon-OECD Europe and Eurasia. . . 1,350 657 669 716 758 782 809 838 0.8
Russia . . . . . . . . . . . . . . . . . . . . . . . 782 351 356 350 361 366 372 376 0.2Other . . . . . . . . . . . . . . . . . . . . . . . . 568 306 312 366 397 416 437 462 1.5
Non-OECD Asia. . . . . . . . . . . . . . . . 949 1,775 1,853 2,447 2,682 2,942 3,140 3,380 2.3China. . . . . . . . . . . . . . . . . . . . . . . . 325 686 737 1,113 1,235 1,381 1,505 1,644 3.0India . . . . . . . . . . . . . . . . . . . . . . . . 160 298 305 375 407 435 467 496 1.8Other Non-OECD Asia . . . . . . . . . . 464 791 810 959 1,039 1,126 1,168 1,240 1.6
Middle East . . . . . . . . . . . . . . . . . . . 492 695 714 784 820 836 846 870 0.7Africa . . . . . . . . . . . . . . . . . . . . . . . . 298 372 379 498 524 532 545 571 1.5Central and South America . . . . . . 503 721 719 812 860 890 937 983 1.2
Brazil . . . . . . . . . . . . . . . . . . . . . . . . 180 280 276 304 322 334 356 372 1.1Other Central and South America. . 323 441 443 508 538 557 581 611 1.2
Total Non-OECD . . . . . . . . . . . . . 3,592 4,219 4,333 5,257 5,643 5,982 6,277 6,641 1.6
Total World . . . . . . . . . . . . . . . . . . . . 9,005 10,291 10,513 11,705 12,212 12,640 13,061 13,609 1.0aIncludes the 50 States and the District of Columbia.Sources: History: Energy Information Administration (EIA), International Energy Annual 2003 (May-July 2005), web site www.eia.
doe.gov/iea/. Projections: EIA, Annual Energy Outlook 2006, DOE/EIA-0383(2006) (Washington, DC, February 2006), AEO2006National Energy Modeling System, run LM2006.D113005A, web site www.eia.doe.gov/oiaf/aeo/; and System for the Analysis ofGlobal Energy Markets (2006).
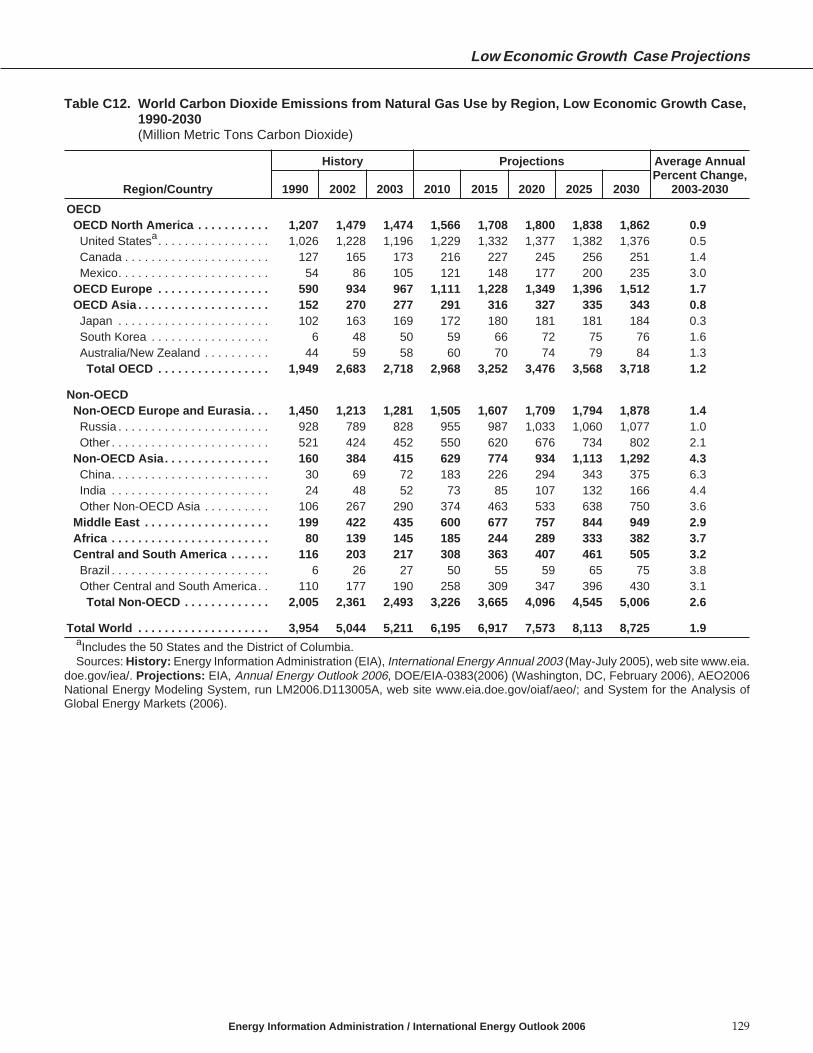
Table C12. World Carbon Dioxide Emissions from Natural Gas Use by Region, Low Economic Growth Case,1990-2030(Million Metric Tons Carbon Dioxide)
Low Economic Growth Case Projections
Energy Information Administration / International Energy Outlook 2006 129
Region/Country
History Projections Average AnnualPercent Change,
2003-20301990 2002 2003 2010 2015 2020 2025 2030
OECDOECD North America . . . . . . . . . . . 1,207 1,479 1,474 1,566 1,708 1,800 1,838 1,862 0.9
United Statesa. . . . . . . . . . . . . . . . . 1,026 1,228 1,196 1,229 1,332 1,377 1,382 1,376 0.5Canada . . . . . . . . . . . . . . . . . . . . . . 127 165 173 216 227 245 256 251 1.4Mexico. . . . . . . . . . . . . . . . . . . . . . . 54 86 105 121 148 177 200 235 3.0
OECD Europe . . . . . . . . . . . . . . . . . 590 934 967 1,111 1,228 1,349 1,396 1,512 1.7OECD Asia . . . . . . . . . . . . . . . . . . . . 152 270 277 291 316 327 335 343 0.8
Japan . . . . . . . . . . . . . . . . . . . . . . . 102 163 169 172 180 181 181 184 0.3South Korea . . . . . . . . . . . . . . . . . . 6 48 50 59 66 72 75 76 1.6Australia/New Zealand . . . . . . . . . . 44 59 58 60 70 74 79 84 1.3
Total OECD . . . . . . . . . . . . . . . . . 1,949 2,683 2,718 2,968 3,252 3,476 3,568 3,718 1.2
Non-OECDNon-OECD Europe and Eurasia. . . 1,450 1,213 1,281 1,505 1,607 1,709 1,794 1,878 1.4
Russia . . . . . . . . . . . . . . . . . . . . . . . 928 789 828 955 987 1,033 1,060 1,077 1.0Other . . . . . . . . . . . . . . . . . . . . . . . . 521 424 452 550 620 676 734 802 2.1
Non-OECD Asia. . . . . . . . . . . . . . . . 160 384 415 629 774 934 1,113 1,292 4.3China. . . . . . . . . . . . . . . . . . . . . . . . 30 69 72 183 226 294 343 375 6.3India . . . . . . . . . . . . . . . . . . . . . . . . 24 48 52 73 85 107 132 166 4.4Other Non-OECD Asia . . . . . . . . . . 106 267 290 374 463 533 638 750 3.6
Middle East . . . . . . . . . . . . . . . . . . . 199 422 435 600 677 757 844 949 2.9Africa . . . . . . . . . . . . . . . . . . . . . . . . 80 139 145 185 244 289 333 382 3.7Central and South America . . . . . . 116 203 217 308 363 407 461 505 3.2
Brazil . . . . . . . . . . . . . . . . . . . . . . . . 6 26 27 50 55 59 65 75 3.8Other Central and South America. . 110 177 190 258 309 347 396 430 3.1
Total Non-OECD . . . . . . . . . . . . . 2,005 2,361 2,493 3,226 3,665 4,096 4,545 5,006 2.6
Total World . . . . . . . . . . . . . . . . . . . . 3,954 5,044 5,211 6,195 6,917 7,573 8,113 8,725 1.9aIncludes the 50 States and the District of Columbia.Sources: History: Energy Information Administration (EIA), International Energy Annual 2003 (May-July 2005), web site www.eia.
doe.gov/iea/. Projections: EIA, Annual Energy Outlook 2006, DOE/EIA-0383(2006) (Washington, DC, February 2006), AEO2006National Energy Modeling System, run LM2006.D113005A, web site www.eia.doe.gov/oiaf/aeo/; and System for the Analysis ofGlobal Energy Markets (2006).

Table C13. World Carbon Dioxide Emissions from Coal Use by Region, Low Economic Growth Case,1990-2025(Million Metric Tons Carbon Dioxide)
Appendix C
130 Energy Information Administration / International Energy Outlook 2006
Region/Country
History Projections Average AnnualPercent Change,
2003-20301990 2002 2003 2010 2015 2020 2025 2030
OECDOECD North America . . . . . . . . . . . 1,910 2,239 2,287 2,496 2,605 2,717 2,950 3,149 1.2
United Statesa. . . . . . . . . . . . . . . . . 1,772 2,064 2,100 2,303 2,363 2,449 2,637 2,821 1.1Canada . . . . . . . . . . . . . . . . . . . . . . 123 143 147 153 192 213 238 252 2.0Mexico. . . . . . . . . . . . . . . . . . . . . . . 15 32 40 40 50 55 75 77 2.5
OECD Europe . . . . . . . . . . . . . . . . . 1,635 1,199 1,203 1,187 1,175 1,184 1,187 1,179 -0.1OECD Asia . . . . . . . . . . . . . . . . . . . . 471 758 761 865 884 887 902 918 0.7
Japan . . . . . . . . . . . . . . . . . . . . . . . 245 375 369 364 360 345 328 314 -0.6South Korea . . . . . . . . . . . . . . . . . . 88 170 173 248 265 274 293 311 2.2Australia/New Zealand . . . . . . . . . . 137 213 218 254 259 268 281 293 1.1
Total OECD . . . . . . . . . . . . . . . . . 4,016 4,196 4,251 4,548 4,665 4,788 5,038 5,247 0.8
Non-OECDNon-OECD Europe and Eurasia. . . 1,393 764 775 794 883 918 960 1,001 1.0
Russia . . . . . . . . . . . . . . . . . . . . . . . 624 406 422 437 492 501 519 536 0.9Other . . . . . . . . . . . . . . . . . . . . . . . . 770 359 353 357 391 416 441 465 1.0
Non-OECD Asia. . . . . . . . . . . . . . . . 2,517 3,574 3,805 5,661 6,471 7,111 7,764 8,462 3.0China. . . . . . . . . . . . . . . . . . . . . . . . 1,886 2,518 2,731 4,318 4,981 5,489 6,014 6,632 3.3India . . . . . . . . . . . . . . . . . . . . . . . . 394 665 666 883 992 1,083 1,167 1,240 2.3Other Non-OECD Asia . . . . . . . . . . 237 391 408 459 498 539 583 590 1.4
Middle East . . . . . . . . . . . . . . . . . . . 14 35 33 34 35 35 37 40 0.7Africa . . . . . . . . . . . . . . . . . . . . . . . . 271 339 369 467 517 525 532 539 1.4Central and South America . . . . . . 54 69 70 94 101 112 118 122 2.1
Brazil . . . . . . . . . . . . . . . . . . . . . . . . 34 41 44 55 60 64 66 71 1.8Other Central and South America. . 20 28 25 39 42 48 52 51 2.6
Total Non-OECD . . . . . . . . . . . . . 4,248 4,782 5,052 7,050 8,008 8,702 9,412 10,165 2.6
Total World . . . . . . . . . . . . . . . . . . . . 8,264 8,978 9,303 11,598 12,672 13,489 14,450 15,412 1.9aIncludes the 50 States and the District of Columbia.Sources: History: Energy Information Administration (EIA), International Energy Annual 2003 (May-July 2005), web site www.eia.
doe.gov/iea/. Projections: EIA, Annual Energy Outlook 2006, DOE/EIA-0383(2006) (Washington, DC, February 2006), AEO2006National Energy Modeling System, run LM2006.D113005A, web site www.eia.doe.gov/oiaf/aeo/; and System for the Analysis ofGlobal Energy Markets (2006).

Appendix D
Reference Case Projectionsby End-Use Sector and Region


Table D1. Total World Delivered Energy Consumption by End-Use Sector and Fuel, 2003-2030(Quadrillion Btu)
Reference Case Projections by End-Use Sector and Region
Energy Information Administration / International Energy Outlook 2006 133
Sector/Fuel 2003
Projections Average AnnualPercent Change,
2003-20302010 2015 2020 2025 2030Residential
Oil . . . . . . . . . . . . . . . . . . . . . . . . . . . . . 10.6 12.3 12.8 13.1 13.4 13.7 1.0Natural Gas . . . . . . . . . . . . . . . . . . . . . . 18.0 19.7 20.8 21.8 22.8 23.9 1.1Coal . . . . . . . . . . . . . . . . . . . . . . . . . . . . 2.8 4.3 4.3 4.1 3.9 3.9 1.3Electricity . . . . . . . . . . . . . . . . . . . . . . . . 13.8 18.9 21.7 24.3 27.2 30.4 3.0Heat . . . . . . . . . . . . . . . . . . . . . . . . . . . . 4.5 5.5 5.6 5.5 5.5 5.4 0.7Renewables. . . . . . . . . . . . . . . . . . . . . . 0.6 0.7 0.8 0.8 0.8 0.9 1.7
Total . . . . . . . . . . . . . . . . . . . . . . . . . . 50.1 61.5 65.9 69.5 73.7 78.1 1.7Commercial
Oil . . . . . . . . . . . . . . . . . . . . . . . . . . . . . 5.0 5.2 5.5 5.7 5.9 6.1 0.7Natural Gas . . . . . . . . . . . . . . . . . . . . . . 6.7 6.8 7.3 7.7 8.1 8.5 0.9Coal . . . . . . . . . . . . . . . . . . . . . . . . . . . . 0.6 0.9 0.9 1.0 1.0 1.0 1.8Electricity . . . . . . . . . . . . . . . . . . . . . . . . 11.3 14.6 16.6 18.5 20.5 22.6 2.6Heat . . . . . . . . . . . . . . . . . . . . . . . . . . . . 0.7 0.8 0.8 0.7 0.7 0.7 -0.2Renewables. . . . . . . . . . . . . . . . . . . . . . 0.1 0.1 0.1 0.2 0.2 0.2 2.1
Total . . . . . . . . . . . . . . . . . . . . . . . . . . 24.4 28.4 31.2 33.8 36.3 39.0 1.8Industrial
Oil . . . . . . . . . . . . . . . . . . . . . . . . . . . . . 52.8 61.1 67.2 72.8 77.8 82.6 1.7Natural Gas . . . . . . . . . . . . . . . . . . . . . . 43.1 55.7 64.2 72.8 81.3 90.5 2.8Coal . . . . . . . . . . . . . . . . . . . . . . . . . . . . 29.9 39.9 46.8 53.3 60.2 67.6 3.1Electricity . . . . . . . . . . . . . . . . . . . . . . . . 24.0 29.9 34.2 38.6 43.0 47.8 2.6Heat . . . . . . . . . . . . . . . . . . . . . . . . . . . . 5.4 4.5 5.2 5.9 6.9 7.6 1.3Renewables. . . . . . . . . . . . . . . . . . . . . . 1.9 2.1 2.2 2.3 2.4 2.6 1.2
Total . . . . . . . . . . . . . . . . . . . . . . . . . . 157.1 193.2 219.7 245.8 271.7 298.5 2.4Transportation
Oil . . . . . . . . . . . . . . . . . . . . . . . . . . . . . 83.5 94.3 100.2 105.1 112.5 121.4 1.4Natural Gas . . . . . . . . . . . . . . . . . . . . . . 0.9 0.9 1.0 1.1 1.1 1.2 1.0Coal . . . . . . . . . . . . . . . . . . . . . . . . . . . . 0.2 0.3 0.3 0.2 0.2 0.1 -1.7Electricity . . . . . . . . . . . . . . . . . . . . . . . . 0.8 0.9 1.0 1.0 1.0 1.1 0.9Renewables. . . . . . . . . . . . . . . . . . . . . . 0.5 0.8 1.0 1.1 1.2 1.2 3.6
Total . . . . . . . . . . . . . . . . . . . . . . . . . . 85.9 97.2 103.5 108.6 116.0 125.0 1.4All End-Use Sectors
Oil . . . . . . . . . . . . . . . . . . . . . . . . . . . . . 151.9 173.0 185.7 196.7 209.6 223.8 1.4Natural Gas . . . . . . . . . . . . . . . . . . . . . . 68.7 83.0 93.4 103.4 113.4 124.1 2.2Coal . . . . . . . . . . . . . . . . . . . . . . . . . . . . 33.5 45.3 52.2 58.6 65.3 72.5 2.9Electricity . . . . . . . . . . . . . . . . . . . . . . . . 49.9 64.4 73.4 82.4 91.7 101.8 2.7Heat . . . . . . . . . . . . . . . . . . . . . . . . . . . . 10.6 10.8 11.5 12.1 13.1 13.7 0.9Renewables. . . . . . . . . . . . . . . . . . . . . . 3.0 3.8 4.1 4.4 4.6 4.8 1.8
Delivered Energy . . . . . . . . . . . . . . . 317.5 380.3 420.3 457.7 497.7 540.7 2.0Electricity-Related Losses . . . . . . . . . . . 103.2 129.3 143.0 155.4 167.8 180.9 2.1
Total . . . . . . . . . . . . . . . . . . . . . . . . . . 420.8 509.7 563.4 613.0 665.4 721.6 2.0Electric Power a
Oil . . . . . . . . . . . . . . . . . . . . . . . . . . . . . 10.2 12.6 13.4 14.1 14.7 15.3 1.5Natural Gas . . . . . . . . . . . . . . . . . . . . . . 30.4 38.1 46.4 52.7 59.1 65.8 2.9Coal . . . . . . . . . . . . . . . . . . . . . . . . . . . . 66.9 83.5 92.1 101.5 111.4 123.0 2.3Nuclear . . . . . . . . . . . . . . . . . . . . . . . . . 26.5 28.9 31.0 32.9 34.0 34.7 1.0Renewables. . . . . . . . . . . . . . . . . . . . . . 29.6 41.4 44.9 48.7 53.2 57.5 2.5
Total . . . . . . . . . . . . . . . . . . . . . . . . . . 163.7 204.5 227.9 249.9 272.6 296.4 2.2Total Energy Consumption
Oil . . . . . . . . . . . . . . . . . . . . . . . . . . . . . 162.1 185.6 199.1 210.8 224.3 239.1 1.4Natural Gas . . . . . . . . . . . . . . . . . . . . . . 99.1 121.1 139.8 156.1 172.5 189.9 2.4Coal . . . . . . . . . . . . . . . . . . . . . . . . . . . . 100.4 128.8 144.4 160.1 176.7 195.5 2.5Nuclear . . . . . . . . . . . . . . . . . . . . . . . . . 26.5 28.9 31.0 32.9 34.0 34.7 1.0Renewables. . . . . . . . . . . . . . . . . . . . . . 32.7 45.2 49.0 53.1 57.8 62.4 2.4
Total . . . . . . . . . . . . . . . . . . . . . . . . . . 420.7 509.7 563.4 613.0 665.4 721.6 2.0aFuel inputs used in the production of electricity and heat at central-station generators.Sources: 2003: Derived from Energy Information Administration (EIA), International Energy Annual 2003 (May-July 2005), web site www.eia.
doe.gov/iea/. Projections: EIA, Annual Energy Outlook 2006, DOE/EIA-0383(2006) (Washington, DC, February 2006), AEO2006 National EnergyModeling System, run AEO2006.D111905A, web site www.eia.doe.gov/oiaf/aeo/; and System for the Analysis of Global Energy Markets (2006).
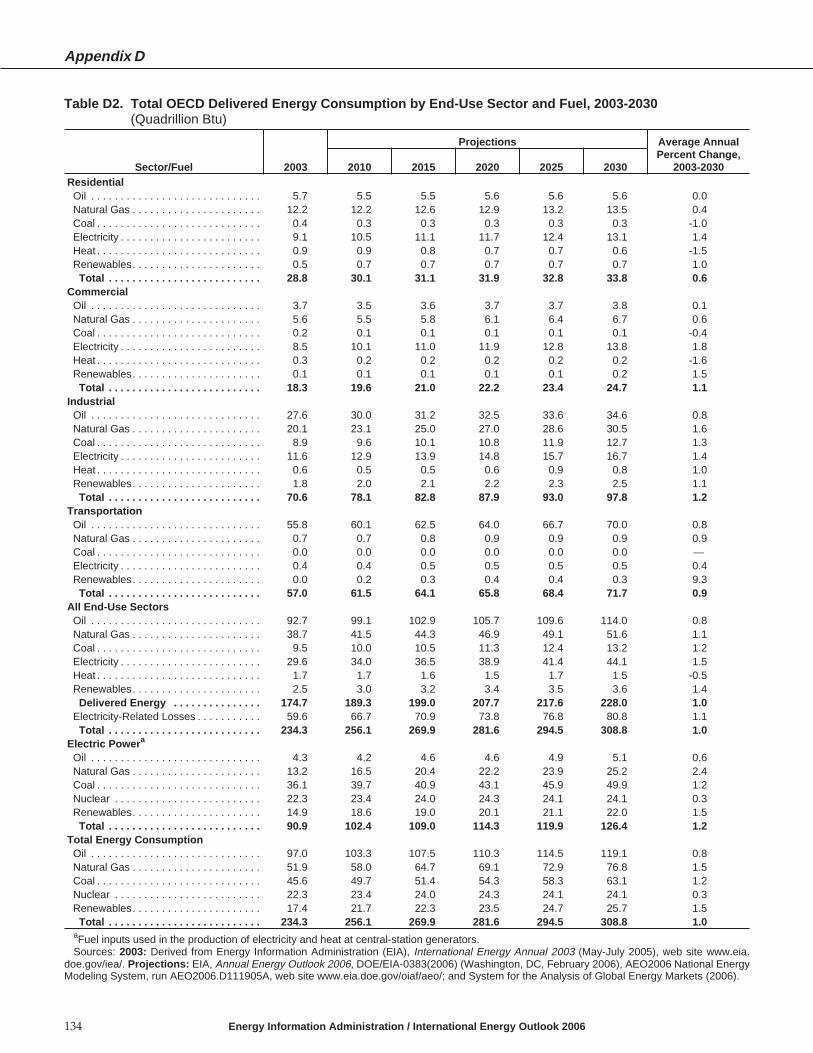
Table D2. Total OECD Delivered Energy Consumption by End-Use Sector and Fuel, 2003-2030(Quadrillion Btu)
Appendix D
134 Energy Information Administration / International Energy Outlook 2006
Sector/Fuel 2003
Projections Average AnnualPercent Change,
2003-20302010 2015 2020 2025 2030Residential
Oil . . . . . . . . . . . . . . . . . . . . . . . . . . . . . 5.7 5.5 5.5 5.6 5.6 5.6 0.0Natural Gas . . . . . . . . . . . . . . . . . . . . . . 12.2 12.2 12.6 12.9 13.2 13.5 0.4Coal . . . . . . . . . . . . . . . . . . . . . . . . . . . . 0.4 0.3 0.3 0.3 0.3 0.3 -1.0Electricity . . . . . . . . . . . . . . . . . . . . . . . . 9.1 10.5 11.1 11.7 12.4 13.1 1.4Heat . . . . . . . . . . . . . . . . . . . . . . . . . . . . 0.9 0.9 0.8 0.7 0.7 0.6 -1.5Renewables. . . . . . . . . . . . . . . . . . . . . . 0.5 0.7 0.7 0.7 0.7 0.7 1.0
Total . . . . . . . . . . . . . . . . . . . . . . . . . . 28.8 30.1 31.1 31.9 32.8 33.8 0.6Commercial
Oil . . . . . . . . . . . . . . . . . . . . . . . . . . . . . 3.7 3.5 3.6 3.7 3.7 3.8 0.1Natural Gas . . . . . . . . . . . . . . . . . . . . . . 5.6 5.5 5.8 6.1 6.4 6.7 0.6Coal . . . . . . . . . . . . . . . . . . . . . . . . . . . . 0.2 0.1 0.1 0.1 0.1 0.1 -0.4Electricity . . . . . . . . . . . . . . . . . . . . . . . . 8.5 10.1 11.0 11.9 12.8 13.8 1.8Heat . . . . . . . . . . . . . . . . . . . . . . . . . . . . 0.3 0.2 0.2 0.2 0.2 0.2 -1.6Renewables. . . . . . . . . . . . . . . . . . . . . . 0.1 0.1 0.1 0.1 0.1 0.2 1.5
Total . . . . . . . . . . . . . . . . . . . . . . . . . . 18.3 19.6 21.0 22.2 23.4 24.7 1.1Industrial
Oil . . . . . . . . . . . . . . . . . . . . . . . . . . . . . 27.6 30.0 31.2 32.5 33.6 34.6 0.8Natural Gas . . . . . . . . . . . . . . . . . . . . . . 20.1 23.1 25.0 27.0 28.6 30.5 1.6Coal . . . . . . . . . . . . . . . . . . . . . . . . . . . . 8.9 9.6 10.1 10.8 11.9 12.7 1.3Electricity . . . . . . . . . . . . . . . . . . . . . . . . 11.6 12.9 13.9 14.8 15.7 16.7 1.4Heat . . . . . . . . . . . . . . . . . . . . . . . . . . . . 0.6 0.5 0.5 0.6 0.9 0.8 1.0Renewables. . . . . . . . . . . . . . . . . . . . . . 1.8 2.0 2.1 2.2 2.3 2.5 1.1
Total . . . . . . . . . . . . . . . . . . . . . . . . . . 70.6 78.1 82.8 87.9 93.0 97.8 1.2Transportation
Oil . . . . . . . . . . . . . . . . . . . . . . . . . . . . . 55.8 60.1 62.5 64.0 66.7 70.0 0.8Natural Gas . . . . . . . . . . . . . . . . . . . . . . 0.7 0.7 0.8 0.9 0.9 0.9 0.9Coal . . . . . . . . . . . . . . . . . . . . . . . . . . . . 0.0 0.0 0.0 0.0 0.0 0.0 —Electricity . . . . . . . . . . . . . . . . . . . . . . . . 0.4 0.4 0.5 0.5 0.5 0.5 0.4Renewables. . . . . . . . . . . . . . . . . . . . . . 0.0 0.2 0.3 0.4 0.4 0.3 9.3
Total . . . . . . . . . . . . . . . . . . . . . . . . . . 57.0 61.5 64.1 65.8 68.4 71.7 0.9All End-Use Sectors
Oil . . . . . . . . . . . . . . . . . . . . . . . . . . . . . 92.7 99.1 102.9 105.7 109.6 114.0 0.8Natural Gas . . . . . . . . . . . . . . . . . . . . . . 38.7 41.5 44.3 46.9 49.1 51.6 1.1Coal . . . . . . . . . . . . . . . . . . . . . . . . . . . . 9.5 10.0 10.5 11.3 12.4 13.2 1.2Electricity . . . . . . . . . . . . . . . . . . . . . . . . 29.6 34.0 36.5 38.9 41.4 44.1 1.5Heat . . . . . . . . . . . . . . . . . . . . . . . . . . . . 1.7 1.7 1.6 1.5 1.7 1.5 -0.5Renewables. . . . . . . . . . . . . . . . . . . . . . 2.5 3.0 3.2 3.4 3.5 3.6 1.4
Delivered Energy . . . . . . . . . . . . . . . 174.7 189.3 199.0 207.7 217.6 228.0 1.0Electricity-Related Losses . . . . . . . . . . . 59.6 66.7 70.9 73.8 76.8 80.8 1.1
Total . . . . . . . . . . . . . . . . . . . . . . . . . . 234.3 256.1 269.9 281.6 294.5 308.8 1.0Electric Power a
Oil . . . . . . . . . . . . . . . . . . . . . . . . . . . . . 4.3 4.2 4.6 4.6 4.9 5.1 0.6Natural Gas . . . . . . . . . . . . . . . . . . . . . . 13.2 16.5 20.4 22.2 23.9 25.2 2.4Coal . . . . . . . . . . . . . . . . . . . . . . . . . . . . 36.1 39.7 40.9 43.1 45.9 49.9 1.2Nuclear . . . . . . . . . . . . . . . . . . . . . . . . . 22.3 23.4 24.0 24.3 24.1 24.1 0.3Renewables. . . . . . . . . . . . . . . . . . . . . . 14.9 18.6 19.0 20.1 21.1 22.0 1.5
Total . . . . . . . . . . . . . . . . . . . . . . . . . . 90.9 102.4 109.0 114.3 119.9 126.4 1.2Total Energy Consumption
Oil . . . . . . . . . . . . . . . . . . . . . . . . . . . . . 97.0 103.3 107.5 110.3 114.5 119.1 0.8Natural Gas . . . . . . . . . . . . . . . . . . . . . . 51.9 58.0 64.7 69.1 72.9 76.8 1.5Coal . . . . . . . . . . . . . . . . . . . . . . . . . . . . 45.6 49.7 51.4 54.3 58.3 63.1 1.2Nuclear . . . . . . . . . . . . . . . . . . . . . . . . . 22.3 23.4 24.0 24.3 24.1 24.1 0.3Renewables. . . . . . . . . . . . . . . . . . . . . . 17.4 21.7 22.3 23.5 24.7 25.7 1.5
Total . . . . . . . . . . . . . . . . . . . . . . . . . . 234.3 256.1 269.9 281.6 294.5 308.8 1.0aFuel inputs used in the production of electricity and heat at central-station generators.Sources: 2003: Derived from Energy Information Administration (EIA), International Energy Annual 2003 (May-July 2005), web site www.eia.
doe.gov/iea/. Projections: EIA, Annual Energy Outlook 2006, DOE/EIA-0383(2006) (Washington, DC, February 2006), AEO2006 National EnergyModeling System, run AEO2006.D111905A, web site www.eia.doe.gov/oiaf/aeo/; and System for the Analysis of Global Energy Markets (2006).

Table D3. Delivered Energy Consumption in the United States by End-Use Sector and Fuel, 2003-2030(Quadrillion Btu)
Reference Case Projections by End-Use Sector and Region
Energy Information Administration / International Energy Outlook 2006 135
Sector/Fuel 2003
Projections Average AnnualPercent Change,
2003-20302010 2015 2020 2025 2030Residential
Oil . . . . . . . . . . . . . . . . . . . . . . . . . . . . . 1.5 1.5 1.5 1.4 1.4 1.3 -0.5Natural Gas . . . . . . . . . . . . . . . . . . . . . . 5.2 5.3 5.5 5.7 5.7 5.8 0.4Coal . . . . . . . . . . . . . . . . . . . . . . . . . . . . 0.0 0.0 0.0 0.0 0.0 0.0 -0.4Electricity . . . . . . . . . . . . . . . . . . . . . . . . 4.3 5.0 5.4 5.8 6.1 6.5 1.5Heat . . . . . . . . . . . . . . . . . . . . . . . . . . . . 0.0 0.0 0.0 0.0 0.0 0.0 —Renewables. . . . . . . . . . . . . . . . . . . . . . 0.4 0.4 0.4 0.4 0.4 0.4 0.1
Total . . . . . . . . . . . . . . . . . . . . . . . . . . 11.5 12.2 12.8 13.3 13.6 14.0 0.7Commercial
Oil . . . . . . . . . . . . . . . . . . . . . . . . . . . . . 0.8 0.8 0.8 0.8 0.8 0.8 0.3Natural Gas . . . . . . . . . . . . . . . . . . . . . . 3.3 3.2 3.5 3.7 3.9 4.1 0.8Coal . . . . . . . . . . . . . . . . . . . . . . . . . . . . 0.1 0.1 0.1 0.1 0.1 0.1 0.1Electricity . . . . . . . . . . . . . . . . . . . . . . . . 4.1 4.9 5.4 6.0 6.6 7.3 2.2Heat . . . . . . . . . . . . . . . . . . . . . . . . . . . . 0.0 0.0 0.0 0.0 0.0 0.0 —Renewables. . . . . . . . . . . . . . . . . . . . . . 0.1 0.1 0.1 0.1 0.1 0.1 0.0
Total . . . . . . . . . . . . . . . . . . . . . . . . . . 8.3 9.0 9.9 10.7 11.5 12.4 1.5Industrial
Oil . . . . . . . . . . . . . . . . . . . . . . . . . . . . . 9.3 10.0 10.3 10.6 11.1 11.7 0.8Natural Gas . . . . . . . . . . . . . . . . . . . . . . 8.5 9.2 9.5 9.8 10.0 10.3 0.7Coal . . . . . . . . . . . . . . . . . . . . . . . . . . . . 2.1 2.1 2.2 2.5 3.3 3.6 2.1Electricity . . . . . . . . . . . . . . . . . . . . . . . . 3.4 3.6 3.8 3.9 4.1 4.3 0.8Heat . . . . . . . . . . . . . . . . . . . . . . . . . . . . 0.0 0.0 0.0 0.0 0.0 0.0 —Renewables. . . . . . . . . . . . . . . . . . . . . . 1.6 1.8 1.9 2.0 2.1 2.3 1.4
Total . . . . . . . . . . . . . . . . . . . . . . . . . . 24.9 26.7 27.7 28.9 30.6 32.2 1.0Transportation
Oil . . . . . . . . . . . . . . . . . . . . . . . . . . . . . 26.3 29.9 32.2 34.3 36.3 38.7 1.4Natural Gas . . . . . . . . . . . . . . . . . . . . . . 0.7 0.7 0.8 0.9 0.9 0.9 0.9Coal . . . . . . . . . . . . . . . . . . . . . . . . . . . . 0.0 0.0 0.0 0.0 0.0 0.0 —Electricity . . . . . . . . . . . . . . . . . . . . . . . . 0.1 0.1 0.1 0.1 0.1 0.1 0.9Renewables. . . . . . . . . . . . . . . . . . . . . . 0.0 0.0 0.0 0.0 0.0 0.0 6.4
Total . . . . . . . . . . . . . . . . . . . . . . . . . . 27.1 30.7 33.1 35.3 37.3 39.7 1.4All End-Use Sectors
Oil . . . . . . . . . . . . . . . . . . . . . . . . . . . . . 37.8 42.2 44.7 47.2 49.6 52.5 1.2Natural Gas . . . . . . . . . . . . . . . . . . . . . . 17.8 18.4 19.3 20.1 20.5 21.1 0.6Coal . . . . . . . . . . . . . . . . . . . . . . . . . . . . 2.2 2.2 2.3 2.6 3.3 3.7 2.0Electricity . . . . . . . . . . . . . . . . . . . . . . . . 12.0 13.6 14.7 15.8 16.9 18.2 1.6Heat . . . . . . . . . . . . . . . . . . . . . . . . . . . . 0.0 0.0 0.0 0.0 0.0 0.0 —Renewables. . . . . . . . . . . . . . . . . . . . . . 2.1 2.3 2.4 2.5 2.7 2.8 1.1
Delivered Energy . . . . . . . . . . . . . . . 71.9 78.6 83.5 88.2 93.0 98.4 1.2Electricity-Related Losses . . . . . . . . . . . 26.2 29.2 30.7 32.4 33.9 35.5 1.1
Total . . . . . . . . . . . . . . . . . . . . . . . . . . 98.1 107.9 114.2 120.6 127.0 133.9 1.2Electric Power a
Oil . . . . . . . . . . . . . . . . . . . . . . . . . . . . . 1.1 1.0 1.0 1.0 1.0 1.1 -0.2Natural Gas . . . . . . . . . . . . . . . . . . . . . . 5.2 5.6 7.3 7.6 7.2 6.5 0.8Coal . . . . . . . . . . . . . . . . . . . . . . . . . . . . 20.2 22.9 23.4 25.0 27.5 30.7 1.6Nuclear . . . . . . . . . . . . . . . . . . . . . . . . . 8.0 8.4 8.7 9.1 9.1 9.1 0.5Renewables. . . . . . . . . . . . . . . . . . . . . . 3.6 4.8 5.0 5.5 6.0 6.2 2.0
Total . . . . . . . . . . . . . . . . . . . . . . . . . . 38.1 42.8 45.4 48.2 50.9 53.7 1.3Total Energy Consumption
Oil . . . . . . . . . . . . . . . . . . . . . . . . . . . . . 39.0 43.1 45.7 48.1 50.6 53.6 1.2Natural Gas . . . . . . . . . . . . . . . . . . . . . . 23.0 24.0 26.7 27.7 27.8 27.7 0.7Coal . . . . . . . . . . . . . . . . . . . . . . . . . . . . 22.4 25.1 25.7 27.6 30.9 34.5 1.6Nuclear . . . . . . . . . . . . . . . . . . . . . . . . . 8.0 8.4 8.7 9.1 9.1 9.1 0.5Renewables. . . . . . . . . . . . . . . . . . . . . . 5.7 7.2 7.5 8.1 8.7 9.1 1.7
Total . . . . . . . . . . . . . . . . . . . . . . . . . . 98.1 107.9 114.2 120.6 127.0 133.9 1.2aFuel inputs used in the production of electricity and heat at central-station generators. Includes net electricity imports.Sources: 2003: Based on Energy Information Administration (EIA), Annual Energy Review 2004, DOE/EIA-0384(2004) (Washington, DC, August
2005). Projections: EIA, Annual Energy Outlook 2006, DOE/EIA-0383(2006) (Washington, DC, February 2006), AEO2006 National EnergyModeling System, run AEO2006.D111905A, web site www.eia.doe.gov/oiaf/aeo/; and System for the Analysis of Global Energy Markets (2006).

Table D4. Delivered Energy Consumption in Canada by End-Use Sector and Fuel, 2003-2030(Quadrillion Btu)
Appendix D
136 Energy Information Administration / International Energy Outlook 2006
Sector/Fuel 2003
Projections Average AnnualPercent Change,
2003-20302010 2015 2020 2025 2030Residential
Oil . . . . . . . . . . . . . . . . . . . . . . . . . . . . . 0.1 0.1 0.1 0.1 0.1 0.1 0.1Natural Gas . . . . . . . . . . . . . . . . . . . . . . 0.6 0.6 0.6 0.6 0.6 0.7 0.3Coal . . . . . . . . . . . . . . . . . . . . . . . . . . . . 0.0 0.0 0.0 0.0 0.0 0.0 -0.7Electricity . . . . . . . . . . . . . . . . . . . . . . . . 0.5 0.6 0.7 0.7 0.7 0.8 1.6Heat . . . . . . . . . . . . . . . . . . . . . . . . . . . . 0.0 0.0 0.0 0.0 0.0 0.0 —Renewables. . . . . . . . . . . . . . . . . . . . . . 0.0 0.0 0.0 0.0 0.0 0.0 —
Total . . . . . . . . . . . . . . . . . . . . . . . . . . 1.3 1.4 1.4 1.5 1.5 1.6 0.9Commercial
Oil . . . . . . . . . . . . . . . . . . . . . . . . . . . . . 0.4 0.3 0.4 0.4 0.4 0.4 0.5Natural Gas . . . . . . . . . . . . . . . . . . . . . . 0.5 0.5 0.5 0.5 0.6 0.6 0.7Coal . . . . . . . . . . . . . . . . . . . . . . . . . . . . 0.0 0.0 0.0 0.0 0.0 0.0 —Electricity . . . . . . . . . . . . . . . . . . . . . . . . 0.4 0.6 0.6 0.7 0.7 0.8 2.1Heat . . . . . . . . . . . . . . . . . . . . . . . . . . . . 0.0 0.0 0.0 0.0 0.0 0.0 —Renewables. . . . . . . . . . . . . . . . . . . . . . 0.0 0.0 0.0 0.0 0.0 0.0 —
Total . . . . . . . . . . . . . . . . . . . . . . . . . . 1.3 1.4 1.5 1.6 1.7 1.8 1.2Industrial
Oil . . . . . . . . . . . . . . . . . . . . . . . . . . . . . 1.5 1.7 1.8 1.9 2.0 2.0 1.3Natural Gas . . . . . . . . . . . . . . . . . . . . . . 1.9 2.6 2.7 2.9 3.2 3.5 2.2Coal . . . . . . . . . . . . . . . . . . . . . . . . . . . . 0.2 0.9 0.9 1.0 1.0 1.1 5.9Electricity . . . . . . . . . . . . . . . . . . . . . . . . 0.8 0.9 0.9 1.0 1.0 1.1 1.1Heat . . . . . . . . . . . . . . . . . . . . . . . . . . . . 0.0 0.0 0.0 0.0 0.1 0.1 1.7Renewables. . . . . . . . . . . . . . . . . . . . . . 0.1 0.1 0.1 0.1 0.1 0.0 -3.1
Total . . . . . . . . . . . . . . . . . . . . . . . . . . 4.6 6.1 6.5 6.9 7.4 7.8 2.0Transportation
Oil . . . . . . . . . . . . . . . . . . . . . . . . . . . . . 2.2 2.3 2.3 2.3 2.3 2.3 0.3Natural Gas . . . . . . . . . . . . . . . . . . . . . . 0.0 0.0 0.0 0.0 0.0 0.0 1.5Coal . . . . . . . . . . . . . . . . . . . . . . . . . . . . 0.0 0.0 0.0 0.0 0.0 0.0 —Electricity . . . . . . . . . . . . . . . . . . . . . . . . 0.0 0.0 0.0 0.0 0.0 0.0 0.6Renewables. . . . . . . . . . . . . . . . . . . . . . 0.0 0.0 0.0 0.0 0.0 0.0 —
Total . . . . . . . . . . . . . . . . . . . . . . . . . . 2.2 2.3 2.3 2.3 2.3 2.3 0.3All End-Use Sectors
Oil . . . . . . . . . . . . . . . . . . . . . . . . . . . . . 4.1 4.4 4.6 4.7 4.8 4.9 0.7Natural Gas . . . . . . . . . . . . . . . . . . . . . . 3.0 3.7 3.9 4.1 4.4 4.7 1.7Coal . . . . . . . . . . . . . . . . . . . . . . . . . . . . 0.2 0.9 0.9 1.0 1.0 1.1 5.9Electricity . . . . . . . . . . . . . . . . . . . . . . . . 1.8 2.1 2.3 2.4 2.5 2.6 1.5Heat . . . . . . . . . . . . . . . . . . . . . . . . . . . . 0.0 0.0 0.0 0.0 0.1 0.1 1.7Renewables. . . . . . . . . . . . . . . . . . . . . . 0.1 0.1 0.1 0.1 0.1 0.1 -1.3
Delivered Energy . . . . . . . . . . . . . . . 9.3 11.2 11.8 12.3 12.9 13.5 1.4Electricity-Related Losses . . . . . . . . . . . 4.2 4.4 4.8 5.2 5.4 5.7 1.1
Total . . . . . . . . . . . . . . . . . . . . . . . . . . 13.5 15.6 16.6 17.5 18.4 19.2 1.3Electric Power a
Oil . . . . . . . . . . . . . . . . . . . . . . . . . . . . . 0.2 0.3 0.4 0.2 0.2 0.2 0.0Natural Gas . . . . . . . . . . . . . . . . . . . . . . 0.3 0.6 0.4 0.7 0.7 0.7 3.6Coal . . . . . . . . . . . . . . . . . . . . . . . . . . . . 1.4 0.8 1.3 1.6 1.7 1.7 0.9Nuclear . . . . . . . . . . . . . . . . . . . . . . . . . 0.8 1.2 1.3 1.3 1.2 1.2 1.6Renewables. . . . . . . . . . . . . . . . . . . . . . 3.4 3.7 3.7 3.9 4.2 4.5 1.1
Total . . . . . . . . . . . . . . . . . . . . . . . . . . 6.0 6.5 7.1 7.6 8.0 8.4 1.2Total Energy Consumption
Oil . . . . . . . . . . . . . . . . . . . . . . . . . . . . . 4.3 4.8 5.0 4.9 5.1 5.1 0.6Natural Gas . . . . . . . . . . . . . . . . . . . . . . 3.3 4.2 4.3 4.8 5.1 5.4 1.9Coal . . . . . . . . . . . . . . . . . . . . . . . . . . . . 1.6 1.7 2.2 2.5 2.7 2.8 2.1Nuclear . . . . . . . . . . . . . . . . . . . . . . . . . 0.8 1.2 1.3 1.3 1.2 1.2 1.6Renewables. . . . . . . . . . . . . . . . . . . . . . 3.5 3.8 3.8 4.0 4.3 4.6 1.0
Total . . . . . . . . . . . . . . . . . . . . . . . . . . 13.5 15.6 16.6 17.5 18.4 19.2 1.3aFuel inputs used in the production of electricity and heat at central-station generators.Sources: 2003: Derived from Energy Information Administration (EIA), International Energy Annual 2003 (May-July 2005), web site www.eia.
doe.gov/iea/. Projections: EIA, System for the Analysis of Global Energy Markets (2006).
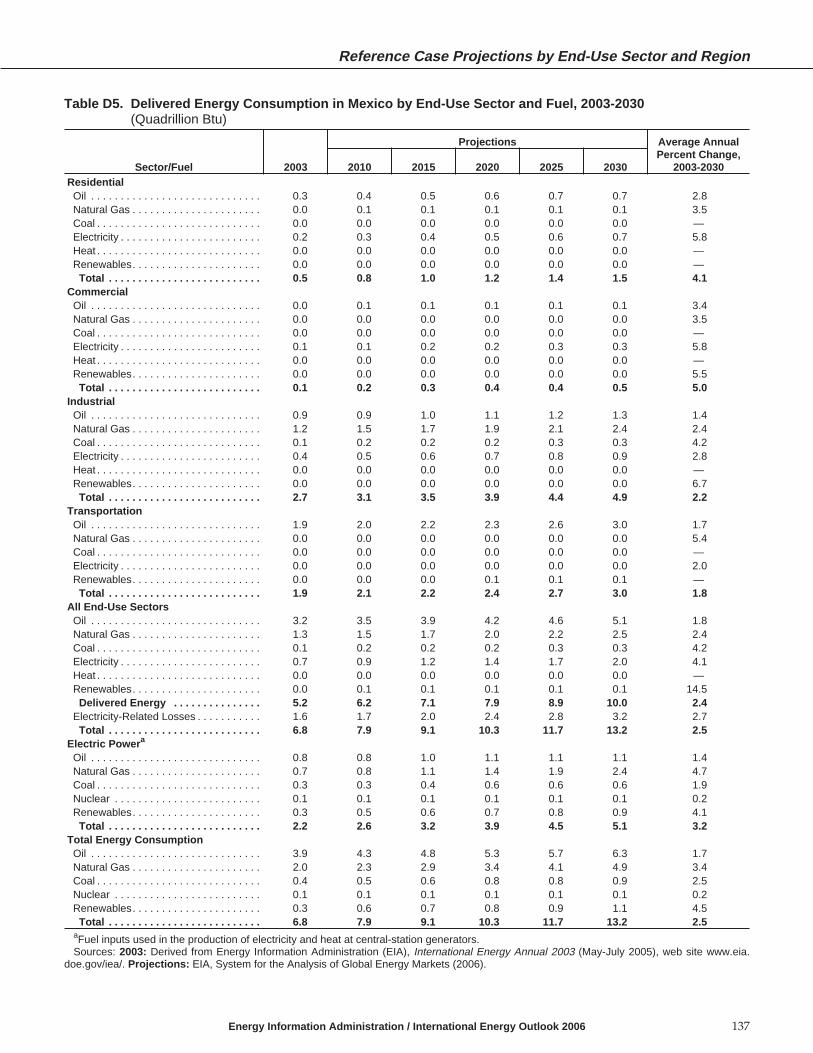
Table D5. Delivered Energy Consumption in Mexico by End-Use Sector and Fuel, 2003-2030(Quadrillion Btu)
Reference Case Projections by End-Use Sector and Region
Energy Information Administration / International Energy Outlook 2006 137
Sector/Fuel 2003
Projections Average AnnualPercent Change,
2003-20302010 2015 2020 2025 2030Residential
Oil . . . . . . . . . . . . . . . . . . . . . . . . . . . . . 0.3 0.4 0.5 0.6 0.7 0.7 2.8Natural Gas . . . . . . . . . . . . . . . . . . . . . . 0.0 0.1 0.1 0.1 0.1 0.1 3.5Coal . . . . . . . . . . . . . . . . . . . . . . . . . . . . 0.0 0.0 0.0 0.0 0.0 0.0 —Electricity . . . . . . . . . . . . . . . . . . . . . . . . 0.2 0.3 0.4 0.5 0.6 0.7 5.8Heat . . . . . . . . . . . . . . . . . . . . . . . . . . . . 0.0 0.0 0.0 0.0 0.0 0.0 —Renewables. . . . . . . . . . . . . . . . . . . . . . 0.0 0.0 0.0 0.0 0.0 0.0 —
Total . . . . . . . . . . . . . . . . . . . . . . . . . . 0.5 0.8 1.0 1.2 1.4 1.5 4.1Commercial
Oil . . . . . . . . . . . . . . . . . . . . . . . . . . . . . 0.0 0.1 0.1 0.1 0.1 0.1 3.4Natural Gas . . . . . . . . . . . . . . . . . . . . . . 0.0 0.0 0.0 0.0 0.0 0.0 3.5Coal . . . . . . . . . . . . . . . . . . . . . . . . . . . . 0.0 0.0 0.0 0.0 0.0 0.0 —Electricity . . . . . . . . . . . . . . . . . . . . . . . . 0.1 0.1 0.2 0.2 0.3 0.3 5.8Heat . . . . . . . . . . . . . . . . . . . . . . . . . . . . 0.0 0.0 0.0 0.0 0.0 0.0 —Renewables. . . . . . . . . . . . . . . . . . . . . . 0.0 0.0 0.0 0.0 0.0 0.0 5.5
Total . . . . . . . . . . . . . . . . . . . . . . . . . . 0.1 0.2 0.3 0.4 0.4 0.5 5.0Industrial
Oil . . . . . . . . . . . . . . . . . . . . . . . . . . . . . 0.9 0.9 1.0 1.1 1.2 1.3 1.4Natural Gas . . . . . . . . . . . . . . . . . . . . . . 1.2 1.5 1.7 1.9 2.1 2.4 2.4Coal . . . . . . . . . . . . . . . . . . . . . . . . . . . . 0.1 0.2 0.2 0.2 0.3 0.3 4.2Electricity . . . . . . . . . . . . . . . . . . . . . . . . 0.4 0.5 0.6 0.7 0.8 0.9 2.8Heat . . . . . . . . . . . . . . . . . . . . . . . . . . . . 0.0 0.0 0.0 0.0 0.0 0.0 —Renewables. . . . . . . . . . . . . . . . . . . . . . 0.0 0.0 0.0 0.0 0.0 0.0 6.7
Total . . . . . . . . . . . . . . . . . . . . . . . . . . 2.7 3.1 3.5 3.9 4.4 4.9 2.2Transportation
Oil . . . . . . . . . . . . . . . . . . . . . . . . . . . . . 1.9 2.0 2.2 2.3 2.6 3.0 1.7Natural Gas . . . . . . . . . . . . . . . . . . . . . . 0.0 0.0 0.0 0.0 0.0 0.0 5.4Coal . . . . . . . . . . . . . . . . . . . . . . . . . . . . 0.0 0.0 0.0 0.0 0.0 0.0 —Electricity . . . . . . . . . . . . . . . . . . . . . . . . 0.0 0.0 0.0 0.0 0.0 0.0 2.0Renewables. . . . . . . . . . . . . . . . . . . . . . 0.0 0.0 0.0 0.1 0.1 0.1 —
Total . . . . . . . . . . . . . . . . . . . . . . . . . . 1.9 2.1 2.2 2.4 2.7 3.0 1.8All End-Use Sectors
Oil . . . . . . . . . . . . . . . . . . . . . . . . . . . . . 3.2 3.5 3.9 4.2 4.6 5.1 1.8Natural Gas . . . . . . . . . . . . . . . . . . . . . . 1.3 1.5 1.7 2.0 2.2 2.5 2.4Coal . . . . . . . . . . . . . . . . . . . . . . . . . . . . 0.1 0.2 0.2 0.2 0.3 0.3 4.2Electricity . . . . . . . . . . . . . . . . . . . . . . . . 0.7 0.9 1.2 1.4 1.7 2.0 4.1Heat . . . . . . . . . . . . . . . . . . . . . . . . . . . . 0.0 0.0 0.0 0.0 0.0 0.0 —Renewables. . . . . . . . . . . . . . . . . . . . . . 0.0 0.1 0.1 0.1 0.1 0.1 14.5
Delivered Energy . . . . . . . . . . . . . . . 5.2 6.2 7.1 7.9 8.9 10.0 2.4Electricity-Related Losses . . . . . . . . . . . 1.6 1.7 2.0 2.4 2.8 3.2 2.7
Total . . . . . . . . . . . . . . . . . . . . . . . . . . 6.8 7.9 9.1 10.3 11.7 13.2 2.5Electric Power a
Oil . . . . . . . . . . . . . . . . . . . . . . . . . . . . . 0.8 0.8 1.0 1.1 1.1 1.1 1.4Natural Gas . . . . . . . . . . . . . . . . . . . . . . 0.7 0.8 1.1 1.4 1.9 2.4 4.7Coal . . . . . . . . . . . . . . . . . . . . . . . . . . . . 0.3 0.3 0.4 0.6 0.6 0.6 1.9Nuclear . . . . . . . . . . . . . . . . . . . . . . . . . 0.1 0.1 0.1 0.1 0.1 0.1 0.2Renewables. . . . . . . . . . . . . . . . . . . . . . 0.3 0.5 0.6 0.7 0.8 0.9 4.1
Total . . . . . . . . . . . . . . . . . . . . . . . . . . 2.2 2.6 3.2 3.9 4.5 5.1 3.2Total Energy Consumption
Oil . . . . . . . . . . . . . . . . . . . . . . . . . . . . . 3.9 4.3 4.8 5.3 5.7 6.3 1.7Natural Gas . . . . . . . . . . . . . . . . . . . . . . 2.0 2.3 2.9 3.4 4.1 4.9 3.4Coal . . . . . . . . . . . . . . . . . . . . . . . . . . . . 0.4 0.5 0.6 0.8 0.8 0.9 2.5Nuclear . . . . . . . . . . . . . . . . . . . . . . . . . 0.1 0.1 0.1 0.1 0.1 0.1 0.2Renewables. . . . . . . . . . . . . . . . . . . . . . 0.3 0.6 0.7 0.8 0.9 1.1 4.5
Total . . . . . . . . . . . . . . . . . . . . . . . . . . 6.8 7.9 9.1 10.3 11.7 13.2 2.5aFuel inputs used in the production of electricity and heat at central-station generators.Sources: 2003: Derived from Energy Information Administration (EIA), International Energy Annual 2003 (May-July 2005), web site www.eia.
doe.gov/iea/. Projections: EIA, System for the Analysis of Global Energy Markets (2006).

Table D6. Delivered Energy Consumption in OECD Europe by End-Use Sector and Fuel, 2003-2030(Quadrillion Btu)
Appendix D
138 Energy Information Administration / International Energy Outlook 2006
Sector/Fuel 2003
Projections Average AnnualPercent Change,
2003-20302010 2015 2020 2025 2030Residential
Oil . . . . . . . . . . . . . . . . . . . . . . . . . . . . . 2.8 2.7 2.7 2.7 2.7 2.7 -0.1Natural Gas . . . . . . . . . . . . . . . . . . . . . . 5.4 5.4 5.5 5.6 5.8 6.0 0.3Coal . . . . . . . . . . . . . . . . . . . . . . . . . . . . 0.4 0.3 0.3 0.3 0.3 0.3 -1.0Electricity . . . . . . . . . . . . . . . . . . . . . . . . 2.8 3.1 3.2 3.2 3.4 3.5 0.8Heat . . . . . . . . . . . . . . . . . . . . . . . . . . . . 0.8 0.9 0.8 0.7 0.6 0.5 -1.8Renewables. . . . . . . . . . . . . . . . . . . . . . 0.1 0.1 0.1 0.1 0.2 0.2 2.2
Total . . . . . . . . . . . . . . . . . . . . . . . . . . 12.3 12.4 12.5 12.5 12.8 13.1 0.2Commercial
Oil . . . . . . . . . . . . . . . . . . . . . . . . . . . . . 1.0 1.0 1.0 1.0 1.0 1.0 -0.3Natural Gas . . . . . . . . . . . . . . . . . . . . . . 1.5 1.4 1.5 1.5 1.5 1.6 0.3Coal . . . . . . . . . . . . . . . . . . . . . . . . . . . . 0.1 0.0 0.0 0.0 0.0 0.0 -1.3Electricity . . . . . . . . . . . . . . . . . . . . . . . . 2.5 2.8 2.9 3.0 3.2 3.3 1.1Heat . . . . . . . . . . . . . . . . . . . . . . . . . . . . 0.2 0.2 0.2 0.2 0.2 0.1 -1.8Renewables. . . . . . . . . . . . . . . . . . . . . . 0.0 0.0 0.0 0.0 0.0 0.0 5.5
Total . . . . . . . . . . . . . . . . . . . . . . . . . . 5.3 5.5 5.6 5.8 5.9 6.1 0.5Industrial
Oil . . . . . . . . . . . . . . . . . . . . . . . . . . . . . 8.9 9.6 9.8 10.1 10.2 10.2 0.5Natural Gas . . . . . . . . . . . . . . . . . . . . . . 7.0 8.3 9.1 10.3 10.9 11.8 1.9Coal . . . . . . . . . . . . . . . . . . . . . . . . . . . . 3.3 3.3 3.3 3.6 3.8 3.9 0.7Electricity . . . . . . . . . . . . . . . . . . . . . . . . 4.6 5.2 5.7 6.1 6.5 6.9 1.5Heat . . . . . . . . . . . . . . . . . . . . . . . . . . . . 0.5 0.5 0.5 0.5 0.8 0.7 0.9Renewables. . . . . . . . . . . . . . . . . . . . . . 0.1 0.1 0.1 0.1 0.1 0.1 0.8
Total . . . . . . . . . . . . . . . . . . . . . . . . . . 24.5 27.0 28.5 30.6 32.2 33.7 1.2Transportation
Oil . . . . . . . . . . . . . . . . . . . . . . . . . . . . . 18.0 18.3 18.1 17.6 17.8 18.2 0.0Natural Gas . . . . . . . . . . . . . . . . . . . . . . 0.0 0.0 0.0 0.0 0.0 0.0 -3.7Coal . . . . . . . . . . . . . . . . . . . . . . . . . . . . 0.0 0.0 0.0 0.0 0.0 0.0 —Electricity . . . . . . . . . . . . . . . . . . . . . . . . 0.3 0.3 0.3 0.3 0.3 0.3 0.2Renewables. . . . . . . . . . . . . . . . . . . . . . 0.0 0.1 0.2 0.2 0.2 0.2 7.4
Total . . . . . . . . . . . . . . . . . . . . . . . . . . 18.3 18.7 18.6 18.1 18.3 18.7 0.1All End-Use Sectors
Oil . . . . . . . . . . . . . . . . . . . . . . . . . . . . . 30.8 31.6 31.6 31.3 31.7 32.1 0.2Natural Gas . . . . . . . . . . . . . . . . . . . . . . 14.0 15.1 16.1 17.4 18.2 19.4 1.2Coal . . . . . . . . . . . . . . . . . . . . . . . . . . . . 3.7 3.6 3.7 3.9 4.1 4.2 0.5Electricity . . . . . . . . . . . . . . . . . . . . . . . . 10.1 11.4 12.0 12.6 13.3 14.0 1.2Heat . . . . . . . . . . . . . . . . . . . . . . . . . . . . 1.6 1.6 1.4 1.4 1.5 1.3 -0.7Renewables. . . . . . . . . . . . . . . . . . . . . . 0.2 0.4 0.4 0.5 0.5 0.5 3.2
Delivered Energy . . . . . . . . . . . . . . . 60.4 63.6 65.2 67.0 69.3 71.5 0.6Electricity-Related Losses . . . . . . . . . . . 18.5 20.8 22.0 21.7 22.0 23.0 0.8
Total . . . . . . . . . . . . . . . . . . . . . . . . . . 78.9 84.4 87.2 88.7 91.3 94.5 0.7Electric Power a
Oil . . . . . . . . . . . . . . . . . . . . . . . . . . . . . 1.2 1.0 1.1 1.2 1.3 1.4 0.7Natural Gas . . . . . . . . . . . . . . . . . . . . . . 4.3 6.6 8.4 9.2 10.8 12.3 3.9Coal . . . . . . . . . . . . . . . . . . . . . . . . . . . . 9.1 9.1 9.0 9.0 8.8 9.2 0.0Nuclear . . . . . . . . . . . . . . . . . . . . . . . . . 9.8 9.5 9.3 8.5 7.9 7.5 -1.0Renewables. . . . . . . . . . . . . . . . . . . . . . 5.8 7.6 7.6 7.8 7.9 8.0 1.2
Total . . . . . . . . . . . . . . . . . . . . . . . . . . 30.2 33.8 35.4 35.7 36.8 38.3 0.9Total Energy Consumption
Oil . . . . . . . . . . . . . . . . . . . . . . . . . . . . . 32.0 32.6 32.8 32.5 33.0 33.5 0.2Natural Gas . . . . . . . . . . . . . . . . . . . . . . 18.3 21.7 24.5 26.6 29.0 31.6 2.0Coal . . . . . . . . . . . . . . . . . . . . . . . . . . . . 12.8 12.7 12.7 12.9 12.9 13.4 0.2Nuclear . . . . . . . . . . . . . . . . . . . . . . . . . 9.8 9.5 9.3 8.5 7.9 7.5 -1.0Renewables. . . . . . . . . . . . . . . . . . . . . . 6.0 7.9 8.0 8.3 8.4 8.5 1.3
Total . . . . . . . . . . . . . . . . . . . . . . . . . . 78.9 84.4 87.2 88.7 91.3 94.5 0.7aFuel inputs used in the production of electricity and heat at central-station generators.Sources: 2003: Derived from Energy Information Administration (EIA), International Energy Annual 2003 (May-July 2005), web site www.eia.
doe.gov/iea/. Projections: EIA, System for the Analysis of Global Energy Markets (2006).

Table D7. Delivered Energy Consumption in Japan by End-Use Sector and Fuel, 2003-2030(Quadrillion Btu)
Reference Case Projections by End-Use Sector and Region
Energy Information Administration / International Energy Outlook 2006 139
Sector/Fuel 2003
Projections Average AnnualPercent Change,
2003-20302010 2015 2020 2025 2030Residential
Oil . . . . . . . . . . . . . . . . . . . . . . . . . . . . . 0.7 0.6 0.6 0.6 0.6 0.6 -0.8Natural Gas . . . . . . . . . . . . . . . . . . . . . . 0.4 0.3 0.3 0.3 0.3 0.3 -0.5Coal . . . . . . . . . . . . . . . . . . . . . . . . . . . . 0.0 0.0 0.0 0.0 0.0 0.0 —Electricity . . . . . . . . . . . . . . . . . . . . . . . . 0.9 1.0 1.0 1.0 1.0 1.0 0.6Heat . . . . . . . . . . . . . . . . . . . . . . . . . . . . 0.0 0.0 0.0 0.0 0.0 0.0 -0.7Renewables. . . . . . . . . . . . . . . . . . . . . . 0.0 0.0 0.0 0.0 0.0 0.0 1.2
Total . . . . . . . . . . . . . . . . . . . . . . . . . . 2.0 2.0 2.0 2.0 2.0 2.0 -0.1Commercial
Oil . . . . . . . . . . . . . . . . . . . . . . . . . . . . . 1.1 1.0 1.0 1.0 1.0 1.0 -0.4Natural Gas . . . . . . . . . . . . . . . . . . . . . . 0.2 0.2 0.2 0.2 0.2 0.2 0.0Coal . . . . . . . . . . . . . . . . . . . . . . . . . . . . 0.0 0.0 0.0 0.0 0.0 0.0 -0.2Electricity . . . . . . . . . . . . . . . . . . . . . . . . 0.9 1.0 1.1 1.1 1.1 1.1 0.7Heat . . . . . . . . . . . . . . . . . . . . . . . . . . . . 0.0 0.0 0.0 0.0 0.0 0.0 0.0Renewables. . . . . . . . . . . . . . . . . . . . . . 0.0 0.0 0.0 0.0 0.0 0.0 3.2
Total . . . . . . . . . . . . . . . . . . . . . . . . . . 2.3 2.3 2.3 2.4 2.4 2.4 0.1Industrial
Oil . . . . . . . . . . . . . . . . . . . . . . . . . . . . . 4.4 4.5 4.6 4.7 4.8 4.7 0.2Natural Gas . . . . . . . . . . . . . . . . . . . . . . 0.5 0.5 0.6 0.6 0.6 0.6 1.0Coal . . . . . . . . . . . . . . . . . . . . . . . . . . . . 2.2 2.1 2.2 2.2 2.2 2.2 0.0Electricity . . . . . . . . . . . . . . . . . . . . . . . . 1.4 1.5 1.6 1.6 1.7 1.7 0.8Heat . . . . . . . . . . . . . . . . . . . . . . . . . . . . 0.0 0.0 0.0 0.0 0.0 0.0 —Renewables. . . . . . . . . . . . . . . . . . . . . . 0.1 0.0 0.0 0.0 0.0 0.0 -3.2
Total . . . . . . . . . . . . . . . . . . . . . . . . . . 8.5 8.7 9.0 9.1 9.2 9.2 0.3Transportation
Oil . . . . . . . . . . . . . . . . . . . . . . . . . . . . . 4.3 4.1 4.1 3.9 3.8 3.8 -0.4Natural Gas . . . . . . . . . . . . . . . . . . . . . . 0.0 0.0 0.0 0.0 0.0 0.0 —Coal . . . . . . . . . . . . . . . . . . . . . . . . . . . . 0.0 0.0 0.0 0.0 0.0 0.0 —Electricity . . . . . . . . . . . . . . . . . . . . . . . . 0.1 0.1 0.1 0.1 0.1 0.1 0.0Renewables. . . . . . . . . . . . . . . . . . . . . . 0.0 0.0 0.0 0.0 0.0 0.0 —
Total . . . . . . . . . . . . . . . . . . . . . . . . . . 4.3 4.2 4.2 4.0 3.9 3.9 -0.4All End-Use Sectors
Oil . . . . . . . . . . . . . . . . . . . . . . . . . . . . . 10.6 10.2 10.3 10.2 10.2 10.1 -0.2Natural Gas . . . . . . . . . . . . . . . . . . . . . . 1.1 1.1 1.1 1.1 1.2 1.2 0.3Coal . . . . . . . . . . . . . . . . . . . . . . . . . . . . 2.2 2.1 2.2 2.2 2.2 2.2 0.0Electricity . . . . . . . . . . . . . . . . . . . . . . . . 3.2 3.6 3.7 3.8 3.9 3.9 0.7Heat . . . . . . . . . . . . . . . . . . . . . . . . . . . . 0.0 0.0 0.0 0.0 0.0 0.0 1.2Renewables. . . . . . . . . . . . . . . . . . . . . . 0.1 0.1 0.1 0.1 0.1 0.1 -0.1
Delivered Energy . . . . . . . . . . . . . . . 17.2 17.2 17.5 17.4 17.5 17.5 0.1Electricity-Related Losses . . . . . . . . . . . 5.3 5.6 6.0 6.2 6.5 6.8 1.0
Total . . . . . . . . . . . . . . . . . . . . . . . . . . 22.4 22.7 23.4 23.6 24.0 24.3 0.3Electric Power a
Oil . . . . . . . . . . . . . . . . . . . . . . . . . . . . . 0.8 0.8 0.8 0.9 0.9 0.9 0.7Natural Gas . . . . . . . . . . . . . . . . . . . . . . 2.1 2.3 2.5 2.6 2.7 2.8 1.1Coal . . . . . . . . . . . . . . . . . . . . . . . . . . . . 1.9 2.0 2.0 1.9 1.8 1.8 -0.3Nuclear . . . . . . . . . . . . . . . . . . . . . . . . . 2.4 2.8 3.0 3.3 3.6 3.8 1.7Renewables. . . . . . . . . . . . . . . . . . . . . . 1.3 1.3 1.4 1.4 1.4 1.5 0.5
Total . . . . . . . . . . . . . . . . . . . . . . . . . . 8.5 9.2 9.7 10.1 10.4 10.8 0.9Total Energy Consumption
Oil . . . . . . . . . . . . . . . . . . . . . . . . . . . . . 11.3 11.0 11.1 11.0 11.1 11.1 -0.1Natural Gas . . . . . . . . . . . . . . . . . . . . . . 3.2 3.4 3.6 3.7 3.8 4.0 0.8Coal . . . . . . . . . . . . . . . . . . . . . . . . . . . . 4.1 4.1 4.2 4.1 4.0 4.0 -0.1Nuclear . . . . . . . . . . . . . . . . . . . . . . . . . 2.4 2.8 3.0 3.3 3.6 3.8 1.7Renewables. . . . . . . . . . . . . . . . . . . . . . 1.4 1.4 1.5 1.5 1.5 1.6 0.4
Total . . . . . . . . . . . . . . . . . . . . . . . . . . 22.4 22.7 23.4 23.6 24.0 24.3 0.3aFuel inputs used in the production of electricity and heat at central-station generators.Sources: 2003: Derived from Energy Information Administration (EIA), International Energy Annual 2003 (May-July 2005), web site www.eia.
doe.gov/iea/. Projections: EIA, System for the Analysis of Global Energy Markets (2006).

Table D8. Delivered Energy Consumption in South Korea by End-Use Sector and Fuel, 2003-2030(Quadrillion Btu)
Appendix D
140 Energy Information Administration / International Energy Outlook 2006
Sector/Fuel 2003
Projections Average AnnualPercent Change,
2003-20302010 2015 2020 2025 2030Residential
Oil . . . . . . . . . . . . . . . . . . . . . . . . . . . . . 0.2 0.2 0.2 0.2 0.2 0.2 0.2Natural Gas . . . . . . . . . . . . . . . . . . . . . . 0.4 0.4 0.4 0.4 0.4 0.4 0.7Coal . . . . . . . . . . . . . . . . . . . . . . . . . . . . 0.0 0.0 0.0 0.0 0.0 0.0 -1.7Electricity . . . . . . . . . . . . . . . . . . . . . . . . 0.1 0.2 0.2 0.3 0.3 0.3 2.7Heat . . . . . . . . . . . . . . . . . . . . . . . . . . . . 0.0 0.1 0.1 0.1 0.1 0.1 1.7Renewables. . . . . . . . . . . . . . . . . . . . . . 0.0 0.0 0.0 0.0 0.0 0.0 7.0
Total . . . . . . . . . . . . . . . . . . . . . . . . . . 0.8 0.8 0.9 0.9 1.0 1.0 1.1Commercial
Oil . . . . . . . . . . . . . . . . . . . . . . . . . . . . . 0.3 0.3 0.4 0.4 0.4 0.4 1.1Natural Gas . . . . . . . . . . . . . . . . . . . . . . 0.1 0.1 0.1 0.1 0.1 0.1 1.6Coal . . . . . . . . . . . . . . . . . . . . . . . . . . . . 0.0 0.0 0.0 0.0 0.0 0.0 —Electricity . . . . . . . . . . . . . . . . . . . . . . . . 0.3 0.5 0.5 0.5 0.6 0.6 2.5Heat . . . . . . . . . . . . . . . . . . . . . . . . . . . . 0.0 0.0 0.0 0.0 0.0 0.0 1.0Renewables. . . . . . . . . . . . . . . . . . . . . . 0.0 0.0 0.0 0.0 0.0 0.0 15.8
Total . . . . . . . . . . . . . . . . . . . . . . . . . . 0.7 0.9 1.0 1.0 1.1 1.1 1.8Industrial
Oil . . . . . . . . . . . . . . . . . . . . . . . . . . . . . 2.0 2.6 3.0 3.3 3.6 3.9 2.4Natural Gas . . . . . . . . . . . . . . . . . . . . . . 0.2 0.3 0.4 0.5 0.6 0.7 4.9Coal . . . . . . . . . . . . . . . . . . . . . . . . . . . . 0.8 0.8 0.9 0.9 1.0 1.1 1.2Electricity . . . . . . . . . . . . . . . . . . . . . . . . 0.6 0.8 0.9 1.0 1.1 1.2 2.9Heat . . . . . . . . . . . . . . . . . . . . . . . . . . . . 0.0 0.0 0.0 0.0 0.0 0.0 2.8Renewables. . . . . . . . . . . . . . . . . . . . . . 0.0 0.0 0.0 0.0 0.0 0.0 20.2
Total . . . . . . . . . . . . . . . . . . . . . . . . . . 3.5 4.4 5.2 5.8 6.3 6.9 2.5Transportation
Oil . . . . . . . . . . . . . . . . . . . . . . . . . . . . . 1.8 2.0 2.1 2.1 2.2 2.4 1.1Natural Gas . . . . . . . . . . . . . . . . . . . . . . 0.0 0.0 0.0 0.0 0.0 0.0 0.1Coal . . . . . . . . . . . . . . . . . . . . . . . . . . . . 0.0 0.0 0.0 0.0 0.0 0.0 —Electricity . . . . . . . . . . . . . . . . . . . . . . . . 0.0 0.0 0.0 0.0 0.0 0.0 0.8Renewables. . . . . . . . . . . . . . . . . . . . . . 0.0 0.0 0.0 0.0 0.1 0.1 32.3
Total . . . . . . . . . . . . . . . . . . . . . . . . . . 1.8 2.0 2.1 2.2 2.3 2.4 1.2All End-Use Sectors
Oil . . . . . . . . . . . . . . . . . . . . . . . . . . . . . 4.2 5.1 5.6 6.0 6.4 6.8 1.8Natural Gas . . . . . . . . . . . . . . . . . . . . . . 0.6 0.8 0.9 1.0 1.1 1.3 2.5Coal . . . . . . . . . . . . . . . . . . . . . . . . . . . . 0.8 0.8 0.9 0.9 1.0 1.1 1.2Electricity . . . . . . . . . . . . . . . . . . . . . . . . 1.0 1.4 1.7 1.8 2.0 2.1 2.7Heat . . . . . . . . . . . . . . . . . . . . . . . . . . . . 0.1 0.1 0.1 0.1 0.1 0.1 1.8Renewables. . . . . . . . . . . . . . . . . . . . . . 0.0 0.0 0.0 0.1 0.1 0.1 15.3
Delivered Energy . . . . . . . . . . . . . . . 6.8 8.2 9.2 9.9 10.7 11.5 2.0Electricity-Related Losses . . . . . . . . . . . 1.9 2.7 3.1 3.4 3.7 4.0 2.9
Total . . . . . . . . . . . . . . . . . . . . . . . . . . 8.6 10.9 12.3 13.3 14.4 15.5 2.2Electric Power a
Oil . . . . . . . . . . . . . . . . . . . . . . . . . . . . . 0.3 0.2 0.3 0.3 0.3 0.3 1.0Natural Gas . . . . . . . . . . . . . . . . . . . . . . 0.3 0.3 0.4 0.4 0.3 0.2 -1.1Coal . . . . . . . . . . . . . . . . . . . . . . . . . . . . 1.1 2.0 2.2 2.4 2.7 3.0 3.8Nuclear . . . . . . . . . . . . . . . . . . . . . . . . . 1.2 1.4 1.8 2.0 2.2 2.4 2.5Renewables. . . . . . . . . . . . . . . . . . . . . . 0.1 0.2 0.2 0.2 0.3 0.3 5.9
Total . . . . . . . . . . . . . . . . . . . . . . . . . . 3.0 4.2 4.9 5.3 5.8 6.2 2.8Total Energy Consumption
Oil . . . . . . . . . . . . . . . . . . . . . . . . . . . . . 4.5 5.3 5.9 6.3 6.7 7.2 1.7Natural Gas . . . . . . . . . . . . . . . . . . . . . . 1.0 1.1 1.3 1.4 1.5 1.5 1.7Coal . . . . . . . . . . . . . . . . . . . . . . . . . . . . 1.9 2.8 3.1 3.3 3.7 4.1 2.9Nuclear . . . . . . . . . . . . . . . . . . . . . . . . . 1.2 1.4 1.8 2.0 2.2 2.4 2.5Renewables. . . . . . . . . . . . . . . . . . . . . . 0.1 0.2 0.3 0.3 0.3 0.3 6.7
Total . . . . . . . . . . . . . . . . . . . . . . . . . . 8.6 10.9 12.3 13.3 14.4 15.5 2.2aFuel inputs used in the production of electricity and heat at central-station generators.Sources: 2003: Derived from Energy Information Administration (EIA), International Energy Annual 2003 (May-July 2005), web site www.eia.
doe.gov/iea/. Projections: EIA, System for the Analysis of Global Energy Markets (2006).

Table D9. Delivered Energy Consumption in Australia/New Zealand by End-Use Sector and Fuel, 2003-2030(Quadrillion Btu)
Reference Case Projections by End-Use Sector and Region
Energy Information Administration / International Energy Outlook 2006 141
Sector/Fuel 2003
Projections Average AnnualPercent Change,
2003-20302010 2015 2020 2025 2030Residential
Oil . . . . . . . . . . . . . . . . . . . . . . . . . . . . . 0.0 0.0 0.0 0.0 0.0 0.0 0.3Natural Gas . . . . . . . . . . . . . . . . . . . . . . 0.1 0.1 0.1 0.1 0.1 0.1 0.6Coal . . . . . . . . . . . . . . . . . . . . . . . . . . . . 0.0 0.0 0.0 0.0 0.0 0.0 -0.7Electricity . . . . . . . . . . . . . . . . . . . . . . . . 0.2 0.3 0.3 0.3 0.3 0.3 1.4Heat . . . . . . . . . . . . . . . . . . . . . . . . . . . . 0.0 0.0 0.0 0.0 0.0 0.0 —Renewables. . . . . . . . . . . . . . . . . . . . . . 0.0 0.0 0.0 0.0 0.0 0.0 2.2
Total . . . . . . . . . . . . . . . . . . . . . . . . . . 0.4 0.4 0.4 0.4 0.5 0.5 1.1Commercial
Oil . . . . . . . . . . . . . . . . . . . . . . . . . . . . . 0.0 0.0 0.0 0.0 0.0 0.0 0.3Natural Gas . . . . . . . . . . . . . . . . . . . . . . 0.0 0.0 0.1 0.1 0.1 0.1 0.6Coal . . . . . . . . . . . . . . . . . . . . . . . . . . . . 0.0 0.0 0.0 0.0 0.0 0.0 -0.3Electricity . . . . . . . . . . . . . . . . . . . . . . . . 0.2 0.2 0.3 0.3 0.3 0.3 1.8Heat . . . . . . . . . . . . . . . . . . . . . . . . . . . . 0.0 0.0 0.0 0.0 0.0 0.0 —Renewables. . . . . . . . . . . . . . . . . . . . . . 0.0 0.0 0.0 0.0 0.0 0.0 8.4
Total . . . . . . . . . . . . . . . . . . . . . . . . . . 0.3 0.3 0.3 0.4 0.4 0.4 1.4Industrial
Oil . . . . . . . . . . . . . . . . . . . . . . . . . . . . . 0.5 0.6 0.6 0.6 0.7 0.7 1.1Natural Gas . . . . . . . . . . . . . . . . . . . . . . 0.7 0.8 1.0 1.1 1.2 1.3 2.4Coal . . . . . . . . . . . . . . . . . . . . . . . . . . . . 0.2 0.3 0.4 0.4 0.5 0.5 2.7Electricity . . . . . . . . . . . . . . . . . . . . . . . . 0.4 0.4 0.5 0.5 0.5 0.6 1.4Heat . . . . . . . . . . . . . . . . . . . . . . . . . . . . 0.0 0.0 0.0 0.0 0.0 0.0 -1.5Renewables. . . . . . . . . . . . . . . . . . . . . . 0.0 0.0 0.0 0.0 0.0 0.0 -0.9
Total . . . . . . . . . . . . . . . . . . . . . . . . . . 1.9 2.1 2.4 2.6 2.9 3.1 1.9Transportation
Oil . . . . . . . . . . . . . . . . . . . . . . . . . . . . . 1.5 1.5 1.5 1.5 1.6 1.6 0.4Natural Gas . . . . . . . . . . . . . . . . . . . . . . 0.0 0.0 0.0 0.0 0.0 0.0 5.6Coal . . . . . . . . . . . . . . . . . . . . . . . . . . . . 0.0 0.0 0.0 0.0 0.0 0.0 —Electricity . . . . . . . . . . . . . . . . . . . . . . . . 0.0 0.0 0.0 0.0 0.0 0.0 0.9Renewables. . . . . . . . . . . . . . . . . . . . . . 0.0 0.0 0.0 0.0 0.0 0.0 —
Total . . . . . . . . . . . . . . . . . . . . . . . . . . 1.5 1.5 1.5 1.5 1.6 1.6 0.4All End-Use Sectors
Oil . . . . . . . . . . . . . . . . . . . . . . . . . . . . . 2.0 2.1 2.2 2.2 2.3 2.4 0.6Natural Gas . . . . . . . . . . . . . . . . . . . . . . 0.8 1.0 1.1 1.3 1.4 1.5 2.1Coal . . . . . . . . . . . . . . . . . . . . . . . . . . . . 0.3 0.3 0.4 0.4 0.5 0.5 2.6Electricity . . . . . . . . . . . . . . . . . . . . . . . . 0.8 0.9 1.0 1.1 1.1 1.2 1.5Heat . . . . . . . . . . . . . . . . . . . . . . . . . . . . 0.0 0.0 0.0 0.0 0.0 0.0 -1.5Renewables. . . . . . . . . . . . . . . . . . . . . . 0.0 0.0 0.0 0.0 0.0 0.0 3.2
Delivered Energy . . . . . . . . . . . . . . . 4.0 4.4 4.7 5.0 5.3 5.6 1.3Electricity-Related Losses . . . . . . . . . . . 2.0 2.3 2.3 2.4 2.5 2.6 0.9
Total . . . . . . . . . . . . . . . . . . . . . . . . . . 6.0 6.6 7.0 7.4 7.8 8.2 1.2Electric Power a
Oil . . . . . . . . . . . . . . . . . . . . . . . . . . . . . 0.0 0.0 0.0 0.0 0.0 0.0 6.4Natural Gas . . . . . . . . . . . . . . . . . . . . . . 0.3 0.2 0.2 0.3 0.2 0.3 0.1Coal . . . . . . . . . . . . . . . . . . . . . . . . . . . . 2.1 2.4 2.5 2.6 2.8 3.0 1.3Nuclear . . . . . . . . . . . . . . . . . . . . . . . . . 0.0 0.0 0.0 0.0 0.0 0.0 —Renewables. . . . . . . . . . . . . . . . . . . . . . 0.5 0.5 0.6 0.6 0.6 0.6 0.7
Total . . . . . . . . . . . . . . . . . . . . . . . . . . 2.9 3.2 3.3 3.5 3.7 3.9 1.1Total Energy Consumption
Oil . . . . . . . . . . . . . . . . . . . . . . . . . . . . . 2.0 2.1 2.2 2.3 2.3 2.4 0.6Natural Gas . . . . . . . . . . . . . . . . . . . . . . 1.1 1.2 1.4 1.5 1.6 1.7 1.7Coal . . . . . . . . . . . . . . . . . . . . . . . . . . . . 2.4 2.8 2.9 3.0 3.3 3.5 1.4Nuclear . . . . . . . . . . . . . . . . . . . . . . . . . 0.0 0.0 0.0 0.0 0.0 0.0 —Renewables. . . . . . . . . . . . . . . . . . . . . . 0.5 0.6 0.6 0.6 0.6 0.6 0.8
Total . . . . . . . . . . . . . . . . . . . . . . . . . . 6.0 6.6 7.0 7.4 7.8 8.2 1.2aFuel inputs used in the production of electricity and heat at central-station generators.Sources: 2003: Derived from Energy Information Administration (EIA), International Energy Annual 2003 (May-July 2005), web site www.eia.
doe.gov/iea/. Projections: EIA, System for the Analysis of Global Energy Markets (2006).

Table D10. Total Non-OECD Delivered Energy Consumption by End-Use Sector and Fuel, 2003-2030(Quadrillion Btu)
Appendix D
142 Energy Information Administration / International Energy Outlook 2006
Sector/Fuel 2003
Projections Average AnnualPercent Change,
2003-20302010 2015 2020 2025 2030Residential
Oil . . . . . . . . . . . . . . . . . . . . . . . . . . . . . 4.9 6.8 7.3 7.5 7.8 8.0 1.8Natural Gas . . . . . . . . . . . . . . . . . . . . . . 5.8 7.5 8.3 8.9 9.6 10.4 2.2Coal . . . . . . . . . . . . . . . . . . . . . . . . . . . . 2.3 4.0 3.9 3.7 3.6 3.5 1.5Electricity . . . . . . . . . . . . . . . . . . . . . . . . 4.7 8.4 10.5 12.6 14.8 17.3 4.9Heat . . . . . . . . . . . . . . . . . . . . . . . . . . . . 3.6 4.6 4.7 4.8 4.8 4.8 1.1Renewables. . . . . . . . . . . . . . . . . . . . . . 0.0 0.1 0.1 0.1 0.2 0.2 6.7
Total . . . . . . . . . . . . . . . . . . . . . . . . . . 21.4 31.4 34.9 37.6 40.9 44.3 2.7Commercial
Oil . . . . . . . . . . . . . . . . . . . . . . . . . . . . . 1.4 1.7 1.9 2.0 2.2 2.3 2.0Natural Gas . . . . . . . . . . . . . . . . . . . . . . 1.0 1.3 1.5 1.6 1.7 1.8 2.2Coal . . . . . . . . . . . . . . . . . . . . . . . . . . . . 0.4 0.7 0.8 0.8 0.8 0.8 2.4Electricity . . . . . . . . . . . . . . . . . . . . . . . . 2.8 4.5 5.6 6.6 7.7 8.8 4.3Heat . . . . . . . . . . . . . . . . . . . . . . . . . . . . 0.5 0.5 0.5 0.5 0.5 0.5 0.3Renewables. . . . . . . . . . . . . . . . . . . . . . 0.0 0.0 0.0 0.0 0.0 0.0 16.3
Total . . . . . . . . . . . . . . . . . . . . . . . . . . 6.1 8.8 10.3 11.6 12.9 14.3 3.2Industrial
Oil . . . . . . . . . . . . . . . . . . . . . . . . . . . . . 25.2 31.2 35.9 40.4 44.2 48.0 2.4Natural Gas . . . . . . . . . . . . . . . . . . . . . . 23.1 32.5 39.2 45.8 52.8 60.0 3.6Coal . . . . . . . . . . . . . . . . . . . . . . . . . . . . 21.0 30.3 36.7 42.5 48.3 54.9 3.6Electricity . . . . . . . . . . . . . . . . . . . . . . . . 12.4 17.0 20.3 23.8 27.3 31.0 3.5Heat . . . . . . . . . . . . . . . . . . . . . . . . . . . . 4.8 4.0 4.6 5.3 6.0 6.8 1.3Renewables. . . . . . . . . . . . . . . . . . . . . . 0.1 0.1 0.1 0.1 0.1 0.1 2.2
Total . . . . . . . . . . . . . . . . . . . . . . . . . . 86.5 115.1 136.9 157.9 178.7 200.7 3.2Transportation
Oil . . . . . . . . . . . . . . . . . . . . . . . . . . . . . 27.7 34.2 37.7 41.1 45.8 51.5 2.3Natural Gas . . . . . . . . . . . . . . . . . . . . . . 0.2 0.2 0.2 0.2 0.2 0.3 1.5Coal . . . . . . . . . . . . . . . . . . . . . . . . . . . . 0.2 0.3 0.3 0.2 0.2 0.1 -1.6Electricity . . . . . . . . . . . . . . . . . . . . . . . . 0.4 0.5 0.5 0.5 0.6 0.6 1.3Renewables. . . . . . . . . . . . . . . . . . . . . . 0.4 0.6 0.7 0.7 0.8 0.9 2.5
Total . . . . . . . . . . . . . . . . . . . . . . . . . . 28.9 35.7 39.3 42.8 47.6 53.3 2.3All End-Use Sectors
Oil . . . . . . . . . . . . . . . . . . . . . . . . . . . . . 59.2 73.9 82.8 91.0 100.0 109.8 2.3Natural Gas . . . . . . . . . . . . . . . . . . . . . . 30.0 41.5 49.1 56.5 64.3 72.5 3.3Coal . . . . . . . . . . . . . . . . . . . . . . . . . . . . 24.0 35.3 41.7 47.3 52.9 59.3 3.4Electricity . . . . . . . . . . . . . . . . . . . . . . . . 20.3 30.4 36.9 43.5 50.4 57.7 3.9Heat . . . . . . . . . . . . . . . . . . . . . . . . . . . . 8.9 9.1 9.9 10.6 11.3 12.1 1.2Renewables. . . . . . . . . . . . . . . . . . . . . . 0.5 0.8 0.9 1.0 1.1 1.2 3.0
Delivered Energy . . . . . . . . . . . . . . . 142.9 191.0 221.4 249.9 280.0 312.7 2.9Electricity-Related Losses . . . . . . . . . . . 43.6 62.6 72.1 81.6 90.9 100.1 3.1
Total . . . . . . . . . . . . . . . . . . . . . . . . . . 186.5 253.6 293.5 331.5 371.0 412.8 3.0Electric Power a
Oil . . . . . . . . . . . . . . . . . . . . . . . . . . . . . 5.9 8.4 8.8 9.4 9.8 10.2 2.0Natural Gas . . . . . . . . . . . . . . . . . . . . . . 17.2 21.7 26.0 30.6 35.3 40.6 3.2Coal . . . . . . . . . . . . . . . . . . . . . . . . . . . . 30.8 43.8 51.2 58.4 65.5 73.1 3.3Nuclear . . . . . . . . . . . . . . . . . . . . . . . . . 4.2 5.5 7.0 8.7 10.0 10.6 3.5Renewables. . . . . . . . . . . . . . . . . . . . . . 14.7 22.8 25.9 28.6 32.0 35.5 3.3
Total . . . . . . . . . . . . . . . . . . . . . . . . . . 72.8 102.1 118.9 135.7 152.6 170.0 3.2Total Energy Consumption
Oil . . . . . . . . . . . . . . . . . . . . . . . . . . . . . 65.1 82.3 91.6 100.4 109.8 120.0 2.3Natural Gas . . . . . . . . . . . . . . . . . . . . . . 47.2 63.1 75.1 87.0 99.6 113.1 3.3Coal . . . . . . . . . . . . . . . . . . . . . . . . . . . . 54.8 79.1 92.9 105.7 118.4 132.4 3.3Nuclear . . . . . . . . . . . . . . . . . . . . . . . . . 4.2 5.5 7.0 8.7 10.0 10.6 3.5Renewables. . . . . . . . . . . . . . . . . . . . . . 15.2 23.6 26.8 29.6 33.1 36.7 3.3
Total . . . . . . . . . . . . . . . . . . . . . . . . . . 186.5 253.6 293.5 331.5 371.0 412.8 3.0aFuel inputs used in the production of electricity and heat at central-station generators.Sources: 2003: Derived from Energy Information Administration (EIA), International Energy Annual 2003 (May-July 2005), web site www.eia.
doe.gov/iea/. Projections: EIA, System for the Analysis of Global Energy Markets (2006).

Table D11. Delivered Energy Consumption in Russia by End-Use Sector and Fuel, 2003-2030(Quadrillion Btu)
Reference Case Projections by End-Use Sector and Region
Energy Information Administration / International Energy Outlook 2006 143
Sector/Fuel 2003
Projections Average AnnualPercent Change,
2003-20302010 2015 2020 2025 2030Residential
Oil . . . . . . . . . . . . . . . . . . . . . . . . . . . . . 0.2 0.1 0.2 0.2 0.2 0.2 0.1Natural Gas . . . . . . . . . . . . . . . . . . . . . . 2.1 2.1 2.2 2.3 2.4 2.5 0.7Coal . . . . . . . . . . . . . . . . . . . . . . . . . . . . 0.2 0.2 0.2 0.2 0.2 0.2 -0.6Electricity . . . . . . . . . . . . . . . . . . . . . . . . 0.5 0.6 0.7 0.8 0.9 0.9 1.9Heat . . . . . . . . . . . . . . . . . . . . . . . . . . . . 2.8 3.3 3.4 3.4 3.5 3.4 0.8Renewables. . . . . . . . . . . . . . . . . . . . . . 0.0 0.0 0.0 0.0 0.0 0.0 —
Total . . . . . . . . . . . . . . . . . . . . . . . . . . 5.8 6.4 6.7 6.9 7.1 7.2 0.8Commercial
Oil . . . . . . . . . . . . . . . . . . . . . . . . . . . . . 0.0 0.0 0.0 0.0 0.0 0.0 -0.4Natural Gas . . . . . . . . . . . . . . . . . . . . . . 0.1 0.1 0.1 0.1 0.1 0.1 0.7Coal . . . . . . . . . . . . . . . . . . . . . . . . . . . . 0.0 0.0 0.0 0.0 0.0 0.0 -0.4Electricity . . . . . . . . . . . . . . . . . . . . . . . . 0.3 0.3 0.3 0.4 0.4 0.4 2.0Heat . . . . . . . . . . . . . . . . . . . . . . . . . . . . 0.4 0.4 0.4 0.4 0.4 0.4 0.2Renewables. . . . . . . . . . . . . . . . . . . . . . 0.0 0.0 0.0 0.0 0.0 0.0 —
Total . . . . . . . . . . . . . . . . . . . . . . . . . . 0.8 0.9 1.0 1.0 1.0 1.1 0.9Industrial
Oil . . . . . . . . . . . . . . . . . . . . . . . . . . . . . 2.8 2.9 3.1 3.2 3.3 3.4 0.7Natural Gas . . . . . . . . . . . . . . . . . . . . . . 8.0 9.1 9.7 10.7 11.5 12.2 1.5Coal . . . . . . . . . . . . . . . . . . . . . . . . . . . . 2.0 1.7 2.2 2.5 2.7 3.0 1.5Electricity . . . . . . . . . . . . . . . . . . . . . . . . 1.8 2.5 2.9 3.4 3.7 4.1 3.1Heat . . . . . . . . . . . . . . . . . . . . . . . . . . . . 2.7 1.7 1.9 2.0 2.2 2.4 -0.4Renewables. . . . . . . . . . . . . . . . . . . . . . 0.0 0.0 0.0 0.0 0.0 0.0 4.3
Total . . . . . . . . . . . . . . . . . . . . . . . . . . 17.3 18.0 19.9 21.8 23.6 25.0 1.4Transportation
Oil . . . . . . . . . . . . . . . . . . . . . . . . . . . . . 2.2 2.5 2.7 2.8 2.9 3.1 1.3Natural Gas . . . . . . . . . . . . . . . . . . . . . . 0.0 0.0 0.0 0.0 0.0 0.0 8.3Coal . . . . . . . . . . . . . . . . . . . . . . . . . . . . 0.0 0.0 0.0 0.0 0.0 0.0 —Electricity . . . . . . . . . . . . . . . . . . . . . . . . 0.2 0.2 0.2 0.2 0.2 0.2 0.1Renewables. . . . . . . . . . . . . . . . . . . . . . 0.0 0.0 0.0 0.0 0.0 0.0 —
Total . . . . . . . . . . . . . . . . . . . . . . . . . . 2.4 2.7 2.9 3.0 3.2 3.3 1.3All End-Use Sectors
Oil . . . . . . . . . . . . . . . . . . . . . . . . . . . . . 5.2 5.6 6.0 6.1 6.5 6.7 0.9Natural Gas . . . . . . . . . . . . . . . . . . . . . . 10.2 11.3 12.0 13.2 14.1 14.8 1.4Coal . . . . . . . . . . . . . . . . . . . . . . . . . . . . 2.2 1.9 2.4 2.7 2.9 3.2 1.4Electricity . . . . . . . . . . . . . . . . . . . . . . . . 2.8 3.7 4.2 4.8 5.2 5.6 2.6Heat . . . . . . . . . . . . . . . . . . . . . . . . . . . . 5.9 5.5 5.8 5.9 6.1 6.3 0.3Renewables. . . . . . . . . . . . . . . . . . . . . . 0.0 0.0 0.0 0.0 0.0 0.0 6.5
Delivered Energy . . . . . . . . . . . . . . . 26.3 27.9 30.4 32.6 34.8 36.7 1.2Electricity-Related Losses . . . . . . . . . . . 2.8 5.4 6.1 7.0 7.6 8.2 4.1
Total . . . . . . . . . . . . . . . . . . . . . . . . . . 29.1 33.3 36.5 39.6 42.4 44.8 1.6Electric Power a
Oil . . . . . . . . . . . . . . . . . . . . . . . . . . . . . 0.3 0.3 0.3 0.3 0.3 0.3 -0.3Natural Gas . . . . . . . . . . . . . . . . . . . . . . 5.5 7.3 7.7 8.6 8.9 9.4 2.1Coal . . . . . . . . . . . . . . . . . . . . . . . . . . . . 2.4 2.9 3.1 3.4 3.6 3.8 1.8Nuclear . . . . . . . . . . . . . . . . . . . . . . . . . 1.5 1.7 2.1 2.6 3.1 3.5 3.2Renewables. . . . . . . . . . . . . . . . . . . . . . 1.8 2.4 2.9 2.8 3.0 3.0 2.0
Total . . . . . . . . . . . . . . . . . . . . . . . . . . 11.4 14.6 16.1 17.7 18.9 20.1 2.1Total Energy Consumption
Oil . . . . . . . . . . . . . . . . . . . . . . . . . . . . . 5.5 5.9 6.3 6.4 6.7 7.0 0.9Natural Gas . . . . . . . . . . . . . . . . . . . . . . 15.7 18.5 19.8 21.7 23.0 24.2 1.6Coal . . . . . . . . . . . . . . . . . . . . . . . . . . . . 4.6 4.8 5.4 6.1 6.5 7.0 1.6Nuclear . . . . . . . . . . . . . . . . . . . . . . . . . 1.5 1.7 2.1 2.6 3.1 3.5 3.2Renewables. . . . . . . . . . . . . . . . . . . . . . 1.8 2.4 2.9 2.9 3.0 3.1 2.0
Total . . . . . . . . . . . . . . . . . . . . . . . . . . 29.1 33.3 36.5 39.6 42.4 44.8 1.6aFuel inputs used in the production of electricity and heat at central-station generators.Sources: 2003: Derived from Energy Information Administration (EIA), International Energy Annual 2003 (May-July 2005), web site www.eia.
doe.gov/iea/. Projections: EIA, System for the Analysis of Global Energy Markets (2006).
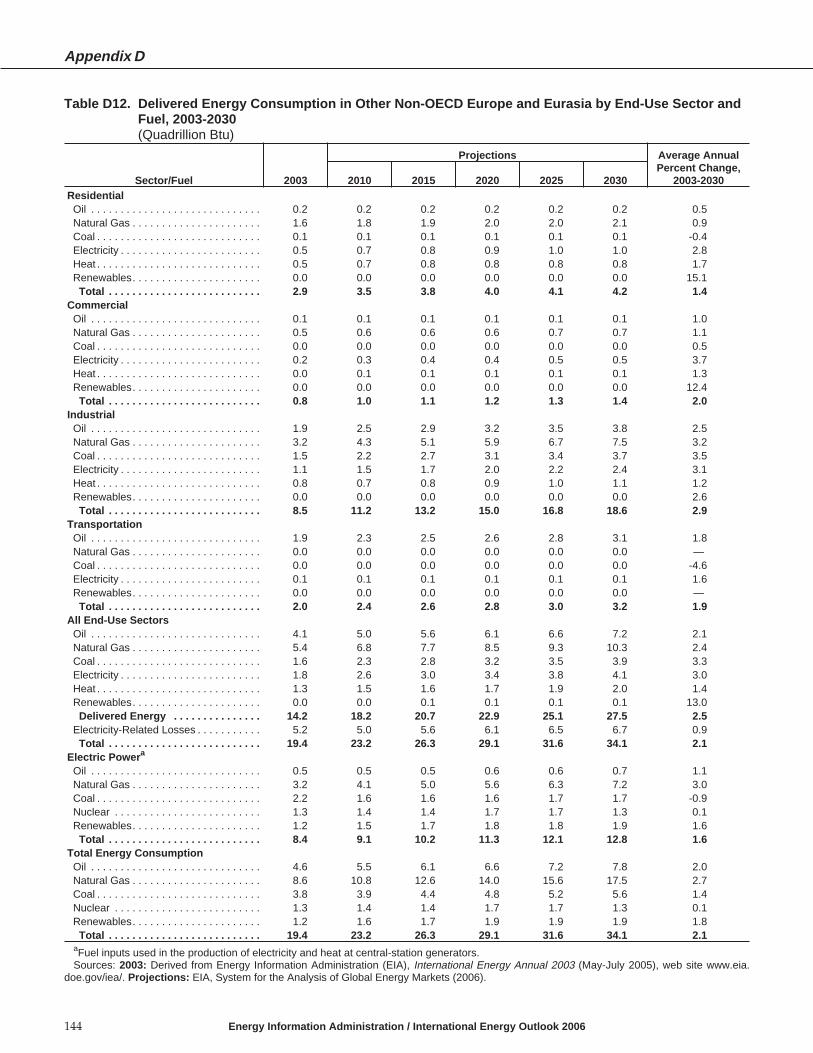
Table D12. Delivered Energy Consumption in Other Non-OECD Europe and Eurasia by End-Use Sector andFuel, 2003-2030(Quadrillion Btu)
Appendix D
144 Energy Information Administration / International Energy Outlook 2006
Sector/Fuel 2003
Projections Average AnnualPercent Change,
2003-20302010 2015 2020 2025 2030Residential
Oil . . . . . . . . . . . . . . . . . . . . . . . . . . . . . 0.2 0.2 0.2 0.2 0.2 0.2 0.5Natural Gas . . . . . . . . . . . . . . . . . . . . . . 1.6 1.8 1.9 2.0 2.0 2.1 0.9Coal . . . . . . . . . . . . . . . . . . . . . . . . . . . . 0.1 0.1 0.1 0.1 0.1 0.1 -0.4Electricity . . . . . . . . . . . . . . . . . . . . . . . . 0.5 0.7 0.8 0.9 1.0 1.0 2.8Heat . . . . . . . . . . . . . . . . . . . . . . . . . . . . 0.5 0.7 0.8 0.8 0.8 0.8 1.7Renewables. . . . . . . . . . . . . . . . . . . . . . 0.0 0.0 0.0 0.0 0.0 0.0 15.1
Total . . . . . . . . . . . . . . . . . . . . . . . . . . 2.9 3.5 3.8 4.0 4.1 4.2 1.4Commercial
Oil . . . . . . . . . . . . . . . . . . . . . . . . . . . . . 0.1 0.1 0.1 0.1 0.1 0.1 1.0Natural Gas . . . . . . . . . . . . . . . . . . . . . . 0.5 0.6 0.6 0.6 0.7 0.7 1.1Coal . . . . . . . . . . . . . . . . . . . . . . . . . . . . 0.0 0.0 0.0 0.0 0.0 0.0 0.5Electricity . . . . . . . . . . . . . . . . . . . . . . . . 0.2 0.3 0.4 0.4 0.5 0.5 3.7Heat . . . . . . . . . . . . . . . . . . . . . . . . . . . . 0.0 0.1 0.1 0.1 0.1 0.1 1.3Renewables. . . . . . . . . . . . . . . . . . . . . . 0.0 0.0 0.0 0.0 0.0 0.0 12.4
Total . . . . . . . . . . . . . . . . . . . . . . . . . . 0.8 1.0 1.1 1.2 1.3 1.4 2.0Industrial
Oil . . . . . . . . . . . . . . . . . . . . . . . . . . . . . 1.9 2.5 2.9 3.2 3.5 3.8 2.5Natural Gas . . . . . . . . . . . . . . . . . . . . . . 3.2 4.3 5.1 5.9 6.7 7.5 3.2Coal . . . . . . . . . . . . . . . . . . . . . . . . . . . . 1.5 2.2 2.7 3.1 3.4 3.7 3.5Electricity . . . . . . . . . . . . . . . . . . . . . . . . 1.1 1.5 1.7 2.0 2.2 2.4 3.1Heat . . . . . . . . . . . . . . . . . . . . . . . . . . . . 0.8 0.7 0.8 0.9 1.0 1.1 1.2Renewables. . . . . . . . . . . . . . . . . . . . . . 0.0 0.0 0.0 0.0 0.0 0.0 2.6
Total . . . . . . . . . . . . . . . . . . . . . . . . . . 8.5 11.2 13.2 15.0 16.8 18.6 2.9Transportation
Oil . . . . . . . . . . . . . . . . . . . . . . . . . . . . . 1.9 2.3 2.5 2.6 2.8 3.1 1.8Natural Gas . . . . . . . . . . . . . . . . . . . . . . 0.0 0.0 0.0 0.0 0.0 0.0 —Coal . . . . . . . . . . . . . . . . . . . . . . . . . . . . 0.0 0.0 0.0 0.0 0.0 0.0 -4.6Electricity . . . . . . . . . . . . . . . . . . . . . . . . 0.1 0.1 0.1 0.1 0.1 0.1 1.6Renewables. . . . . . . . . . . . . . . . . . . . . . 0.0 0.0 0.0 0.0 0.0 0.0 —
Total . . . . . . . . . . . . . . . . . . . . . . . . . . 2.0 2.4 2.6 2.8 3.0 3.2 1.9All End-Use Sectors
Oil . . . . . . . . . . . . . . . . . . . . . . . . . . . . . 4.1 5.0 5.6 6.1 6.6 7.2 2.1Natural Gas . . . . . . . . . . . . . . . . . . . . . . 5.4 6.8 7.7 8.5 9.3 10.3 2.4Coal . . . . . . . . . . . . . . . . . . . . . . . . . . . . 1.6 2.3 2.8 3.2 3.5 3.9 3.3Electricity . . . . . . . . . . . . . . . . . . . . . . . . 1.8 2.6 3.0 3.4 3.8 4.1 3.0Heat . . . . . . . . . . . . . . . . . . . . . . . . . . . . 1.3 1.5 1.6 1.7 1.9 2.0 1.4Renewables. . . . . . . . . . . . . . . . . . . . . . 0.0 0.0 0.1 0.1 0.1 0.1 13.0
Delivered Energy . . . . . . . . . . . . . . . 14.2 18.2 20.7 22.9 25.1 27.5 2.5Electricity-Related Losses . . . . . . . . . . . 5.2 5.0 5.6 6.1 6.5 6.7 0.9
Total . . . . . . . . . . . . . . . . . . . . . . . . . . 19.4 23.2 26.3 29.1 31.6 34.1 2.1Electric Power a
Oil . . . . . . . . . . . . . . . . . . . . . . . . . . . . . 0.5 0.5 0.5 0.6 0.6 0.7 1.1Natural Gas . . . . . . . . . . . . . . . . . . . . . . 3.2 4.1 5.0 5.6 6.3 7.2 3.0Coal . . . . . . . . . . . . . . . . . . . . . . . . . . . . 2.2 1.6 1.6 1.6 1.7 1.7 -0.9Nuclear . . . . . . . . . . . . . . . . . . . . . . . . . 1.3 1.4 1.4 1.7 1.7 1.3 0.1Renewables. . . . . . . . . . . . . . . . . . . . . . 1.2 1.5 1.7 1.8 1.8 1.9 1.6
Total . . . . . . . . . . . . . . . . . . . . . . . . . . 8.4 9.1 10.2 11.3 12.1 12.8 1.6Total Energy Consumption
Oil . . . . . . . . . . . . . . . . . . . . . . . . . . . . . 4.6 5.5 6.1 6.6 7.2 7.8 2.0Natural Gas . . . . . . . . . . . . . . . . . . . . . . 8.6 10.8 12.6 14.0 15.6 17.5 2.7Coal . . . . . . . . . . . . . . . . . . . . . . . . . . . . 3.8 3.9 4.4 4.8 5.2 5.6 1.4Nuclear . . . . . . . . . . . . . . . . . . . . . . . . . 1.3 1.4 1.4 1.7 1.7 1.3 0.1Renewables. . . . . . . . . . . . . . . . . . . . . . 1.2 1.6 1.7 1.9 1.9 1.9 1.8
Total . . . . . . . . . . . . . . . . . . . . . . . . . . 19.4 23.2 26.3 29.1 31.6 34.1 2.1aFuel inputs used in the production of electricity and heat at central-station generators.Sources: 2003: Derived from Energy Information Administration (EIA), International Energy Annual 2003 (May-July 2005), web site www.eia.
doe.gov/iea/. Projections: EIA, System for the Analysis of Global Energy Markets (2006).

Table D13. Delivered Energy Consumption in China by End-Use Sector and Fuel, 2003-2030(Quadrillion Btu)
Reference Case Projections by End-Use Sector and Region
Energy Information Administration / International Energy Outlook 2006 145
Sector/Fuel 2003
Projections Average AnnualPercent Change,
2003-20302010 2015 2020 2025 2030Residential
Oil . . . . . . . . . . . . . . . . . . . . . . . . . . . . . 0.7 1.1 1.2 1.3 1.4 1.5 2.8Natural Gas . . . . . . . . . . . . . . . . . . . . . . 0.4 0.9 1.3 1.6 1.9 2.3 7.1Coal . . . . . . . . . . . . . . . . . . . . . . . . . . . . 1.6 3.1 3.0 2.7 2.6 2.4 1.5Electricity . . . . . . . . . . . . . . . . . . . . . . . . 0.8 2.0 2.7 3.5 4.4 5.6 7.4Heat . . . . . . . . . . . . . . . . . . . . . . . . . . . . 0.3 0.5 0.5 0.5 0.5 0.5 2.0Renewables. . . . . . . . . . . . . . . . . . . . . . 0.0 0.0 0.0 0.0 0.0 0.0 —
Total . . . . . . . . . . . . . . . . . . . . . . . . . . 3.8 7.6 8.7 9.6 10.8 12.3 4.5Commercial
Oil . . . . . . . . . . . . . . . . . . . . . . . . . . . . . 0.7 0.9 1.0 1.0 1.1 1.1 1.7Natural Gas . . . . . . . . . . . . . . . . . . . . . . 0.0 0.1 0.1 0.2 0.2 0.2 6.4Coal . . . . . . . . . . . . . . . . . . . . . . . . . . . . 0.2 0.3 0.3 0.3 0.3 0.3 1.6Electricity . . . . . . . . . . . . . . . . . . . . . . . . 0.4 0.9 1.1 1.3 1.5 1.8 5.5Heat . . . . . . . . . . . . . . . . . . . . . . . . . . . . 0.0 0.0 0.0 0.0 0.0 0.0 -0.5Renewables. . . . . . . . . . . . . . . . . . . . . . 0.0 0.0 0.0 0.0 0.0 0.0 —
Total . . . . . . . . . . . . . . . . . . . . . . . . . . 1.4 2.2 2.5 2.8 3.2 3.6 3.5Industrial
Oil . . . . . . . . . . . . . . . . . . . . . . . . . . . . . 5.3 7.5 9.5 11.7 13.5 15.5 4.1Natural Gas . . . . . . . . . . . . . . . . . . . . . . 0.8 2.0 2.6 3.2 3.8 4.5 6.7Coal . . . . . . . . . . . . . . . . . . . . . . . . . . . . 11.2 18.6 23.1 27.3 31.4 36.5 4.5Electricity . . . . . . . . . . . . . . . . . . . . . . . . 4.4 6.6 8.1 9.6 11.2 12.8 4.0Heat . . . . . . . . . . . . . . . . . . . . . . . . . . . . 1.3 1.5 1.9 2.3 2.8 3.3 3.5Renewables. . . . . . . . . . . . . . . . . . . . . . 0.0 0.0 0.0 0.0 0.0 0.0 —
Total . . . . . . . . . . . . . . . . . . . . . . . . . . 22.9 36.3 45.2 54.1 62.7 72.6 4.4Transportation
Oil . . . . . . . . . . . . . . . . . . . . . . . . . . . . . 4.1 6.2 7.4 8.8 10.5 12.5 4.2Natural Gas . . . . . . . . . . . . . . . . . . . . . . 0.0 0.0 0.0 0.0 0.0 0.0 5.6Coal . . . . . . . . . . . . . . . . . . . . . . . . . . . . 0.2 0.3 0.3 0.2 0.2 0.1 -1.6Electricity . . . . . . . . . . . . . . . . . . . . . . . . 0.1 0.1 0.1 0.1 0.1 0.1 3.1Renewables. . . . . . . . . . . . . . . . . . . . . . 0.0 0.0 0.0 0.0 0.0 0.0 —
Total . . . . . . . . . . . . . . . . . . . . . . . . . . 4.4 6.6 7.8 9.2 10.9 12.9 4.1All End-Use Sectors
Oil . . . . . . . . . . . . . . . . . . . . . . . . . . . . . 10.8 15.7 19.1 22.8 26.5 30.7 3.9Natural Gas . . . . . . . . . . . . . . . . . . . . . . 1.2 3.1 4.0 4.9 6.0 7.1 6.8Coal . . . . . . . . . . . . . . . . . . . . . . . . . . . . 13.2 22.2 26.6 30.5 34.5 39.3 4.1Electricity . . . . . . . . . . . . . . . . . . . . . . . . 5.7 9.5 12.0 14.5 17.3 20.4 4.8Heat . . . . . . . . . . . . . . . . . . . . . . . . . . . . 1.6 2.0 2.4 2.9 3.3 3.8 3.2Renewables. . . . . . . . . . . . . . . . . . . . . . 0.0 0.0 0.1 0.1 0.1 0.1 —
Delivered Energy . . . . . . . . . . . . . . . 32.5 52.6 64.1 75.7 87.6 101.4 4.3Electricity-Related Losses . . . . . . . . . . . 13.0 24.4 27.7 30.9 34.1 37.7 4.0
Total . . . . . . . . . . . . . . . . . . . . . . . . . . 45.5 77.0 91.8 106.6 121.7 139.1 4.2Electric Power a
Oil . . . . . . . . . . . . . . . . . . . . . . . . . . . . . 0.5 2.0 1.4 1.1 0.7 0.2 -4.3Natural Gas . . . . . . . . . . . . . . . . . . . . . . 0.2 0.4 0.6 1.0 1.2 1.0 7.0Coal . . . . . . . . . . . . . . . . . . . . . . . . . . . . 16.3 26.6 32.0 37.4 43.3 50.1 4.2Nuclear . . . . . . . . . . . . . . . . . . . . . . . . . 0.4 0.8 1.3 1.7 2.3 3.1 7.6Renewables. . . . . . . . . . . . . . . . . . . . . . 2.9 6.1 6.8 7.0 7.2 7.5 3.6
Total . . . . . . . . . . . . . . . . . . . . . . . . . . 20.3 35.9 42.1 48.2 54.7 61.9 4.2Total Energy Consumption
Oil . . . . . . . . . . . . . . . . . . . . . . . . . . . . . 11.4 17.8 20.5 23.9 27.2 30.9 3.8Natural Gas . . . . . . . . . . . . . . . . . . . . . . 1.4 3.5 4.6 5.9 7.2 8.2 6.8Coal . . . . . . . . . . . . . . . . . . . . . . . . . . . . 29.5 48.8 58.6 67.9 77.8 89.4 4.2Nuclear . . . . . . . . . . . . . . . . . . . . . . . . . 0.4 0.8 1.3 1.7 2.3 3.1 7.6Renewables. . . . . . . . . . . . . . . . . . . . . . 2.9 6.1 6.8 7.1 7.3 7.6 3.7
Total . . . . . . . . . . . . . . . . . . . . . . . . . . 45.5 77.0 91.8 106.6 121.7 139.1 4.2aFuel inputs used in the production of electricity and heat at central-station generators.Sources: 2003: Derived from Energy Information Administration (EIA), International Energy Annual 2003 (May-July 2005), web site www.eia.
doe.gov/iea/. Projections: EIA, System for the Analysis of Global Energy Markets (2006).

Table D14. Delivered Energy Consumption in India by End-Use Sector and Fuel, 2003-2030(Quadrillion Btu)
Appendix D
146 Energy Information Administration / International Energy Outlook 2006
Sector/Fuel 2003
Projections Average AnnualPercent Change,
2003-20302010 2015 2020 2025 2030Residential
Oil . . . . . . . . . . . . . . . . . . . . . . . . . . . . . 1.0 1.3 1.4 1.4 1.4 1.4 1.2Natural Gas . . . . . . . . . . . . . . . . . . . . . . 0.0 0.0 0.1 0.1 0.1 0.1 4.9Coal . . . . . . . . . . . . . . . . . . . . . . . . . . . . 0.2 0.4 0.4 0.4 0.5 0.5 2.9Electricity . . . . . . . . . . . . . . . . . . . . . . . . 0.4 0.8 1.0 1.3 1.5 1.8 5.9Heat . . . . . . . . . . . . . . . . . . . . . . . . . . . . 0.0 0.0 0.0 0.0 0.0 0.0 —Renewables. . . . . . . . . . . . . . . . . . . . . . 0.0 0.0 0.0 0.0 0.0 0.0 —
Total . . . . . . . . . . . . . . . . . . . . . . . . . . 1.7 2.6 2.9 3.2 3.5 3.8 3.1Commercial
Oil . . . . . . . . . . . . . . . . . . . . . . . . . . . . . 0.0 0.0 0.0 0.0 0.0 0.0 —Natural Gas . . . . . . . . . . . . . . . . . . . . . . 0.0 0.0 0.0 0.0 0.0 0.0 —Coal . . . . . . . . . . . . . . . . . . . . . . . . . . . . 0.1 0.3 0.4 0.4 0.4 0.3 3.6Electricity . . . . . . . . . . . . . . . . . . . . . . . . 0.3 0.7 0.9 1.0 1.2 1.5 6.0Heat . . . . . . . . . . . . . . . . . . . . . . . . . . . . 0.0 0.0 0.0 0.0 0.0 0.0 —Renewables. . . . . . . . . . . . . . . . . . . . . . 0.0 0.0 0.0 0.0 0.0 0.0 —
Total . . . . . . . . . . . . . . . . . . . . . . . . . . 0.4 1.0 1.2 1.4 1.6 1.8 5.4Industrial
Oil . . . . . . . . . . . . . . . . . . . . . . . . . . . . . 2.2 2.8 3.3 3.7 4.2 4.6 2.7Natural Gas . . . . . . . . . . . . . . . . . . . . . . 0.6 0.7 0.9 1.2 1.6 2.0 4.8Coal . . . . . . . . . . . . . . . . . . . . . . . . . . . . 1.9 2.3 2.6 3.1 3.5 3.8 2.7Electricity . . . . . . . . . . . . . . . . . . . . . . . . 1.0 1.3 1.6 1.9 2.2 2.6 3.4Heat . . . . . . . . . . . . . . . . . . . . . . . . . . . . 0.0 0.0 0.0 0.0 0.0 0.0 —Renewables. . . . . . . . . . . . . . . . . . . . . . 0.0 0.0 0.0 0.0 0.0 0.0 13.8
Total . . . . . . . . . . . . . . . . . . . . . . . . . . 5.7 7.1 8.4 9.9 11.5 13.0 3.1Transportation
Oil . . . . . . . . . . . . . . . . . . . . . . . . . . . . . 1.4 1.8 2.0 2.3 2.6 2.9 2.8Natural Gas . . . . . . . . . . . . . . . . . . . . . . 0.0 0.0 0.0 0.0 0.0 0.0 —Coal . . . . . . . . . . . . . . . . . . . . . . . . . . . . 0.0 0.0 0.0 0.0 0.0 0.0 —Electricity . . . . . . . . . . . . . . . . . . . . . . . . 0.0 0.1 0.1 0.1 0.1 0.1 2.3Renewables. . . . . . . . . . . . . . . . . . . . . . 0.0 0.0 0.0 0.0 0.0 0.0 —
Total . . . . . . . . . . . . . . . . . . . . . . . . . . 1.4 1.8 2.1 2.4 2.7 3.0 2.9All End-Use Sectors
Oil . . . . . . . . . . . . . . . . . . . . . . . . . . . . . 4.6 5.9 6.7 7.3 8.1 8.9 2.5Natural Gas . . . . . . . . . . . . . . . . . . . . . . 0.6 0.8 1.0 1.3 1.7 2.1 4.9Coal . . . . . . . . . . . . . . . . . . . . . . . . . . . . 2.2 2.9 3.4 3.9 4.3 4.7 2.7Electricity . . . . . . . . . . . . . . . . . . . . . . . . 1.8 2.9 3.6 4.3 5.0 5.9 4.6Heat . . . . . . . . . . . . . . . . . . . . . . . . . . . . 0.0 0.0 0.0 0.0 0.0 0.0 —Renewables. . . . . . . . . . . . . . . . . . . . . . 0.0 0.0 0.0 0.0 0.0 0.0 16.5
Delivered Energy . . . . . . . . . . . . . . . 9.2 12.5 14.6 16.8 19.2 21.6 3.2Electricity-Related Losses . . . . . . . . . . . 4.8 6.9 7.9 8.9 9.8 10.9 3.1
Total . . . . . . . . . . . . . . . . . . . . . . . . . . 14.0 19.4 22.5 25.7 29.0 32.5 3.2Electric Power a
Oil . . . . . . . . . . . . . . . . . . . . . . . . . . . . . 0.2 0.2 0.2 0.3 0.3 0.3 2.0Natural Gas . . . . . . . . . . . . . . . . . . . . . . 0.4 0.8 0.8 1.0 1.5 2.6 7.1Coal . . . . . . . . . . . . . . . . . . . . . . . . . . . . 5.0 6.9 8.2 9.2 9.9 10.3 2.7Nuclear . . . . . . . . . . . . . . . . . . . . . . . . . 0.2 0.7 0.9 1.2 1.3 1.4 7.4Renewables. . . . . . . . . . . . . . . . . . . . . . 0.7 1.3 1.3 1.5 1.8 2.2 4.1
Total . . . . . . . . . . . . . . . . . . . . . . . . . . 6.6 9.8 11.5 13.2 14.8 16.8 3.5Total Energy Consumption
Oil . . . . . . . . . . . . . . . . . . . . . . . . . . . . . 4.8 6.1 6.9 7.6 8.4 9.2 2.4Natural Gas . . . . . . . . . . . . . . . . . . . . . . 1.0 1.5 1.8 2.3 3.2 4.7 5.9Coal . . . . . . . . . . . . . . . . . . . . . . . . . . . . 7.3 9.9 11.6 13.1 14.2 15.0 2.7Nuclear . . . . . . . . . . . . . . . . . . . . . . . . . 0.2 0.7 0.9 1.2 1.3 1.4 7.4Renewables. . . . . . . . . . . . . . . . . . . . . . 0.7 1.3 1.3 1.5 1.8 2.2 4.2
Total . . . . . . . . . . . . . . . . . . . . . . . . . . 14.0 19.4 22.5 25.7 29.0 32.5 3.2aFuel inputs used in the production of electricity and heat at central-station generators.Sources: 2003: Derived from Energy Information Administration (EIA), International Energy Annual 2003 (May-July 2005), web site www.eia.
doe.gov/iea/. Projections: EIA, System for the Analysis of Global Energy Markets (2006).
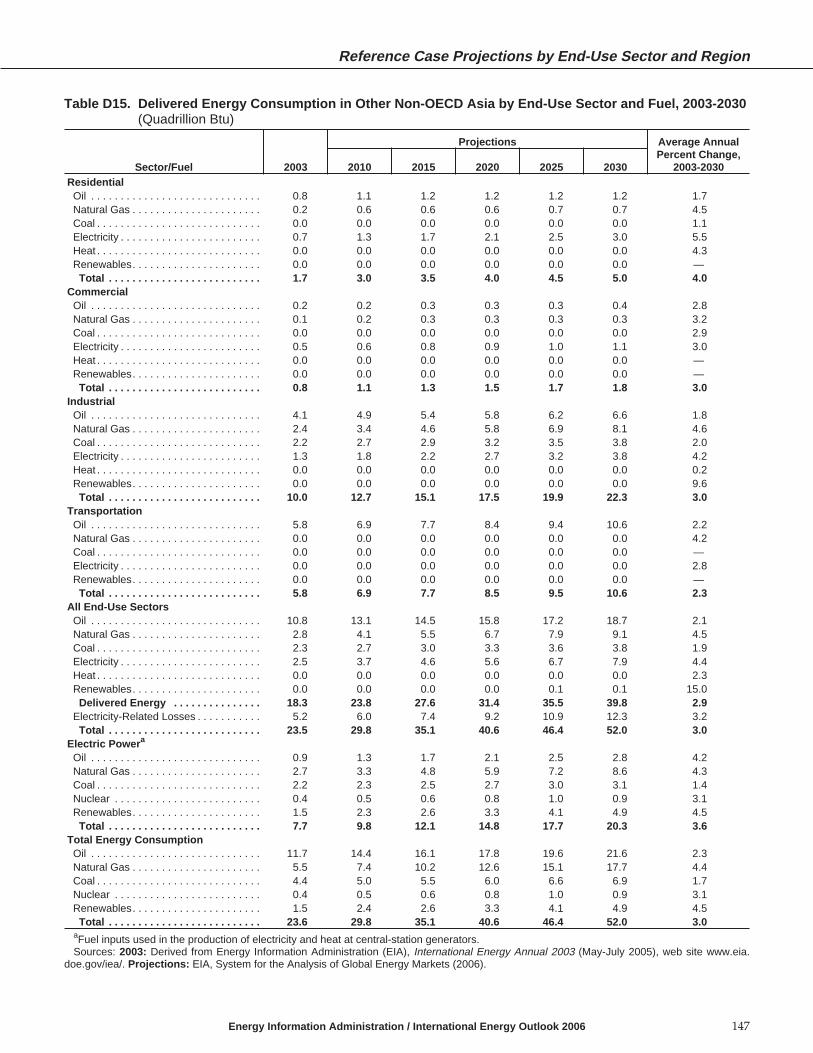
Table D15. Delivered Energy Consumption in Other Non-OECD Asia by End-Use Sector and Fuel, 2003-2030(Quadrillion Btu)
Reference Case Projections by End-Use Sector and Region
Energy Information Administration / International Energy Outlook 2006 147
Sector/Fuel 2003
Projections Average AnnualPercent Change,
2003-20302010 2015 2020 2025 2030Residential
Oil . . . . . . . . . . . . . . . . . . . . . . . . . . . . . 0.8 1.1 1.2 1.2 1.2 1.2 1.7Natural Gas . . . . . . . . . . . . . . . . . . . . . . 0.2 0.6 0.6 0.6 0.7 0.7 4.5Coal . . . . . . . . . . . . . . . . . . . . . . . . . . . . 0.0 0.0 0.0 0.0 0.0 0.0 1.1Electricity . . . . . . . . . . . . . . . . . . . . . . . . 0.7 1.3 1.7 2.1 2.5 3.0 5.5Heat . . . . . . . . . . . . . . . . . . . . . . . . . . . . 0.0 0.0 0.0 0.0 0.0 0.0 4.3Renewables. . . . . . . . . . . . . . . . . . . . . . 0.0 0.0 0.0 0.0 0.0 0.0 —
Total . . . . . . . . . . . . . . . . . . . . . . . . . . 1.7 3.0 3.5 4.0 4.5 5.0 4.0Commercial
Oil . . . . . . . . . . . . . . . . . . . . . . . . . . . . . 0.2 0.2 0.3 0.3 0.3 0.4 2.8Natural Gas . . . . . . . . . . . . . . . . . . . . . . 0.1 0.2 0.3 0.3 0.3 0.3 3.2Coal . . . . . . . . . . . . . . . . . . . . . . . . . . . . 0.0 0.0 0.0 0.0 0.0 0.0 2.9Electricity . . . . . . . . . . . . . . . . . . . . . . . . 0.5 0.6 0.8 0.9 1.0 1.1 3.0Heat . . . . . . . . . . . . . . . . . . . . . . . . . . . . 0.0 0.0 0.0 0.0 0.0 0.0 —Renewables. . . . . . . . . . . . . . . . . . . . . . 0.0 0.0 0.0 0.0 0.0 0.0 —
Total . . . . . . . . . . . . . . . . . . . . . . . . . . 0.8 1.1 1.3 1.5 1.7 1.8 3.0Industrial
Oil . . . . . . . . . . . . . . . . . . . . . . . . . . . . . 4.1 4.9 5.4 5.8 6.2 6.6 1.8Natural Gas . . . . . . . . . . . . . . . . . . . . . . 2.4 3.4 4.6 5.8 6.9 8.1 4.6Coal . . . . . . . . . . . . . . . . . . . . . . . . . . . . 2.2 2.7 2.9 3.2 3.5 3.8 2.0Electricity . . . . . . . . . . . . . . . . . . . . . . . . 1.3 1.8 2.2 2.7 3.2 3.8 4.2Heat . . . . . . . . . . . . . . . . . . . . . . . . . . . . 0.0 0.0 0.0 0.0 0.0 0.0 0.2Renewables. . . . . . . . . . . . . . . . . . . . . . 0.0 0.0 0.0 0.0 0.0 0.0 9.6
Total . . . . . . . . . . . . . . . . . . . . . . . . . . 10.0 12.7 15.1 17.5 19.9 22.3 3.0Transportation
Oil . . . . . . . . . . . . . . . . . . . . . . . . . . . . . 5.8 6.9 7.7 8.4 9.4 10.6 2.2Natural Gas . . . . . . . . . . . . . . . . . . . . . . 0.0 0.0 0.0 0.0 0.0 0.0 4.2Coal . . . . . . . . . . . . . . . . . . . . . . . . . . . . 0.0 0.0 0.0 0.0 0.0 0.0 —Electricity . . . . . . . . . . . . . . . . . . . . . . . . 0.0 0.0 0.0 0.0 0.0 0.0 2.8Renewables. . . . . . . . . . . . . . . . . . . . . . 0.0 0.0 0.0 0.0 0.0 0.0 —
Total . . . . . . . . . . . . . . . . . . . . . . . . . . 5.8 6.9 7.7 8.5 9.5 10.6 2.3All End-Use Sectors
Oil . . . . . . . . . . . . . . . . . . . . . . . . . . . . . 10.8 13.1 14.5 15.8 17.2 18.7 2.1Natural Gas . . . . . . . . . . . . . . . . . . . . . . 2.8 4.1 5.5 6.7 7.9 9.1 4.5Coal . . . . . . . . . . . . . . . . . . . . . . . . . . . . 2.3 2.7 3.0 3.3 3.6 3.8 1.9Electricity . . . . . . . . . . . . . . . . . . . . . . . . 2.5 3.7 4.6 5.6 6.7 7.9 4.4Heat . . . . . . . . . . . . . . . . . . . . . . . . . . . . 0.0 0.0 0.0 0.0 0.0 0.0 2.3Renewables. . . . . . . . . . . . . . . . . . . . . . 0.0 0.0 0.0 0.0 0.1 0.1 15.0
Delivered Energy . . . . . . . . . . . . . . . 18.3 23.8 27.6 31.4 35.5 39.8 2.9Electricity-Related Losses . . . . . . . . . . . 5.2 6.0 7.4 9.2 10.9 12.3 3.2
Total . . . . . . . . . . . . . . . . . . . . . . . . . . 23.5 29.8 35.1 40.6 46.4 52.0 3.0Electric Power a
Oil . . . . . . . . . . . . . . . . . . . . . . . . . . . . . 0.9 1.3 1.7 2.1 2.5 2.8 4.2Natural Gas . . . . . . . . . . . . . . . . . . . . . . 2.7 3.3 4.8 5.9 7.2 8.6 4.3Coal . . . . . . . . . . . . . . . . . . . . . . . . . . . . 2.2 2.3 2.5 2.7 3.0 3.1 1.4Nuclear . . . . . . . . . . . . . . . . . . . . . . . . . 0.4 0.5 0.6 0.8 1.0 0.9 3.1Renewables. . . . . . . . . . . . . . . . . . . . . . 1.5 2.3 2.6 3.3 4.1 4.9 4.5
Total . . . . . . . . . . . . . . . . . . . . . . . . . . 7.7 9.8 12.1 14.8 17.7 20.3 3.6Total Energy Consumption
Oil . . . . . . . . . . . . . . . . . . . . . . . . . . . . . 11.7 14.4 16.1 17.8 19.6 21.6 2.3Natural Gas . . . . . . . . . . . . . . . . . . . . . . 5.5 7.4 10.2 12.6 15.1 17.7 4.4Coal . . . . . . . . . . . . . . . . . . . . . . . . . . . . 4.4 5.0 5.5 6.0 6.6 6.9 1.7Nuclear . . . . . . . . . . . . . . . . . . . . . . . . . 0.4 0.5 0.6 0.8 1.0 0.9 3.1Renewables. . . . . . . . . . . . . . . . . . . . . . 1.5 2.4 2.6 3.3 4.1 4.9 4.5
Total . . . . . . . . . . . . . . . . . . . . . . . . . . 23.6 29.8 35.1 40.6 46.4 52.0 3.0aFuel inputs used in the production of electricity and heat at central-station generators.Sources: 2003: Derived from Energy Information Administration (EIA), International Energy Annual 2003 (May-July 2005), web site www.eia.
doe.gov/iea/. Projections: EIA, System for the Analysis of Global Energy Markets (2006).
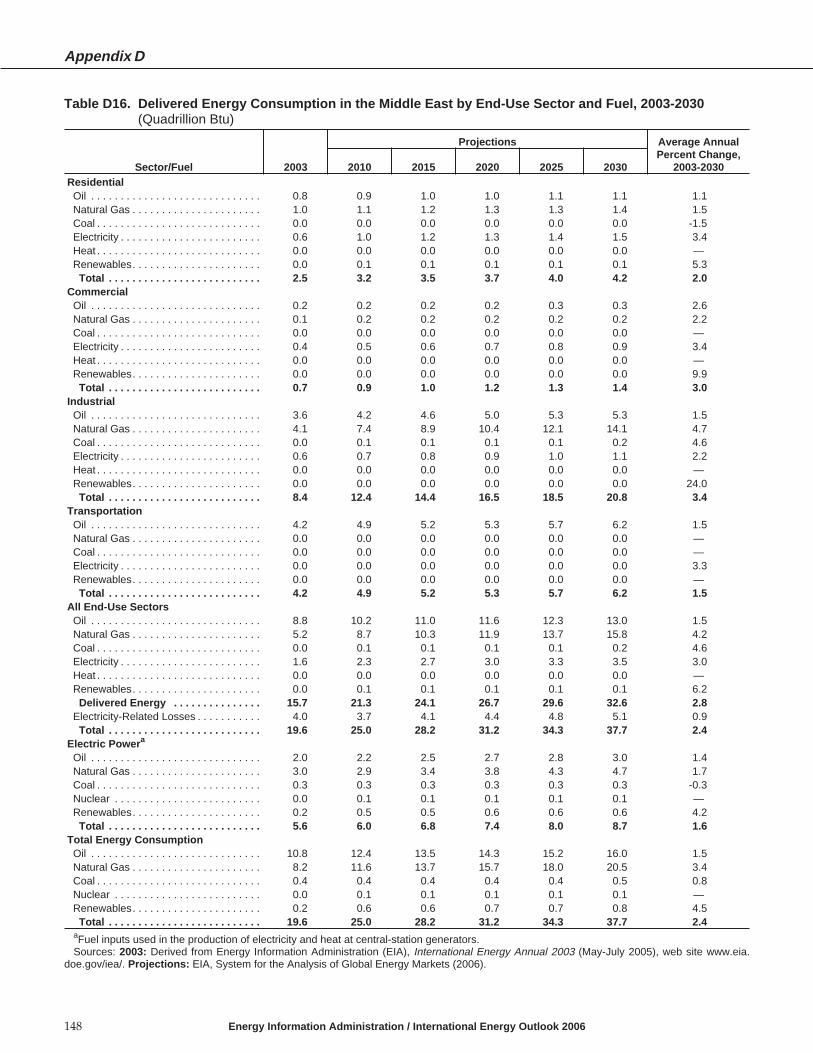
Table D16. Delivered Energy Consumption in the Middle East by End-Use Sector and Fuel, 2003-2030(Quadrillion Btu)
Appendix D
148 Energy Information Administration / International Energy Outlook 2006
Sector/Fuel 2003
Projections Average AnnualPercent Change,
2003-20302010 2015 2020 2025 2030Residential
Oil . . . . . . . . . . . . . . . . . . . . . . . . . . . . . 0.8 0.9 1.0 1.0 1.1 1.1 1.1Natural Gas . . . . . . . . . . . . . . . . . . . . . . 1.0 1.1 1.2 1.3 1.3 1.4 1.5Coal . . . . . . . . . . . . . . . . . . . . . . . . . . . . 0.0 0.0 0.0 0.0 0.0 0.0 -1.5Electricity . . . . . . . . . . . . . . . . . . . . . . . . 0.6 1.0 1.2 1.3 1.4 1.5 3.4Heat . . . . . . . . . . . . . . . . . . . . . . . . . . . . 0.0 0.0 0.0 0.0 0.0 0.0 —Renewables. . . . . . . . . . . . . . . . . . . . . . 0.0 0.1 0.1 0.1 0.1 0.1 5.3
Total . . . . . . . . . . . . . . . . . . . . . . . . . . 2.5 3.2 3.5 3.7 4.0 4.2 2.0Commercial
Oil . . . . . . . . . . . . . . . . . . . . . . . . . . . . . 0.2 0.2 0.2 0.2 0.3 0.3 2.6Natural Gas . . . . . . . . . . . . . . . . . . . . . . 0.1 0.2 0.2 0.2 0.2 0.2 2.2Coal . . . . . . . . . . . . . . . . . . . . . . . . . . . . 0.0 0.0 0.0 0.0 0.0 0.0 —Electricity . . . . . . . . . . . . . . . . . . . . . . . . 0.4 0.5 0.6 0.7 0.8 0.9 3.4Heat . . . . . . . . . . . . . . . . . . . . . . . . . . . . 0.0 0.0 0.0 0.0 0.0 0.0 —Renewables. . . . . . . . . . . . . . . . . . . . . . 0.0 0.0 0.0 0.0 0.0 0.0 9.9
Total . . . . . . . . . . . . . . . . . . . . . . . . . . 0.7 0.9 1.0 1.2 1.3 1.4 3.0Industrial
Oil . . . . . . . . . . . . . . . . . . . . . . . . . . . . . 3.6 4.2 4.6 5.0 5.3 5.3 1.5Natural Gas . . . . . . . . . . . . . . . . . . . . . . 4.1 7.4 8.9 10.4 12.1 14.1 4.7Coal . . . . . . . . . . . . . . . . . . . . . . . . . . . . 0.0 0.1 0.1 0.1 0.1 0.2 4.6Electricity . . . . . . . . . . . . . . . . . . . . . . . . 0.6 0.7 0.8 0.9 1.0 1.1 2.2Heat . . . . . . . . . . . . . . . . . . . . . . . . . . . . 0.0 0.0 0.0 0.0 0.0 0.0 —Renewables. . . . . . . . . . . . . . . . . . . . . . 0.0 0.0 0.0 0.0 0.0 0.0 24.0
Total . . . . . . . . . . . . . . . . . . . . . . . . . . 8.4 12.4 14.4 16.5 18.5 20.8 3.4Transportation
Oil . . . . . . . . . . . . . . . . . . . . . . . . . . . . . 4.2 4.9 5.2 5.3 5.7 6.2 1.5Natural Gas . . . . . . . . . . . . . . . . . . . . . . 0.0 0.0 0.0 0.0 0.0 0.0 —Coal . . . . . . . . . . . . . . . . . . . . . . . . . . . . 0.0 0.0 0.0 0.0 0.0 0.0 —Electricity . . . . . . . . . . . . . . . . . . . . . . . . 0.0 0.0 0.0 0.0 0.0 0.0 3.3Renewables. . . . . . . . . . . . . . . . . . . . . . 0.0 0.0 0.0 0.0 0.0 0.0 —
Total . . . . . . . . . . . . . . . . . . . . . . . . . . 4.2 4.9 5.2 5.3 5.7 6.2 1.5All End-Use Sectors
Oil . . . . . . . . . . . . . . . . . . . . . . . . . . . . . 8.8 10.2 11.0 11.6 12.3 13.0 1.5Natural Gas . . . . . . . . . . . . . . . . . . . . . . 5.2 8.7 10.3 11.9 13.7 15.8 4.2Coal . . . . . . . . . . . . . . . . . . . . . . . . . . . . 0.0 0.1 0.1 0.1 0.1 0.2 4.6Electricity . . . . . . . . . . . . . . . . . . . . . . . . 1.6 2.3 2.7 3.0 3.3 3.5 3.0Heat . . . . . . . . . . . . . . . . . . . . . . . . . . . . 0.0 0.0 0.0 0.0 0.0 0.0 —Renewables. . . . . . . . . . . . . . . . . . . . . . 0.0 0.1 0.1 0.1 0.1 0.1 6.2
Delivered Energy . . . . . . . . . . . . . . . 15.7 21.3 24.1 26.7 29.6 32.6 2.8Electricity-Related Losses . . . . . . . . . . . 4.0 3.7 4.1 4.4 4.8 5.1 0.9
Total . . . . . . . . . . . . . . . . . . . . . . . . . . 19.6 25.0 28.2 31.2 34.3 37.7 2.4Electric Power a
Oil . . . . . . . . . . . . . . . . . . . . . . . . . . . . . 2.0 2.2 2.5 2.7 2.8 3.0 1.4Natural Gas . . . . . . . . . . . . . . . . . . . . . . 3.0 2.9 3.4 3.8 4.3 4.7 1.7Coal . . . . . . . . . . . . . . . . . . . . . . . . . . . . 0.3 0.3 0.3 0.3 0.3 0.3 -0.3Nuclear . . . . . . . . . . . . . . . . . . . . . . . . . 0.0 0.1 0.1 0.1 0.1 0.1 —Renewables. . . . . . . . . . . . . . . . . . . . . . 0.2 0.5 0.5 0.6 0.6 0.6 4.2
Total . . . . . . . . . . . . . . . . . . . . . . . . . . 5.6 6.0 6.8 7.4 8.0 8.7 1.6Total Energy Consumption
Oil . . . . . . . . . . . . . . . . . . . . . . . . . . . . . 10.8 12.4 13.5 14.3 15.2 16.0 1.5Natural Gas . . . . . . . . . . . . . . . . . . . . . . 8.2 11.6 13.7 15.7 18.0 20.5 3.4Coal . . . . . . . . . . . . . . . . . . . . . . . . . . . . 0.4 0.4 0.4 0.4 0.4 0.5 0.8Nuclear . . . . . . . . . . . . . . . . . . . . . . . . . 0.0 0.1 0.1 0.1 0.1 0.1 —Renewables. . . . . . . . . . . . . . . . . . . . . . 0.2 0.6 0.6 0.7 0.7 0.8 4.5
Total . . . . . . . . . . . . . . . . . . . . . . . . . . 19.6 25.0 28.2 31.2 34.3 37.7 2.4aFuel inputs used in the production of electricity and heat at central-station generators.Sources: 2003: Derived from Energy Information Administration (EIA), International Energy Annual 2003 (May-July 2005), web site www.eia.
doe.gov/iea/. Projections: EIA, System for the Analysis of Global Energy Markets (2006).

Table D17. Delivered Energy Consumption in Africa by End-Use Sector and Fuel, 2003-2030(Quadrillion Btu)
Reference Case Projections by End-Use Sector and Region
Energy Information Administration / International Energy Outlook 2006 149
Sector/Fuel 2003
Projections Average AnnualPercent Change,
2003-20302010 2015 2020 2025 2030Residential
Oil . . . . . . . . . . . . . . . . . . . . . . . . . . . . . 0.6 1.2 1.2 1.1 1.1 1.1 2.3Natural Gas . . . . . . . . . . . . . . . . . . . . . . 0.1 0.3 0.4 0.4 0.4 0.4 4.1Coal . . . . . . . . . . . . . . . . . . . . . . . . . . . . 0.1 0.2 0.2 0.2 0.3 0.3 3.4Electricity . . . . . . . . . . . . . . . . . . . . . . . . 0.4 0.7 0.9 1.0 1.2 1.3 4.2Heat . . . . . . . . . . . . . . . . . . . . . . . . . . . . 0.0 0.0 0.0 0.0 0.0 0.0 —Renewables. . . . . . . . . . . . . . . . . . . . . . 0.0 0.0 0.0 0.0 0.0 0.0 —
Total . . . . . . . . . . . . . . . . . . . . . . . . . . 1.3 2.5 2.7 2.8 3.0 3.1 3.3Commercial
Oil . . . . . . . . . . . . . . . . . . . . . . . . . . . . . 0.1 0.1 0.1 0.1 0.1 0.1 2.7Natural Gas . . . . . . . . . . . . . . . . . . . . . . 0.0 0.0 0.0 0.0 0.0 0.0 4.3Coal . . . . . . . . . . . . . . . . . . . . . . . . . . . . 0.1 0.1 0.1 0.1 0.1 0.1 2.3Electricity . . . . . . . . . . . . . . . . . . . . . . . . 0.2 0.3 0.3 0.4 0.5 0.5 4.5Heat . . . . . . . . . . . . . . . . . . . . . . . . . . . . 0.0 0.0 0.0 0.0 0.0 0.0 —Renewables. . . . . . . . . . . . . . . . . . . . . . 0.0 0.0 0.0 0.0 0.0 0.0 —
Total . . . . . . . . . . . . . . . . . . . . . . . . . . 0.3 0.5 0.5 0.6 0.7 0.7 3.8Industrial
Oil . . . . . . . . . . . . . . . . . . . . . . . . . . . . . 1.5 2.0 2.3 2.4 2.4 2.6 1.9Natural Gas . . . . . . . . . . . . . . . . . . . . . . 1.3 2.1 3.1 3.7 4.3 5.0 5.2Coal . . . . . . . . . . . . . . . . . . . . . . . . . . . . 1.6 2.1 2.3 2.5 2.7 2.9 2.2Electricity . . . . . . . . . . . . . . . . . . . . . . . . 0.9 0.9 1.0 1.1 1.2 1.4 1.7Heat . . . . . . . . . . . . . . . . . . . . . . . . . . . . 0.0 0.0 0.0 0.0 0.0 0.0 —Renewables. . . . . . . . . . . . . . . . . . . . . . 0.0 0.0 0.0 0.0 0.0 0.0 2.9
Total . . . . . . . . . . . . . . . . . . . . . . . . . . 5.3 7.1 8.8 9.7 10.6 11.9 3.0Transportation
Oil . . . . . . . . . . . . . . . . . . . . . . . . . . . . . 2.9 3.6 3.9 4.2 4.6 5.1 2.2Natural Gas . . . . . . . . . . . . . . . . . . . . . . 0.0 0.0 0.0 0.0 0.0 0.0 -5.3Coal . . . . . . . . . . . . . . . . . . . . . . . . . . . . 0.0 0.0 0.0 0.0 0.0 0.0 -4.0Electricity . . . . . . . . . . . . . . . . . . . . . . . . 0.0 0.0 0.0 0.0 0.0 0.0 0.7Renewables. . . . . . . . . . . . . . . . . . . . . . 0.0 0.0 0.0 0.0 0.0 0.0 —
Total . . . . . . . . . . . . . . . . . . . . . . . . . . 2.9 3.6 3.9 4.2 4.7 5.2 2.2All End-Use Sectors
Oil . . . . . . . . . . . . . . . . . . . . . . . . . . . . . 5.0 6.8 7.4 7.8 8.2 8.9 2.1Natural Gas . . . . . . . . . . . . . . . . . . . . . . 1.4 2.4 3.5 4.1 4.7 5.5 5.1Coal . . . . . . . . . . . . . . . . . . . . . . . . . . . . 1.8 2.5 2.7 2.9 3.1 3.3 2.2Electricity . . . . . . . . . . . . . . . . . . . . . . . . 1.5 1.9 2.3 2.6 2.9 3.2 2.9Heat . . . . . . . . . . . . . . . . . . . . . . . . . . . . 0.0 0.0 0.0 0.0 0.0 0.0 —Renewables. . . . . . . . . . . . . . . . . . . . . . 0.0 0.0 0.0 0.0 0.0 0.0 7.1
Delivered Energy . . . . . . . . . . . . . . . 9.7 13.6 15.9 17.3 18.9 20.9 2.9Electricity-Related Losses . . . . . . . . . . . 3.6 4.1 4.6 5.0 5.4 5.9 1.9
Total . . . . . . . . . . . . . . . . . . . . . . . . . . 13.3 17.7 20.5 22.3 24.3 26.8 2.6Electric Power a
Oil . . . . . . . . . . . . . . . . . . . . . . . . . . . . . 0.5 0.7 0.9 1.0 1.0 1.2 3.3Natural Gas . . . . . . . . . . . . . . . . . . . . . . 1.3 1.1 1.4 2.0 2.6 3.2 3.3Coal . . . . . . . . . . . . . . . . . . . . . . . . . . . . 2.3 2.9 3.2 3.2 3.2 3.1 1.2Nuclear . . . . . . . . . . . . . . . . . . . . . . . . . 0.1 0.1 0.2 0.2 0.2 0.2 0.7Renewables. . . . . . . . . . . . . . . . . . . . . . 0.9 1.2 1.2 1.2 1.3 1.5 1.9
Total . . . . . . . . . . . . . . . . . . . . . . . . . . 5.1 6.0 6.9 7.6 8.3 9.1 2.2Total Energy Consumption
Oil . . . . . . . . . . . . . . . . . . . . . . . . . . . . . 5.5 7.6 8.3 8.8 9.3 10.1 2.3Natural Gas . . . . . . . . . . . . . . . . . . . . . . 2.7 3.5 4.9 6.1 7.4 8.7 4.4Coal . . . . . . . . . . . . . . . . . . . . . . . . . . . . 4.1 5.3 5.9 6.1 6.2 6.4 1.7Nuclear . . . . . . . . . . . . . . . . . . . . . . . . . 0.1 0.1 0.2 0.2 0.2 0.2 0.7Renewables. . . . . . . . . . . . . . . . . . . . . . 0.9 1.2 1.3 1.3 1.3 1.5 1.9
Total . . . . . . . . . . . . . . . . . . . . . . . . . . 13.3 17.7 20.5 22.3 24.3 26.8 2.6aFuel inputs used in the production of electricity and heat at central-station generators.Sources: 2003: Derived from Energy Information Administration (EIA), International Energy Annual 2003 (May-July 2005), web site www.eia.
doe.gov/iea/. Projections: EIA, System for the Analysis of Global Energy Markets (2006).

Table D18. Delivered Energy Consumption in Brazil by End-Use Sector and Fuel, 2003-2030(Quadrillion Btu)
Appendix D
150 Energy Information Administration / International Energy Outlook 2006
Sector/Fuel 2003
Projections Average AnnualPercent Change,
2003-20302010 2015 2020 2025 2030Residential
Oil . . . . . . . . . . . . . . . . . . . . . . . . . . . . . 0.3 0.4 0.4 0.5 0.5 0.6 2.6Natural Gas . . . . . . . . . . . . . . . . . . . . . . 0.0 0.0 0.0 0.0 0.0 0.0 4.6Coal . . . . . . . . . . . . . . . . . . . . . . . . . . . . 0.0 0.0 0.0 0.0 0.0 0.0 —Electricity . . . . . . . . . . . . . . . . . . . . . . . . 0.3 0.5 0.5 0.6 0.6 0.7 3.2Heat . . . . . . . . . . . . . . . . . . . . . . . . . . . . 0.0 0.0 0.0 0.0 0.0 0.0 —Renewables. . . . . . . . . . . . . . . . . . . . . . 0.0 0.0 0.0 0.0 0.0 0.0 —
Total . . . . . . . . . . . . . . . . . . . . . . . . . . 0.6 0.9 1.0 1.1 1.2 1.3 2.9Commercial
Oil . . . . . . . . . . . . . . . . . . . . . . . . . . . . . 0.1 0.1 0.1 0.1 0.1 0.1 2.0Natural Gas . . . . . . . . . . . . . . . . . . . . . . 0.0 0.0 0.0 0.0 0.0 0.0 2.6Coal . . . . . . . . . . . . . . . . . . . . . . . . . . . . 0.0 0.0 0.0 0.0 0.0 0.0 —Electricity . . . . . . . . . . . . . . . . . . . . . . . . 0.3 0.5 0.6 0.7 0.9 1.0 4.5Heat . . . . . . . . . . . . . . . . . . . . . . . . . . . . 0.0 0.0 0.0 0.0 0.0 0.0 —Renewables. . . . . . . . . . . . . . . . . . . . . . 0.0 0.0 0.0 0.0 0.0 0.0 —
Total . . . . . . . . . . . . . . . . . . . . . . . . . . 0.4 0.6 0.7 0.9 1.0 1.1 4.1Industrial
Oil . . . . . . . . . . . . . . . . . . . . . . . . . . . . . 1.6 1.9 2.1 2.4 2.6 2.7 2.0Natural Gas . . . . . . . . . . . . . . . . . . . . . . 0.4 0.5 0.6 0.6 0.7 0.8 2.7Coal . . . . . . . . . . . . . . . . . . . . . . . . . . . . 0.4 0.5 0.5 0.5 0.5 0.6 1.5Electricity . . . . . . . . . . . . . . . . . . . . . . . . 0.7 0.8 0.9 1.1 1.2 1.3 2.5Heat . . . . . . . . . . . . . . . . . . . . . . . . . . . . 0.0 0.0 0.0 0.0 0.0 0.0 —Renewables. . . . . . . . . . . . . . . . . . . . . . 0.0 0.0 0.0 0.0 0.0 0.0 -2.3
Total . . . . . . . . . . . . . . . . . . . . . . . . . . 3.1 3.7 4.2 4.6 5.1 5.5 2.1Transportation
Oil . . . . . . . . . . . . . . . . . . . . . . . . . . . . . 2.3 2.5 2.6 2.7 2.9 3.2 1.2Natural Gas . . . . . . . . . . . . . . . . . . . . . . 0.0 0.0 0.0 0.0 0.1 0.1 1.3Coal . . . . . . . . . . . . . . . . . . . . . . . . . . . . 0.0 0.0 0.0 0.0 0.0 0.0 —Electricity . . . . . . . . . . . . . . . . . . . . . . . . 0.0 0.0 0.0 0.0 0.0 0.0 1.8Renewables. . . . . . . . . . . . . . . . . . . . . . 0.2 0.3 0.3 0.3 0.3 0.3 1.5
Total . . . . . . . . . . . . . . . . . . . . . . . . . . 2.5 2.8 2.9 3.0 3.3 3.6 1.3All End-Use Sectors
Oil . . . . . . . . . . . . . . . . . . . . . . . . . . . . . 4.2 4.8 5.2 5.6 6.2 6.6 1.7Natural Gas . . . . . . . . . . . . . . . . . . . . . . 0.5 0.6 0.6 0.7 0.8 0.9 2.6Coal . . . . . . . . . . . . . . . . . . . . . . . . . . . . 0.4 0.5 0.5 0.5 0.5 0.6 1.5Electricity . . . . . . . . . . . . . . . . . . . . . . . . 1.3 1.8 2.1 2.4 2.7 3.0 3.2Heat . . . . . . . . . . . . . . . . . . . . . . . . . . . . 0.0 0.0 0.0 0.0 0.0 0.0 —Renewables. . . . . . . . . . . . . . . . . . . . . . 0.3 0.3 0.3 0.3 0.3 0.4 1.1
Delivered Energy . . . . . . . . . . . . . . . 6.6 7.9 8.8 9.5 10.5 11.4 2.1Electricity-Related Losses . . . . . . . . . . . 2.1 2.9 3.6 4.3 5.0 5.7 3.8
Total . . . . . . . . . . . . . . . . . . . . . . . . . . 8.7 10.8 12.4 13.8 15.5 17.2 2.5Electric Power a
Oil . . . . . . . . . . . . . . . . . . . . . . . . . . . . . 0.1 0.1 0.1 0.2 0.2 0.2 2.3Natural Gas . . . . . . . . . . . . . . . . . . . . . . 0.1 0.4 0.5 0.5 0.6 0.8 9.8Coal . . . . . . . . . . . . . . . . . . . . . . . . . . . . 0.1 0.1 0.2 0.3 0.3 0.3 6.1Nuclear . . . . . . . . . . . . . . . . . . . . . . . . . 0.1 0.1 0.2 0.2 0.2 0.2 1.2Renewables. . . . . . . . . . . . . . . . . . . . . . 3.0 3.9 4.7 5.5 6.3 7.2 3.3
Total . . . . . . . . . . . . . . . . . . . . . . . . . . 3.4 4.7 5.7 6.7 7.7 8.7 3.6Total Energy Consumption
Oil . . . . . . . . . . . . . . . . . . . . . . . . . . . . . 4.3 4.9 5.4 5.8 6.3 6.8 1.7Natural Gas . . . . . . . . . . . . . . . . . . . . . . 0.5 1.0 1.1 1.2 1.4 1.7 4.6Coal . . . . . . . . . . . . . . . . . . . . . . . . . . . . 0.5 0.6 0.7 0.8 0.8 0.9 2.4Nuclear . . . . . . . . . . . . . . . . . . . . . . . . . 0.1 0.1 0.2 0.2 0.2 0.2 1.2Renewables. . . . . . . . . . . . . . . . . . . . . . 3.3 4.2 5.0 5.8 6.7 7.6 3.2
Total . . . . . . . . . . . . . . . . . . . . . . . . . . 8.8 10.8 12.4 13.8 15.5 17.2 2.5aFuel inputs used in the production of electricity and heat at central-station generators.Sources: 2003: Derived from Energy Information Administration (EIA), International Energy Annual 2003 (May-July 2005), web site www.eia.
doe.gov/iea/. Projections: EIA, System for the Analysis of Global Energy Markets (2006).

Table D19. Delivered Energy Consumption in Other Central and South America by End-Use Sector and Fuel,2003-2030(Quadrillion Btu)
Reference Case Projections by End-Use Sector and Region
Energy Information Administration / International Energy Outlook 2006 151
Sector/Fuel 2003
Projections Average AnnualPercent Change,
2003-20302010 2015 2020 2025 2030Residential
Oil . . . . . . . . . . . . . . . . . . . . . . . . . . . . . 0.4 0.6 0.6 0.7 0.7 0.8 2.6Natural Gas . . . . . . . . . . . . . . . . . . . . . . 0.3 0.5 0.6 0.7 0.8 0.8 3.4Coal . . . . . . . . . . . . . . . . . . . . . . . . . . . . 0.0 0.0 0.0 0.0 0.0 0.0 1.8Electricity . . . . . . . . . . . . . . . . . . . . . . . . 0.4 0.7 0.9 1.1 1.3 1.5 5.0Heat . . . . . . . . . . . . . . . . . . . . . . . . . . . . 0.0 0.0 0.0 0.0 0.0 0.0 —Renewables. . . . . . . . . . . . . . . . . . . . . . 0.0 0.0 0.0 0.0 0.0 0.0 6.6
Total . . . . . . . . . . . . . . . . . . . . . . . . . . 1.1 1.8 2.2 2.5 2.8 3.2 3.8Commercial
Oil . . . . . . . . . . . . . . . . . . . . . . . . . . . . . 0.1 0.1 0.1 0.1 0.2 0.2 2.5Natural Gas . . . . . . . . . . . . . . . . . . . . . . 0.1 0.1 0.1 0.2 0.2 0.2 2.8Coal . . . . . . . . . . . . . . . . . . . . . . . . . . . . 0.0 0.0 0.0 0.0 0.0 0.0 —Electricity . . . . . . . . . . . . . . . . . . . . . . . . 0.3 0.5 0.6 0.8 0.9 1.0 4.8Heat . . . . . . . . . . . . . . . . . . . . . . . . . . . . 0.0 0.0 0.0 0.0 0.0 0.0 —Renewables. . . . . . . . . . . . . . . . . . . . . . 0.0 0.0 0.0 0.0 0.0 0.0 —
Total . . . . . . . . . . . . . . . . . . . . . . . . . . 0.5 0.7 0.9 1.1 1.2 1.4 4.1Industrial
Oil . . . . . . . . . . . . . . . . . . . . . . . . . . . . . 2.1 2.5 2.8 3.1 3.2 3.4 1.8Natural Gas . . . . . . . . . . . . . . . . . . . . . . 2.2 3.1 3.7 4.3 5.2 5.7 3.5Coal . . . . . . . . . . . . . . . . . . . . . . . . . . . . 0.2 0.2 0.3 0.3 0.4 0.4 3.5Electricity . . . . . . . . . . . . . . . . . . . . . . . . 0.7 0.9 1.0 1.1 1.3 1.5 3.0Heat . . . . . . . . . . . . . . . . . . . . . . . . . . . . 0.0 0.0 0.0 0.0 0.0 0.0 —Renewables. . . . . . . . . . . . . . . . . . . . . . 0.0 0.0 0.0 0.0 0.0 0.0 1.1
Total . . . . . . . . . . . . . . . . . . . . . . . . . . 5.2 6.7 7.8 8.8 10.0 11.0 2.8Transportation
Oil . . . . . . . . . . . . . . . . . . . . . . . . . . . . . 3.0 3.6 3.8 4.0 4.3 4.8 1.7Natural Gas . . . . . . . . . . . . . . . . . . . . . . 0.1 0.1 0.1 0.1 0.1 0.1 0.3Coal . . . . . . . . . . . . . . . . . . . . . . . . . . . . 0.0 0.0 0.0 0.0 0.0 0.0 —Electricity . . . . . . . . . . . . . . . . . . . . . . . . 0.0 0.0 0.0 0.0 0.0 0.0 1.6Renewables. . . . . . . . . . . . . . . . . . . . . . 0.2 0.3 0.3 0.3 0.3 0.4 2.1
Total . . . . . . . . . . . . . . . . . . . . . . . . . . 3.3 4.0 4.2 4.4 4.8 5.2 1.7All End-Use Sectors
Oil . . . . . . . . . . . . . . . . . . . . . . . . . . . . . 5.6 6.8 7.4 7.9 8.4 9.1 1.8Natural Gas . . . . . . . . . . . . . . . . . . . . . . 2.8 3.8 4.5 5.2 6.2 6.8 3.4Coal . . . . . . . . . . . . . . . . . . . . . . . . . . . . 0.2 0.2 0.3 0.3 0.4 0.4 3.5Electricity . . . . . . . . . . . . . . . . . . . . . . . . 1.4 2.1 2.5 3.0 3.5 4.0 4.1Heat . . . . . . . . . . . . . . . . . . . . . . . . . . . . 0.0 0.0 0.0 0.0 0.0 0.0 —Renewables. . . . . . . . . . . . . . . . . . . . . . 0.2 0.3 0.3 0.3 0.4 0.4 2.1
Delivered Energy . . . . . . . . . . . . . . . 10.1 13.2 15.0 16.8 18.9 20.8 2.7Electricity-Related Losses . . . . . . . . . . . 3.0 4.1 5.0 5.8 6.8 7.7 3.5
Total . . . . . . . . . . . . . . . . . . . . . . . . . . 13.2 17.4 20.1 22.7 25.7 28.5 2.9Electric Power a
Oil . . . . . . . . . . . . . . . . . . . . . . . . . . . . . 0.8 1.0 1.2 1.3 1.4 1.6 2.5Natural Gas . . . . . . . . . . . . . . . . . . . . . . 0.8 1.4 1.9 2.2 2.6 3.0 4.9Coal . . . . . . . . . . . . . . . . . . . . . . . . . . . . 0.1 0.2 0.2 0.3 0.3 0.3 3.6Nuclear . . . . . . . . . . . . . . . . . . . . . . . . . 0.1 0.1 0.1 0.1 0.1 0.1 -1.1Renewables. . . . . . . . . . . . . . . . . . . . . . 2.5 3.6 4.2 5.0 5.9 6.7 3.7
Total . . . . . . . . . . . . . . . . . . . . . . . . . . 4.4 6.2 7.6 8.9 10.3 11.7 3.7Total Energy Consumption
Oil . . . . . . . . . . . . . . . . . . . . . . . . . . . . . 6.4 7.7 8.5 9.2 9.9 10.7 1.9Natural Gas . . . . . . . . . . . . . . . . . . . . . . 3.6 5.3 6.5 7.5 8.8 9.9 3.8Coal . . . . . . . . . . . . . . . . . . . . . . . . . . . . 0.3 0.4 0.5 0.6 0.6 0.7 3.5Nuclear . . . . . . . . . . . . . . . . . . . . . . . . . 0.1 0.1 0.1 0.1 0.1 0.1 -1.1Renewables. . . . . . . . . . . . . . . . . . . . . . 2.8 3.9 4.5 5.3 6.3 7.1 3.6
Total . . . . . . . . . . . . . . . . . . . . . . . . . . 13.1 17.4 20.1 22.7 25.7 28.5 2.9aFuel inputs used in the production of electricity and heat at central-station generators.Sources: 2003: Derived from Energy Information Administration (EIA), International Energy Annual 2003 (May-July 2005), web site www.eia.
doe.gov/iea/. Projections: EIA, System for the Analysis of Global Energy Markets (2006).

Appendix E
Projections of Oil Production Capacityand Oil Production in Three Cases:
• Reference• High World Oil Price• Low World Oil Price


Table E1. World Oil Production Capacity by Region and Country, Reference Case, 1990-2030(Million Barrels per Day)
Oil Production and Capacity Projections
Energy Information Administration / International Energy Outlook 2006 155
Region/Country
History (Estimates) Projections
1990 2003 2010 2015 2020 2025 2030
OPECPersian Gulf
Iran . . . . . . . . . . . . . . . . . . . . . . . . . . . . 3.2 4.2 3.8 4.0 3.9 4.0 4.3Iraq . . . . . . . . . . . . . . . . . . . . . . . . . . . . 2.2 2.3 3.3 3.8 4.3 5.1 5.5Kuwait. . . . . . . . . . . . . . . . . . . . . . . . . . 1.7 2.4 2.8 3.3 3.8 4.2 4.5Qatar. . . . . . . . . . . . . . . . . . . . . . . . . . . 0.5 0.9 0.7 0.7 0.7 0.7 0.8Saudi Arabia . . . . . . . . . . . . . . . . . . . . . 8.6 10.6 14.4 14.8 14.5 15.1 17.1United Arab Emitates . . . . . . . . . . . . . . 2.5 3.3 3.3 3.5 3.9 4.4 4.6
Total Persian Gulf. . . . . . . . . . . . . . . 18.7 23.7 28.3 30.1 31.1 33.5 36.8Other OPEC
Indonesia . . . . . . . . . . . . . . . . . . . . . . . 1.5 1.4 1.5 1.4 1.3 1.2 1.1Algeria . . . . . . . . . . . . . . . . . . . . . . . . . 1.3 1.5 1.8 1.8 1.9 1.8 1.8Libya . . . . . . . . . . . . . . . . . . . . . . . . . . . 1.5 1.5 1.8 1.9 1.9 1.9 1.8Nigeria . . . . . . . . . . . . . . . . . . . . . . . . . 1.8 2.0 2.4 2.7 2.7 2.9 3.2Venezuela. . . . . . . . . . . . . . . . . . . . . . . 2.4 3.0 4.1 4.8 5.0 5.5 5.9
Total Other OPEC . . . . . . . . . . . . . . . 8.5 9.3 11.6 12.7 12.8 13.2 13.9Total OPEC . . . . . . . . . . . . . . . . . . . . . . . 27.1 33.0 39.9 42.8 43.9 46.7 50.7
Non-OPECOECD
United States . . . . . . . . . . . . . . . . . . . . 9.7 8.8 9.9 10.3 10.4 10.4 10.4Canada . . . . . . . . . . . . . . . . . . . . . . . . . 2.0 3.1 3.6 3.7 4.2 4.7 5.0Mexico . . . . . . . . . . . . . . . . . . . . . . . . . 3.0 3.8 4.0 4.2 4.5 4.8 5.1North Sea . . . . . . . . . . . . . . . . . . . . . . . 4.0 6.3 5.5 5.1 5.1 4.7 4.3Australia and New Zealand . . . . . . . . . 0.7 0.7 0.9 0.8 0.9 0.9 0.9Other. . . . . . . . . . . . . . . . . . . . . . . . . . . 0.7 0.5 0.5 0.5 0.5 0.5 0.5
Total OECD . . . . . . . . . . . . . . . . . . . . 20.1 23.2 24.3 24.7 25.5 26.0 26.1Non-OECD
Russia. . . . . . . . . . . . . . . . . . . . . . . . . . 11.4 8.5 9.6 10.0 10.9 11.3 11.6Caspian Area . . . . . . . . . . . . . . . . . . . . 0.0 1.9 3.0 4.2 5.2 6.3 7.5Other Non-OECD Europe and Eurasia. 0.3 0.2 0.3 0.3 0.4 0.4 0.5China . . . . . . . . . . . . . . . . . . . . . . . . . . 2.8 3.4 3.8 3.7 3.8 4.0 4.2India . . . . . . . . . . . . . . . . . . . . . . . . . . . 0.7 0.9 1.1 1.3 1.4 1.5 1.6Other Non-OECD Asia . . . . . . . . . . . . . 1.0 2.0 1.7 1.8 1.8 1.7 1.7Middle East. . . . . . . . . . . . . . . . . . . . . . 1.4 1.9 2.0 2.2 2.4 2.7 2.9Africa . . . . . . . . . . . . . . . . . . . . . . . . . . 2.2 3.2 3.8 4.8 5.8 7.2 8.6Brazil. . . . . . . . . . . . . . . . . . . . . . . . . . . 0.8 1.8 2.7 3.5 3.9 4.2 4.5Other South and Central America . . . . 1.8 2.4 2.1 2.4 2.7 3.0 3.4
Total Non-OECD . . . . . . . . . . . . . . . . 22.2 26.0 30.0 34.1 38.2 42.2 46.5Total Non-OPEC . . . . . . . . . . . . . . . . . . . 42.4 49.3 54.4 58.8 63.7 68.2 72.6
Total World . . . . . . . . . . . . . . . . . . . . . . . 69.5 82.3 94.3 101.6 107.6 114.9 123.3
Note: OPEC = Organization of Petroleum Exporting Countries.Sources: History: Energy Information Administration (EIA), Energy Markets and Contingency Information Division. Projections:
EIA, System for the Analysis of Global Energy Markets (2006); and U.S. Department of the Interior, U.S. Geological Survey, WorldPetroleum Assessment 2000 (Reston, VA, July 2000).
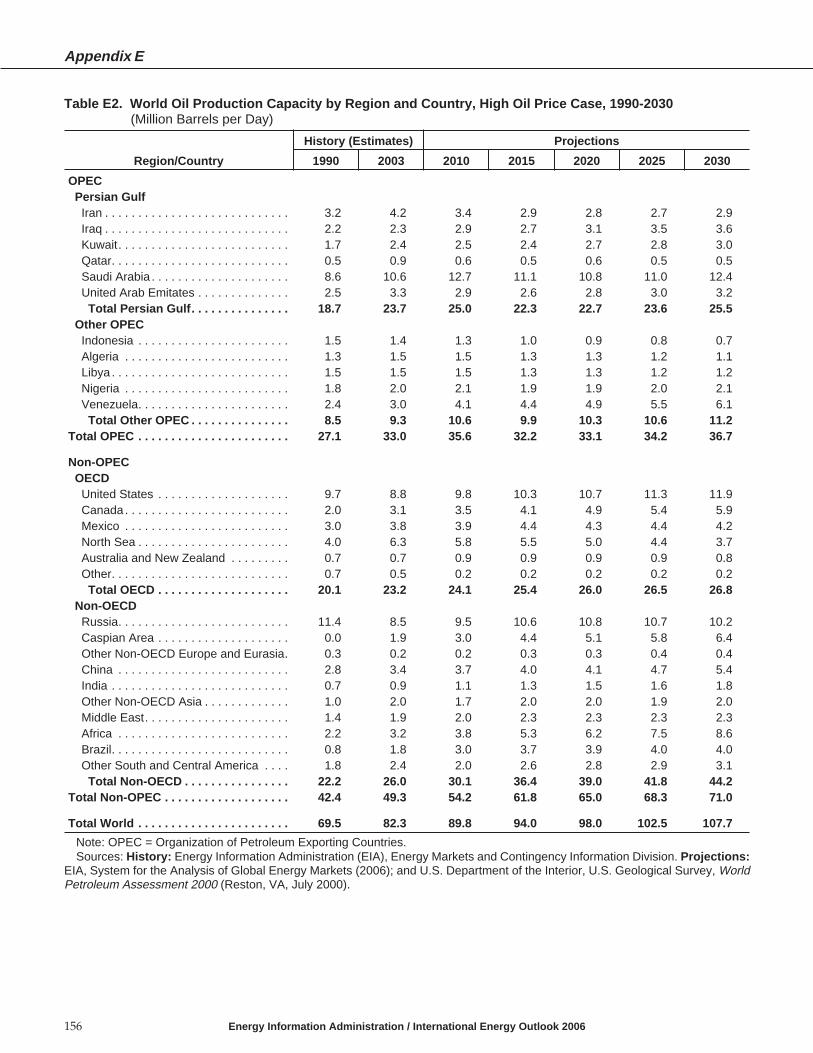
Table E2. World Oil Production Capacity by Region and Country, High Oil Price Case, 1990-2030(Million Barrels per Day)
Appendix E
156 Energy Information Administration / International Energy Outlook 2006
Region/Country
History (Estimates) Projections
1990 2003 2010 2015 2020 2025 2030
OPECPersian Gulf
Iran . . . . . . . . . . . . . . . . . . . . . . . . . . . . 3.2 4.2 3.4 2.9 2.8 2.7 2.9Iraq . . . . . . . . . . . . . . . . . . . . . . . . . . . . 2.2 2.3 2.9 2.7 3.1 3.5 3.6Kuwait. . . . . . . . . . . . . . . . . . . . . . . . . . 1.7 2.4 2.5 2.4 2.7 2.8 3.0Qatar. . . . . . . . . . . . . . . . . . . . . . . . . . . 0.5 0.9 0.6 0.5 0.6 0.5 0.5Saudi Arabia . . . . . . . . . . . . . . . . . . . . . 8.6 10.6 12.7 11.1 10.8 11.0 12.4United Arab Emitates . . . . . . . . . . . . . . 2.5 3.3 2.9 2.6 2.8 3.0 3.2
Total Persian Gulf. . . . . . . . . . . . . . . 18.7 23.7 25.0 22.3 22.7 23.6 25.5Other OPEC
Indonesia . . . . . . . . . . . . . . . . . . . . . . . 1.5 1.4 1.3 1.0 0.9 0.8 0.7Algeria . . . . . . . . . . . . . . . . . . . . . . . . . 1.3 1.5 1.5 1.3 1.3 1.2 1.1Libya . . . . . . . . . . . . . . . . . . . . . . . . . . . 1.5 1.5 1.5 1.3 1.3 1.2 1.2Nigeria . . . . . . . . . . . . . . . . . . . . . . . . . 1.8 2.0 2.1 1.9 1.9 2.0 2.1Venezuela. . . . . . . . . . . . . . . . . . . . . . . 2.4 3.0 4.1 4.4 4.9 5.5 6.1
Total Other OPEC . . . . . . . . . . . . . . . 8.5 9.3 10.6 9.9 10.3 10.6 11.2Total OPEC . . . . . . . . . . . . . . . . . . . . . . . 27.1 33.0 35.6 32.2 33.1 34.2 36.7
Non-OPECOECD
United States . . . . . . . . . . . . . . . . . . . . 9.7 8.8 9.8 10.3 10.7 11.3 11.9Canada . . . . . . . . . . . . . . . . . . . . . . . . . 2.0 3.1 3.5 4.1 4.9 5.4 5.9Mexico . . . . . . . . . . . . . . . . . . . . . . . . . 3.0 3.8 3.9 4.4 4.3 4.4 4.2North Sea . . . . . . . . . . . . . . . . . . . . . . . 4.0 6.3 5.8 5.5 5.0 4.4 3.7Australia and New Zealand . . . . . . . . . 0.7 0.7 0.9 0.9 0.9 0.9 0.8Other. . . . . . . . . . . . . . . . . . . . . . . . . . . 0.7 0.5 0.2 0.2 0.2 0.2 0.2
Total OECD . . . . . . . . . . . . . . . . . . . . 20.1 23.2 24.1 25.4 26.0 26.5 26.8Non-OECD
Russia. . . . . . . . . . . . . . . . . . . . . . . . . . 11.4 8.5 9.5 10.6 10.8 10.7 10.2Caspian Area . . . . . . . . . . . . . . . . . . . . 0.0 1.9 3.0 4.4 5.1 5.8 6.4Other Non-OECD Europe and Eurasia. 0.3 0.2 0.2 0.3 0.3 0.4 0.4China . . . . . . . . . . . . . . . . . . . . . . . . . . 2.8 3.4 3.7 4.0 4.1 4.7 5.4India . . . . . . . . . . . . . . . . . . . . . . . . . . . 0.7 0.9 1.1 1.3 1.5 1.6 1.8Other Non-OECD Asia . . . . . . . . . . . . . 1.0 2.0 1.7 2.0 2.0 1.9 2.0Middle East. . . . . . . . . . . . . . . . . . . . . . 1.4 1.9 2.0 2.3 2.3 2.3 2.3Africa . . . . . . . . . . . . . . . . . . . . . . . . . . 2.2 3.2 3.8 5.3 6.2 7.5 8.6Brazil. . . . . . . . . . . . . . . . . . . . . . . . . . . 0.8 1.8 3.0 3.7 3.9 4.0 4.0Other South and Central America . . . . 1.8 2.4 2.0 2.6 2.8 2.9 3.1
Total Non-OECD . . . . . . . . . . . . . . . . 22.2 26.0 30.1 36.4 39.0 41.8 44.2Total Non-OPEC . . . . . . . . . . . . . . . . . . . 42.4 49.3 54.2 61.8 65.0 68.3 71.0
Total World . . . . . . . . . . . . . . . . . . . . . . . 69.5 82.3 89.8 94.0 98.0 102.5 107.7
Note: OPEC = Organization of Petroleum Exporting Countries.Sources: History: Energy Information Administration (EIA), Energy Markets and Contingency Information Division. Projections:
EIA, System for the Analysis of Global Energy Markets (2006); and U.S. Department of the Interior, U.S. Geological Survey, WorldPetroleum Assessment 2000 (Reston, VA, July 2000).

Table E3. World Oil Production Capacity by Region and Country, Low Oil Price Case, 1990-2030(Million Barrels per Day)
Oil Production and Capacity Projections
Energy Information Administration / International Energy Outlook 2006 157
Region/Country
History (Estimates) Projections
1990 2003 2010 2015 2020 2025 2030
OPECPersian Gulf
Iran . . . . . . . . . . . . . . . . . . . . . . . . . . . . 3.2 4.2 3.8 4.1 4.1 4.3 4.8Iraq . . . . . . . . . . . . . . . . . . . . . . . . . . . . 2.2 2.3 3.3 3.9 4.5 5.6 6.1Kuwait. . . . . . . . . . . . . . . . . . . . . . . . . . 1.7 2.4 2.8 3.3 4.0 4.5 5.0Qatar. . . . . . . . . . . . . . . . . . . . . . . . . . . 0.5 0.9 0.7 0.7 0.8 0.8 0.8Saudi Arabia . . . . . . . . . . . . . . . . . . . . . 8.6 10.6 14.3 15.0 15.1 16.2 18.6United Arab Emitates . . . . . . . . . . . . . . 2.5 3.3 3.3 3.5 4.1 4.8 5.2
Total Persian Gulf. . . . . . . . . . . . . . . 18.7 23.7 28.3 30.6 32.7 36.1 40.6Other OPEC
Indonesia . . . . . . . . . . . . . . . . . . . . . . . 1.5 1.4 1.5 1.5 1.4 1.3 1.3Algeria . . . . . . . . . . . . . . . . . . . . . . . . . 1.3 1.5 1.8 1.9 2.0 2.0 2.0Libya . . . . . . . . . . . . . . . . . . . . . . . . . . . 1.5 1.5 1.8 2.0 2.1 2.0 2.1Nigeria . . . . . . . . . . . . . . . . . . . . . . . . . 1.8 2.0 2.5 2.7 2.9 3.2 3.5Venezuela. . . . . . . . . . . . . . . . . . . . . . . 2.4 3.0 4.2 5.0 5.5 5.7 6.0
Total Other OPEC . . . . . . . . . . . . . . . 8.5 9.3 11.9 13.1 13.8 14.2 14.8Total OPEC . . . . . . . . . . . . . . . . . . . . . . . 27.1 33.0 40.1 43.7 46.5 50.3 55.4
Non-OPECOECD
United States . . . . . . . . . . . . . . . . . . . . 9.7 8.8 10.0 10.5 10.2 9.9 9.5Canada . . . . . . . . . . . . . . . . . . . . . . . . . 2.0 3.1 2.8 3.5 4.0 4.4 4.5Mexico . . . . . . . . . . . . . . . . . . . . . . . . . 3.0 3.8 4.1 4.5 5.0 5.5 5.8North Sea . . . . . . . . . . . . . . . . . . . . . . . 4.0 6.3 5.8 5.4 5.6 5.4 5.2Australia and New Zealand . . . . . . . . . 0.7 0.7 0.9 0.9 1.0 1.0 1.0Other. . . . . . . . . . . . . . . . . . . . . . . . . . . 0.7 0.5 0.6 0.6 0.6 0.5 0.2
Total OECD . . . . . . . . . . . . . . . . . . . . 20.1 23.2 24.2 25.3 26.3 26.6 26.2Non-OECD
Russia. . . . . . . . . . . . . . . . . . . . . . . . . . 11.4 8.5 9.8 10.6 11.8 12.6 13.0Caspian Area . . . . . . . . . . . . . . . . . . . . 0.0 1.9 3.1 4.4 5.7 7.0 8.4Other Non-OECD Europe and Eurasia. 0.3 0.2 0.3 0.3 0.4 0.4 0.5China . . . . . . . . . . . . . . . . . . . . . . . . . . 2.8 3.4 3.9 3.9 4.1 4.3 4.2India . . . . . . . . . . . . . . . . . . . . . . . . . . . 0.7 0.9 1.1 1.3 1.3 1.4 1.6Other Non-OECD Asia . . . . . . . . . . . . . 1.0 2.0 1.7 1.8 1.9 1.9 1.8Middle East. . . . . . . . . . . . . . . . . . . . . . 1.4 1.9 2.1 2.4 2.7 3.1 3.3Africa . . . . . . . . . . . . . . . . . . . . . . . . . . 2.2 3.2 3.9 5.0 6.3 7.9 9.6Brazil. . . . . . . . . . . . . . . . . . . . . . . . . . . 0.8 1.8 3.0 3.5 4.1 4.6 5.0Other South and Central America . . . . 1.8 2.4 2.1 2.6 2.9 3.4 3.8
Total Non-OECD . . . . . . . . . . . . . . . . 22.2 26.0 31.0 35.7 41.2 46.6 51.2Total Non-OPEC . . . . . . . . . . . . . . . . . . . 42.4 49.3 55.2 61.0 67.5 73.1 77.4
Total World . . . . . . . . . . . . . . . . . . . . . . . 69.5 82.3 95.3 104.7 114.0 123.5 132.8
Note: OPEC = Organization of Petroleum Exporting Countries.Sources: History: Energy Information Administration (EIA), Energy Markets and Contingency Information Division. Projections:
EIA, System for the Analysis of Global Energy Markets (2006); and U.S. Department of the Interior, U.S. Geological Survey, WorldPetroleum Assessment 2000 (Reston, VA, July 2000).

Table E4. World Oil Production by Region and Country, Reference Case, 1990-2030(Million Barrels per Day)
Appendix E
158 Energy Information Administration / International Energy Outlook 2006
Region/Country
History (Estimates) Projections
1990 2003 2010 2015 2020 2025 2030
Conventional Production. . . . . . . . . . . . 66.5 77.9 86.7 91.4 96.1 101.0 106.4OPEC . . . . . . . . . . . . . . . . . . . . . . . . . . . 24.4 30.0 36.1 38.1 38.6 40.5 43.0
Asia. . . . . . . . . . . . . . . . . . . . . . . . . . . . 1.5 1.4 1.5 1.4 1.3 1.2 1.1Middle East. . . . . . . . . . . . . . . . . . . . . . 16.1 21.2 25.2 26.6 27.3 29.0 31.2North Africa. . . . . . . . . . . . . . . . . . . . . . 2.7 3.0 3.5 3.7 3.7 3.6 3.5West Africa . . . . . . . . . . . . . . . . . . . . . . 1.8 2.0 2.4 2.6 2.6 2.8 3.1South America . . . . . . . . . . . . . . . . . . . 2.3 2.5 3.4 3.8 3.7 3.9 4.2
Non-OPEC . . . . . . . . . . . . . . . . . . . . . . . 42.1 47.8 50.6 53.3 57.4 60.5 63.4OECD . . . . . . . . . . . . . . . . . . . . . . . . . . 20.1 22.2 22.0 21.6 21.7 21.2 20.7
OECD North America . . . . . . . . . . . . 14.7 14.8 15.0 15.2 15.4 15.4 15.4United States . . . . . . . . . . . . . . . . . . 9.7 8.6 9.4 9.6 9.5 9.1 8.9Canada . . . . . . . . . . . . . . . . . . . . . . . 2.0 2.3 1.7 1.4 1.5 1.5 1.4Mexico . . . . . . . . . . . . . . . . . . . . . . . 3.0 3.8 4.0 4.2 4.5 4.8 5.0
OECD Europe . . . . . . . . . . . . . . . . . . 4.6 6.7 6.0 5.4 5.3 4.9 4.5OECD Asia. . . . . . . . . . . . . . . . . . . . . 0.8 0.8 1.0 0.9 0.9 0.9 0.9
Japan . . . . . . . . . . . . . . . . . . . . . . . . 0.1 0.1 0.1 0.1 0.1 0.1 0.1South Korea . . . . . . . . . . . . . . . . . . . 0.0 0.0 0.0 0.0 0.0 0.0 0.0Australia and New Zealand . . . . . . . 0.7 0.7 0.9 0.8 0.8 0.8 0.8
Non-OECD. . . . . . . . . . . . . . . . . . . . . . 21.9 25.6 28.6 31.8 35.7 39.3 42.7Non-OECD Europe and Eurasia . . . 11.6 10.6 12.7 14.3 16.1 17.7 19.1
Russia. . . . . . . . . . . . . . . . . . . . . . . . 11.3 8.5 9.5 9.9 10.7 11.1 11.3Caspian Area . . . . . . . . . . . . . . . . . . 0.0 1.9 3.0 4.2 5.2 6.2 7.4Other. . . . . . . . . . . . . . . . . . . . . . . . . 0.3 0.2 0.3 0.3 0.3 0.4 0.4
Non-OECD Asia . . . . . . . . . . . . . . . . 4.4 6.0 5.9 5.7 5.9 5.9 5.7China . . . . . . . . . . . . . . . . . . . . . . . . 2.8 3.3 3.4 3.2 3.3 3.3 3.2India . . . . . . . . . . . . . . . . . . . . . . . . . 0.7 0.8 1.1 1.2 1.3 1.4 1.4Other. . . . . . . . . . . . . . . . . . . . . . . . . 1.0 1.9 1.4 1.3 1.3 1.2 1.1
Middle East . . . . . . . . . . . . . . . . . . . . 1.3 1.9 2.0 2.2 2.4 2.7 2.9Africa . . . . . . . . . . . . . . . . . . . . . . . . . 2.2 3.1 3.6 4.5 5.4 6.7 8.0Central and South America . . . . . . . 2.4 4.0 4.3 5.0 5.8 6.4 7.0
Brazil. . . . . . . . . . . . . . . . . . . . . . . . . 0.8 1.7 2.4 2.8 3.2 3.5 3.9Other. . . . . . . . . . . . . . . . . . . . . . . . . 1.6 2.4 2.0 2.3 2.6 2.9 3.2
Unconventional Production. . . . . . . . . . 0.0 1.8 4.9 6.9 8.0 9.7 11.5United States . . . . . . . . . . . . . . . . . . . . . 0.0 0.2 0.5 0.7 0.9 1.3 1.5Other North America. . . . . . . . . . . . . . . . 0.0 0.8 1.8 2.3 2.7 3.2 3.6OECD Europe. . . . . . . . . . . . . . . . . . . . . 0.0 0.0 0.1 0.1 0.1 0.1 0.1Asia. . . . . . . . . . . . . . . . . . . . . . . . . . . . . 0.0 0.2 0.7 1.1 1.3 1.5 2.1Middle East. . . . . . . . . . . . . . . . . . . . . . . 0.0 0.0 0.5 0.6 0.7 0.9 1.1Africa . . . . . . . . . . . . . . . . . . . . . . . . . . . 0.0 0.1 0.2 0.4 0.5 0.7 0.9Central and South America . . . . . . . . . . 0.0 0.5 1.1 1.7 1.8 2.1 2.3
Total Liquids Production . . . . . . . . . . . . 66.5 79.6 91.6 98.3 104.1 110.7 118.0OPEC . . . . . . . . . . . . . . . . . . . . . . . . . . . 24.5 30.7 37.3 39.7 40.4 42.5 45.3Non-OPEC . . . . . . . . . . . . . . . . . . . . . . . 42.1 48.9 54.4 58.6 63.7 68.2 72.6
Persian Gulf Production as aPercentage of World Consumption . . . 26.2% 29.6% 32.0% 32.2% 31.6% 32.2% 33.0%
Notes: OPEC = Organization of Petroleum Exporting Countries. Conventional production includes crude oil (including lease con-densates), natural gas liquids, other hydrogen hydrocarbons for refinery feedstocks, refinery gains, alcohol, and liquids producedfrom coal and other sources. Unconventional liquids include production from oil sands, ultra-heavy oils, gas-to-liquids technologies,coal-to-liquids technologies, biofuel technologies, and shale oil. Totals may not equal sum of components due to independent round-ing.
Sources: History: Energy Information Administration (EIA), Energy Markets and Contingency Information Division. Projections:EIA, System for the Analysis of Global Energy Markets (2006); and U.S. Department of the Interior, U.S. Geological Survey, WorldPetroleum Assessment 2000 (Reston, VA, July 2000).

Table E5. World Oil Production by Region and Country, High Oil Price Case, 1990-2030(Million Barrels per Day)
Oil Production and Capacity Projections
Energy Information Administration / International Energy Outlook 2006 159
Region/Country
History (Estimates) Projections
1990 2003 2010 2015 2020 2025 2030
Conventional Production. . . . . . . . . . . . 66.5 77.9 81.1 81.2 81.7 81.7 80.8OPEC . . . . . . . . . . . . . . . . . . . . . . . . . . . 24.4 30.0 31.3 26.2 26.2 26.1 26.7
Asia. . . . . . . . . . . . . . . . . . . . . . . . . . . . 1.5 1.4 1.3 1.0 0.9 0.8 0.7Middle East. . . . . . . . . . . . . . . . . . . . . . 16.1 21.2 21.8 18.3 18.5 18.7 19.4North Africa. . . . . . . . . . . . . . . . . . . . . . 2.7 3.0 3.1 2.5 2.5 2.3 2.2West Africa . . . . . . . . . . . . . . . . . . . . . . 1.8 2.0 2.1 1.8 1.8 1.8 1.9South America . . . . . . . . . . . . . . . . . . . 2.3 2.5 3.0 2.6 2.5 2.5 2.6
Non-OPEC . . . . . . . . . . . . . . . . . . . . . . . 42.1 47.8 49.9 54.9 55.5 55.5 54.1OECD . . . . . . . . . . . . . . . . . . . . . . . . . . 20.1 22.2 21.7 21.8 21.0 19.9 18.4
OECD North America . . . . . . . . . . . . 14.7 14.8 14.9 15.4 15.2 14.8 14.0United States . . . . . . . . . . . . . . . . . . 9.7 8.6 9.3 9.6 9.5 9.3 8.8Canada . . . . . . . . . . . . . . . . . . . . . . . 2.0 2.3 1.6 1.4 1.3 1.2 1.1Mexico . . . . . . . . . . . . . . . . . . . . . . . 3.0 3.8 3.9 4.4 4.3 4.3 4.2
OECD Europe . . . . . . . . . . . . . . . . . . 4.6 6.7 5.9 5.5 5.0 4.3 3.6OECD Asia. . . . . . . . . . . . . . . . . . . . . 0.8 0.8 1.0 0.9 0.9 0.8 0.7
Japan . . . . . . . . . . . . . . . . . . . . . . . . 0.1 0.1 0.1 0.1 0.1 0.1 0.1South Korea . . . . . . . . . . . . . . . . . . . 0.0 0.0 0.0 0.0 0.0 0.0 0.0Australia and New Zealand . . . . . . . 0.7 0.7 0.9 0.8 0.8 0.7 0.7
Non-OECD. . . . . . . . . . . . . . . . . . . . . . 21.9 25.6 28.2 33.1 34.5 35.6 35.7Non-OECD Europe and Eurasia . . . 11.6 10.6 12.6 15.0 15.6 16.0 16.0
Russia. . . . . . . . . . . . . . . . . . . . . . . . 11.3 8.5 9.4 10.3 10.3 10.0 9.4Caspian Area . . . . . . . . . . . . . . . . . . 0.0 1.9 3.0 4.4 5.0 5.7 6.3Other. . . . . . . . . . . . . . . . . . . . . . . . . 0.3 0.2 0.2 0.3 0.3 0.3 0.3
Non-OECD Asia . . . . . . . . . . . . . . . . 4.4 6.0 5.8 5.9 5.6 5.2 4.7China . . . . . . . . . . . . . . . . . . . . . . . . 2.8 3.3 3.3 3.3 3.2 2.9 2.6India . . . . . . . . . . . . . . . . . . . . . . . . . 0.7 0.8 1.1 1.2 1.3 1.4 1.4Other. . . . . . . . . . . . . . . . . . . . . . . . . 1.0 1.9 1.3 1.4 1.2 0.9 0.7
Middle East . . . . . . . . . . . . . . . . . . . . 1.3 1.9 2.0 2.3 2.3 2.3 2.3Africa . . . . . . . . . . . . . . . . . . . . . . . . . 2.2 3.1 3.6 4.7 5.3 6.1 6.8Central and South America . . . . . . . 2.4 4.0 4.3 5.3 5.7 5.9 5.9
Brazil. . . . . . . . . . . . . . . . . . . . . . . . . 0.8 1.7 2.4 2.9 3.1 3.2 3.2Other. . . . . . . . . . . . . . . . . . . . . . . . . 1.6 2.4 1.9 2.4 2.5 2.6 2.7
Unconventional Production. . . . . . . . . . 0.0 1.8 5.9 9.4 12.5 16.3 21.1United States . . . . . . . . . . . . . . . . . . . . . 0.0 0.2 0.5 0.8 1.2 2.0 3.2Other North America. . . . . . . . . . . . . . . . 0.0 0.8 1.9 2.7 3.5 4.1 4.9OECD Europe. . . . . . . . . . . . . . . . . . . . . 0.0 0.0 0.1 0.1 0.2 0.2 0.2Asia. . . . . . . . . . . . . . . . . . . . . . . . . . . . . 0.0 0.2 0.8 1.6 2.3 3.5 5.1Middle East. . . . . . . . . . . . . . . . . . . . . . . 0.0 0.0 0.7 1.0 1.1 1.3 1.5Africa . . . . . . . . . . . . . . . . . . . . . . . . . . . 0.0 0.1 0.3 0.7 1.1 1.6 2.1Central and South America . . . . . . . . . . 0.0 0.5 1.6 2.5 3.1 3.6 4.2
Total Liquids Production . . . . . . . . . . . . 66.5 79.6 87.0 90.6 94.2 98.0 101.9OPEC . . . . . . . . . . . . . . . . . . . . . . . . . . . 24.5 30.7 32.9 28.7 29.3 29.8 30.9Non-OPEC . . . . . . . . . . . . . . . . . . . . . . . 42.1 48.9 54.1 61.9 64.9 68.2 71.0
Persian Gulf Production as aPercentage of World Consumption . . . 26.2% 29.6% 30.2% 26.6% 26.8% 27.3% 28.7%
Notes: OPEC = Organization of Petroleum Exporting Countries. Conventional production includes crude oil (including lease con-densates), natural gas liquids, other hydrogen hydrocarbons for refinery feedstocks, refinery gains, alcohol, and liquids producedfrom coal and other sources. Unconventional liquids include production from oil sands, ultra-heavy oils, gas-to-liquids technologies,coal-to-liquids technologies, biofuel technologies, and shale oil. Totals may not equal sum of components due to independent round-ing.
Sources: History: Energy Information Administration (EIA), Energy Markets and Contingency Information Division. Projections:EIA, System for the Analysis of Global Energy Markets (2006); and U.S. Department of the Interior, U.S. Geological Survey, WorldPetroleum Assessment 2000 (Reston, VA, July 2000).

Table E6. World Oil Production by Region and Country, Low Oil Price Case, 1990-2030(Million Barrels per Day)
Appendix E
160 Energy Information Administration / International Energy Outlook 2006
Region/Country
History (Estimates) Projections
1990 2003 2010 2015 2020 2025 2030
Conventional Production. . . . . . . . . . . . 66.5 77.9 88.8 95.9 104.3 112.8 120.6OPEC . . . . . . . . . . . . . . . . . . . . . . . . . . . 24.4 30.0 36.8 39.4 41.6 45.1 49.2
Asia. . . . . . . . . . . . . . . . . . . . . . . . . . . . 1.5 1.4 1.5 1.5 1.4 1.3 1.3Middle East. . . . . . . . . . . . . . . . . . . . . . 16.1 21.2 25.7 27.5 29.4 32.2 35.7North Africa. . . . . . . . . . . . . . . . . . . . . . 2.7 3.0 3.6 3.8 4.0 4.0 4.0West Africa . . . . . . . . . . . . . . . . . . . . . . 1.8 2.0 2.5 2.7 2.8 3.1 3.5South America . . . . . . . . . . . . . . . . . . . 2.3 2.5 3.5 3.9 4.0 4.4 4.7
Non-OPEC . . . . . . . . . . . . . . . . . . . . . . . 42.1 47.8 52.0 56.5 62.6 67.7 71.5OECD . . . . . . . . . . . . . . . . . . . . . . . . . . 20.1 22.2 22.5 22.7 23.2 23.2 22.7
OECD North America . . . . . . . . . . . . 14.7 14.8 15.3 15.9 16.2 16.4 16.4United States . . . . . . . . . . . . . . . . . . 9.7 8.6 9.5 9.8 9.6 9.2 8.8Canada . . . . . . . . . . . . . . . . . . . . . . . 2.0 2.3 1.7 1.6 1.7 1.8 1.8Mexico . . . . . . . . . . . . . . . . . . . . . . . 3.0 3.8 4.1 4.5 5.0 5.4 5.8
OECD Europe . . . . . . . . . . . . . . . . . . 4.6 6.7 6.2 5.8 6.0 5.7 5.3OECD Asia. . . . . . . . . . . . . . . . . . . . . 0.8 0.8 1.0 1.0 1.0 1.0 1.0
Japan . . . . . . . . . . . . . . . . . . . . . . . . 0.1 0.1 0.1 0.1 0.1 0.1 0.1South Korea . . . . . . . . . . . . . . . . . . . 0.0 0.0 0.0 0.0 0.0 0.0 0.0Australia and New Zealand . . . . . . . 0.7 0.7 0.9 0.9 0.9 1.0 0.9
Non-OECD. . . . . . . . . . . . . . . . . . . . . . 21.9 25.6 29.5 33.8 39.4 44.5 48.8Non-OECD Europe and Eurasia . . . 11.6 10.6 13.1 15.2 17.8 20.0 21.8
Russia. . . . . . . . . . . . . . . . . . . . . . . . 11.3 8.5 9.8 10.5 11.7 12.5 12.9Caspian Area . . . . . . . . . . . . . . . . . . 0.0 1.9 3.1 4.4 5.7 7.0 8.4Other. . . . . . . . . . . . . . . . . . . . . . . . . 0.3 0.2 0.3 0.3 0.4 0.4 0.5
Non-OECD Asia . . . . . . . . . . . . . . . . 4.4 6.0 6.1 6.1 6.6 6.8 6.7China . . . . . . . . . . . . . . . . . . . . . . . . 2.8 3.3 3.5 3.4 3.7 3.8 3.8India . . . . . . . . . . . . . . . . . . . . . . . . . 0.7 0.8 1.1 1.2 1.3 1.4 1.4Other. . . . . . . . . . . . . . . . . . . . . . . . . 1.0 1.9 1.5 1.5 1.6 1.6 1.5
Middle East . . . . . . . . . . . . . . . . . . . . 1.3 1.9 2.1 2.4 2.7 3.1 3.3Africa . . . . . . . . . . . . . . . . . . . . . . . . . 2.2 3.1 3.7 4.7 5.9 7.4 9.0Central and South America . . . . . . . 2.4 4.0 4.5 5.3 6.4 7.3 7.9
Brazil. . . . . . . . . . . . . . . . . . . . . . . . . 0.8 1.7 2.5 2.9 3.5 4.0 4.4Other. . . . . . . . . . . . . . . . . . . . . . . . . 1.6 2.4 2.0 2.4 2.9 3.3 3.6
Unconventional Production. . . . . . . . . . 0.0 1.8 3.7 5.5 6.1 6.7 7.1United States . . . . . . . . . . . . . . . . . . . . . 0.0 0.2 0.5 0.6 0.6 0.6 0.6Other North America. . . . . . . . . . . . . . . . 0.0 0.8 1.1 1.9 2.3 2.5 2.7OECD Europe. . . . . . . . . . . . . . . . . . . . . 0.0 0.0 0.1 0.1 0.1 0.1 0.1Asia. . . . . . . . . . . . . . . . . . . . . . . . . . . . . 0.0 0.2 0.6 0.8 0.8 0.9 0.9Middle East. . . . . . . . . . . . . . . . . . . . . . . 0.0 0.0 0.1 0.2 0.2 0.3 0.3Africa . . . . . . . . . . . . . . . . . . . . . . . . . . . 0.0 0.1 0.2 0.3 0.4 0.5 0.6Central and South America . . . . . . . . . . 0.0 0.5 1.1 1.6 1.7 1.9 1.9
Total Liquids Production . . . . . . . . . . . . 66.5 79.6 92.5 101.4 110.4 119.5 127.7OPEC . . . . . . . . . . . . . . . . . . . . . . . . . . . 24.5 30.7 37.9 41.0 43.3 46.9 51.0Non-OPEC . . . . . . . . . . . . . . . . . . . . . . . 42.1 48.9 54.6 60.4 67.1 72.6 76.7
Persian Gulf Production as aPercentage of World Consumption . . . 26.2% 29.6% 31.3% 31.3% 30.9% 31.5% 32.6%
Notes: OPEC = Organization of Petroleum Exporting Countries. Conventional production includes crude oil (including lease con-densates), natural gas liquids, other hydrogen hydrocarbons for refinery feedstocks, refinery gains, alcohol, and liquids producedfrom coal and other sources. Unconventional liquids include production from oil sands, ultra-heavy oils, gas-to-liquids technologies,coal-to-liquids technologies, biofuel technologies, and shale oil. Totals may not equal sum of components due to independent round-ing.
Sources: History: Energy Information Administration (EIA), Energy Markets and Contingency Information Division. Projections:EIA, System for the Analysis of Global Energy Markets (2006); and U.S. Department of the Interior, U.S. Geological Survey, WorldPetroleum Assessment 2000 (Reston, VA, July 2000).

Appendix F
Reference Case Projections forElectricity Capacity and Generation by Fuel


Table F1. World Total Installed Generating Capacity by Region and Country, 2003-2030(Gigawatts)
Reference Case Electricity Capacity and Generation Projections
Energy Information Administration / International Energy Outlook 2006 163
Region/Country
History Projections Average AnnualPercent Change,
2003-20302003 2010 2015 2020 2025 2030
OECDOECD North America . . . . . . . . . . . 1,091 1,200 1,197 1,280 1,370 1,483 1.1
United Statesa. . . . . . . . . . . . . . . . . 922 988 965 1,027 1,098 1,186 0.9Canada . . . . . . . . . . . . . . . . . . . . . . 119 127 138 148 157 167 1.3Mexico. . . . . . . . . . . . . . . . . . . . . . . 50 85 95 105 116 129 3.6
OECD Europe . . . . . . . . . . . . . . . . . 751 801 806 846 874 912 0.7OECD Asia . . . . . . . . . . . . . . . . . . . . 379 425 439 446 458 472 0.8
Japan . . . . . . . . . . . . . . . . . . . . . . . 261 277 278 277 278 276 0.2South Korea . . . . . . . . . . . . . . . . . . 60 84 92 98 105 116 2.5Australia/New Zealand . . . . . . . . . . 58 64 69 71 75 80 1.2
Total OECD . . . . . . . . . . . . . . . . . 2,221 2,427 2,442 2,573 2,702 2,866 0.9
Non-OECDNon-OECD Europe and Eurasia. . . 400 503 547 580 614 641 1.8
Russia . . . . . . . . . . . . . . . . . . . . . . . 216 272 298 316 337 351 1.8Other . . . . . . . . . . . . . . . . . . . . . . . . 184 231 249 264 277 290 1.7
Non-OECD Asia. . . . . . . . . . . . . . . . 657 1,062 1,252 1,450 1,653 1,897 4.0China. . . . . . . . . . . . . . . . . . . . . . . . 337 552 673 797 932 1,086 4.4India . . . . . . . . . . . . . . . . . . . . . . . . 117 200 235 273 316 368 4.3Other Non-OECD Asia . . . . . . . . . . 203 310 345 381 406 443 2.9
Middle East . . . . . . . . . . . . . . . . . . . 123 237 251 261 269 276 3.0Africa . . . . . . . . . . . . . . . . . . . . . . . . 109 156 170 181 194 210 2.5Central and South America . . . . . . 200 271 319 368 417 459 3.1
Brazil . . . . . . . . . . . . . . . . . . . . . . . . 86 122 144 164 184 202 3.2Other Central and South America. . 114 149 175 205 233 258 3.1
Total Non-OECD . . . . . . . . . . . . . 1,489 2,229 2,539 2,840 3,147 3,483 3.2
Total World . . . . . . . . . . . . . . . . . . . . 3,710 4,656 4,981 5,413 5,850 6,349 2.0aIncludes the 50 States and the District of Columbia.Note: Totals may not equal sum of components due to independent rounding.Sources: History: Derived from Energy Information Administration (EIA), International Energy Annual 2003 (May-July 2005), web
site www.eia.doe.gov/iea/. Projections: EIA, Annual Energy Outlook 2006, DOE/EIA-0383(2006) (Washington, DC, February2006), AEO2006 National Energy Modeling System, run AEO2006.D111905A, web site www.eia.doe.gov/oiaf/aeo/; and System forthe Analysis of Global Energy Markets (2006).

Table F2. World Installed Oil-Fired Generating Capacity by Region and Country, 2003-2030(Gigawatts)
Appendix F
164 Energy Information Administration / International Energy Outlook 2006
Region/Country
History Projections Average AnnualPercent Change,
2003-20302003 2010 2015 2020 2025 2030
OECDOECD North America . . . . . . . . . . . 87 83 68 69 74 82 -0.2
United Statesa. . . . . . . . . . . . . . . . . 68 54 38 39 44 53 -0.9Canada . . . . . . . . . . . . . . . . . . . . . . 5 5 5 5 5 5 -0.2Mexico. . . . . . . . . . . . . . . . . . . . . . . 14 24 25 26 26 25 2.2
OECD Europe . . . . . . . . . . . . . . . . . 66 66 66 65 64 63 -0.1OECD Asia . . . . . . . . . . . . . . . . . . . . 68 69 69 67 66 65 -0.2
Japan . . . . . . . . . . . . . . . . . . . . . . . 60 61 61 60 59 57 -0.2South Korea . . . . . . . . . . . . . . . . . . 6 6 6 6 6 6 0.0Australia/New Zealand . . . . . . . . . . 1 1 1 1 1 1 0.1
Total OECD . . . . . . . . . . . . . . . . . 220 218 204 202 204 210 -0.2
Non-OECDNon-OECD Europe and Eurasia. . . 30 31 31 31 30 30 0.0
Russia . . . . . . . . . . . . . . . . . . . . . . . 8 8 8 8 8 8 -0.1Other . . . . . . . . . . . . . . . . . . . . . . . . 22 23 23 22 22 22 0.0
Non-OECD Asia. . . . . . . . . . . . . . . . 53 79 79 78 77 81 1.6China. . . . . . . . . . . . . . . . . . . . . . . . 13 35 35 35 35 34 3.7India . . . . . . . . . . . . . . . . . . . . . . . . 5 7 8 8 8 8 1.9Other Non-OECD Asia . . . . . . . . . . 35 36 36 36 35 38 0.4
Middle East . . . . . . . . . . . . . . . . . . . 28 46 48 49 50 52 2.3Africa . . . . . . . . . . . . . . . . . . . . . . . . 16 17 18 18 21 22 1.2Central and South America . . . . . . 26 27 30 34 37 38 1.4
Brazil . . . . . . . . . . . . . . . . . . . . . . . . 4 4 4 4 5 5 0.9Other Central and South America. . 23 23 26 29 33 34 1.5
Total Non-OECD . . . . . . . . . . . . . 152 200 206 210 216 223 1.4
Total World . . . . . . . . . . . . . . . . . . . . 372 418 410 412 420 433 0.6aIncludes the 50 States and the District of Columbia.Note: Totals may not equal sum of components due to independent rounding.Sources: History: Derived from Energy Information Administration (EIA), International Energy Annual 2003 (May-July 2005), web
site www.eia.doe.gov/iea/. Projections: EIA, Annual Energy Outlook 2006, DOE/EIA-0383(2006) (Washington, DC, February2006), AEO2006 National Energy Modeling System, run AEO2006.D111905A, web site www.eia.doe.gov/oiaf/aeo/; and System forthe Analysis of Global Energy Markets (2006).
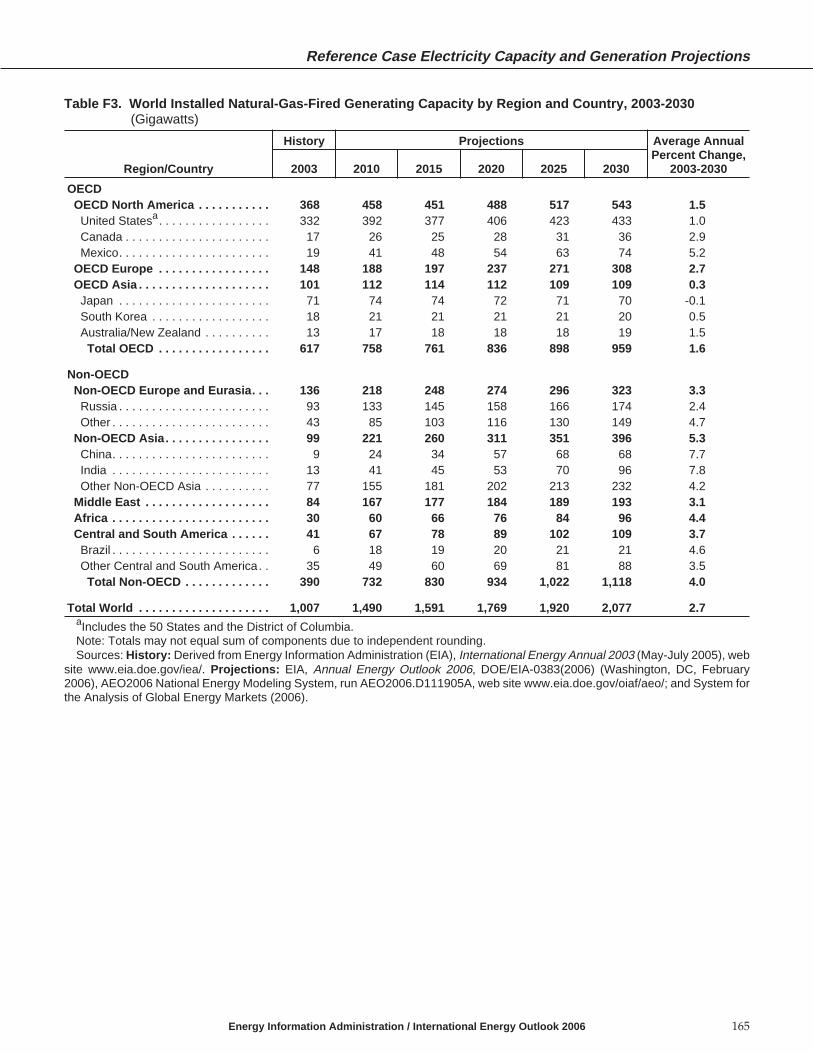
Table F3. World Installed Natural-Gas-Fired Generating Capacity by Region and Country, 2003-2030(Gigawatts)
Reference Case Electricity Capacity and Generation Projections
Energy Information Administration / International Energy Outlook 2006 165
Region/Country
History Projections Average AnnualPercent Change,
2003-20302003 2010 2015 2020 2025 2030
OECDOECD North America . . . . . . . . . . . 368 458 451 488 517 543 1.5
United Statesa. . . . . . . . . . . . . . . . . 332 392 377 406 423 433 1.0Canada . . . . . . . . . . . . . . . . . . . . . . 17 26 25 28 31 36 2.9Mexico. . . . . . . . . . . . . . . . . . . . . . . 19 41 48 54 63 74 5.2
OECD Europe . . . . . . . . . . . . . . . . . 148 188 197 237 271 308 2.7OECD Asia . . . . . . . . . . . . . . . . . . . . 101 112 114 112 109 109 0.3
Japan . . . . . . . . . . . . . . . . . . . . . . . 71 74 74 72 71 70 -0.1South Korea . . . . . . . . . . . . . . . . . . 18 21 21 21 21 20 0.5Australia/New Zealand . . . . . . . . . . 13 17 18 18 18 19 1.5
Total OECD . . . . . . . . . . . . . . . . . 617 758 761 836 898 959 1.6
Non-OECDNon-OECD Europe and Eurasia. . . 136 218 248 274 296 323 3.3
Russia . . . . . . . . . . . . . . . . . . . . . . . 93 133 145 158 166 174 2.4Other . . . . . . . . . . . . . . . . . . . . . . . . 43 85 103 116 130 149 4.7
Non-OECD Asia. . . . . . . . . . . . . . . . 99 221 260 311 351 396 5.3China. . . . . . . . . . . . . . . . . . . . . . . . 9 24 34 57 68 68 7.7India . . . . . . . . . . . . . . . . . . . . . . . . 13 41 45 53 70 96 7.8Other Non-OECD Asia . . . . . . . . . . 77 155 181 202 213 232 4.2
Middle East . . . . . . . . . . . . . . . . . . . 84 167 177 184 189 193 3.1Africa . . . . . . . . . . . . . . . . . . . . . . . . 30 60 66 76 84 96 4.4Central and South America . . . . . . 41 67 78 89 102 109 3.7
Brazil . . . . . . . . . . . . . . . . . . . . . . . . 6 18 19 20 21 21 4.6Other Central and South America. . 35 49 60 69 81 88 3.5
Total Non-OECD . . . . . . . . . . . . . 390 732 830 934 1,022 1,118 4.0
Total World . . . . . . . . . . . . . . . . . . . . 1,007 1,490 1,591 1,769 1,920 2,077 2.7aIncludes the 50 States and the District of Columbia.Note: Totals may not equal sum of components due to independent rounding.Sources: History: Derived from Energy Information Administration (EIA), International Energy Annual 2003 (May-July 2005), web
site www.eia.doe.gov/iea/. Projections: EIA, Annual Energy Outlook 2006, DOE/EIA-0383(2006) (Washington, DC, February2006), AEO2006 National Energy Modeling System, run AEO2006.D111905A, web site www.eia.doe.gov/oiaf/aeo/; and System forthe Analysis of Global Energy Markets (2006).

Table F4. World Installed Coal-Fired Generating Capacity by Region and Country, 2003-2030(Gigawatts)
Appendix F
166 Energy Information Administration / International Energy Outlook 2006
Region/Country
History Projections Average AnnualPercent Change,
2003-20302003 2010 2015 2020 2025 2030
OECDOECD North America . . . . . . . . . . . 333 334 344 377 423 491 1.5
United Statesa. . . . . . . . . . . . . . . . . 310 319 319 345 390 457 1.4Canada . . . . . . . . . . . . . . . . . . . . . . 18 11 19 23 24 25 1.3Mexico. . . . . . . . . . . . . . . . . . . . . . . 5 5 6 9 9 9 2.5
OECD Europe . . . . . . . . . . . . . . . . . 196 198 198 196 193 198 0.0OECD Asia . . . . . . . . . . . . . . . . . . . . 85 102 107 110 117 126 1.5
Japan . . . . . . . . . . . . . . . . . . . . . . . 38 41 41 40 39 38 0.1South Korea . . . . . . . . . . . . . . . . . . 17 32 35 37 42 49 4.0Australia/New Zealand . . . . . . . . . . 30 30 32 34 36 39 1.0
Total OECD . . . . . . . . . . . . . . . . . 613 635 650 683 733 816 1.1
Non-OECDNon-OECD Europe and Eurasia. . . 108 108 108 107 105 104 -0.1
Russia . . . . . . . . . . . . . . . . . . . . . . . 49 49 49 48 48 47 -0.1Other . . . . . . . . . . . . . . . . . . . . . . . . 59 59 59 58 57 57 -0.1
Non-OECD Asia. . . . . . . . . . . . . . . . 348 496 615 728 853 1,005 4.0China. . . . . . . . . . . . . . . . . . . . . . . . 239 348 438 531 643 785 4.5India . . . . . . . . . . . . . . . . . . . . . . . . 67 95 119 140 153 161 3.3Other Non-OECD Asia . . . . . . . . . . 42 52 57 57 57 59 1.2
Middle East . . . . . . . . . . . . . . . . . . . 5 6 6 6 6 6 0.5Africa . . . . . . . . . . . . . . . . . . . . . . . . 39 49 54 54 54 53 1.1Central and South America . . . . . . 5 8 10 12 13 14 3.4
Brazil . . . . . . . . . . . . . . . . . . . . . . . . 1 3 4 5 6 6 5.4Other Central and South America. . 4 5 5 7 7 8 2.5
Total Non-OECD . . . . . . . . . . . . . 505 667 792 907 1,031 1,181 3.2
Total World . . . . . . . . . . . . . . . . . . . . 1,119 1,302 1,442 1,590 1,763 1,997 2.2aIncludes the 50 States and the District of Columbia.Note: Totals may not equal sum of components due to independent rounding.Sources: History: Derived from Energy Information Administration (EIA), International Energy Annual 2003 (May-July 2005), web
site www.eia.doe.gov/iea/. Projections: EIA, Annual Energy Outlook 2006, DOE/EIA-0383(2006) (Washington, DC, February2006), AEO2006 National Energy Modeling System, run AEO2006.D111905A, web site www.eia.doe.gov/oiaf/aeo/; and System forthe Analysis of Global Energy Markets (2006).

Table F5. World Installed Nuclear Generating Capacity by Region and Country, 2003-2030(Gigawatts)
Reference Case Electricity Capacity and Generation Projections
Energy Information Administration / International Energy Outlook 2006 167
Region/Country
History Projections Average AnnualPercent Change,
2003-20302003 2010 2015 2020 2025 2030
OECDOECD North America . . . . . . . . . . . 111 117 121 125 125 125 0.4
United Statesa. . . . . . . . . . . . . . . . . 99 101 104 109 109 109 0.3Canada . . . . . . . . . . . . . . . . . . . . . . 11 14 15 15 14 14 1.2Mexico. . . . . . . . . . . . . . . . . . . . . . . 1 1 1 1 1 1 0.2
OECD Europe . . . . . . . . . . . . . . . . . 134 126 122 111 102 95 -1.3OECD Asia . . . . . . . . . . . . . . . . . . . . 59 65 70 76 82 86 1.4
Japan . . . . . . . . . . . . . . . . . . . . . . . 44 47 49 51 55 56 0.9South Korea . . . . . . . . . . . . . . . . . . 15 18 22 25 27 30 2.6Australia/New Zealand . . . . . . . . . . 0 0 0 0 0 0 —
Total OECD . . . . . . . . . . . . . . . . . 304 308 313 313 308 306 0.0
Non-OECDNon-OECD Europe and Eurasia. . . 39 41 46 55 61 60 1.6
Russia . . . . . . . . . . . . . . . . . . . . . . . 21 23 27 33 39 43 2.7Other . . . . . . . . . . . . . . . . . . . . . . . . 18 18 18 22 22 17 -0.2
Non-OECD Asia. . . . . . . . . . . . . . . . 14 26 36 47 57 65 5.9China. . . . . . . . . . . . . . . . . . . . . . . . 6 11 18 23 30 39 7.1India . . . . . . . . . . . . . . . . . . . . . . . . 3 8 11 13 14 15 6.8Other Non-OECD Asia . . . . . . . . . . 5 7 8 11 13 12 3.0
Middle East . . . . . . . . . . . . . . . . . . . 0 1 1 1 1 1 —Africa . . . . . . . . . . . . . . . . . . . . . . . . 2 2 2 2 2 2 0.5Central and South America . . . . . . 3 3 5 4 4 3 0.4
Brazil . . . . . . . . . . . . . . . . . . . . . . . . 2 2 3 3 3 3 1.0Other Central and South America. . 1 1 2 1 1 1 -1.1
Total Non-OECD . . . . . . . . . . . . . 57 72 90 110 125 132 3.1
Total World . . . . . . . . . . . . . . . . . . . . 361 380 403 422 433 438 0.7aIncludes the 50 States and the District of Columbia.Note: Totals may not equal sum of components due to independent rounding.Sources: History: Derived from Energy Information Administration (EIA), International Energy Annual 2003 (May-July 2005), web
site www.eia.doe.gov/iea/. Projections: EIA, Annual Energy Outlook 2006, DOE/EIA-0383(2006) (Washington, DC, February2006), AEO2006 National Energy Modeling System, run AEO2006.D111905A, web site www.eia.doe.gov/oiaf/aeo/; and System forthe Analysis of Global Energy Markets (2006).

Table F6. World Installed Renewable Generating Capacity by Region and Country, 2003-2030(Gigawatts)
Appendix F
168 Energy Information Administration / International Energy Outlook 2006
Region/Country
History Projections Average AnnualPercent Change,
2003-20302003 2010 2015 2020 2025 2030
OECDOECD North America . . . . . . . . . . . 193 208 213 221 232 242 0.8
United Statesa. . . . . . . . . . . . . . . . . 113 123 126 129 133 135 0.7Canada . . . . . . . . . . . . . . . . . . . . . . 69 72 74 77 82 87 0.9Mexico. . . . . . . . . . . . . . . . . . . . . . . 11 13 14 15 17 19 2.1
OECD Europe . . . . . . . . . . . . . . . . . 208 222 222 238 244 248 0.7OECD Asia . . . . . . . . . . . . . . . . . . . . 66 77 79 81 84 86 0.9
Japan . . . . . . . . . . . . . . . . . . . . . . . 48 54 54 54 54 54 0.4South Korea . . . . . . . . . . . . . . . . . . 4 7 8 9 10 11 3.7Australia/New Zealand . . . . . . . . . . 14 16 17 18 20 21 1.4
Total OECD . . . . . . . . . . . . . . . . . 467 507 514 539 559 575 0.8
Non-OECDNon-OECD Europe and Eurasia. . . 88 104 114 114 121 123 1.3
Russia . . . . . . . . . . . . . . . . . . . . . . . 46 59 68 68 76 78 2.0Other . . . . . . . . . . . . . . . . . . . . . . . . 42 46 46 46 46 46 0.3
Non-OECD Asia. . . . . . . . . . . . . . . . 143 241 262 285 315 349 3.3China. . . . . . . . . . . . . . . . . . . . . . . . 70 134 148 152 156 160 3.1India . . . . . . . . . . . . . . . . . . . . . . . . 30 48 52 59 71 87 4.0Other Non-OECD Asia . . . . . . . . . . 43 59 62 74 88 102 3.2
Middle East . . . . . . . . . . . . . . . . . . . 7 17 19 21 23 24 4.8Africa . . . . . . . . . . . . . . . . . . . . . . . . 22 29 30 30 33 37 1.9Central and South America . . . . . . 124 166 196 229 261 295 3.3
Brazil . . . . . . . . . . . . . . . . . . . . . . . . 73 96 113 131 149 168 3.1Other Central and South America. . 51 70 82 98 111 127 3.4
Total Non-OECD . . . . . . . . . . . . . 384 558 622 680 754 829 2.9
Total World . . . . . . . . . . . . . . . . . . . . 851 1,065 1,136 1,219 1,313 1,404 1.9aIncludes the 50 States and the District of Columbia.Note: Totals may not equal sum of components due to independent rounding.Sources: History: Derived from Energy Information Administration (EIA), International Energy Annual 2003 (May-July 2005), web
site www.eia.doe.gov/iea/. Projections: EIA, Annual Energy Outlook 2006, DOE/EIA-0383(2006) (Washington, DC, February2006), AEO2006 National Energy Modeling System, run AEO2006.D111905A, web site www.eia.doe.gov/oiaf/aeo/; and System forthe Analysis of Global Energy Markets (2006).

Table F7. World Total Net Electricity Generation From Central Producers by Region and Country, 2003-2030(Billion Kilowatthours)
Reference Case Electricity Capacity and Generation Projections
Energy Information Administration / International Energy Outlook 2006 169
Region/Country
History Projections Average AnnualPercent Change,
2003-20302003 2010 2015 2020 2025 2030
OECDOECD North America . . . . . . . . . . . 4,442 5,109 5,553 6,017 6,439 6,944 1.7
United Statesa. . . . . . . . . . . . . . . . . 3,720 4,196 4,501 4,827 5,121 5,497 1.5Canada . . . . . . . . . . . . . . . . . . . . . . 531 627 691 745 786 829 1.7Mexico. . . . . . . . . . . . . . . . . . . . . . . 191 286 361 444 531 618 4.4
OECD Europe . . . . . . . . . . . . . . . . . 2,975 3,471 3,679 3,849 4,073 4,350 1.4OECD Asia . . . . . . . . . . . . . . . . . . . . 1,465 1,799 1,941 2,044 2,141 2,257 1.6
Japan . . . . . . . . . . . . . . . . . . . . . . . 916 1,060 1,112 1,143 1,169 1,206 1.0South Korea . . . . . . . . . . . . . . . . . . 308 456 524 574 622 674 2.9Australia/New Zealand . . . . . . . . . . 241 283 305 327 350 377 1.7
Total OECD . . . . . . . . . . . . . . . . . 8,882 10,380 11,174 11,909 12,653 13,551 1.6
Non-OECDNon-OECD Europe and Eurasia. . . 1,377 1,985 2,293 2,586 2,836 3,071 3.0
Russia . . . . . . . . . . . . . . . . . . . . . . . 812 1,178 1,345 1,516 1,655 1,781 3.0Other . . . . . . . . . . . . . . . . . . . . . . . . 565 807 949 1,070 1,181 1,290 3.1
Non-OECD Asia. . . . . . . . . . . . . . . . 3,014 5,027 6,307 7,649 9,049 10,599 4.8China. . . . . . . . . . . . . . . . . . . . . . . . 1,782 3,003 3,779 4,588 5,456 6,436 4.9India . . . . . . . . . . . . . . . . . . . . . . . . 516 900 1,113 1,340 1,574 1,854 4.8Other Non-OECD Asia . . . . . . . . . . 715 1,124 1,415 1,721 2,019 2,309 4.4
Middle East . . . . . . . . . . . . . . . . . . . 448 738 846 938 1,025 1,108 3.4Africa . . . . . . . . . . . . . . . . . . . . . . . . 408 607 713 815 921 1,035 3.5Central and South America . . . . . . 756 1,162 1,426 1,677 1,938 2,196 4.0
Brazil . . . . . . . . . . . . . . . . . . . . . . . . 323 491 594 690 791 890 3.8Other Central and South America. . 433 670 833 987 1,148 1,306 4.2
Total Non-OECD . . . . . . . . . . . . . 6,003 9,518 11,587 13,665 15,769 18,009 4.2
Total World . . . . . . . . . . . . . . . . . . . . 14,885 19,898 22,761 25,575 28,423 31,560 2.8aIncludes the 50 States and the District of Columbia.Note: Totals may not equal sum of components due to independent rounding.Sources: History: Derived from Energy Information Administration (EIA), International Energy Annual 2003 (May-July 2005), web
site www.eia.doe.gov/iea/. Projections: EIA, Annual Energy Outlook 2006, DOE/EIA-0383(2006) (Washington, DC, February2006), AEO2006 National Energy Modeling System, run AEO2006.D111905A, web site www.eia.doe.gov/oiaf/aeo/; and System forthe Analysis of Global Energy Markets (2006).

Table F8. World Net Oil-Fired Electricity Generation From Central Producers by Region and Country,2003-2030(Billion Kilowatthours)
Appendix F
170 Energy Information Administration / International Energy Outlook 2006
Region/Country
History Projections Average AnnualPercent Change,
2003-20302003 2010 2015 2020 2025 2030
OECDOECD North America . . . . . . . . . . . 189 189 196 207 216 223 0.6
United Statesa. . . . . . . . . . . . . . . . . 115 93 91 92 95 101 -0.5Canada . . . . . . . . . . . . . . . . . . . . . . 13 17 15 16 17 18 1.2Mexico. . . . . . . . . . . . . . . . . . . . . . . 60 79 90 99 104 103 2.0
OECD Europe . . . . . . . . . . . . . . . . . 92 82 88 95 103 111 0.7OECD Asia . . . . . . . . . . . . . . . . . . . . 103 106 114 122 126 132 0.9
Japan . . . . . . . . . . . . . . . . . . . . . . . 81 83 90 93 96 100 0.8South Korea . . . . . . . . . . . . . . . . . . 21 21 23 25 27 28 1.2Australia/New Zealand . . . . . . . . . . 1 2 1 3 3 3 6.4
Total OECD . . . . . . . . . . . . . . . . . 384 377 398 424 445 466 0.7
Non-OECDNon-OECD Europe and Eurasia. . . 48 48 51 53 56 59 0.8
Russia . . . . . . . . . . . . . . . . . . . . . . . 20 18 18 17 17 17 -0.5Other . . . . . . . . . . . . . . . . . . . . . . . . 28 30 34 36 38 42 1.5
Non-OECD Asia. . . . . . . . . . . . . . . . 122 308 290 299 296 282 3.1China. . . . . . . . . . . . . . . . . . . . . . . . 31 170 117 93 55 5 -6.4India . . . . . . . . . . . . . . . . . . . . . . . . 11 18 21 23 25 28 3.5Other Non-OECD Asia . . . . . . . . . . 80 120 152 183 216 249 4.3
Middle East . . . . . . . . . . . . . . . . . . . 157 193 217 235 251 265 2.0Africa . . . . . . . . . . . . . . . . . . . . . . . . 39 57 67 77 87 98 3.5Central and South America . . . . . . 73 90 111 127 144 159 2.9
Brazil . . . . . . . . . . . . . . . . . . . . . . . . 7 11 13 14 16 16 3.0Other Central and South America. . 66 80 98 112 128 143 2.9
Total Non-OECD . . . . . . . . . . . . . 438 697 736 791 833 863 2.5
Total World . . . . . . . . . . . . . . . . . . . . 823 1,074 1,134 1,215 1,277 1,329 1.8aIncludes the 50 States and the District of Columbia.Note: Totals may not equal sum of components due to independent rounding.Sources: History: Derived from Energy Information Administration (EIA), International Energy Annual 2003 (May-July 2005), web
site www.eia.doe.gov/iea/. Projections: EIA, Annual Energy Outlook 2006, DOE/EIA-0383(2006) (Washington, DC, February2006), AEO2006 National Energy Modeling System, run AEO2006.D111905A, web site www.eia.doe.gov/oiaf/aeo/; and System forthe Analysis of Global Energy Markets (2006).
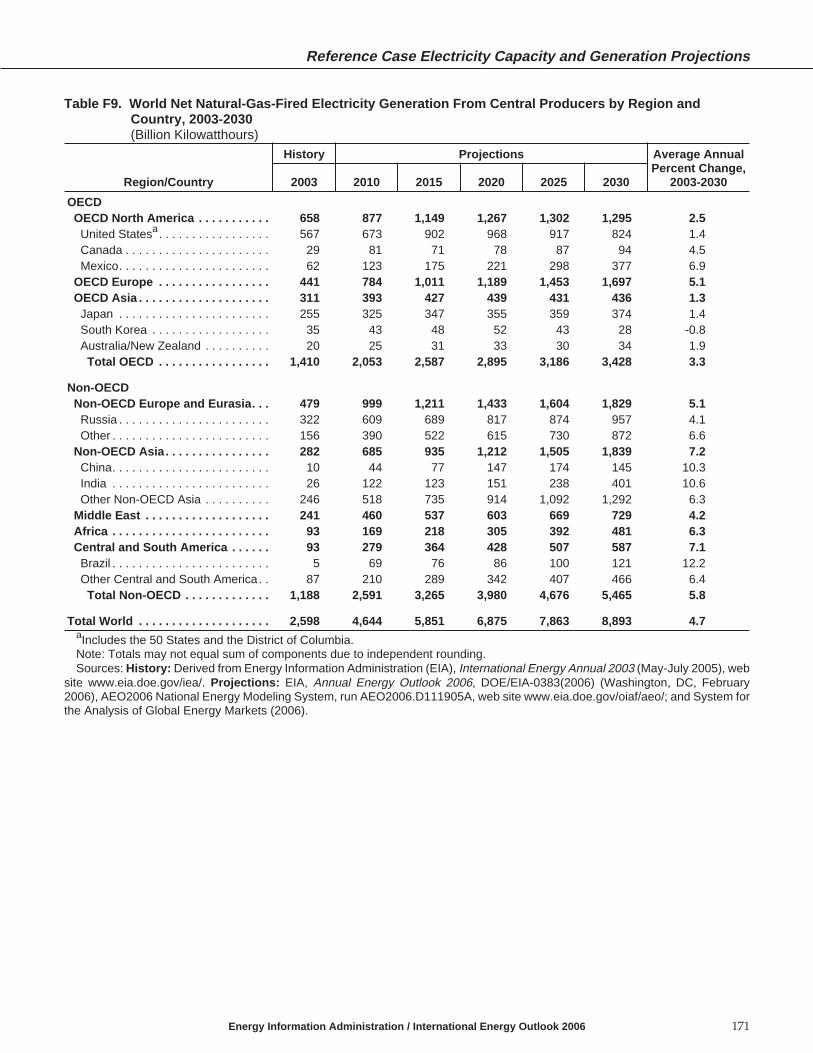
Table F9. World Net Natural-Gas-Fired Electricity Generation From Central Producers by Region andCountry, 2003-2030(Billion Kilowatthours)
Reference Case Electricity Capacity and Generation Projections
Energy Information Administration / International Energy Outlook 2006 171
Region/Country
History Projections Average AnnualPercent Change,
2003-20302003 2010 2015 2020 2025 2030
OECDOECD North America . . . . . . . . . . . 658 877 1,149 1,267 1,302 1,295 2.5
United Statesa. . . . . . . . . . . . . . . . . 567 673 902 968 917 824 1.4Canada . . . . . . . . . . . . . . . . . . . . . . 29 81 71 78 87 94 4.5Mexico. . . . . . . . . . . . . . . . . . . . . . . 62 123 175 221 298 377 6.9
OECD Europe . . . . . . . . . . . . . . . . . 441 784 1,011 1,189 1,453 1,697 5.1OECD Asia . . . . . . . . . . . . . . . . . . . . 311 393 427 439 431 436 1.3
Japan . . . . . . . . . . . . . . . . . . . . . . . 255 325 347 355 359 374 1.4South Korea . . . . . . . . . . . . . . . . . . 35 43 48 52 43 28 -0.8Australia/New Zealand . . . . . . . . . . 20 25 31 33 30 34 1.9
Total OECD . . . . . . . . . . . . . . . . . 1,410 2,053 2,587 2,895 3,186 3,428 3.3
Non-OECDNon-OECD Europe and Eurasia. . . 479 999 1,211 1,433 1,604 1,829 5.1
Russia . . . . . . . . . . . . . . . . . . . . . . . 322 609 689 817 874 957 4.1Other . . . . . . . . . . . . . . . . . . . . . . . . 156 390 522 615 730 872 6.6
Non-OECD Asia. . . . . . . . . . . . . . . . 282 685 935 1,212 1,505 1,839 7.2China. . . . . . . . . . . . . . . . . . . . . . . . 10 44 77 147 174 145 10.3India . . . . . . . . . . . . . . . . . . . . . . . . 26 122 123 151 238 401 10.6Other Non-OECD Asia . . . . . . . . . . 246 518 735 914 1,092 1,292 6.3
Middle East . . . . . . . . . . . . . . . . . . . 241 460 537 603 669 729 4.2Africa . . . . . . . . . . . . . . . . . . . . . . . . 93 169 218 305 392 481 6.3Central and South America . . . . . . 93 279 364 428 507 587 7.1
Brazil . . . . . . . . . . . . . . . . . . . . . . . . 5 69 76 86 100 121 12.2Other Central and South America. . 87 210 289 342 407 466 6.4
Total Non-OECD . . . . . . . . . . . . . 1,188 2,591 3,265 3,980 4,676 5,465 5.8
Total World . . . . . . . . . . . . . . . . . . . . 2,598 4,644 5,851 6,875 7,863 8,893 4.7aIncludes the 50 States and the District of Columbia.Note: Totals may not equal sum of components due to independent rounding.Sources: History: Derived from Energy Information Administration (EIA), International Energy Annual 2003 (May-July 2005), web
site www.eia.doe.gov/iea/. Projections: EIA, Annual Energy Outlook 2006, DOE/EIA-0383(2006) (Washington, DC, February2006), AEO2006 National Energy Modeling System, run AEO2006.D111905A, web site www.eia.doe.gov/oiaf/aeo/; and System forthe Analysis of Global Energy Markets (2006).

Table F10. World Net Coal-Fired Electricity Generation From Central Producers by Region and Country,2003-2030(Billion Kilowatthours)
Appendix F
172 Energy Information Administration / International Energy Outlook 2006
Region/Country
History Projections Average AnnualPercent Change,
2003-20302003 2010 2015 2020 2025 2030
OECDOECD North America . . . . . . . . . . . 2,101 2,297 2,411 2,659 2,990 3,446 1.8
United Statesa. . . . . . . . . . . . . . . . . 1,953 2,195 2,239 2,435 2,757 3,205 1.9Canada . . . . . . . . . . . . . . . . . . . . . . 115 69 130 158 167 175 1.6Mexico. . . . . . . . . . . . . . . . . . . . . . . 33 33 42 66 66 66 2.5
OECD Europe . . . . . . . . . . . . . . . . . 969 982 976 968 954 1,002 0.1OECD Asia . . . . . . . . . . . . . . . . . . . . 533 685 719 739 780 830 1.7
Japan . . . . . . . . . . . . . . . . . . . . . . . 233 251 251 240 227 219 -0.2South Korea . . . . . . . . . . . . . . . . . . 123 230 253 269 303 341 3.8Australia/New Zealand . . . . . . . . . . 177 204 215 230 250 269 1.6
Total OECD . . . . . . . . . . . . . . . . . 3,603 3,964 4,106 4,366 4,724 5,278 1.4
Non-OECDNon-OECD Europe and Eurasia. . . 307 282 294 293 290 287 -0.2
Russia . . . . . . . . . . . . . . . . . . . . . . . 162 166 178 177 177 176 0.3Other . . . . . . . . . . . . . . . . . . . . . . . . 145 116 117 116 114 111 -1.0
Non-OECD Asia. . . . . . . . . . . . . . . . 2,027 2,919 3,795 4,676 5,603 6,636 4.5China. . . . . . . . . . . . . . . . . . . . . . . . 1,414 2,109 2,788 3,489 4,287 5,243 5.0India . . . . . . . . . . . . . . . . . . . . . . . . 389 572 748 902 1,005 1,069 3.8Other Non-OECD Asia . . . . . . . . . . 224 238 259 284 311 324 1.4
Middle East . . . . . . . . . . . . . . . . . . . 28 25 24 23 23 26 -0.3Africa . . . . . . . . . . . . . . . . . . . . . . . . 178 252 289 295 292 288 1.8Central and South America . . . . . . 18 39 49 67 72 78 5.5
Brazil . . . . . . . . . . . . . . . . . . . . . . . . 5 16 25 33 38 37 7.7Other Central and South America. . 13 23 23 34 34 41 4.3
Total Non-OECD . . . . . . . . . . . . . 2,558 3,518 4,452 5,355 6,279 7,314 4.0
Total World . . . . . . . . . . . . . . . . . . . . 6,160 7,482 8,557 9,721 11,003 12,592 2.7aIncludes the 50 States and the District of Columbia.Note: Totals may not equal sum of components due to independent rounding.Sources: History: Derived from Energy Information Administration (EIA), International Energy Annual 2003 (May-July 2005), web
site www.eia.doe.gov/iea/. Projections: EIA, Annual Energy Outlook 2006, DOE/EIA-0383(2006) (Washington, DC, February2006), AEO2006 National Energy Modeling System, run AEO2006.D111905A, web site www.eia.doe.gov/oiaf/aeo/; and System forthe Analysis of Global Energy Markets (2006).

Table F11. World Net Nuclear Electricity Generation From Central Producers by Region and Country,2003-2030(Billion Kilowatthours)
Reference Case Electricity Capacity and Generation Projections
Energy Information Administration / International Energy Outlook 2006 173
Region/Country
History Projections Average AnnualPercent Change,
2003-20302003 2010 2015 2020 2025 2030
OECDOECD North America . . . . . . . . . . . 844 923 953 994 989 989 0.6
United Statesa. . . . . . . . . . . . . . . . . 764 809 829 871 871 871 0.5Canada . . . . . . . . . . . . . . . . . . . . . . 71 104 113 113 108 108 1.6Mexico. . . . . . . . . . . . . . . . . . . . . . . 10 11 11 11 11 11 0.2
OECD Europe . . . . . . . . . . . . . . . . . 930 896 877 807 748 707 -1.0OECD Asia . . . . . . . . . . . . . . . . . . . . 360 416 464 518 567 610 2.0
Japan . . . . . . . . . . . . . . . . . . . . . . . 237 274 289 318 350 371 1.7South Korea . . . . . . . . . . . . . . . . . . 123 142 175 200 217 239 2.5Australia/New Zealand . . . . . . . . . . 0 0 0 0 0 0 —
Total OECD . . . . . . . . . . . . . . . . . 2,135 2,234 2,293 2,320 2,304 2,306 0.3
Non-OECDNon-OECD Europe and Eurasia. . . 258 278 323 393 441 443 2.0
Russia . . . . . . . . . . . . . . . . . . . . . . . 138 151 190 233 286 321 3.2Other . . . . . . . . . . . . . . . . . . . . . . . . 120 127 133 160 155 122 0.1
Non-OECD Asia. . . . . . . . . . . . . . . . 97 186 268 356 433 504 6.3China. . . . . . . . . . . . . . . . . . . . . . . . 42 79 130 171 230 303 7.6India . . . . . . . . . . . . . . . . . . . . . . . . 16 56 76 99 106 112 7.4Other Non-OECD Asia . . . . . . . . . . 39 52 62 85 98 89 3.1
Middle East . . . . . . . . . . . . . . . . . . . 0 5 6 6 6 6 —Africa . . . . . . . . . . . . . . . . . . . . . . . . 13 14 15 15 15 15 0.7Central and South America . . . . . . 20 21 35 32 33 24 0.6
Brazil . . . . . . . . . . . . . . . . . . . . . . . . 13 13 22 23 23 19 1.2Other Central and South America. . 7 7 12 10 10 5 -1.1
Total Non-OECD . . . . . . . . . . . . . 388 504 646 802 928 992 3.5
Total World . . . . . . . . . . . . . . . . . . . . 2,523 2,739 2,940 3,122 3,232 3,299 1.0aIncludes the 50 States and the District of Columbia.Note: Totals may not equal sum of components due to independent rounding.Sources: History: Derived from Energy Information Administration (EIA), International Energy Annual 2003 (May-July 2005), web
site www.eia.doe.gov/iea/. Projections: EIA, Annual Energy Outlook 2006, DOE/EIA-0383(2006) (Washington, DC, February2006), AEO2006 National Energy Modeling System, run AEO2006.D111905A, web site www.eia.doe.gov/oiaf/aeo/; and System forthe Analysis of Global Energy Markets (2006).

Table F12. World Net Renewable Electricity Generation From Central Producers by Region and Country,2003-2030(Billion Kilowatthours)
Appendix F
174 Energy Information Administration / International Energy Outlook 2006
Region/Country
History Projections Average AnnualPercent Change,
2003-20302003 2010 2015 2020 2025 2030
OECDOECD North America . . . . . . . . . . . 649 823 845 888 942 991 1.6
United Statesa. . . . . . . . . . . . . . . . . 321 427 439 460 481 495 1.6Canada . . . . . . . . . . . . . . . . . . . . . . 303 356 363 379 408 434 1.3Mexico. . . . . . . . . . . . . . . . . . . . . . . 25 40 42 48 54 62 3.5
OECD Europe . . . . . . . . . . . . . . . . . 543 728 728 791 816 833 1.6OECD Asia . . . . . . . . . . . . . . . . . . . . 158 201 218 226 237 249 1.7
Japan . . . . . . . . . . . . . . . . . . . . . . . 110 127 135 137 138 142 1.0South Korea . . . . . . . . . . . . . . . . . . 5 21 25 29 33 37 7.6Australia/New Zealand . . . . . . . . . . 43 53 58 60 67 71 1.8
Total OECD . . . . . . . . . . . . . . . . . 1,350 1,751 1,790 1,904 1,995 2,073 1.6
Non-OECDNon-OECD Europe and Eurasia. . . 286 377 415 415 445 453 1.7
Russia . . . . . . . . . . . . . . . . . . . . . . . 170 234 271 271 301 309 2.2Other . . . . . . . . . . . . . . . . . . . . . . . . 116 144 144 144 144 144 0.8
Non-OECD Asia. . . . . . . . . . . . . . . . 485 928 1,019 1,106 1,212 1,338 3.8China. . . . . . . . . . . . . . . . . . . . . . . . 285 601 667 688 710 740 3.6India . . . . . . . . . . . . . . . . . . . . . . . . 74 132 144 165 200 244 4.5Other Non-OECD Asia . . . . . . . . . . 126 195 208 253 302 355 3.9
Middle East . . . . . . . . . . . . . . . . . . . 23 55 63 71 77 83 4.9Africa . . . . . . . . . . . . . . . . . . . . . . . . 85 115 124 123 136 153 2.2Central and South America . . . . . . 552 732 867 1,023 1,183 1,347 3.4
Brazil . . . . . . . . . . . . . . . . . . . . . . . . 292 382 457 534 614 697 3.3Other Central and South America. . 260 350 410 489 569 650 3.5
Total Non-OECD . . . . . . . . . . . . . 1,430 2,208 2,488 2,738 3,053 3,374 3.2
Total World . . . . . . . . . . . . . . . . . . . . 2,781 3,959 4,277 4,642 5,048 5,447 2.5aIncludes the 50 States and the District of Columbia.Note: Totals may not equal sum of components due to independent rounding.Sources: History: Derived from Energy Information Administration (EIA), International Energy Annual 2003 (May-July 2005), web
site www.eia.doe.gov/iea/. Projections: EIA, Annual Energy Outlook 2006, DOE/EIA-0383(2006) (Washington, DC, February2006), AEO2006 National Energy Modeling System, run AEO2006.D111905A, web site www.eia.doe.gov/oiaf/aeo/; and System forthe Analysis of Global Energy Markets (2006).

Appendix G
Key Assumptions for the IEO2006 Kyoto Protocol Case
Energy-Related Emissions of Greenhouse Gases
The System for the Analysis of Global energy Markets(SAGE)—the model used by EIA to prepare the IEO2006mid-term projections—does not include non-energy-related emissions of greenhouse gases, which are esti-mated at about 15 to 20 percent of total greenhouse gasemissions, based on inventories submitted to the UnitedNations Framework Convention on Climate Change(UNFCCC). SAGE models global energy supply anddemand and, therefore, does not address agriculturaland other non-energy-related emissions.
EIA implicitly assumes that percentage reductions ofnon-energy-related emissions and their associatedabatement costs will be similar to those for energy-related emissions. Non-energy-related greenhouse gasemissions are likely to grow faster than energy-relatedemissions; however, the marginal abatement costs fornon-energy-related greenhouse gas emissions are notknown and cannot be estimated reliably. In SAGE, eachregion’s emissions reduction goal under the Kyoto Pro-tocol is based only on the corresponding estimate of thatregion’s energy-related carbon dioxide emissions, asdetermined by EIA data. It is assumed that the requiredreductions will also be proportionately less than if allgases were included.
Carbon Dioxide Emissions
For IEO2006, EIA modeled only energy-related carbondioxide emissions. Energy-related emissions of othergreenhouse gases, such as methane, nitrous oxide, andsulfur hexafluoride, are not included in the analysis. Thecurrent SAGE framework uses historical data on fuelconsumption and emissions from EIA’s InternationalEnergy Annual 2003 to calibrate the base year for themodel’s Reference Energy System (RES).19 The Interna-tional Energy Annual does not provide historical data formethane and nitrous oxide emissions, and currentlythere are no plans to do so in the future.
EIA assumes that emissions reduction proportions andabatement costs for energy-related methane and nitrousoxide will be sufficiently similar to those for carbondioxide that—given their lesser share of total emissions(approximately 15 percent from energy and non-energysources combined)—the per-unit carbon price derivedby modeling carbon dioxide alone is representative ofthe abatement costs for all energy-related greenhousegas emissions. The UNFCCC estimates that total AnnexI emissions of greenhouse gases (in carbon dioxideequivalents) in 2003 had the following composition: car-bon dioxide, 81.1 percent; methane, 9.1 percent; nitrousoxide, 6.5 percent; and other gases, 1.6 percent.20
Energy Information Administration / International Energy Outlook 2006 175
19EIA data differ slightly from the data submitted to the UNFCCC for energy-related carbon dioxide emissions. It is assumed that thedifferences will not have a significant effect on estimates of abatement costs.
20United Nations Framework Convention on Climate Change (UNFCCC), Greenhouse Gas Inventory Database, Queried for 2003“National Totals” and “Total Fuel Combustion (Sectoral Approach)” for all greenhouse gases for all Annex I countries except Russia,Poland, and Liechtenstein, web site http://ghg.unfccc.int/index.html.


Appendix H
Comparisons With Other Forecasts, and Performance ofPast IEO Forecasts for 1990, 1995, and 2000
Forecast ComparisonsEnergy Consumption by Region
Three organizations provide forecasts comparable withthe projections in IEO2006, which extend to 2030 for thefirst time. The International Energy Agency (IEA) pro-vides “business as usual” projections to 2030 in its WorldEnergy Outlook 2004; Petroleum Economics, Ltd. (PEL)publishes world energy projections to 2025; and Petro-leum Industry Research Associates (PIRA) providesprojections to 2020. For comparison, 2002 is used as thebase year for all the projections. Comparisons betweenIEO2006 and IEO2005 extend only to 2025, the last yearof the IEO2005 projections.
Regional breakouts vary among the different projec-tions, complicating the comparisons. For example,IEO2006, PIRA, and IEA include Mexico in OECD NorthAmerica, but PEL includes Mexico in Latin America.Because PEL does not provide separate projections forMexico, its numbers for North America are somewhat
inconsistent with the other projections. PIRA includesonly Japan in OECD Asia, whereas OECD Asia in theIEO2006 and IEA projections comprises Japan, SouthKorea, Australia, and New Zealand. IEO2006 and IEAprovide forecasts for OECD Europe, which includesTurkey, the Czech Republic, Hungary, Poland, andSlovakia. PEL places Turkey in Western Europe butincludes all Eastern and Western European countries in“Europe,” including those that are not OECD members.IEO2005 reported Eastern Europe and Western Europeseparately and, in addition, placed Turkey in the MiddleEast. PIRA reports the Eastern European countries in itsformer Soviet Union region. The differences in theregional aggregations contribute to the variationsamong the forecasts.
All the forecasts provide projections out to 2010 (TableH1). The 2002-2010 projections vary widely, reflecting inpart the volatility of world energy markets over the pastseveral years. Growth rates for energy consumptionamong the reference case forecasts range from 2.2
Energy Information Administration / International Energy Outlook 2006 177
Table H1. Comparison of Energy Consumption Growth Rates by Region, 2002-2010(Average Annual Percent Growth)
Region
IEO2006IEO2005 IEA PIRA PELLow Growth Reference High Growth
OECD . . . . . . . . . . . . . . . . . . . . . 1.0 1.2 1.5 1.3 1.4 1.2 1.2North America . . . . . . . . . . . . . . 1.1 1.4 1.7 1.7 1.5 1.3 1.4Europe . . . . . . . . . . . . . . . . . . . . 0.8 1.0 1.2 0.5 1.1 1.3 1.3Asia . . . . . . . . . . . . . . . . . . . . . . 1.0 1.2 1.4 1.3 1.6 0.4 0.5
Non-OECD . . . . . . . . . . . . . . . . . 4.0 4.5 5.0 3.9 2.8 3.9 3.8Europe and Eurasia . . . . . . . . . . 1.9 2.4 2.8 2.0 1.8 2.5 1.6China . . . . . . . . . . . . . . . . . . . . . 7.3 7.8 8.4 6.8 3.4 7.0 6.2Other Non-OECD Asia. . . . . . . . 3.5 3.9 4.5 3.9 3.2 3.0 3.7Middle East . . . . . . . . . . . . . . . . 3.0 3.4 3.9 3.4 3.2 4.8 4.5Africa . . . . . . . . . . . . . . . . . . . . . 3.7 4.2 4.6 3.4 2.7 3.3 3.0Central and South America . . . . 3.0 3.6 4.0 3.0 2.7 2.5 2.4
Total World . . . . . . . . . . . . . . . . . 2.4 2.7 3.1 2.6 2.2 2.7 2.4
Notes: For IEO2005, the Czech Republic, Hungary, Poland, and Slovakia are included in non-OECD Europe and Eurasia; forIEO2006 they are included in OECD Europe. For PIRA, all Eastern European and former Soviet Union countries are included innon-OECD Europe and Eurasia, OECD Asia includes only Japan, and Australia/New Zealand and South Korea are included in othernon-OECD Asia. For PEL, OECD Europe includes both Western Europe and Eastern Europe, and non-OECD Europe and Eurasiaincludes only the former Soviet Union.
Sources: IEO2006: Energy Information Administration (EIA), System for the Analysis of Global Energy Markets (2006). IEO2005:EIA, International Energy Outlook 2005, DOE/EIA-0484(2005) (Washington, DC, July 2005), Table A1, p. 89. IEA: InternationalEnergy Agency, World Energy Outlook 2004 (Paris, France, October 2004), pp. 430-517. PIRA: PIRA Energy Group, Retainer ClientSeminar (New York, NY, October 2005), Table II-4. PEL: Petroleum Economics, Ltd., World Long Term Oil and Energy Outlook(London, United Kingdom, May 2005), Tables 3i and 3ii.
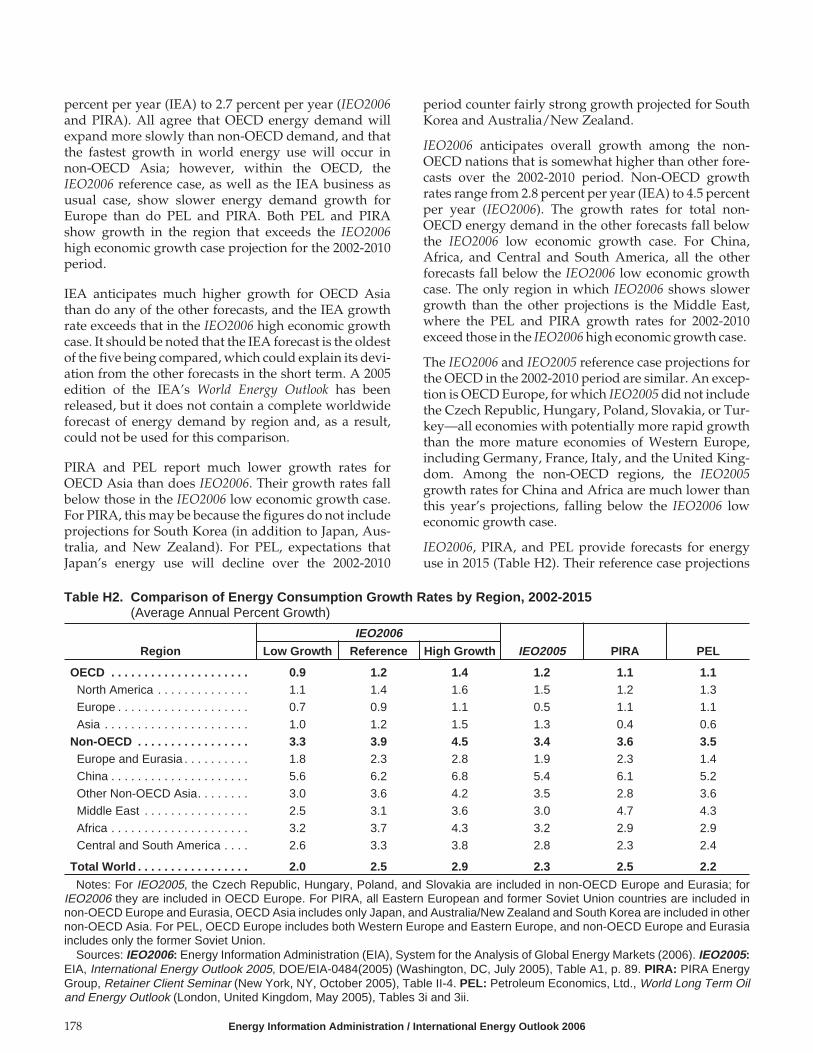
percent per year (IEA) to 2.7 percent per year (IEO2006and PIRA). All agree that OECD energy demand willexpand more slowly than non-OECD demand, and thatthe fastest growth in world energy use will occur innon-OECD Asia; however, within the OECD, theIEO2006 reference case, as well as the IEA business asusual case, show slower energy demand growth forEurope than do PEL and PIRA. Both PEL and PIRAshow growth in the region that exceeds the IEO2006high economic growth case projection for the 2002-2010period.
IEA anticipates much higher growth for OECD Asiathan do any of the other forecasts, and the IEA growthrate exceeds that in the IEO2006 high economic growthcase. It should be noted that the IEA forecast is the oldestof the five being compared, which could explain its devi-ation from the other forecasts in the short term. A 2005edition of the IEA’s World Energy Outlook has beenreleased, but it does not contain a complete worldwideforecast of energy demand by region and, as a result,could not be used for this comparison.
PIRA and PEL report much lower growth rates forOECD Asia than does IEO2006. Their growth rates fallbelow those in the IEO2006 low economic growth case.For PIRA, this may be because the figures do not includeprojections for South Korea (in addition to Japan, Aus-tralia, and New Zealand). For PEL, expectations thatJapan’s energy use will decline over the 2002-2010
period counter fairly strong growth projected for SouthKorea and Australia/New Zealand.
IEO2006 anticipates overall growth among the non-OECD nations that is somewhat higher than other fore-casts over the 2002-2010 period. Non-OECD growthrates range from 2.8 percent per year (IEA) to 4.5 percentper year (IEO2006). The growth rates for total non-OECD energy demand in the other forecasts fall belowthe IEO2006 low economic growth case. For China,Africa, and Central and South America, all the otherforecasts fall below the IEO2006 low economic growthcase. The only region in which IEO2006 shows slowergrowth than the other projections is the Middle East,where the PEL and PIRA growth rates for 2002-2010exceed those in the IEO2006 high economic growth case.
The IEO2006 and IEO2005 reference case projections forthe OECD in the 2002-2010 period are similar. An excep-tion is OECD Europe, for which IEO2005 did not includethe Czech Republic, Hungary, Poland, Slovakia, or Tur-key—all economies with potentially more rapid growththan the more mature economies of Western Europe,including Germany, France, Italy, and the United King-dom. Among the non-OECD regions, the IEO2005growth rates for China and Africa are much lower thanthis year’s projections, falling below the IEO2006 loweconomic growth case.
IEO2006, PIRA, and PEL provide forecasts for energyuse in 2015 (Table H2). Their reference case projections
178 Energy Information Administration / International Energy Outlook 2006
Table H2. Comparison of Energy Consumption Growth Rates by Region, 2002-2015(Average Annual Percent Growth)
Region
IEO2006IEO2005 PIRA PELLow Growth Reference High Growth
OECD . . . . . . . . . . . . . . . . . . . . . 0.9 1.2 1.4 1.2 1.1 1.1North America . . . . . . . . . . . . . . 1.1 1.4 1.6 1.5 1.2 1.3Europe . . . . . . . . . . . . . . . . . . . . 0.7 0.9 1.1 0.5 1.1 1.1Asia . . . . . . . . . . . . . . . . . . . . . . 1.0 1.2 1.5 1.3 0.4 0.6
Non-OECD . . . . . . . . . . . . . . . . . 3.3 3.9 4.5 3.4 3.6 3.5Europe and Eurasia . . . . . . . . . . 1.8 2.3 2.8 1.9 2.3 1.4China . . . . . . . . . . . . . . . . . . . . . 5.6 6.2 6.8 5.4 6.1 5.2Other Non-OECD Asia. . . . . . . . 3.0 3.6 4.2 3.5 2.8 3.6Middle East . . . . . . . . . . . . . . . . 2.5 3.1 3.6 3.0 4.7 4.3Africa . . . . . . . . . . . . . . . . . . . . . 3.2 3.7 4.3 3.2 2.9 2.9Central and South America . . . . 2.6 3.3 3.8 2.8 2.3 2.4
Total World . . . . . . . . . . . . . . . . . 2.0 2.5 2.9 2.3 2.5 2.2
Notes: For IEO2005, the Czech Republic, Hungary, Poland, and Slovakia are included in non-OECD Europe and Eurasia; forIEO2006 they are included in OECD Europe. For PIRA, all Eastern European and former Soviet Union countries are included innon-OECD Europe and Eurasia, OECD Asia includes only Japan, and Australia/New Zealand and South Korea are included in othernon-OECD Asia. For PEL, OECD Europe includes both Western Europe and Eastern Europe, and non-OECD Europe and Eurasiaincludes only the former Soviet Union.
Sources: IEO2006: Energy Information Administration (EIA), System for the Analysis of Global Energy Markets (2006). IEO2005:EIA, International Energy Outlook 2005, DOE/EIA-0484(2005) (Washington, DC, July 2005), Table A1, p. 89. PIRA: PIRA EnergyGroup, Retainer Client Seminar (New York, NY, October 2005), Table II-4. PEL: Petroleum Economics, Ltd., World Long Term Oiland Energy Outlook (London, United Kingdom, May 2005), Tables 3i and 3ii.

for worldwide growth in energy consumption from 2002to 2015 vary from 2.2 percent per year (PEL) to 2.5 per-cent per year (IEO2006 and PIRA). As was true for the2002-2010 period, PEL and PIRA show much fastergrowth in energy use for the Middle East from 2002 to2015 than does IEO2006, exceeding the IEO2006 higheconomic growth case. Moreover, both the PEL andPIRA forecasts for demand growth in Africa and in Cen-tral and South America fall well below those in theIEO2006 reference case. PEL also projects much slowergrowth than does IEO2006 for China and for non-OECDEurope and Eurasia in the 2002-2015 period, below theIEO2006 low economic growth case projections. PIRA’sprojections for the two regions closely resemble those inthe IEO2006 reference case All the forecasts have similarexpectations for overall growth among the OECDnations, but as was true for the 2002-2010 comparisons,the PEL and PIRA growth rates for OECD Asia are muchlower than in the IEO2006 reference case.
The IEO2006 reference case projection for worldwidegrowth in energy use from 2002 to 2015, at 2.5 percentper year, is higher than projected in IEO2005. By region,the largest differences between the two forecasts are forOECD Europe and for China, both of which are belowthose in the IEO2006 low economic growth case. In thecase of China, the unanticipated strong expansion inincome and resulting energy demand in 2003 and 2004—
especially for oil but also for other fuels—was not fullyanticipated in last year’s forecast. For both OECDEurope and non-OECD Europe and Eurasia, economicgrowth is slightly higher in IEO2006.
All the forecasts provide energy consumption projec-tions for 2020 (Table H3), PIRA’s final forecast year. Thefour forecasts have similar projections for energydemand growth from 2002 to 2020, with average annualincreases in the world’s total energy consumption thatrange from 1.9 percent (IEA) to 2.3 percent (IEO2006)and with non-OECD growth higher than the OECDgrowth rate. The largest variation among the regionalprojections is for China, ranging from 2.9 percent peryear (IEA) to 4.6 percent per year (IEO2006). For2002-2020, as for 2002-2015, the PEL and PIRA projec-tions for OECD Asia falling below the IEO2006 low eco-nomic growth case.
The largest differences between the IEO2006 and IEO-2005 reference case growth rates for energy demandfrom 2002 to 2020 are for China and OECD Europe.IEO2005 projected annual energy demand growth forChina that is 0.7 percentage points lower than inIEO2006; and the IEO2005 reference case projectionfor OECD Europe is lower than in the IEO2006 loweconomic growth case, largely due to lower expecta-tions for economic growth and differences in regionaldefinitions.
Energy Information Administration / International Energy Outlook 2006 179
Table H3. Comparison of Energy Consumption Growth Rates by Region, 2002-2020(Average Annual Percent Growth)
Region
IEO2006IEO2005 IEA PIRA PELLow Growth Reference High Growth
OECD . . . . . . . . . . . . . . . . . . . . . 0.8 1.1 1.4 1.1 1.1 1.1 1.0North America . . . . . . . . . . . . . . 1.0 1.3 1.6 1.5 1.2 1.2 1.2Europe . . . . . . . . . . . . . . . . . . . . 0.6 0.7 0.9 0.5 0.9 1.2 0.9Asia . . . . . . . . . . . . . . . . . . . . . . 0.8 1.1 1.4 1.1 1.3 0.4 0.6
Non-OECD . . . . . . . . . . . . . . . . . 2.9 3.5 4.1 3.1 2.6 3.3 3.3Europe and Eurasia . . . . . . . . . . 1.6 2.1 2.8 1.7 1.5 2.1 1.3China . . . . . . . . . . . . . . . . . . . . . 4.6 5.3 6.0 4.6 2.9 5.5 4.6Other Non-OECD Asia. . . . . . . . 2.7 3.4 4.0 3.3 2.9 2.6 3.5Middle East . . . . . . . . . . . . . . . . 2.2 2.8 3.4 2.7 3.0 4.4 4.1Africa . . . . . . . . . . . . . . . . . . . . . 2.6 3.2 3.8 2.9 2.6 2.6 2.8Central and South America . . . . 2.3 3.0 3.7 2.5 2.7 2.1 2.4
Total World . . . . . . . . . . . . . . . . . 1.8 2.3 2.7 2.1 1.9 2.4 2.1
Notes: For IEO2005, the Czech Republic, Hungary, Poland, and Slovakia are included in non-OECD Europe and Eurasia; forIEO2006 they are included in OECD Europe. For PIRA, all Eastern European and former Soviet Union countries are included innon-OECD Europe and Eurasia, OECD Asia includes only Japan, and Australia/New Zealand and South Korea are included in othernon-OECD Asia. For PEL, OECD Europe includes both Western Europe and Eastern Europe, and non-OECD Europe and Eurasiaincludes only the former Soviet Union.
Sources: IEO2006: Energy Information Administration (EIA), System for the Analysis of Global Energy Markets (2006). IEO2005:EIA, International Energy Outlook 2005, DOE/EIA-0484(2005) (Washington, DC, July 2005), Table A1, p. 89. IEA: InternationalEnergy Agency, World Energy Outlook 2004 (Paris, France, October 2004), pp. 430-517. PIRA: PIRA Energy Group, Retainer ClientSeminar (New York, NY, October 2005), Table II-4. PEL: Petroleum Economics, Ltd., World Long Term Oil and Energy Outlook(London, United Kingdom, May 2005), Tables 3i and 3ii.

Only the IEO2006 and PEL projections cover 2025 (IEAextends to 2030 but does not include projections for2025). The two forecasts are largely in agreement on aworldwide basis (Table H4), with PEL projecting2.0-percent average annual growth in world energydemand and IEO2006 2.1 percent. There are someregional differences between the two, particularly forOECD Asia, non-OECD Europe and Eurasia, and theMiddle East. For the Middle East, the PEL projectionsexceed the IEO2006 high economic growth case, as they
do for the other time periods compared here. Althoughthe IEO2006 and PEL projections for economic growth inthe Middle East region are similar (4.3 percent and 4.0percent per year, respectively), IEO2006 projects stron-ger gains in energy intensity over the 2002-2025 period,whereas PEL expects GDP and energy demand to con-tinue increasing at about the same pace.
IEO2006 and IEA are the only projections that runthrough 2030 (Table H5). Generally they agree, with
180 Energy Information Administration / International Energy Outlook 2006
Table H4. Comparison of Energy Consumption Growth Rates by Region, 2002-2025(Average Annual Percent Growth)
Region
IEO2006IEO2005 PELLow Growth Reference High Growth
OECD . . . . . . . . . . . . . . . . . . . . . 0.8 1.0 1.3 1.1 0.9North America . . . . . . . . . . . . . . 0.9 1.3 1.6 1.4 1.1Europe . . . . . . . . . . . . . . . . . . . . 0.5 0.7 0.9 0.5 0.8Asia . . . . . . . . . . . . . . . . . . . . . . 0.7 1.0 1.3 1.1 0.6
Non-OECD . . . . . . . . . . . . . . . . . 2.6 3.2 3.9 2.8 3.1Europe and Eurasia . . . . . . . . . . 1.4 2.0 2.6 1.6 1.2China . . . . . . . . . . . . . . . . . . . . . 4.0 4.7 5.4 4.1 4.1Other Non-OECD Asia. . . . . . . . 2.6 3.2 4.0 3.1 3.4Middle East . . . . . . . . . . . . . . . . 2.0 2.6 3.2 2.5 4.0Africa . . . . . . . . . . . . . . . . . . . . . 2.3 2.8 3.5 2.7 2.8Central and South America . . . . 2.2 2.9 3.5 2.3 2.4
Total World . . . . . . . . . . . . . . . . . 1.6 2.1 2.6 2.0 2.0
Notes: For IEO2005, the Czech Republic, Hungary, Poland, and Slovakia are included in non-OECD Europe and Eurasia; forIEO2006 they are included in OECD Europe. For PEL, OECD Europe includes both Western Europe and Eastern Europe, andnon-OECD Europe and Eurasia includes only the former Soviet Union.
Sources: IEO2006: Energy Information Administration (EIA), System for the Analysis of Global Energy Markets (2006). IEO2005:EIA, International Energy Outlook 2005, DOE/EIA-0484(2005) (Washington, DC, July 2005), Table A1, p. 89. PEL: Petroleum Eco-nomics, Ltd., World Long Term Oil and Energy Outlook (London, United Kingdom, May 2005), Tables 3i and 3ii.
Table H5. Comparison of Energy Consumption Growth Rates by Region, 2002-2030(Average Annual Percent Growth)
Region
IEO2006IEALow Growth Reference High Growth
OECD . . . . . . . . . . . . . . . . . . . . . 0.7 1.0 1.3 0.9North America . . . . . . . . . . . . . . 0.9 1.2 1.6 1.1Europe . . . . . . . . . . . . . . . . . . . . 0.5 0.7 0.9 0.7Asia . . . . . . . . . . . . . . . . . . . . . . 0.7 1.0 1.3 1.0
Non-OECD . . . . . . . . . . . . . . . . . 2.4 3.0 3.8 2.4Europe and Eurasia . . . . . . . . . . 1.3 1.9 2.5 1.3China . . . . . . . . . . . . . . . . . . . . . 3.6 4.4 5.1 2.6Other Non-OECD Asia. . . . . . . . 2.4 3.1 3.9 2.7Middle East . . . . . . . . . . . . . . . . 1.9 2.5 3.1 2.5Africa . . . . . . . . . . . . . . . . . . . . . 2.1 2.7 3.4 2.6Central and South America . . . . 2.0 2.8 3.4 2.6
Total World . . . . . . . . . . . . . . . . . 1.5 2.0 2.6 1.8
Sources: IEO2006: Energy Information Administration (EIA), System for the Analysis of Global Energy Markets (2006). IEO2005:EIA, International Energy Outlook 2005, DOE/EIA-0484(2005) (Washington, DC, July 2005), Table A1, p. 89. IEA: InternationalEnergy Agency, World Energy Outlook 2004 (Paris, France, October 2004), pp. 430-517.

worldwide energy demand growing by 2.0 percent peryear from 2002 to 2030 in the IEO2006 reference case andby 1.8 percent per year in the IEA business as usual case.The largest difference between the two is for China: theIEA projection for China is nearly 2 percentage pointslower than the IEO2006 reference case and is a full per-centage point lower than the IEO2006 low economicgrowth case.
Energy Consumption by Fuel
The forecasts vary not only with respect to levels of totalenergy demand but also with respect to the mix of pri-mary energy inputs. All the forecasts provide energyconsumption projections by fuel in 2010 (Table H6), witha wide range of views regarding the mix of fuels that willbe used to meet projected demand. Whereas IEO2006and PIRA expect coal to be the fastest growing fuelsource in the 2002-2010 period—at 3.6 percent per yearand 3.4 percent per year, respectively—IEA and PELexpect much lower growth for coal.
IEA and PEL project relatively strong growth in nuclearpower demand over the time period, whereas the
IEO2006 and PIRA projections are relatively modest.IEO2006, IEA, and PIRA project average growth inworldwide renewable energy use at more than 3.0 per-cent per year from 2002 to 2010; in contrast, PEL projectsan average of 1.9 percent per year. All the projections forgrowth in world oil demand are between 2.0 percent peryear (IEO2006 and IEA) and 2.2 percent per year (PEL),and all expect relatively strong growth in natural gasuse.
In comparison with IEO2005, the IEO2006 projectionsare lower for oil and nuclear power and higher for everyother energy source. The IEO2006 projection for worldoil prices in the 2002-2010 period are higher, leading toslower growth in oil demand and fuel substitutionwhere possible. For nuclear power, IEO2006 projectsslightly slower growth in generating capacity through2010 and lower capacity utilization rates for some thanwere projected in IEO2005.
PEL, PIRA, and IEO2006 provide world energy con-sumption projections by fuel for 2015 (Table H7). Again,the forecasts agree on the outlook for oil demand, with
Energy Information Administration / International Energy Outlook 2006 181
Table H6. Comparison of World Energy Consumption Growth Rates by Fuel, 2002-2010(Average Annual Percent Growth)
Fuel
IEO2006IEO2005 IEA PIRA PELLow Growth Reference High Growth
Oil . . . . . . . . . . . . . . . . . 1.6 2.0 2.3 2.4 2.0 2.1 2.2Natural Gas . . . . . . . . . . 2.6 3.0 3.5 2.4 2.7 2.9 3.1Coal . . . . . . . . . . . . . . . . 3.3 3.6 4.0 3.1 1.8 3.4 1.9Nuclear . . . . . . . . . . . . . 1.0 1.0 1.0 1.5 1.5 0.7 2.6Renewable/Other. . . . . . 4.1 4.3 4.4 2.7 3.2 3.6 1.9
Total . . . . . . . . . . . . . . 2.4 2.7 3.1 2.6 2.2 2.7 2.4
Note: For IEA, Renewable/Other excludes traditional biomass.Sources: IEO2006: Energy Information Administration (EIA), System for the Analysis of Global Energy Markets (2006). IEO2005:
EIA, International Energy Outlook 2005, DOE/EIA-0484(2005) (Washington, DC, July 2005), Table A2, p. 91. IEA: InternationalEnergy Agency, World Energy Outlook 2004 (Paris, France, October 2004), pp. 430-517. PIRA: PIRA Energy Group, Retainer ClientSeminar (New York, NY, October 2005). PEL: Petroleum Economics, Ltd., World Long Term Oil and Energy Outlook (London,United Kingdom, May 2005).
Table H7. Comparison of World Energy Consumption Growth Rates by Fuel, 2002-2015(Average Annual Percent Growth)
Fuel
IEO2006IEO2005 PIRA PELLow Growth Reference High Growth
Oil . . . . . . . . . . . . . . . . . 1.3 1.8 2.2 2.2 1.9 1.9Natural Gas . . . . . . . . . . 2.4 2.9 3.5 2.6 2.8 3.2Coal . . . . . . . . . . . . . . . . 2.7 3.1 3.6 2.6 3.1 1.7Nuclear . . . . . . . . . . . . . 1.1 1.2 1.2 1.3 0.7 2.3Renewable/Other. . . . . . 2.9 3.3 3.5 2.2 3.3 2.1
Total . . . . . . . . . . . . . . 2.0 2.5 2.9 2.3 2.5 2.2
Sources: IEO2006: Energy Information Administration (EIA), System for the Analysis of Global Energy Markets (2006). IEO2005:EIA, International Energy Outlook 2005, DOE/EIA-0484(2005) (Washington, DC, July 2005), Table A2, p. 91. PIRA: PIRA EnergyGroup, Retainer Client Seminar (New York, NY, October 2005). PEL: Petroleum Economics, Ltd., World Long Term Oil and EnergyOutlook (London, United Kingdom, May 2005).

growth rates ranging from 1.8 percent per year(IEO2006) to 1.9 percent per year (PEL and PIRA) from2002 to 2015. There is a wider range of expectations forthe other energy sources. The largest variation is fornuclear power generation, ranging from 0.7 percent peryear (PIRA) to 2.3 percent per year (PEL), with IEO2006at 1.2 percent per year. PEL’s bullish forecast for nuclearpower offsets its fairly pessimistic forecasts for coal (1.7percent per year) and renewables (2.1 percent per year).Both IEO2006 and PIRA project average demand growthof 3.1 percent per year for coal and 3.3 percent per yearfor renewables.
All the forecasts provide energy consumption projec-tions for 2020 (Table H8). They are largely in agreementon the growth rate for world oil use, at 1.6 percent(IEO2006), 1.7 percent (PEL), and 1.8 percent per year(IEA and PIRA) from 2002 to 2020. Expectations for theother energy sources differ. Again, the largest differ-ences are in the projections for nuclear power. The pro-jections for growth in nuclear power generation varyfrom 0.6 percent per year (IEA) to 2.2 percent per year(PEL), with IEO2006 projecting 1.2 percent per year.Among the growth projections for total world energy
consumption from 2002 to 2020, IEA and PEL are lowerthan IEO2006 and PIRA, and IEA is the lowest.
The IEO2006 reference case projections for growth in oilconsumption from 2002 to 2020 are lower than those inIEO2005 as a result of the higher oil prices in IEO2006.For all other energy sources, the IEO2006 projections arehigher, with other fuels replacing oil where possible. Inparticular, coal demand is expected to grow by 2.8 per-cent per year from 2002 to 2020 in IEO2006, comparedwith 2.3 percent per year in IEO2005. Growth in renew-able energy use is also significantly higher in IEO2006, at2.8 percent per year, as compared with 1.9 percent peryear in IEO2005. For natural gas, higher prices that resultfrom increased demand as natural gas replaces oil use,mostly for industrial purposes, make renewable energysources more competitive, especially for electric powergeneration.
As noted above, the only two forecasts for the 2002-2025period, IEO2006 and PEL, are largely in agreement withrespect to the increase in total energy demand (TableH9). PEL projects average annual growth of 2.0 percentfor total world demand and IEO2006 2.1 percent per
182 Energy Information Administration / International Energy Outlook 2006
Table H8. Comparison of World Energy Consumption Growth Rates by Fuel, 2002-2020(Average Annual Percent Growth)
Fuel
IEO2006IEO2005 IEA PIRA PELLow Growth Reference High Growth
Oil . . . . . . . . . . . . . . . . . 1.1 1.6 2.1 2.0 1.8 1.8 1.7Natural Gas . . . . . . . . . . 2.3 2.7 3.2 2.4 2.6 2.7 3.1Coal . . . . . . . . . . . . . . . . 2.3 2.8 3.4 2.3 1.6 2.7 1.5Nuclear . . . . . . . . . . . . . 1.1 1.2 1.2 1.1 0.6 1.6 2.2Renewable/Other. . . . . . 2.3 2.8 3.2 1.9 2.7 3.2 2.1
Total . . . . . . . . . . . . . . 1.8 2.3 2.7 2.1 1.9 2.4 2.1
Note: For IEA, Renewable/Other excludes traditional biomass.Sources: IEO2006: Energy Information Administration (EIA), System for the Analysis of Global Energy Markets (2006). IEO2005:
EIA, International Energy Outlook 2005, DOE/EIA-0484(2005) (Washington, DC, July 2005), Table A2, p. 91. IEA: InternationalEnergy Agency, World Energy Outlook 2004 (Paris, France, October 2004), pp. 430-517. PIRA: PIRA Energy Group, Retainer ClientSeminar (New York, NY, October 2005). PEL: Petroleum Economics, Ltd., World Long Term Oil and Energy Outlook (London,United Kingdom, May 2005).
Table H9. Comparison of World Energy Consumption Growth Rates by Fuel, 2002-2025(Average Annual Percent Growth)
Fuel
IEO2006IEO2005 PELLow Growth Reference High Growth
Oil . . . . . . . . . . . . . . . . . 1.0 1.5 2.1 1.9 1.4Natural Gas . . . . . . . . . . 2.1 2.6 3.0 2.3 3.1Coal . . . . . . . . . . . . . . . . 2.1 2.7 3.3 2.0 1.4Nuclear . . . . . . . . . . . . . 1.0 1.1 1.1 1.0 2.1Renewable/Other. . . . . . 2.1 2.6 3.0 1.9 2.1
Total . . . . . . . . . . . . . . 1.6 2.1 2.6 2.0 2.0
Sources: IEO2006: Energy Information Administration (EIA), System for the Analysis of Global Energy Markets (2006). IEO2005:EIA, International Energy Outlook 2005, DOE/EIA-0484(2005) (Washington, DC, July 2005), Table A2, p. 91. PEL: Petroleum Eco-nomics, Ltd., World Long Term Oil and Energy Outlook (London, United Kingdom, May 2005).

year. The fuel mix does vary between the two forecasts,however, with PEL projecting stronger growth in natu-ral gas use and nuclear power generation than IEO2006.PEL’s growth rate for natural gas demand exceeds theprojection in the IEO2006 high economic growth caseand is a full percentage point higher than the IEO2006projection for nuclear power. In contrast, IEO2006expects stronger growth in coal and renewable energyuse. The IEO2006 reference case shows generally higherconsumption growth rates for all fuels from 2002 to 2025,except for oil.
IEO2006 and IEA are the only forecasts that extend to2030 (Table H10). In the IEA projections, worldwideenergy use grows at a slower pace than in the IEO2006reference case (1.7 percent and 2.0 percent per year,respectively). IEA projects somewhat higher growth foroil and renewable energy demand than does IEO2006,but much lower growth for coal and nuclear power con-sumption. The IEA growth forecast for coal use is a fullpercentage point lower than the IEO2006 reference caseand falls below the IEO2006 low economic growth case.Similarly, the IEA projection for growth in nuclearpower generation (0.4 percent per year) is less thanone-half the IEO2006 projection (0.9 percent per year).
Performance of Past IEO Forecastsfor 1990, 1995, and 2000In an effort to measure how well the IEO projectionshave estimated future energy consumption trends overthe 20-year history of the series, a comparison of IEOforecasts produced for the years 1990, 1995, and 2000 ispresented here. The forecasts are compared with actualdata published in EIA’s International Energy Annual 2002,as part of EIA’s commitment to provide users of the IEOwith a set of performance measures to assess the fore-casts produced by this agency.
The IEO has been published since 1985. In IEO85,mid-term projections were derived only for the world’smarket economies. That is, no projections were prepared
for the centrally planned economies (CPE) of the SovietUnion, Eastern Europe, Cambodia, China, Cuba, Laos,Mongolia, North Korea, and Vietnam. The IEO85 projec-tions extended to 1995 and included forecasts of energyconsumption for 1990 and 1995 and primary consump-tion of oil, natural gas, coal, and “other fuels.” IEO85projections were also presented for several individualcountries and subregions: the United States, Canada,Japan, the United Kingdom, France, West Germany,Italy, the Netherlands, other OECD Europe, other OECD(Australia, New Zealand, and the U.S. Territories),OPEC, and other developing countries. Beginning withIEO86, nuclear power projections were published sepa-rately from the “other fuel” category.
Regional aggregations have changed from report toreport. In 1990, the report coverage was expanded forthe first time from only the market economies to theentire world. Projections for China, the FSU, and otherCPE countries were provided separately. Starting withIEO94, the regional presentation was changed from mar-ket economies and CPE countries to OECD, Eurasia(China, FSU, and Eastern Europe), and “Rest of World.”Beginning in 1995 and essentially continuing until thecurrent issue, the regional presentation changed to fur-ther group the nations of the world according to eco-nomic development: industrialized nations (essentiallythe OECD before the entry of South Korea and the East-ern European nations, the Czech Republic, Hungary,Poland, and Slovakia), the transitional economies of theEE/FSU, and the developing world (including Chinaand India).
The forecast time horizon has also changed over theyears (Table H11). In the first edition of the report,IEO85, projections were made for 1990 and 1995. IEO86saw the addition of projection year 2000. In IEO91, fore-casts were no longer published for 1990, but forecasts for2010 were added. The projection horizon remained thesame until IEO96, when projection year 2015 was added.In 1998, the forecast was extended again, out to 2020.With IEO2003, the forecast period was extended to 2025;
Energy Information Administration / International Energy Outlook 2006 183
Table H10. Comparison of World Energy Consumption Growth Rates by Fuel, 2002-2030(Average Annual Percent Growth)
Fuel
IEO2006IEALow Growth Reference High Growth
Oil . . . . . . . . . . . . . . . . . 1.0 1.5 2.0 1.6Natural Gas . . . . . . . . . . 2.0 2.5 3.0 2.3Coal . . . . . . . . . . . . . . . . 2.0 2.5 3.2 1.5Nuclear . . . . . . . . . . . . . 0.9 0.9 0.9 0.4Renewable/Other. . . . . . 1.9 2.4 3.0 2.7
Total . . . . . . . . . . . . . . 1.5 2.0 2.6 1.7
Note: For IEA, Renewable/Other excludes traditional biomass.Sources: IEO2006: Energy Information Administration (EIA), System for the Analysis of Global Energy Markets (2006). IEA: Inter-
national Energy Agency, World Energy Outlook 2004 (Paris, France, October 2004), pp. 430-517.

and for the first time, the forecast period extends to 2030in IEO2006.
Comparisons of Forecasts for Market Economies
Projections for market economies were made in the eightissues of the IEO that were published between 1985 and1993 (no IEO was published in 1988). Historical data fortotal regional energy consumption in 1990 show that theIEO projections from those early years were consistentlylower than the actual data for the market economies. Forthe four editions of the IEO printed between 1985 and1989 in which 1990 projections were presented, total pro-jected energy consumption in the market economies ranbetween 4 and 7 percent below the actual amounts pub-lished in the International Energy Annual 2001 (FigureH1).
In addition, market economy projections for 1995 in the1985 through 1993 IEO reports (EIA did not release fore-casts for 1995 after the 1993 report) were consistentlylower than the actual, historical 1995 data (Figure H2).Most of the difference is attributed to those market econ-omy countries outside the OECD. Through the years,EIA’s economic growth assumptions for OPEC andother market economy countries outside the OECD havebeen low. The 1993 forecast was, as one might expect, themost accurate of the forecasts for 1995, and its projectionfor OPEC and the other market economy countries wasabout 2 percent below the actual number.
Similarly to the year 1995 projections, year 2000 projec-tions were also consistently lower than actual 2000 datain each of the IEOs published between 1986 and 1993(Figure H3). The consumption estimates for the marketeconomies increased in each edition, from 265 quadril-lion Btu in IEO86 to 292 quadrillion Btu in IEO93. As lateas 1993, the IEO forecasts were underestimating con-sumption of all energy sources in the market economies,by between 2 percent (oil) and 7 percent (natural gas andnuclear power).
184 Energy Information Administration / International Energy Outlook 2006
Table H11. Years Included in IEO Projectionsby Edition, 1985-2006
Edition 1990 1995 2000 2005 2010 2015 2020 2025 2030
IEO85 . . . . x x
IEO86 . . . . x x x
IEO87 . . . . x x x
IEO89 . . . . x x x
IEO90 . . . . x x x
IEO91 . . . . x x x
IEO92 . . . . x x x
IEO93 . . . . x x x
IEO94 . . . . x x x
IEO95 . . . . x x x
IEO96 . . . . x x x x x
IEO97 . . . . x x x x
IEO98 . . . . x x x x x x
IEO99 . . . . x x x x x x
IEO2000 . . x x x x x
IEO2001 . . x x x x x
IEO2002 . . x x x x x
IEO2003 . . x x x x x
IEO2004 . . x x x x
IEO2005 . . x x x x
IEO2006 . . x x x x x
Sources: Energy Information Administration, International EnergyOutlook, DOE/EIA-0484 (Washington, DC, various years).
243
234
228
225
225
Actual 1990
IEO89
IEO87
IEO86
IEO85
0 50 100 150 200 250 300
Quadrillion Btu
Figure H1. Comparison of IEO Forecasts with 1990Energy Consumption in MarketEconomies
Sources: Energy Information Administration (EIA), Interna-tional Energy Annual 2003 (May-July 2005), web site www.eia.doe.gov/iea/, and International Energy Outlook, DOE/EIA-0484 (Washington, DC, various years).
274
269
268
260
258
256
251
245
247
Actual 1995
IEO93
IEO92
IEO91
IEO90
IEO89
IEO87
IEO86
IEO85
0 50 100 150 200 250 300 350
Quadrillion Btu
Figure H2. Comparison of IEO Forecasts with 1995Energy Consumption in MarketEconomies
Sources: Energy Information Administration (EIA), Interna-tional Energy Annual 2003 (May-July 2005), web site www.eia.doe.gov/iea/, and International Energy Outlook, DOE/EIA-0484 (Washington, DC, various years).

As noted above, in the 1994 edition of the IEO, theregional aggregation “market economies” was droppedaltogether and replaced with delineation of membercountries of the OECD, Eurasia, and Rest of World(ROW). As a result of that reorganization, it is not possi-ble to recreate a forecast for the CPE countries: except forChina, the FSU, and Eastern Europe, the remaining CPEcountries—noted above—were included in “otherROW.”
Comparisons of Forecasts for Year 1995
IEO90 marked the first release of a worldwide energyconsumption forecast. In IEO90 through IEO93, the
forecasts for worldwide energy demand in 1995 werebetween 1 and 4 percent higher than the actual amountsconsumed (Figure H4). Much of the difference can beexplained by the unanticipated collapse of the SovietUnion economies in the early 1990s. The IEO forecasterscould not foresee the extent to which energy consump-tion would fall in the FSU region. In IEO90, total energyconsumption in the FSU was projected to reach 67 qua-drillion Btu in 1995. The projection was reduced steadilyin the next three IEO reports, but even in IEO93 energydemand for 1995 in the FSU region was projected to be53 quadrillion Btu, as compared with its actual 1995energy consumption of 42 quadrillion Btu—a differenceequivalent to about 5 million barrels of oil per day.
Forecasts for 1995 can also be compared in terms of theirdepiction of the fuel mix. Every IEO after 1990 projectedthe share of each energy source relative to total energyconsumption within 2.6 percentage points of the actual1995 distribution. The earliest IEOs tended to be toooptimistic about the growth of coal use in the marketeconomies (Figure H5) and too pessimistic about therecovery of oil consumption after the declines in theearly 1980s that followed the price shocks caused by oilembargoes in 1973 and 1974 and the 1979-1980 revolu-tion in Iran (Figure H6). The IEO85 and IEO86 reportsprojected that oil would account for only about 40 per-cent of total energy consumption for the market econo-mies in 1995, whereas oil actually accounted for 45percent of the total in 1995.
The 1995 forecasts for world coal consumption thatappeared in the IEOs printed between 1990 and 1993were consistently high, between 5 and 17 percent higherthan actual coal use (Figure H7), largely because of
Energy Information Administration / International Energy Outlook 2006 185
307
292
290
280
276
274
270
265
Actual 2000
IEO93
IEO92
IEO91
IEO90
IEO89
IEO87
IEO86
0 50 100 150 200 250 300 350
Quadrillion Btu
Figure H3. Comparison of IEO Forecasts with 2000Energy Consumption in MarketEconomies
Sources: Energy Information Administration (EIA), Interna-tional Energy Annual 2003 (May-July 2005), web site www.eia.doe.gov/iea/, and International Energy Outlook, DOE/EIA-0484 (Washington, DC, various years).
366
375
377
374
383
Actual 1995
IEO93
IEO92
IEO91
IEO90
0 100 200 300 400 500
Quadrillion Btu
Figure H4. Comparison of IEO Forecasts with 1995World Energy Consumption
Sources: Energy Information Administration (EIA), Interna-tional Energy Annual 2003 (May-July 2005), web site www.eia.doe.gov/iea/, and International Energy Outlook, DOE/EIA-0484 (Washington, DC, various years).
2,367
2,326
2,270
2,287
2,363
2,356
2,382
2,411
Actual 1995
IEO93
IEO92
IEO91
IEO90
IEO87
IEO86
IEO85
0 500 1,000 1,500 2,000 2,500 3,000
Million Short Tons
Figure H5. Comparison of IEO Forecasts with 1995Coal Consumption in MarketEconomies
Sources: Energy Information Administration (EIA), Interna-tional Energy Annual 2003 (May-July 2005), web site www.eia.doe.gov/iea/, and International Energy Outlook, DOE/EIA-0484 (Washington, DC, various years).

overestimates for the FSU and Eastern Europe—regionsthat experienced substantial declines in coal consump-tion during the years following the collapse of the SovietUnion. Most of the projections for the FSU by fuel weregreater than the actual consumption numbers, with theexception of hydroelectricity and other renewableresources (Figure H8). Natural gas use in the FSU coun-tries did not decline as much as oil and coal use, becausenatural gas is a plentiful resource in the region and wasused extensively to fuel the domestic infrastructure;however, even the IEO estimates for 1995 natural gas usewere 19 to 27 percent higher than the actual use.
The IEO projections for total energy consumption inChina were below the actual 1995 consumption level inIEO90 (by 12 percent) and IEO91 (by 8 percent) buthigher in IEO92 (by 6 percent) and about the same inIEO93. The underestimates in the earlier IEOs balanced,in part, the overestimates for the EE/FSU countries;however, even the 4- to 14-percent underestimate of pro-jected 1995 coal use in China could not make up for the36- to 129-percent overestimate of FSU coal use.
For other fuels, the IEO forecasts consistently overesti-mated China’s natural gas consumption and underesti-mated its oil consumption. Nuclear power forecastswere fairly close for China, within 5 percent of the actualconsumption (Figure H9). It is noteworthy, however,that consumption of natural gas and nuclear power wasquite small in 1995, so that any variation between actualhistorical consumption and the projections results in a
186 Energy Information Administration / International Energy Outlook 2006
60
60
59
58
56
54
53
51
50
Actual 1995
IEO93
IEO92
IEO91
IEO90
IEO89
IEO87
IEO86
IEO85
0 10 20 30 40 50 60 70
Million Barrels per Day
Figure H6. Comparison of IEO Forecasts with 1995Oil Consumption in Market Economies
Sources: Energy Information Administration (EIA), Interna-tional Energy Annual 2003 (May-July 2005), web site www.eia.doe.gov/iea/, and International Energy Outlook, DOE/EIA-0484 (Washington, DC, various years).
5,116
5,439
5,375
5,592
6,184
Actual 1995
IEO93
IEO92
IEO91
IEO90
0 2,000 4,000 6,000 8,000
Million Short Tons
Figure H7. Comparison of IEO Forecasts with 1995World Coal Consumption
Sources: Energy Information Administration (EIA), Interna-tional Energy Annual 2003 (May-July 2005), web site www.eia.doe.gov/iea/, and International Energy Outlook, DOE/EIA-0484 (Washington, DC, various years).
5833
2225
8556
4137
2723
1920
12955
3651
6356
2226
10-11
-15-11
IEO90IEO91IEO92IEO93
IEO90IEO91IEO92IEO93
IEO90IEO91IEO92IEO93
IEO90IEO91IEO92IEO93
IEO90IEO91IEO92IEO93
IEO90IEO91IEO92IEO93
0 50 100 150-50
Total
Oil
Natural Gas
Coal
Nuclear
Renewables/Other
Percent Difference From Actual 1995
Figure H8. Comparison of IEO Forecasts with 1995Energy Consumption in theFormer Soviet Union by Fuel Type
Sources: Energy Information Administration (EIA), Interna-tional Energy Annual 2003 (May-July 2005), web site www.eia.doe.gov/iea/, and International Energy Outlook, DOE/EIA-0484 (Washington, DC, various years).
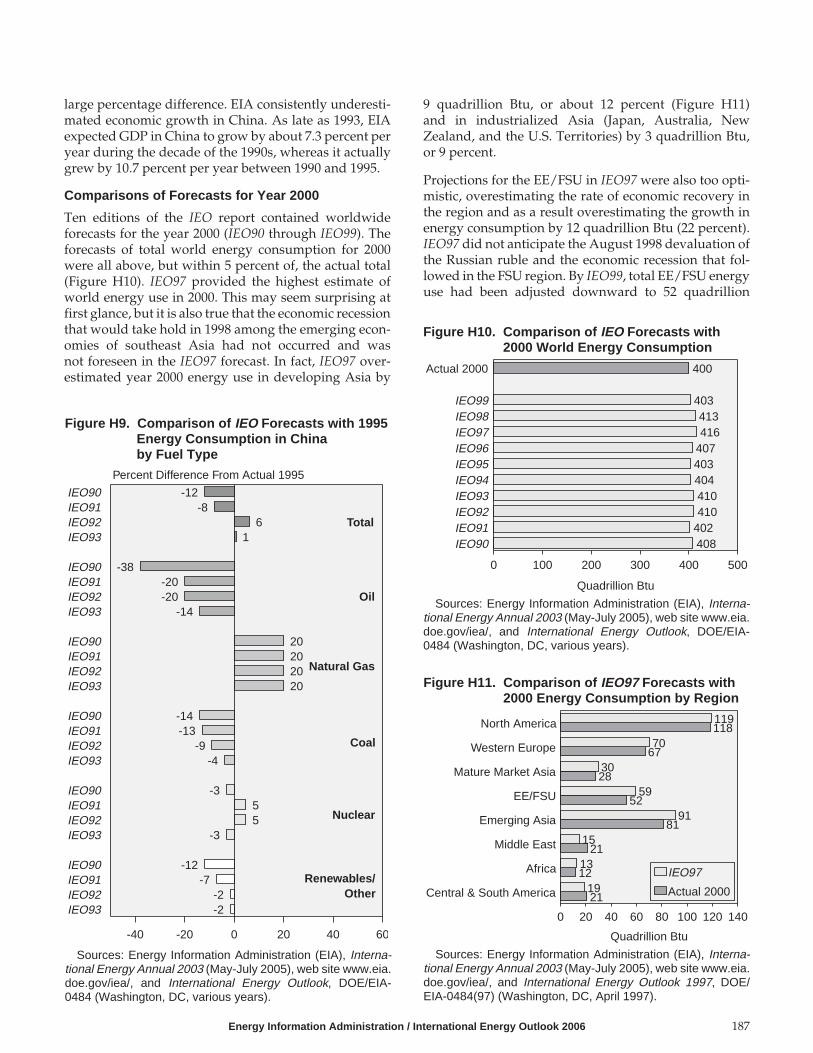
large percentage difference. EIA consistently underesti-mated economic growth in China. As late as 1993, EIAexpected GDP in China to grow by about 7.3 percent peryear during the decade of the 1990s, whereas it actuallygrew by 10.7 percent per year between 1990 and 1995.
Comparisons of Forecasts for Year 2000
Ten editions of the IEO report contained worldwideforecasts for the year 2000 (IEO90 through IEO99). Theforecasts of total world energy consumption for 2000were all above, but within 5 percent of, the actual total(Figure H10). IEO97 provided the highest estimate ofworld energy use in 2000. This may seem surprising atfirst glance, but it is also true that the economic recessionthat would take hold in 1998 among the emerging econ-omies of southeast Asia had not occurred and wasnot foreseen in the IEO97 forecast. In fact, IEO97 over-estimated year 2000 energy use in developing Asia by
9 quadrillion Btu, or about 12 percent (Figure H11)and in industrialized Asia (Japan, Australia, NewZealand, and the U.S. Territories) by 3 quadrillion Btu,or 9 percent.
Projections for the EE/FSU in IEO97 were also too opti-mistic, overestimating the rate of economic recovery inthe region and as a result overestimating the growth inenergy consumption by 12 quadrillion Btu (22 percent).IEO97 did not anticipate the August 1998 devaluation ofthe Russian ruble and the economic recession that fol-lowed in the FSU region. By IEO99, total EE/FSU energyuse had been adjusted downward to 52 quadrillion
Energy Information Administration / International Energy Outlook 2006 187
-12-8
61
-38-20-20
-14
20202020
-14-13
-9-4
-355
-3
-12-7
-2-2
IEO90IEO91IEO92IEO93
IEO90IEO91IEO92IEO93
IEO90IEO91IEO92IEO93
IEO90IEO91IEO92IEO93
IEO90IEO91IEO92IEO93
IEO90IEO91IEO92IEO93
0 20 40 60-20-40
Total
Oil
Natural Gas
Coal
Nuclear
Renewables/Other
Percent Difference From Actual 1995
Figure H9. Comparison of IEO Forecasts with 1995Energy Consumption in Chinaby Fuel Type
Sources: Energy Information Administration (EIA), Interna-tional Energy Annual 2003 (May-July 2005), web site www.eia.doe.gov/iea/, and International Energy Outlook, DOE/EIA-0484 (Washington, DC, various years).
400
403413416
407403404410410
402408
Actual 2000
IEO99IEO98IEO97IEO96IEO95IEO94IEO93IEO92IEO91IEO90
0 100 200 300 400 500
Quadrillion Btu
Figure H10. Comparison of IEO Forecasts with2000 World Energy Consumption
Sources: Energy Information Administration (EIA), Interna-tional Energy Annual 2003 (May-July 2005), web site www.eia.doe.gov/iea/, and International Energy Outlook, DOE/EIA-0484 (Washington, DC, various years).
119
70
30
59
91
15
13
19
118
67
28
52
81
21
12
21
North America
Western Europe
Mature Market Asia
EE/FSU
Emerging Asia
Middle East
Africa
Central & South America
0 20 40 60 80 100 120 140
Quadrillion Btu
IEO97
Actual 2000
Figure H11. Comparison of IEO97 Forecasts with2000 Energy Consumption by Region
Sources: Energy Information Administration (EIA), Interna-tional Energy Annual 2003 (May-July 2005), web site www.eia.doe.gov/iea/, and International Energy Outlook 1997, DOE/EIA-0484(97) (Washington, DC, April 1997).

Btu—just slightly lower than the region’s actual con-sumption in 2000.
The projections for year 2000 by fuel were mixed interms of accuracy. For all energy sources except coal,total world consumption forecasts fell within 13 percentof the actual levels. As was the case with forecasts for theyears 1990 and 1995, world coal consumption projec-tions were consistently high relative to actual consump-tion in 2000. The world coal forecast presented in IEO90was 30 percent higher than actual 2000 values. The fore-casts for the CPE countries were responsible for the largediscrepancy between projected IEO90 and actual coalconsumption in 2000. In fact, IEO90 projected that themarket economies would consume 2,801 million shorttons of coal in 2000, and the actual estimate for coal useamong the market economies was 2,974. However, inthe CPE countries—including the EE/FSU—IEO90 pro-jected that coal use would climb to 3,841 million shorttons in 2000, whereas actual coal consumption was only2,108 million short tons.
Much of the discrepancy between the IEO90 projectionand actual 2000 coal consumption can be attributed tothe FSU. As noted above, IEO90 did not foresee the col-lapse of the Soviet regime in 1990 when the report pro-jections were prepared. Indeed, coal use in the FSU inIEO90 was expected to expand to 1,132 million shorttons in 2000, whereas in reality coal use in the FSU beganto decline precipitously after 1990, hitting a low of 388million short tons in 1998 before edging up to 400 mil-lion short tons in 2000. The story was similar for EasternEurope and the other CPE countries (excluding China),where coal use in 2000 was overestimated by 202 percentin IEO90.
The year 2000 forecasts for oil, natural gas, and hydro-electricity and other renewable energy sources were, forthe most part, higher than actual levels. In contrast, pro-jections for nuclear power were consistently lower thanthe actual 2000 values. Interestingly, the forecasts for theUnited States were largely responsible for the underesti-mation. Even in IEO99—the latest IEO that includedprojections for 2000—analysts were expecting nuclearpower to begin to decline. In IEO90 there was wide-spread pessimism about the future of nuclear power inthe mid-term, given the aftermath of the Chernobyldisaster and the problems associated with nuclear wastedisposal. In the political climate of the early 1990s, IEO90could not anticipate the life extensions and consistentlyimproving efficiencies that have allowed nuclear powerplants to generate more electricity and operate withshorter downtimes for maintenance, even withoutexpanding their installed capacities.
The comparison of IEO projections and historical data inthe context of political and social events underscores theimportance of those events in shaping the world’senergy markets. Such comparisons also point out howimportant a model’s assumptions are to the derivationof accurate forecasts. The political and social upheaval inthe EE/FSU dramatically affected the accuracy of theprojections for the region. On the other hand, if highereconomic growth rates had been assumed for China,more accurate forecasts for that region might have beenachieved. It is important for users of the IEO or any otherprojection series to realize the limitations of the fore-casts. Failing an ability to predict future volatility insocial, political, or economic events, the projectionsshould be viewed as a plausible path or trend for thefuture and not as a precise prediction of future events.
188 Energy Information Administration / International Energy Outlook 2006

Appendix I
System for the Analysis of Global Energy Markets (SAGE)
The projections of world energy consumption appearingin IEO2006 are based on EIA’s international energymodeling tool, SAGE. SAGE is an integrated set ofregional models that provide a technology-rich basisfor estimating regional energy consumption. For eachregion, reference case estimates of 42 end-use energyservice demands (e.g., car, commercial truck, and heavytruck road travel; residential lighting; steam heatrequirements in the paper industry) are developed onthe basis of economic and demographic projections. Pro-jections of energy consumption to meet the energydemands are estimated on the basis of each region’sexisting energy use patterns, the existing stock ofenergy-using equipment, and the characteristics ofavailable new technologies, as well as new sources ofprimary energy supply.
Period-by-period market simulations aim to provideeach region’s energy services at minimum cost by simul-taneously making end-use equipment and primaryenergy supply decisions. For example, in SAGE, if thereis an increase in residential lighting energy service,either existing generation equipment must be used moreintensively or new equipment must be installed. Thechoice of generation equipment (type and fuel) incorpo-rates analysis of both the characteristics of alternativegeneration technologies and the economics of primaryenergy supply.
The IEO provides projections of total world primaryenergy consumption, as well as projections of energyconsumption by primary energy type (oil, natural gas,coal, nuclear, and hydroelectric and other renewableresources) and projections of net electricity consump-tion. Projections of carbon dioxide emissions resultingfrom fossil fuel use are also provided. All projections arecomputed in 5-year intervals through the year 2030.
More detailed tables emphasize the end-use demand-driven nature of SAGE.
SAGE provides projections for 16 regions or countries,including the North American countries of the UnitedStates, Canada, and Mexico; OECD Europe; the OECDAsian countries of Japan, South Korea, and Austra-lia/New Zealand; Russia; other non-OECD Europe andEurasia; China; India; other non-OECD Asia; the MiddleEast; Africa; Brazil; and other Central and SouthAmerica.
Projections of world oil prices over the projection hori-zon are provided to SAGE from EIA’s InternationalEnergy Module, which is a submodule of the NationalEnergy Modeling System (NEMS). Projections of worldnuclear energy consumption are derived from installednuclear power capacity projections developed bynuclear power experts within EIA. All U.S. projectionsare taken from EIA’s Annual Energy Outlook (AEO).
A full description of the SAGE model is available in atwo-volume set. The first volume provides a generalunderstanding of the model’s design, theoretical basis,necessary user-defined assumptions, and output. It alsolists the software necessary to develop and analyze theresults of SAGE-based policy and energy market scenar-ios. In addition, Volume I includes a Reference Guide,which explains each equation in detail. The second vol-ume serves as a User’s Guide for those actively develop-ing SAGE-based scenario analyses. The documentationis available on EIA’s web site in the model documenta-tion section of “Current Publications” (http://www.eia.doe.gov/bookshelf/docs.html). SAGE documentationis also available as part of the documentation for theMARKAL family of models (http://www.etsap.org/MRKLDOC-III_SAGE.pdf).
Energy Information Administration / International Energy Outlook 2006 189

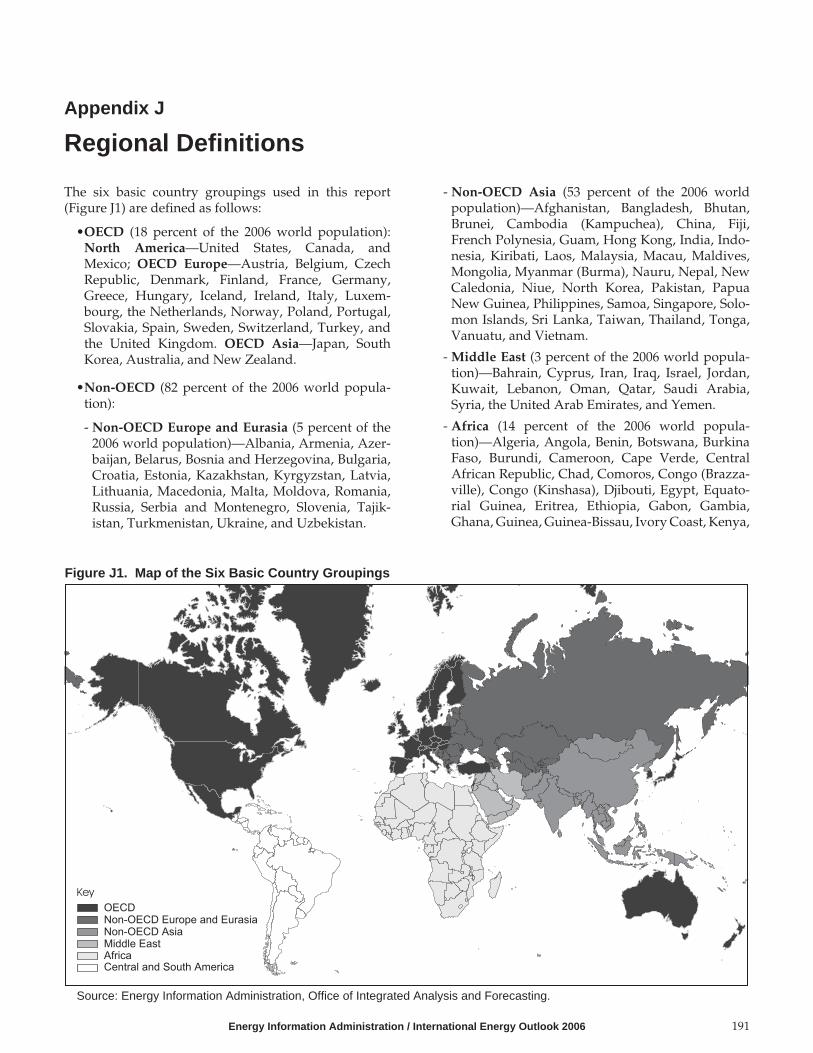
Appendix J
Regional Definitions
The six basic country groupings used in this report(Figure J1) are defined as follows:
•OECD (18 percent of the 2006 world population):North America—United States, Canada, andMexico; OECD Europe—Austria, Belgium, CzechRepublic, Denmark, Finland, France, Germany,Greece, Hungary, Iceland, Ireland, Italy, Luxem-bourg, the Netherlands, Norway, Poland, Portugal,Slovakia, Spain, Sweden, Switzerland, Turkey, andthe United Kingdom. OECD Asia—Japan, SouthKorea, Australia, and New Zealand.
•Non-OECD (82 percent of the 2006 world popula-tion):
- Non-OECD Europe and Eurasia (5 percent of the2006 world population)—Albania, Armenia, Azer-baijan, Belarus, Bosnia and Herzegovina, Bulgaria,Croatia, Estonia, Kazakhstan, Kyrgyzstan, Latvia,Lithuania, Macedonia, Malta, Moldova, Romania,Russia, Serbia and Montenegro, Slovenia, Tajik-istan, Turkmenistan, Ukraine, and Uzbekistan.
- Non-OECD Asia (53 percent of the 2006 worldpopulation)—Afghanistan, Bangladesh, Bhutan,Brunei, Cambodia (Kampuchea), China, Fiji,French Polynesia, Guam, Hong Kong, India, Indo-nesia, Kiribati, Laos, Malaysia, Macau, Maldives,Mongolia, Myanmar (Burma), Nauru, Nepal, NewCaledonia, Niue, North Korea, Pakistan, PapuaNew Guinea, Philippines, Samoa, Singapore, Solo-mon Islands, Sri Lanka, Taiwan, Thailand, Tonga,Vanuatu, and Vietnam.
- Middle East (3 percent of the 2006 world popula-tion)—Bahrain, Cyprus, Iran, Iraq, Israel, Jordan,Kuwait, Lebanon, Oman, Qatar, Saudi Arabia,Syria, the United Arab Emirates, and Yemen.
- Africa (14 percent of the 2006 world popula-tion)—Algeria, Angola, Benin, Botswana, BurkinaFaso, Burundi, Cameroon, Cape Verde, CentralAfrican Republic, Chad, Comoros, Congo (Brazza-ville), Congo (Kinshasa), Djibouti, Egypt, Equato-rial Guinea, Eritrea, Ethiopia, Gabon, Gambia,Ghana, Guinea, Guinea-Bissau, Ivory Coast, Kenya,
Energy Information Administration / International Energy Outlook 2006 191
Key
Africa
OECDNon-OECD Europe and EurasiaNon-OECD AsiaMiddle East
Central and South America
Figure J1. Map of the Six Basic Country Groupings
Source: Energy Information Administration, Office of Integrated Analysis and Forecasting.
Lesotho, Liberia, Libya, Madagascar, Malawi, Mali,Mauritania, Mauritius, Morocco, Mozambique,Namibia, Niger, Nigeria, Reunion, Rwanda, SaoTome and Principe, Senegal, Seychelles, SierraLeone, Somalia, South Africa, St. Helena, Sudan,Swaziland, Tanzania, Togo, Tunisia, Uganda,Western Sahara, Zambia, and Zimbabwe.
- Central and South America (7 percent of the 2006world population)—Antarctica, Antigua and Bar-buda, Argentina, Aruba, Bahama Islands, Barba-dos, Belize, Bolivia, Brazil, British Virgin Islands,Cayman Islands, Chile, Colombia, Costa Rica,Cuba, Dominica, Dominican Republic, Ecuador, ElSalvador, Falkland Islands, French Guiana, Gre-nada, Guadeloupe, Guatemala, Guyana, Haiti,Honduras, Jamaica, Martinique, Montserrat, Neth-erlands Antilles, Nicaragua, Panama Republic, Par-aguay, Peru, Puerto Rico, St. Kitts-Nevis, St. Lucia,St. Vincent/Grenadines, Suriname, Trinidad andTobago, Turks and Caicos Islands, Uruguay, U.S.Virgin Islands, and Venezuela.
In addition, the following commonly used countrygroupings are referenced in this report:
•Countries that have ratified, accepted, acceded, orapproved the Kyoto Climate Change Protocol onGreenhouse Gas Emissions as of April 16, 2006:Albania, Algeria, Antigua and Barbuda, Argentina,Armenia, Austria, Azerbaijan, Bahamas, Bahrain,Bangladesh, Barbados, Belarus, Belgium, Belize,Benin, Bhutan, Bolivia, Botswana, Brazil, Bulgaria,Burkina Faso, Burundi, Cambodia, Cameroon,Canada, Cape Verde, Chile, China, Colombia, CostaRica, Cuba, Cyprus, Czech Republic, Congo(Kinshasa), Denmark, Djibouti, Dominica, Domini-can Republic, Ecuador, Egypt, El Salvador, Equato-rial Guinea, Eritrea, Estonia, Ethiopia, Fiji, Finland,France, Gambia, Georgia, Germany, Ghana, Greece,Grenada, Guatemala, Guinea, Guinea-Bissau, Guy-ana, Haiti, Honduras, Hungary, Iceland, India, Indo-nesia, Iran, Ireland, Israel, Italy, Jamaica, Japan,Jordan, Kenya, Kiribati, Kuwait, Kyrgyzstan, Laos,Latvia, Lesotho, Liberia, Liechtenstein, Lithuania,Luxembourg, Macedonia, Madagascar, Malawi,Malaysia, Maldives, Mali, Malta, Marshall Islands,Mauritania, Mauritius, Mexico, Micronesia, Monaco,Moldova, Mongolia, Morocco, Mozambique,Myanmar, Namibia, Nauru, Nepal, Netherlands,New Zealand, Nicaragua, Niger, Nigeria, Niue,North Korea, Norway, Oman, Pakistan, Palau,Panama, Papua New Guinea, Paraguay, Peru,
Philippines, Poland, Portugal, Qatar, Romania, Rus-sia, Rwanda, Saint Lucia, St. Vincent/Grenadines,Samoa, Saudi Arabia, Senegal, Seychelles, Singa-pore, Slovakia, Slovenia, Solomon Islands, SouthAfrica, South Korea, Spain, Sri Lanka, Sudan,Swaziland, Sweden, Switzerland, Syria, Tanzania,Thailand, Togo, Trinidad and Tobago, Tunisia, Turk-menistan, Tuvalu, Uganda, Ukraine, United ArabEmirates, United Kingdom, Uruguay, Uzbekistan,Vanuatu, Venezuela, Vietnam, and Yemen.
•Annex I Countries participating in the KyotoClimate Change Protocol on Greenhouse Gas Emis-sions: Austria, Belgium, Bulgaria, Canada, Croatia,Czech Republic, Denmark, Estonia, European Com-munity, Finland, France, Germany, Greece, Hun-gary, Iceland, Ireland, Italy, Japan, Latvia, Liechten-stein, Lithuania, Luxembourg, Monaco, the Nether-lands, New Zealand, Norway, Poland, Portugal,Romania, Russia, Slovakia, Slovenia, Spain, Sweden,Switzerland, Ukraine, and the United Kingdom.21
•European Union (EU): Austria, Belgium, Cyprus,Czech Republic, Denmark, Estonia, Finland, France,Germany, Greece, Hungary, Ireland, Italy, Latvia,Lithuania, Luxembourg, Malta, the Netherlands,Poland, Portugal, Slovakia, Slovenia, Spain, Sweden,and the United Kingdom.
•G8: Canada, France, Germany, Italy, Japan, Russia,United Kingdom, and the United States.
•North American Free Trade Agreement (NAFTA)Member Countries: Canada, Mexico, and the UnitedStates.
•Organization for Economic Cooperation andDevelopment (OECD): Australia, Austria, Belgium,Canada, Czech Republic, Denmark, Finland, France,Germany, Greece, Hungary, Iceland, Ireland, Italy,Japan, Luxembourg, Mexico, the Netherlands, NewZealand, Norway, Poland, Portugal, Slovakia, SouthKorea, Spain, Sweden, Switzerland, Turkey, theUnited Kingdom, and the United States.
•Organization of Petroleum Exporting Countries(OPEC): Algeria, Indonesia, Iran, Iraq, Kuwait,Libya, Nigeria, Qatar, Saudi Arabia, the United ArabEmirates, and Venezuela.
•Pacific Rim Developing Countries: Hong Kong,Indonesia, Malaysia, Philippines, Singapore, SouthKorea, Taiwan, and Thailand.
•Persian Gulf Countries: Bahrain, Iran, Iraq, Kuwait,Qatar, Saudi Arabia, and the United Arab Emirates.
192 Energy Information Administration / International Energy Outlook 2006
21Turkey and Croatia are Annex I nations that have not ratified the Framework Convention on Climate Change and did not commit toquantifiable emissions targets under the Kyoto Protocol. In 2001, the United States withdrew from the Protocol, and in 2002 Australiaannounced that it will not ratify the Kyoto Protocol unless the United States does.