Embed Size (px)
Citation preview

International Family Migration and the Dual-Earner Model
Martin D. Munk Till Nikolka
Panu Poutvaara
CESIFO WORKING PAPER NO. 6377 CATEGORY 4: LABOUR MARKETS
FEBRUARY 2017
An electronic version of the paper may be downloaded • from the SSRN website: www.SSRN.com • from the RePEc website: www.RePEc.org
• from the CESifo website: Twww.CESifo-group.org/wp T
ISSN 2364-1428

CESifo Working Paper No. 6377
International Family Migration and the Dual-Earner Model
Abstract Gender differences in labor force participation are exceptionally small in Nordic countries. We investigate how couples emigrating from Denmark self-select and sort into different destinations and whether couples pursue the dual-earner model, in which both partners work, when abroad. Female labor force participation is slightly lower among couples that later emigrate, and drops considerably after migration outside the Nordic countries. Pre-migration differences between couples subsequently migrating to different destinations are small. Our survey reveals that couple migration is usually driven by the male’s job opportunities. The results suggest that increasing international migration may reduce women’s career investments.
JEL-Codes: D130, J120, J130, J160, F220.
Keywords: household production, female labor force participation, child care, international migration, family migration.
Martin D. Munk Aalborg University
Department of Political Science A C Meyers Vaenge 15, FKJ10B-3 Denmark - 2450 Copenhagen SV
Till Nikolka Ifo Institute – Leibniz Institute for
Economic Research at the University of Munich
Poschingerstrasse 5 Germany – 81679 Munich
Panu Poutvaara Ifo Institute – Leibniz Institute for
Economic Research at the University of Munich
Poschingerstrasse 5 Germany – 81679 Munich
We thank Christina Fong, Paola Profeta, Helmut Rainer, Maximilian Schwefer, Madhinee Valeyatheepillay, as well as participants at the 4th Norface Migration Conference, 12th Journees LAGV, 71st IIPF Annual Congress as well as seminar participants at Brunel University and the University of Exeter for useful comments. Financial support from the Leibniz Association (SAW-2012-ifo-3) and from the Danish Council for Independent Research | Social Sciences (FSE) is gratefully acknowledged.
1 Introduction
A couple considering migration might face a trade-off in whose career to prioritize. An important
question from a societal perspective is hence whether post-migration changes in labor force par-
ticipation and intra-household resource allocation reflect both partners’ preferences, or whether
migration hurts one of the partners. Previous research on internal migration has found that couple
migration is typically associated with career gains for men, with women often leaving the labor
market or at least reducing the hours worked (Mincer, 1978; Frank, 1978). As partners may differ
in the international transferability of their education and in their language skills, international
migration is likely to impose even more difficult trade-offs. This is of increasing importance in
globalized economies, affecting investments in education and the international allocation of talent
as well as firm competitiveness. Furthermore, if women would expect a high probability that they
would later emigrate due to their partner’s job opportunities, this would reduce their incentives
to invest in their own career. In the light of assortative mating, this could be expected to affect
disproportionately women who might otherwise pursue an ambitious career. Given that early in-
vestments in career are made before the realizations of own and partner’s job opportunities abroad
are revealed, this would affect the incentives beyond the group that actually emigrates. However,
so far there is no research linking pre-migration and post-migration outcomes in the context of
international family migration.
In this paper, we first present a theoretical model in which partners jointly choose the optimal
allocation of available time for labor supply and household production. Depending on wage rates,
gender identity and, in the presence of children, the price of child care, couples may prefer either a
dual-earner model in which both partners work outside the home, or a male breadwinner model in
which only the male works outside the home. We then use the predictions of the model to guide our
empirical analysis on labor force participation among migrant couples from Denmark in different
destinations. Second, to test the role of Tiebout sorting, we use administrative data on the whole
population to analyze how couples migrating to different destinations self-select according to the
partners’ labor force participation in Denmark. Third, with a representative survey of Danish
emigrants we study why couples emigrate, to what extent emigration is a shared preference of the
partners, and how labor force participation abroad differs from the pre-migration situation. We
restrict attention to couples in which both partners are Danes as migration decisions of couples in
which one partner returns to his or her home country might be qualitatively different. The survey
data is combined with the full Danish population administrative data to evaluate to what extent
1
our survey respondents are representative of the underlying population.
Our model allows both a gender neutral set-up and the possibility of gendered specialization in the
household. Gender identity norms could result in a preference for the male breadwinner model.
For example, Bertrand et al. (2015) conclude that a large fraction of American couples is averse to
a situation in which the female earns more than the male. In international comparison, Denmark
has higher female labor force participation rates than most other countries (75.0%, OECD, 2015)
and ranks third among all countries in gender equality according to Klugman (2011). Goldin
(2006) called women’s increased labor force participation "the most significant change in labor
markets during the past century". The Nordic countries have pioneered this change promoted by
generously subsidized child care services, and also by heavy income taxation at the individual level.
Irrespective of whether specialization in household production follows from comparative advantage
or gender identity, our model predicts that the likelihood that the secondary earner works is in-
creasing in the secondary earner’s relative wage. A revealed preference argumentation suggests
that a partner whose job was the main reason for the couple to emigrate must gain, which in turn
implies that the labor force participation of the tied mover (who can generally be expected to be
the secondary earner) is likely to decrease. Our model suggests that labor force participation rates
of women who are tied movers are linked to income differences in various destination countries.
Moreover, based on the model’s comparative statics we expect female labor force participation to
be lower among couples with children, especially among those with young children in countries
without universal public child care. Both small income differences and generous child care services
in other Nordic countries suggest that female labor force participation should be highest in these
countries, being in line with the rates in Denmark. On the other hand, we would expect female
labor force participation rates among Danish migrant couples to be lower in the United States
(US) than in other Western countries, due to wider income differences in the US. The same would
apply to non-Western destination countries.
Analyzing labor force participation and emigration decisions in the whole population of Danish
couples we find that couples are more likely to emigrate if either partner is out of the labor force.
Among couples migrating to the US, female labor force participation is somewhat lower before
emigration compared to female labor force participation rates of couples migrating to other desti-
nations. However, the vast majority of emigrant couples pursues a dual-earner model in Denmark
before migration. We do not find different sorting of emigrants to other Western or non-Western
countries in terms of pre-migration female labor force participation. Furthermore, regression anal-
2

ysis shows that the effects of partners’ education and children on female labor force participation
in Denmark are quite similar among couples that do not migrate, among couples that migrate for
one or more years, among couples that migrate for five or more years and among couples that have
not returned to Denmark.1 Our survey data analysis sheds light on whether couples emigrating
from egalitarian Nordic countries pursue the dual-earner model outside the Nordic countries, or
if international mobility is associated with adopting a traditional male breadwinner model. Our
main finding is that female labor force participation outside the Nordic countries is considerably
lower than in Denmark while there are no changes in male labor force participation patterns.
Our finding of lower female labor force participation outside the Nordic countries could reflect both
demand and supply side effects. As for demand side effects, women who migrate with their partner
might not be able to find a job matching their qualifications, thus suffering a loss as tied movers.
However, survey data reveals that reduced labor force participation among most couples is in line
with the partners’ preferences. On the labor supply side, there are four potential explanations for
lower female labor force participation rates outside the Nordic countries. First, our model suggests
that wider wage differences between the partners abroad compared with Denmark can be a reason
for reduced female labor force participation. Second, couples with children might face a higher
price for child care services in other countries as compared to the price in Denmark which makes
it less attractive for both partners to participate in the labor force. Third, lower female labor
force participation among the migrant couples could be due to assimilation towards prevailing
social norms in the destination country. Fourth, reduced female labor force participation might be
driven by self-selection to different destinations according to the partners’ preferences towards the
division of labor.
Empirical analysis confirms that female labor force participation is lower among couples living in
countries where incomes are more dispersed, as measured by the GINI coefficient, as well as in
countries with less affordable child care. Prevailing female labor force participation rates in the
countries of residence, instead, fail to explain the observed differences in female labor force par-
ticipation among the migrant couples. As for self-selection into migration, we find slightly lower
female labor force participation in Denmark among couples migrating to the US compared to those
migrating to other Western countries. There are no differences in female labor force participation1When using register data, we analyze different duration criteria separately as Borjas and Bratsberg (1996) found
that accounting for return migration accentuates the self-selection of immigrants to the US. Dustmann and Görlach(2016) show that a large share of international migration is temporary. Our survey data is restricted to Danishemigrants who have not returned.
3

in Denmark between couples subsequently migrating to the Nordic countries, the other Western
countries, and the non-Western countries. While migrants do not differ much from non-migrants in
terms of pre-migration female labor force participation, this does not rule out strong self-selection
in terms of preferences. We find that most male survey respondents migrated for own work reasons
and most females for family reasons, with migration almost always being a shared preference al-
though driven by male preferences in a sizable minority of couples. Furthermore, couples migrating
to different destinations differ considerably with respect to their main motivations to emigrate and
preferred female labor force participation.
We make three main contributions to the previous literature on family migration. First, we obtain
direct evidence on partners’ stated motivations to migrate and on whether migration was a joint
preference, or if one partner was a tied mover who would have preferred not to migrate. Second,
we analyze data on labor force participation before and after migration and address self-selection
and sorting of the migrant couples with regard to labor force participation. Third, we analyze
international migration. Due to data restrictions, most literature on family migration has focused
on internal migration. The few papers that have analyzed international migration in the family
context have looked at labor force participation or earnings only in the destination country (Borjas
and Bronars, 1991; Cobb-Clark, 1993), or only in the country of origin (Junge et al., 2014; Foged,
2016).2 Junge et al. (2014) show that the likelihood that a dual-earner couple emigrates increases
strongly in the earnings of the primary earner. Foged (2016) shows that a similar result holds also
when using partners’ predicted earnings potentials, based on nine education categories.
Earlier migration research has focused extensively on migration from poor to rich countries, but
migration flows between rich countries are also substantial. In 2013, 22 million persons born in one
of the EU15 countries3 lived outside their country of origin. Out of those, 42% lived in another
EU15 country and an additional 13% in the US (United Nations, 2015). The pattern of emigration
from Denmark is rather similar. In 2013, over a quarter million Danes lived outside Denmark
(corresponding to about 5% of the Danish-born population), with 50% of the migrants living in
other EU15 countries and 13% in the US (United Nations, 2015). Emigration rates from Denmark
are neither exceptionally low nor exceptionally high when comparing across European countries.
In 2012, the emigration rate among the 25 to 54 year old native-born population was 0.33% in2There is an extensive literature on the effects of temporary migration of family members on those left behind
in the home country, for example through remittances. For a survey see Docquier and Rapoport (2006).3This country group includes: Austria, Belgium, Denmark, Finland, France, Germany, Greece, Ireland, Italy,
Luxembourg, the Netherlands, Portugal, Spain, Sweden, and the United Kingdom.
4

Denmark, 0.18% in Germany, 1.19% in Ireland, 0.37% in the Netherlands, 0.13% in Spain, and
0.29% in Sweden (Eurostat 2016).
Our findings raise intriguing questions about family preferences towards the dual-earner and the
male breadwinner model, also outside the context of migration. One third of couples that have
emigrated outside the Nordic countries prefer that only the male works, in a stark contrast to
the Nordic countries in which only one in sixteen couples prefers that the male works and the
female stays at home. We find small pre-migration differences in female labor force participation
between couples that subsequently migrated to different destinations. Pre-migration female labor
force participation among couples that subsequently emigrate is lower compared with non-migrant
couples but only a small fraction of female partners is out of the labor force before emigration.
Furthermore, especially women migrating to the US and non-Western countries viewed escaping
stressful working life as an argument in favor of emigration, and very few against. This suggests
that a large fraction of couples emigrating to these countries preferred to switch from a dual-earner
model to a male breadwinner model. Those preferring a dual-earner model might choose to stay
in Denmark or to go to another Nordic country in which generous welfare services, especially child
care provision, make combining work and family easier, in order to avoid the female being pushed
out of the labor force. As it is unlikely that all couples preferring a male breadwinner model
would go as far as to emigrate, an open question is how many of the dual-earner couples living
in egalitarian Nordic countries would actually prefer the traditional male breadwinner model, if
wider income differences would allow a high living standard with only one partner working. The
big differences in labor force participation between emigrant couples in different destinations are
likely to reflect a joint effect of self-selection in terms of preferences and labor supply adjustments
as a reaction to different relative wage rates and price and availability of child care services.
The rest of the paper is organized as follows. Section 2 presents the theoretical model from which
we derive hypotheses to be tested in our empirical analysis. We describe our data in section 3
and summarize stylized facts in section 4. Section 5 presents our econometric analysis. Section 6
concludes.
2 Theoretical Framework
We consider a household consisting of two adult partners, a and b (and possibly children who do
not make any decisions). Partners derive utility from consumption C and household production
5

H and divide their working time between labor market activity and the production of a house-
hold public good. The time available for work and household production is equal to one for each
partner. The partners make their decision on how much time to spend on household production
Ha, Hb and how much time to spend on working in the labor market (1−Ha), (1−Hb) in a simple
unitary household economy as proposed by Becker (1974, 1991), i.e. they maximize joint house-
hold utility.4 Household production is linear so that H = Ha + Hb. According to the standard
framework, the specialization in either household or labor market work would arise due to either
partner’s comparative advantage. However, gender identity might also have a large impact on the
division of labor in the household (John and Shelton, 1996, Bertrand et al. 2015; for a survey see
Bertrand, 2011).
We write the couple’s utility in the Cobb-Douglas form with 0 < α < 1 being the weight of market
good consumption and 1 − α being the weight of household production. Couples with children
additionally enjoy utility ψ, but have to provide child care D̄ < 1 for the children. Couples can
choose how much of the required child care to buy on the market (D, D ≤ D̄) and how much
to provide privately (D̄ − D). The time spent on child care is not available for other household
production. For couples without children ψ = 0, D̄ = 0 and thus D = 0. The presence of children
is given exogenously as we do not focus on fertility decisions in this analysis. Wage rates are wa
for partner a and wb for partner b. Child care can be bought for the price pD per time unit. We
write household utility as
U = Cα(Ha +Hb − D̄ +D)1−α + ψ − λI(Ha > 0 ∧Hb < 1)
with
C = (1−Ha)wa + (1−Hb)wb − pDD.
If the household does not have a preference for partner a specializing in the labor market and b
specializing in household production, independently of who earns more, λ = 0. In this case the
partner with the higher wage specializes in labor market work and the partner with the lower
wage in household production. The model allows the case in which partners may have a preference
towards certain family model independent of the partners’ earnings potentials. Such a preference
could reflect gender identity norms as Akerlof and Kranton (2000) suggest. If λ >> 0, then partner4Alternatively, collective models recognize that household members have their own preferences, and engage in
bargaining. This approach was pioneered by Chiappori (1988, 1992) and Apps and Rees (1988). Our analyticalresults could be derived also from a collective model, at the cost of more complex notation. The relationship betweenour model and the richer collective model is discussed at the end of this section. See Browning et al. (2014) for anoverview on the unitary, cooperative and non-cooperative models of the family.
6

a will always specialize in the labor market and b in household production. If partner a is male
and partner b is female, this can be interpreted as a preference for a traditional male breadwinner
model, giving priority to male labor market opportunities even if wa < wb as long as λ is sufficiently
large. The optimal time allocation H∗a and H∗b is given by
Proposition 1. (i) If wa ≥ wb and wb < pD,
H∗a = 1− 2α+ αD̄,H∗b = 1 if α < α̂ah
H∗a = 0, H∗b = 1 if α̂ah ≤ α ≤ α̂bh
H∗a = 0, H∗b = (1− α)(wa
wb+ 1)
+ αD̄ if α̂bh < α,
α̂ah = 12−D̄ being the threshold below which a starts working in the household and
α̂bh = wa
wa+wb−wbD̄being the threshold above which b participates in the labor force in case
childcare is provided privately;
(ii) if wa ≥ wb ≥ pD,
H∗a = 1− 2α− (1− α)pD
waD̄,H∗b = 1 if α < α̂am
H∗a = 0, H∗b = 1 if α̂am ≤ α ≤ α̂bm
H∗a = 0, H∗b = (1− α)(wa
wb+ 1− pD
wbD̄)
if α̂bm < α,
α̂am = wa−pDD̄2wa−pDD̄
being the threshold below which a starts working in the household and
α̂bm = wa−pDD̄wa+wb−pDD̄
being the threshold above which b participates in the labor force in case
childcare is bought on the market;
(iii) if wb > wa and λ = 0, labor supply decisions are as in (i) and (ii), switching indices a and b;
(iv) if wb > wa, λ >> 0, and wb < pD,
H∗a = 1− 2α+ αD̄,H∗b = 1 if α < α̂gh
H∗a = 1− 2α+ αD̄,H∗b = 1 or H∗a = 0, H∗b = (1− α) if α = α̂gh
H∗a = 0, H∗b = (1− α)(wa
wb+ 1)
+ αD̄ if α̂gh < α,
α̂gh =ln( wa+wb−wbD̄
(2−D̄)wb)
ln( wawb
) being the threshold below which a starts working in the household and above
which b participates in the labor force in case childcare is provided privately; if α = α̂gm both
solutions yield the same utility;
(v) if wb > wa, λ >> 0, and wb ≥ pD,
7

H∗a = 1− 2α− (1− α)pD
waD̄,H∗b = 1 if α < α̂gm
H∗a = 1− 2α+ αD̄,H∗b = 1 or H∗a = 0, H∗b = (1− α) if α = α̂gm
H∗a = 0, H∗b = (1− α)(wa
wb+ 1− pD
wbD̄)
if α̂gm < α,
α̂gm =ln( w2
a+wawb−wapDD̄
2wawb−wbpDD̄)
ln( wawb
) being the threshold below which a starts working in the household and
above which b participates in the labor force in case childcare is bought on the market; if α = α̂gm
both solutions yield the same utility.
Proof. See Appendix.
Proposition 1 defines optimal time allocation as a function of the weight that market consumption
has in the household utility function. Below the lowest threshold in each regime depending on the
relative size of wa, wb, and pD, and associated with λ = 0 or λ >> 0, one of the partners fully
specializes in household production and the other divides the time between household production
and working in the labor market. Above the highest threshold, one of the partners fully specializes
working in the labor market and the other divides the time between household production and
working in the labor market. In cases (i), (ii) and (iii), corresponding to the situation in which
the higher-earning partner is the first one to specialize in working in the labor market, there is
also an intermediate parameter range in which the higher-earning partner works full time in the
labor market and the lower-earning partner works full time in household production. In regimes
(iv) and (v), corresponding to the case in which gender identity norms result in the lower-earning
partner to specialize in working outside the household, such an intermediate range of both partners
specializing fully does not exist. The reason for this is that the higher-earning partner always stays
out of the labor market unless the lower-earning partner works full-time. With increasing marginal
utility from consumption the lower-earning partner increases labor supply while the higher-earning
partner remains out of the labor market up to a value of α = α̂gh in case (iv) and α = α̂gm in
case (v). Above this value, the utility is higher when the higher-earning partner enters the labor
market with a labor supply strictly above zero conditional on the lower-earning partner working
full-time. As the higher-wage partner increases labor supply with increasing α at lower marginal
cost of substitution it is not optimal for the couple to fully specialize before the higher-wage partner
enters the labor market.
Comparative statics yield:
8

Proposition 2. Extensive and intensive margin labor supply of the partner specializing in home
production is weakly increasing with the own wage and weakly decreasing with the partner’s wage.
Proof. Under (i), (ii), (iv) and (v)
∂α̂z∂wa
≥ 0, ∂α̂z∂wb
≤ 0, ∂H∗b∂wa
≥ 0, ∂H∗b∂wb
≤ 0, with z ∈ {bh, bm, gh, gm}.
For case (iii) the above expressions hold after switching indices a and b.
Proposition 3. The labor supply of the partner specializing in home production is increasing
(decreasing) with the time required for child care, provided that the wage rate of that partner is
higher (lower) than the price of child care. If the wage rate of the partner specializing in home
production is higher than the price of child care, this partner’s labor supply is increasing with the
price of child care.
Proof. Under (i) and (iv)
∂α̂z
∂D̄≥ 0, ∂Hb
∂D̄≥ 0 ∂α̂z
∂pD= 0, ∂H∗b
∂pD= 0, with z ∈ {bh, gh},
and under (ii) and (v)
∂α̂z
∂D̄≤ 0, ∂H∗b
∂D̄≤ 0, ∂α̂z
∂pD≤ 0, ∂H∗b
∂pD≤ 0, with z ∈ {bm, gm}.
For case (iii) the comparative statics from (i) and (ii) apply after switching indices a and b.
Figure 1 illustrates the relationship between the minimum relative wage for labor market participa-
tion of b and the required time D̄ for different values of α. The values on the vertical axis (D̄ = 0)
refer to the required relative wage for b to participate in the labor force if the couple has no children.
The theory presents a mechanism relating each partner’s earnings potential and required child
care to labor supply decisions in the household. Deciding which of the partners specializes in the
labor market could be made either based on comparative advantage (λ = 0) or based on relative
preferences for partner b to specialize in household production (λ >> 0). In the data we observe
that almost all male partners work full-time before as well as after migration. Female labor supply
and labor market participation vary to a larger extent. Given our data the subsequent analysis
is going to study the implications of the model for the case that households adjust female labor
supply and the male partner works full time in the labor market. Hence, we refer to partner a as
9

Figure 1: Required child care and minimum relative wage for labor force participation of partnerb under (i), in which wa ≥ wb and wb < pD, left panel, and under (ii) in which wa ≥ wb ≥ pD,right panel.
the male and partner b as the female partner and present the hypotheses referring to female labor
force participation.
This paper focuses on labor supply decisions in the context of international migration. Migration
goes along with changes in the partners’ job opportunities. In the light of our theoretical model, we
relate potential explanatory factors like the partners’ education - as an indicator of their earnings
potential - as well as family characteristics to household economies and labor supply abroad.
We can summarize the hypotheses we test as follows.
Hypothesis 1 (the effect of education). Female labor force participation is lowest if the male partner
has a higher level of education.
Hypothesis 1 follows from our theoretical model if the partners’ education levels are an indicator
of their relative earnings potential in Denmark and abroad.
Hypothesis 2 (the tied mover effect). Female labor force participation is lower abroad if the female
partner is a tied mover.
Hypothesis 2 follows as if a couple migrates mainly for job opportunities of one partner, then we
expect by revealed preference argumentation that the wage rate of that partner increases. This, in
turn, makes it likely that the other partner works less, even if the wage rate of the other partner
10

would be the same abroad. If the wage rate of the accompanying spouse is lower abroad, this
further reduces his or her expected labor force participation.
Hypothesis 3 (the effects of children). Having children, especially young children, reduces female
labor force participation in countries with expensive child care services.
Hypothesis 3 follows from our model if the female partner is more often the one taking care of chil-
dren at home, and child care costs in Denmark and other Nordic countries are heavily subsidized,
while child care is rather expensive elsewhere. This suggests that having children reduces female
labor force participation more strongly outside the Nordic countries. Figure 1 illustrates that the
relative wage required for female labor force participation is higher if child care is provided by the
female partner in the household.
Hypothesis 4 (cross-country differences). Female labor force participation rate is lower in countries
with wider income differences.
According to our model, labor force participation rate of secondary earners (partner b) is decreas-
ing in the wage rate of the primary earners (partner a). The cross-country differences in expected
female labor force participation rates follow from combining the theoretical prediction of Hypoth-
esis 2 with the previous empirical results on income differences between different countries and
self-selection and sorting of emigrants.
Although Denmark has one of the highest female labor force participation rates, females more often
work part-time compared to males (OECD 2015). In addition, in terms of hourly wages the OECD
reports an unconditional gender pay gap for Denmark of 11.8% in 2010.5 Thus, already before
emigration in most couples the male partner earned more than the female and this gap is likely
to increase abroad, in particular in destination countries with wider income differences. Income
differences in the US and non-Western countries are larger than income differences in Australia,
Canada, New Zealand and Western Europe; see Grogger and Hanson (2010) and Klugman (2011).
Therefore, Hypothesis 4 can be tested by comparing female labor force participation rates in the
US with female labor force participation rates in other Western countries.
5The unconditional gender pay gap is not to be interpreted as a measure for discrimination of women. It is thejoint effect of differences in qualifications, career choices and any remaining discrimination. Time allocation whichmaximizes family resources for consumption depends on the unconditional pay gap.
11

Borjas (1987) argues that emigrants from a country with a relatively narrow income distribution
such as Denmark are selected from the upper end of that distribution because they are more likely
to gain abroad compared to those at the lower end. Grogger and Hanson (2010) find that migrants
self-select and sort into destination countries according to their returns to education. Borjas et
al. (2015) show that Danes emigrating to other Nordic countries are not as strongly self-selected
in terms of their earnings as Danes emigrating to the rest of the world. In the family context,
Junge et al. (2014) find that emigrant couples from Denmark are strongly positively selected on
the primary earner’s income. They show that the self-selection of couples into migration is more
responsive to the primary earner’s income and less responsive to the secondary earner’s income
than the self-selection of singles with respect to their income.
An increase in earnings differentials between the partners in the country of residence might make
it optimal to switch from a dual-earner to a single-earner model (implying typically a male bread-
winner). Therefore, we expect labor force participation of tied movers to be highest in Nordic
countries and lowest in the US and non-Western countries, with other Western countries having
rates in between. A competing hypothesis could be that couples with a certain preference for
division of labor, irrespective of economic incentives, self-select into particular destinations. A
further alternative hypothesis unrelated to our model would link differences in female labor force
participation among Danish emigrant women in different countries to differences in female labor
force participation in those countries. We compare predictions arising from our model with these
alternative hypotheses in section 5.
Moreover, couples with children might not be able to find suitable and affordable child care oppor-
tunities abroad. If a couple has to take care of its children at home, the parent doing so, typically
the mother, has less time available in the labor market. The threshold for female labor force partic-
ipation increases and the female partner is more likely not to work. On the other hand, if child care
is bought on the market the female is more likely to work. According to the presented theory the
decision whether or not to purchase child care services depends on their price relative to the wage
rate of the partner who specializes in home production. In Denmark and other Nordic countries,
child care services are heavily subsidized and comparatively cheap. This allows both partners to
combine work and family. For Sweden, Angelov et al. (2016) show that labor force participation
rates of mothers are high, even though after parenthood the pay gap between partners increases
among approximately 80% of households. In many other countries, child care is less easily available
12

and more costly than in Denmark.6 Our prior is that female labor force participation decreases
abroad if the couple has children, in particular for couples with children below school age, and that
this relationship is less strong for the Nordic countries.
Although we presented our model in a unitary framework, it would be straightforward to extend
it to a collective framework. Instead of maximizing household utility function, we would write
the two partners’ utility functions separately. When the household resource allocation is Pareto
efficient, the bargaining outcome is as if the household would maximize the sum of the two part-
ners’ utility functions, weighted to reflect their relative bargaining power (Chiappori, 1988; Apps
and Rees, 1988). Cherchye et al. (2012) extended the model to account for more than one do-
mestic good (such as parental time and household activities such as cleaning), and brought the
model to data. We use the simpler unitary model as our data does not allow testing the richer
collective model. As Cherchye et al. (2012), we separate between time spent on child care and
other household production, but our setting is simpler as we take the time required for child care
as exogenous and do not model leisure choice. Instead, we allow child care to be produced either
inside the household, or bought from the market, and show that the effects of time required for
child care on female labor supply depend mainly on whether the child care cost is more or less
than the female wage rate. As a result, female labor force participation is expected to be much
lower among couples requiring child care in countries with more expensive child care, but not in
the Nordic countries where public day care centers are available and affordable for most parents.
3 Data
We study emigration of couples using Danish administrative data which we link with own survey
data. A first part of our analysis draws on full population administrative register data for migrants
and non-migrants. Our main administrative data sources are the population register, education
register, and migration register. Data from various administrative sources are combined using
an anonymized social security number. By law, all residents in Denmark have to have a social
security number which is necessary in everyday life, including opening a bank account, receiving
wages and salaries or social assistance, visiting doctor or being registered at school. Using the
social security number as identifier we link information from the different sources and generate a6Previous literature has shown that the quality, availability and affordability of child care services has a consid-
erable impact on couples’ labor supply decisions. For example, Herbst (forthcoming) shows that receiving child caresubsidies increased employment of mothers in the US.
13

data set of couples with male and female partners cohabiting at the same address in a given year
and pool the data for all years together.7 Danish residents are obliged by law to report emigration
to the authorities in case they stay abroad for more than six months. Additionally, Danish tax
laws provide incentives for migrants to register when they emigrate. From the migration regis-
ter, we know the date of migration for each individual and the corresponding country of destination.
We consider emigration events between 1982 and 2002 and merge migration register information
for each individual to the other administrative data from the year before. We define that a couple
emigrates if both partners leave Denmark according to the administrative data within the same
year to the same destination country. We restrict our sample to partners who are between 18 and
55 in the year of emigration, and are both Danish citizens, born in Denmark. The reason for this
restriction is that in international couples, emigration from Denmark might imply returning to the
home country of one partner, making a migration decision qualitatively different. Our analysis re-
vealed that results on the subsample of individuals with a foreign partner are qualitatively similar
but statistically weaker and thus will not be reported here. After the mentioned restrictions, we
obtain an overall sample of 16,490,505 couple-year observations for the given years in Denmark, and
5,649 couples with both partners having emigrated within the same year to the same destination
country and neither partner having returned to Denmark during the subsequent 5 years (Table
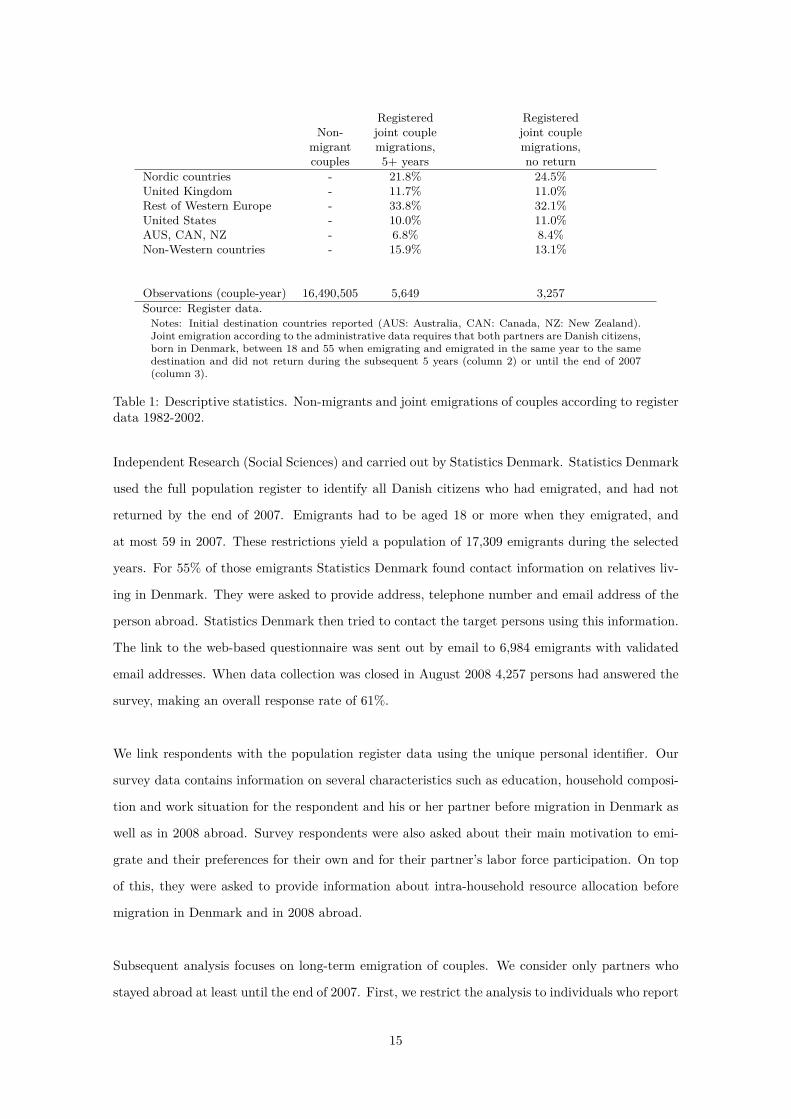
1). Among 3,257 of these emigrant couples neither partner returned until the end of 2007. Most
of these couples (86.9%) emigrated to another Western country. A clear majority migrated to a
Western European country, including the other Nordic countries (24.5%) and the UK (11.0%) as
major destinations. 11.0% of couples having not returned by the end of 2007 migrated to the US,
and 8.4% to Australia, Canada or New Zealand. The destination country shares do not differ much
between couples having stayed at least 5 years abroad and those having not returned until the end
of 2007. Our analysis excludes couples migrating to Greenland or the Faroe Islands because these
are autonomous territories of Denmark.
To study motivations to emigrate as well as the emigrant couples’ labor force participation abroad
we draw on unique survey data. The survey was conducted in 2008 among emigrants who had left
Denmark in 1987, 1988, 1992, 1993, 1997, 1998, 2001 or 2002, and had not returned by the end
of 2007. It was planned by Munk and Poutvaara within the project "Danes Abroad: Economic
and Social Motivations for Emigration and Return Migration", financed by the Danish Council for7Both married and cohabiting couples are included. Cohabitation before or instead of marriage is a common
phenomenon in the Scandinavian countries (Kiernan, 2004).
14
Registered RegisteredNon- joint couple joint couple
migrant migrations, migrations,couples 5+ years no return
Nordic countries - 21.8% 24.5%United Kingdom - 11.7% 11.0%Rest of Western Europe - 33.8% 32.1%United States - 10.0% 11.0%AUS, CAN, NZ - 6.8% 8.4%Non-Western countries - 15.9% 13.1%
Observations (couple-year) 16,490,505 5,649 3,257Source: Register data.Notes: Initial destination countries reported (AUS: Australia, CAN: Canada, NZ: New Zealand).Joint emigration according to the administrative data requires that both partners are Danish citizens,born in Denmark, between 18 and 55 when emigrating and emigrated in the same year to the samedestination and did not return during the subsequent 5 years (column 2) or until the end of 2007(column 3).
Table 1: Descriptive statistics. Non-migrants and joint emigrations of couples according to registerdata 1982-2002.
Independent Research (Social Sciences) and carried out by Statistics Denmark. Statistics Denmark
used the full population register to identify all Danish citizens who had emigrated, and had not
returned by the end of 2007. Emigrants had to be aged 18 or more when they emigrated, and
at most 59 in 2007. These restrictions yield a population of 17,309 emigrants during the selected
years. For 55% of those emigrants Statistics Denmark found contact information on relatives liv-
ing in Denmark. They were asked to provide address, telephone number and email address of the
person abroad. Statistics Denmark then tried to contact the target persons using this information.
The link to the web-based questionnaire was sent out by email to 6,984 emigrants with validated
email addresses. When data collection was closed in August 2008 4,257 persons had answered the
survey, making an overall response rate of 61%.
We link respondents with the population register data using the unique personal identifier. Our
survey data contains information on several characteristics such as education, household composi-
tion and work situation for the respondent and his or her partner before migration in Denmark as
well as in 2008 abroad. Survey respondents were also asked about their main motivation to emi-
grate and their preferences for their own and for their partner’s labor force participation. On top
of this, they were asked to provide information about intra-household resource allocation before
migration in Denmark and in 2008 abroad.
Subsequent analysis focuses on long-term emigration of couples. We consider only partners who
stayed abroad at least until the end of 2007. First, we restrict the analysis to individuals who report
15

to have emigrated with their partner and whose partner is a Danish citizen, born in Denmark. We
also require that the partners lived together in Denmark. In our survey 632 respondents fulfill these
restrictions. Using the administrative migration register we are able to construct the population
of individuals who emigrated with their partner to the same destination country during the same
years as those considered for the survey. Like for the partners in the survey we require that both
partners are Danes, born in Denmark and did not return until the end of 2007. The administrative
data yields an overall sample of 1250 couples in which partners were at least 18 when emigrating
and at most 59 in 2007. The descriptive statistics for migrations from the administrative data and
our survey are reported in columns 1 and 2 of Table 2. Table 2 shows the distribution of initial
destinations and emigration years for the two samples.
Registered Survey respondentsjoint couple migrations, joint emigration,
no return no returnNordic countries 25.8% 23.4%United Kingdom 10.6% 13.1%Rest of Western Europe 29.7% 30.2%United States 11.0% 14.1%AUS, CAN, NZ 7.7% 5.1%Non-Western countries 15.2% 14.1%
1987/88 13.3% 9.7%1992/93 11.8% 14.6%1997/98 23.4% 30.2%2001/02 51.5% 45.5%
Observations 1,250 632Sources: Survey and register data.Notes: Initial destination countries and emigration years reported (AUS: Australia, CAN: Canada,NZ: New Zealand). Joint emigration according to the administrative data requires that both partnersare Danish citizens, born in Denmark, at least 18 when emigrating and at most 59 in 2007 andemigrated in the same year to the same destination and did not return until the end of 2007.According to survey data both partners are Danish citizens, born in Denmark, the respondent is atleast 18 when emigrating and at most 59 in 2007 and reported to have migrated together with thepartner.
Table 2: Descriptive statistics. Joint emigrations of couples in register data and survey.
Data indicates that a slightly lower share of survey respondents emigrated in 1987/88 compared
with the emigrations in the administrative registers. Overall, the shares of migrant couples having
emigrated in the different year-pairs is not very different between the two columns. The same holds
for migration to different destination countries.8
Our final sample obeying the above restrictions consists of 522 respondents and their partners8To account for a potential bias in our results due to sampling design or non-response in the survey we also run
our main analysis for robustness with a weighted sample which is explained in more detail in Appendix C.
16

Male respondents Female respondents All respondentsLow power couples 16.3% 16.6% 16.5%Female power couples 8.6% 11.9% 10.2%Male power couples 21.2% 17.4% 19.4%Power couples 53.9% 54.2% 54.0%
Nordic countries 17.5% 24.5% 20.9%United Kingdom 12.6% 13.4% 13.0%Rest of Western Europe 32.7% 30.8% 31.8%United States 15.6% 16.6% 16.1%AUS, CAN, NZ 7.4% 3.6% 5.6%Non-Western countries 14.1% 11.1% 12.6%
No children in DK 47.6% 47.8% 47.7%Youngest child 0-6 in DK 44.2% 44.7% 44.4%Youngest child 7+ in DK 8.2% 7.5% 7.9%
No children in 2008 20.5% 23.3% 21.8%Youngest child 0-6 in 2008 33.5% 32.4% 33.0%Youngest child 7+ in 2008 46.0% 44.3% 45.2%
Observations 269 253 522Source: Survey and register data.Note: Country of residence and all characteristics in 2008 according to survey data (DK: Denmark,AUS: Australia, CAN: Canada, NZ: New Zealand).
Table 3: Descriptive statistics for respondents having migrated with current partner.
who still live together in 2008 according to the survey data. The composition of this sample with
respect to various characteristics is reported in Table 3. We did not ask the partner’s gender in
the survey, but asked whether the respondent was either married or in a registered partnership or
cohabiting. We did not find any same-gender partnerships among our respondents according to the
linked administrative data. Therefore subsequent analysis refers to partners as male and female.
Following Costa and Kahn (2000) we distinguish different "power" types of couples reflecting the
partners’ levels of education. In power couples both partners have at least college education. In
male and female power couples, only one partner holds a college degree and in low power couples
neither partner has completed college education.9 With 54.0%, power couples are the biggest group
among the respondents while there are 19.4% male power couples and only 10.2% female power
couples. The fraction of 25 to 64 year olds in the Danish population with at least college degree was
24% in 2008 (Statistics Denmark 2009). Thus compared with the overall Danish population the
average level of education among our respondents is high. This is in line with results from Borjas
et al. (2015) who find that emigrants from Denmark are strongly positively self-selected according
to their pre-migration education. Junge et al. (2014) also show that power couples are more likely
to emigrate from Denmark. Table 3 reports the country of residence of the respondents in 2008.
A large fraction of respondents in our sample (20.9%) live in one of the other Nordic countries,9We define college degree as having at least medium tertiary education; however, our results are robust to using
university bachelor’s degree as cutoff.
17

Sweden, Norway, Finland or Iceland. 16.1% live in the US, and 13.0% in the UK. In total 65.7%
percent of the respondents report that they live in another Western European country.10 52.3% of
respondents had children in the household before emigration, 44.4% with the youngest child below
school age and only 7.9% with the youngest child aged seven or older. In 2008, 78.2% have children
in the household, including 33.0% with children below school age and 45.2% with the youngest
child aged seven or older. Characteristics presented in Table 3 do not reveal any response bias
for whether the survey respondent was male or female, with the exception that there are slightly
more female than male respondents in other Nordic destination countries. At the 5% significance
level, this is the only statistically significant difference among the reported characteristics in Table
3. Using the identifier for cohabiting or married partners from the administrative population data
we are able to identify 60 couples in which both partners answered the survey. Our results are ro-
bust to excluding either the female or the male respondents among these couples from the analysis.
4 Big Picture
4.1 Labor Force Participation and Self-Selection into Emigration
As dual-earner couples face a potentially difficult tradeoff in whose career to prioritize (Mincer
1978; Frank 1978), there are strong reasons to expect that single-earner couples are more likely
to emigrate, in general. Furthermore, already Tiebout (1956) suggested that different policies
might be important determinants of choices on where to live. In Denmark and other Nordic coun-
tries, generous provision of child care services makes it easier for couples to pursue a dual-earner
model. High taxes at the individual level and relatively egalitarian wage structure also promote
the dual-earner model, making it difficult to make the ends meet in families with a single earner.
Therefore, it could be that couples preferring a traditional male breadwinner model would self-
select into emigration into countries with less egalitarian wage structure and less generous child
care services. Together, these insights from labor economics and public economics suggest a sim-
ilar pattern: couples in which both partners work should be less likely to emigrate, especially
outside other Nordic countries. To test this prediction empirically, we use the full population data
comparing labor force participation between couples that emigrate and those that stay in Denmark.
10There are some cases for which the initial emigration country differs from the country of residence in 2008 becausecouples migrated onwards to another country. Due to small numbers of observations in the survey data subsequentanalysis groups together other Western destination countries apart from the US and the Nordic countries in onecategory. We show in Appendix B that the findings we describe later do not differ much between the destinationgroups Australia, Canada and New Zealand, the UK and other Western European countries.
18
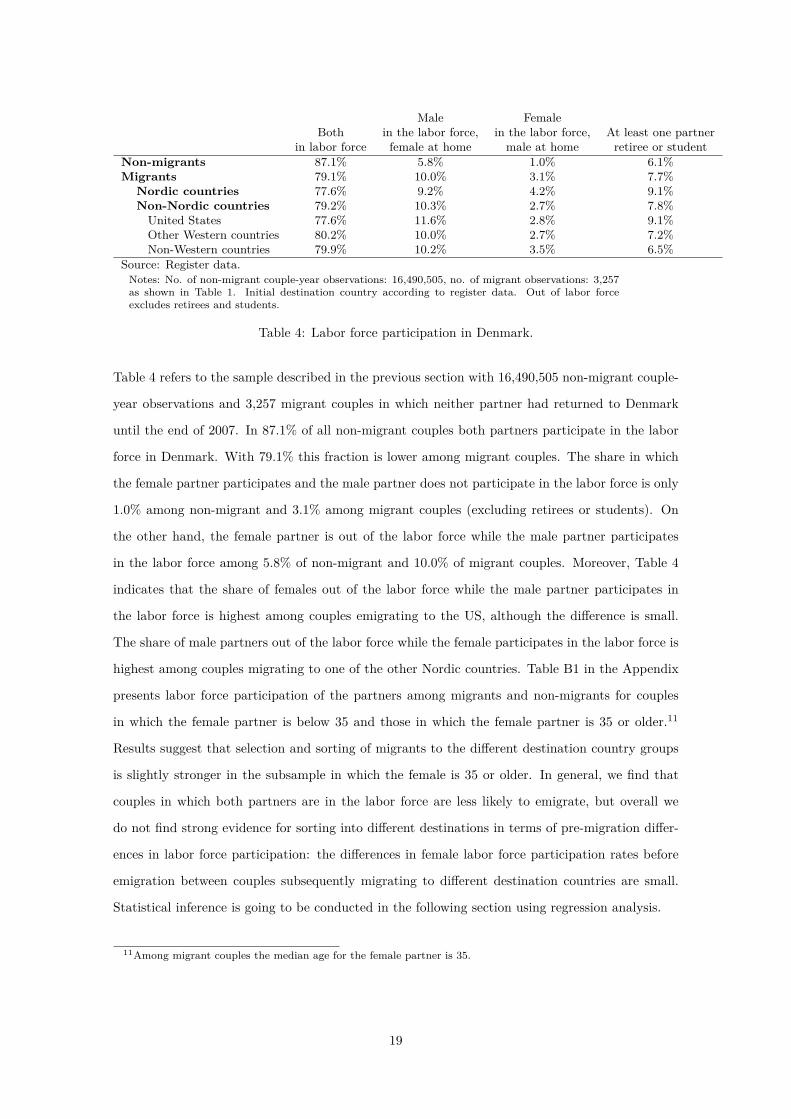
Male FemaleBoth in the labor force, in the labor force, At least one partner
in labor force female at home male at home retiree or studentNon-migrants 87.1% 5.8% 1.0% 6.1%Migrants 79.1% 10.0% 3.1% 7.7%
Nordic countries 77.6% 9.2% 4.2% 9.1%Non-Nordic countries 79.2% 10.3% 2.7% 7.8%United States 77.6% 11.6% 2.8% 9.1%Other Western countries 80.2% 10.0% 2.7% 7.2%Non-Western countries 79.9% 10.2% 3.5% 6.5%
Source: Register data.Notes: No. of non-migrant couple-year observations: 16,490,505, no. of migrant observations: 3,257as shown in Table 1. Initial destination country according to register data. Out of labor forceexcludes retirees and students.
Table 4: Labor force participation in Denmark.
Table 4 refers to the sample described in the previous section with 16,490,505 non-migrant couple-
year observations and 3,257 migrant couples in which neither partner had returned to Denmark
until the end of 2007. In 87.1% of all non-migrant couples both partners participate in the labor
force in Denmark. With 79.1% this fraction is lower among migrant couples. The share in which
the female partner participates and the male partner does not participate in the labor force is only
1.0% among non-migrant and 3.1% among migrant couples (excluding retirees or students). On
the other hand, the female partner is out of the labor force while the male partner participates
in the labor force among 5.8% of non-migrant and 10.0% of migrant couples. Moreover, Table 4
indicates that the share of females out of the labor force while the male partner participates in
the labor force is highest among couples emigrating to the US, although the difference is small.
The share of male partners out of the labor force while the female participates in the labor force is
highest among couples migrating to one of the other Nordic countries. Table B1 in the Appendix
presents labor force participation of the partners among migrants and non-migrants for couples
in which the female partner is below 35 and those in which the female partner is 35 or older.11
Results suggest that selection and sorting of migrants to the different destination country groups
is slightly stronger in the subsample in which the female is 35 or older. In general, we find that
couples in which both partners are in the labor force are less likely to emigrate, but overall we
do not find strong evidence for sorting into different destinations in terms of pre-migration differ-
ences in labor force participation: the differences in female labor force participation rates before
emigration between couples subsequently migrating to different destination countries are small.
Statistical inference is going to be conducted in the following section using regression analysis.
11Among migrant couples the median age for the female partner is 35.
19

4.2 Main Motivation to Emigrate
Our survey provides information about the respondents’ main motivation to emigrate. Table 5
presents information separately for men and women who emigrated with a Danish partner and
live together abroad in 2008. For all residence country groups, own work was the most important
motivation to emigrate for a clear majority of male partners. The majority of female partners in
all non-Nordic countries migrated due to family reasons. Work reasons dominate among male and
family reasons among female partners, especially among those in the US and in non-Western coun-
tries. Among female partners who live in other Nordic countries, about one third emigrated for
work, almost one third for family and a little more than one third for other reasons, such as studies.
Other Non-Nordic United Western Western
countries States countries countries TotalMale respondentsOwn work 66.0% 81.0% 71.1% 92.1% 74.7%Family 10.6% 0.0% 7.8% 0.0% 6.0%Other reasons 23.4% 19.0% 21.1% 7.9% 19.3%Female respondentsOwn work 33.9% 11.9% 20.7% 14.2% 21.7%Family 30.7% 76.2% 52.9% 67.9% 53.0%Other reasons 35.4% 11.9% 26.4% 17.9% 25.3%Source: Survey data.Note: No. of observations: 269 male and 253 female respondents. Distribu-tion according to destinations as shown in Table 3.
Table 5: Main motivations to emigrate.
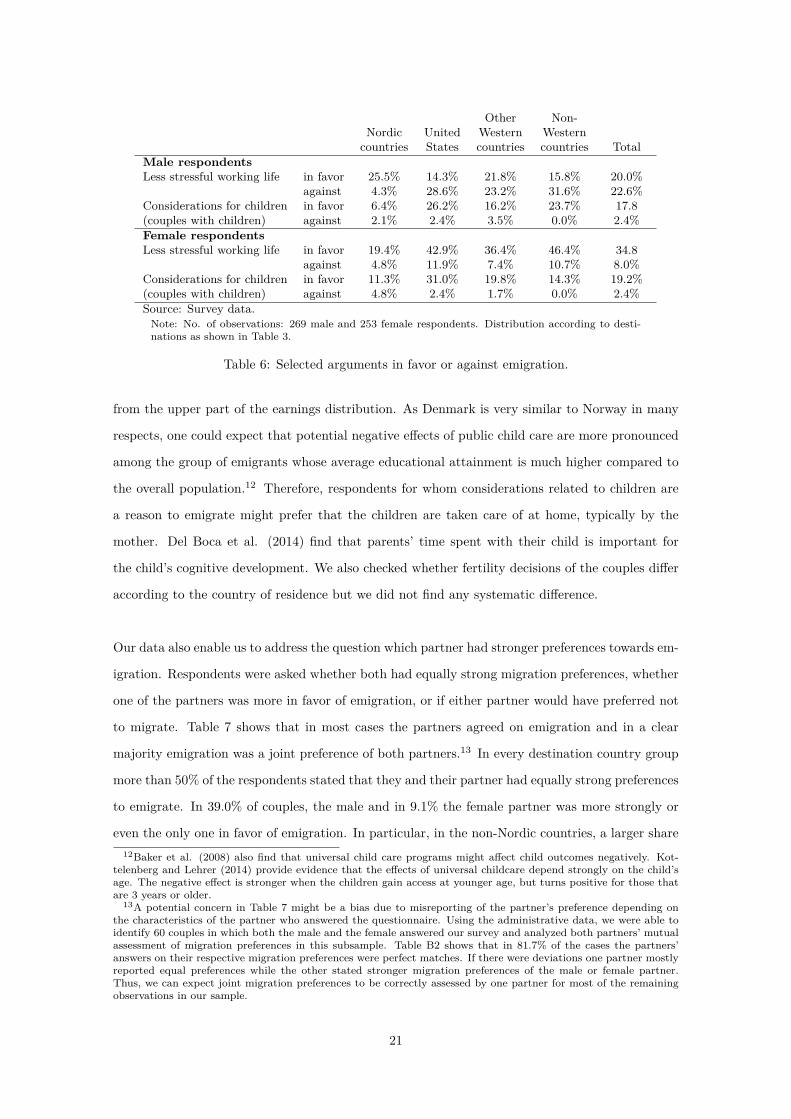
Table 6 presents evaluations of further factors which had an impact on the decision to emigrate.
Two out of five female partners living outside Nordic countries viewed a less stressful working life
as an important or very important reason to emigrate, and one in ten as an argument for staying in
Denmark. Among male partners migrating outside other Nordic countries, a less stressful working
life was more often an argument for staying in Denmark. Both males and females living with their
partner in one of the other Nordic countries view a less stressful working life more often as an
argument for emigration.
Furthermore, the distribution of preferences in Table 6 suggests that most parents viewed consid-
erations related to their children to be neither in favor nor against emigration, but there is also a
significant minority which saw considerations related to children as an important or very impor-
tant reason to emigrate. This is most pronounced among parents migrating to the US. Havnes and
Mogstad (2015) show for Norway that universal public child care is most beneficial for children
from disadvantaged family backgrounds. They find negative effects on child outcomes for families
20
Other Non-Nordic United Western Western
countries States countries countries TotalMale respondentsLess stressful working life in favor 25.5% 14.3% 21.8% 15.8% 20.0%
against 4.3% 28.6% 23.2% 31.6% 22.6%Considerations for children in favor 6.4% 26.2% 16.2% 23.7% 17.8(couples with children) against 2.1% 2.4% 3.5% 0.0% 2.4%Female respondentsLess stressful working life in favor 19.4% 42.9% 36.4% 46.4% 34.8
against 4.8% 11.9% 7.4% 10.7% 8.0%Considerations for children in favor 11.3% 31.0% 19.8% 14.3% 19.2%(couples with children) against 4.8% 2.4% 1.7% 0.0% 2.4%Source: Survey data.Note: No. of observations: 269 male and 253 female respondents. Distribution according to desti-nations as shown in Table 3.
Table 6: Selected arguments in favor or against emigration.
from the upper part of the earnings distribution. As Denmark is very similar to Norway in many
respects, one could expect that potential negative effects of public child care are more pronounced
among the group of emigrants whose average educational attainment is much higher compared to
the overall population.12 Therefore, respondents for whom considerations related to children are
a reason to emigrate might prefer that the children are taken care of at home, typically by the
mother. Del Boca et al. (2014) find that parents’ time spent with their child is important for
the child’s cognitive development. We also checked whether fertility decisions of the couples differ
according to the country of residence but we did not find any systematic difference.
Our data also enable us to address the question which partner had stronger preferences towards em-
igration. Respondents were asked whether both had equally strong migration preferences, whether
one of the partners was more in favor of emigration, or if either partner would have preferred not
to migrate. Table 7 shows that in most cases the partners agreed on emigration and in a clear
majority emigration was a joint preference of both partners.13 In every destination country group
more than 50% of the respondents stated that they and their partner had equally strong preferences
to emigrate. In 39.0% of couples, the male and in 9.1% the female partner was more strongly or
even the only one in favor of emigration. In particular, in the non-Nordic countries, a larger share12Baker et al. (2008) also find that universal child care programs might affect child outcomes negatively. Kot-
telenberg and Lehrer (2014) provide evidence that the effects of universal childcare depend strongly on the child’sage. The negative effect is stronger when the children gain access at younger age, but turns positive for those thatare 3 years or older.
13A potential concern in Table 7 might be a bias due to misreporting of the partner’s preference depending onthe characteristics of the partner who answered the questionnaire. Using the administrative data, we were able toidentify 60 couples in which both the male and the female answered our survey and analyzed both partners’ mutualassessment of migration preferences in this subsample. Table B2 shows that in 81.7% of the cases the partners’answers on their respective migration preferences were perfect matches. If there were deviations one partner mostlyreported equal preferences while the other stated stronger migration preferences of the male or female partner.Thus, we can expect joint migration preferences to be correctly assessed by one partner for most of the remainingobservations in our sample.
21

of males had stronger emigration preferences reflecting migration due to male job opportunities as
described above. The share of stronger female preferences towards emigration was highest among
couples in the Nordic countries. If there was disagreement concerning the emigration decision it
was mostly the female partner who disagreed: with 11.0% this share is highest among couples
having emigrated to the US.
Other Non-Nordic United Western Western
countries States countries countries TotalEqual preferences 53.2% 51.2% 51.9% 51.5% 52.0%Stronger male preference 27.5% 34.2% 34.4% 31.8% 32.6%Stronger female preference 13.8% 3.7% 6.9% 12.1% 8.5%Female against emigration 4.6% 11.0% 6.1% 4.6% 6.4%Male against emigration 0.9% 0.0% 0.8% 0.0% 0.6%Source: Survey data.Note: No. of observations: 522 respondents. Distribution according to destinations as shownin Table 3.
Table 7: Partners’ agreement or disagreement on emigration.
Overall, Tables 5 to 7 show that migration was a joint preference of both partners for most of the
respondents, even though the migration motives differ: males migrated mainly for job opportunities
and females for family reasons.
4.3 Actual and Preferred Labor Force Participation
Table 8 shows that the heterogeneity in migration motives is reflected strongly in differences in
female labor force participation at different destinations. However, in Denmark the partners’ labor
force participation rates before migration do not differ much between couples living subsequently
in different countries.14 Overall, in only 3.4% of the couples the female partner stayed at home
while the male partner was in the labor force. There was no male partner who stayed at home while
the female was in the labor force. We observe substantially lower female labor force participation
abroad: in 28.2% of the couples the female partner stays at home and the male partner participates
in the labor force. On the other hand, the share of couples abroad in which the female works and
the male stays at home is only 1.0%.
Low female labor force participation abroad is most pronounced among male power couples. This
is in line with Hypothesis 1 from our model. The data reveal substantial differences in labor force14We consider a partner as being in the labor force at a given time in case of employment, self-employment or
unemployment. Couples with at least one student or retiree are reported in a separate category. There are 13.4%of couples with at least one student or retiree before emigration. Apart from one retiree in our sample this share isdue to studies before migration.
22

Male in the Female in theBoth in the labor force, labor force, At least one partnerlabor force female at home male at home retiree or student
In Denmark 83.1% 3.4% 0.0% 13.4%Nordic countries 78.0% 4.6% 0.0% 17.4%Non-Nordic countries 84.5% 3.2% 0.0% 12.4%United States 85.7% 4.8% 0.0% 9.5%Other Western countries 84.4% 2.7% 0.0% 12.9%Non-Western countries 83.3% 3.1% 0.0% 13.6%
Abroad in 2008 66.3% 28.2% 1.0% 4.6%Low power couples 69.8% 24.4% 3.5% 2.3%Female power couples 69.8% 18.9% 3.8% 7.5%Male power couples 50.5% 43.6% 0.0% 5.9%Power couples 70.2% 25.5% 0.0% 4.3%
Nordic countries 87.2% 5.5% 1.8% 5.5%Non-Nordic countries 60.8% 34.1% 0.7% 4.4%United States 48.8% 47.6% 0.0% 3.6%Other Western countries 67.7% 27.0% 0.8% 4.6%Non-Western countries 48.5% 45.5% 1.5% 4.6%
No children in 2008 79.8% 12.3% 1.8% 6.1%Youngest child 0-6 in 2008 57.0% 39.5% 0.6% 2.9%Youngest child 7+ in 2008 66.5% 27.5% 0.9% 5.1%
Sources: Survey data.Note: No. of observations as shown in Table 3.
Table 8: Percentage shares for actual labor force participation.
Male in the Female in theBoth in the labor force, labor force, Bothlabor force female at home male at home at home No answer
All 62.1 27.6 1.1 1.7 7.5Nordic countries 80.7% 6.3% 1.8% 2.8% 8.2%Non-Nordic countries 57.1% 33.2% 1.0% 1.5% 7.3%United States 40.5% 52.4% 1.2% 0.0% 6.0%Other Western countries 62.7% 28.1% 0.8% 2.3% 6.1%Non-Western countries 56.1% 28.8% 1.5% 0.0% 13.6%
Source: Survey data.Note: No. of observations as shown in Table 3.
Table 9: Percentage shares for preferred labor force participation.
23

participation in 2008 depending on the country of residence. Female labor force participation
rates are particularly low and decreased dramatically among couples having migrated to the US
and to non-Western countries; in 47.6% of the couples in the US and in 45.5% of the couples
in the non-Western countries the female stays out of the labor force while the male is in the la-
bor force. In the Nordic countries, on the other hand, this is only the case among 5.5% of the
couples. The corresponding share is 27.0% in other Western countries. Appendix Table B3 illus-
trates that female labor force participation between the UK, other Western European countries
and Australia, Canada and New Zealand do not differ much. A high share of dual-earner couples
in Australia, Canada and New Zealand compared with the US highlights that low female labor
force participation is not driven by long distance migration. Table 8 additionally shows that fe-
male labor force participation decreased particularly among couples with children in the household.
Respondents were asked about their preferred division of labor in the household. In their answers
they could indicate who of the partners they prefer to participate in the labor market.15 Table
9 reveals that low female labor force participation in 2008 seems to reflect the respondents’ pref-
erences towards their own and their partners’ participation in the labor market. More than half
of the respondents who reside in the US state that they prefer the male partner to work while
the female partner stays at home. In the Nordic countries, on the other hand, most respondents
prefer a dual-earner model. The share of respondents preferring a dual-earner model in the other
Western countries is lower than among those in the other Nordic countries, but higher than among
those in the US and the non-Western countries.16
Table B5 also provides insights about how the partners organize their household economy and who
of them contributes more financially. We asked respondents whether they had separate economies
or joint economies before migration as well as at the time of the survey in 2008. In separate
economies the partners dispose of their own incomes and share only common expenses while cou-
ples with joint economies pool at least part of their individual incomes. Table B5 shows that, as
a result of reduced female labor force participation, couples increasingly pool their earnings: the
share of couples with separate economies declined from 12.6% before migration to 2.5% abroad,
and the share of couples in which the male brings in all the money increased from 3.1% to 24.3%.15To alleviate the concern that respondents gave self-serving answers concerning their partner’s preferred labor
force participation we analyze responses among the 60 couples in which both the male and the female answeredour survey. The responses are in most cases mutually consistent among both partners as Table B2 shows. Giventhis subsample of couples we are confident that the responses do not depend on which of the partners answered thesurvey. In a clear majority of cases, the partners agreed that either both should work, or that the male should workand female should stay at home.
16Appendix Table B4 also illustrates that female labor force participation preferences between the UK, otherWestern European countries and Australia, Canada and New Zealand do not differ much.
24

This pattern is particularly strong among couples having emigrated to the non-Nordic countries
indicating that intra-family income transfers compensating the female partner are more frequent.17
Table 9 shows that respondents in our sample have very different preferences for the partners’
division of labor in different countries of residence. These are very similar to the differences in
actually observed labor force participation. Moreover, analysis of administrative data showed that
female labor force participation rates were higher among non-migrant couples than for migrant
couples before emigration. Female labor force participation was lowest among couples migrating
to the US in the subsequent year. Even though, these findings provide evidence for self-selection
into destination countries according to a couple’s division of labor, the observed decrease in female
labor force participation rate is striking given that the dual-earner model was predominant in
Denmark also among couples that subsequently emigrated.
4.4 Tied Mover Effect
A: All couples. Nordic Other Western Non Westerncountries US countries countries
Male tied mover 100.0% 40.0% 94.0% 75.0%(26) (5) (36) (4)
No tied mover 97.0% 46.1% 75.8% 62.5%(33) (13) (62) (8)
Female tied mover 90.0% 54.5% 65.4% 51.9%(50) (66) (165) (54)
B: Couples withoutpre-school age children.Male tied mover 100.0% 100.0% 100.0% 100.0%
(14) (2) (25) (1)No tied mover 100.0% 57.1% 86.9% 80.0%
(21) (7) (46) (5)Female tied mover 90.9% 59.1% 66.4% 66.7%
(33) (44) (116) (36)Source: Survey data.Notes: Numbers of observation in parentheses.
Table 10: Tied mover status and female labor force participation rates in percent.
In Table 10, we compare female labor force participation rates according to whether the female
partner was a tied mover. We derive this information from the respondents’ main motivation to17A potential concern related to our results might be that household economy dynamics are driven by a time effect
which is unrelated to migration. Moreover, the composition of emigrant cohorts might have changed over time. Ourfindings could then be driven by a subgroup of households in our sample depending on the year of emigration.Table B6 and B7 address these issues and alleviate our concerns: we present separately the household economiesfor couples that emigrated before 1999 and in 2001/2002. We do not observe qualitative differences between thecohorts in terms of changes in household economies. For example, the decrease in the share of separate householdeconomies among the 2000/2001 emigration cohorts is almost as high as for the couples that left Denmark in earlieryears. Moreover, the composition of the cohorts in terms of countries of residence does not vary substantially overthe years of emigration either as Table B7 shows.
25

emigrate. In all country groups, except for the US, female labor force participation is lowest when
the female is a tied mover, i.e. male respondents reported that they migrated for their own job
opportunities and female respondents reported to have migrated mainly for family reasons. At the
same time, female labor force participation is highest among couples in which the male partner
is a tied mover. Among couples without pre-school age children, we find that in all considered
country groups all women whose male partner is a tied mover participate in the labor force. These
findings support Hypothesis 2 in our model. A tied mover’s partner should gain from migration,
suggesting that wage differences abroad are larger than in Denmark. This makes it more likely
that the tied mover (typically the female partner) works less, particularly if the couple migrates
to a country where the dispersion of income is larger. This leads to lower female labor force par-
ticipation, especially in the US and non-Western countries where incomes are more dispersed, and
less so in other Nordic countries.18 Table B8 in the Appendix shows that the pattern presented
for the aggregated group of other Western countries hold separately for the UK, Other Western
Europe and Australia, Canada and New Zealand.
5 Econometric Analysis
5.1 Self-Selection and Sorting of Emigrant Couples and the Dual-Earner
Model
We analyze self-selection and sorting of emigrant couples between 1982 and 2002. For each year
we include couples where both partners were at least 18 and at most 55. Table 11 presents OLS
regression estimates for the self-selection of emigrant couples from the population of married or
cohabiting Danes. We exclude those in which either partner is a retiree or student. The dependent
variable is equal to one if both partners emigrate in the same year to the same destination country.
We require that neither partner returns to Denmark in the following calendar year in columns 1
and 2. In columns 3 and 4 neither partner has returned to Denmark in the subsequent 5 years
after emigration and in columns 5 and 6 we require that both stayed abroad at least until the
end of 2007. We include dummy variables for different power types, the reference category being
low power couples in which neither partner holds a college degree. Male power couples and power
couples are most likely to emigrate. The probability to emigrate is lowest for low power couples.
Having children is associated with statistically significantly lower emigration propensities. We in-18According to Klugman (2011) the income GINI coefficient or the income quintile ratio 2000-2011 is lowest in
Nordic countries. For the US the income inequality measures are higher than for Western Europe and Australia,Canada and New Zealand.
26
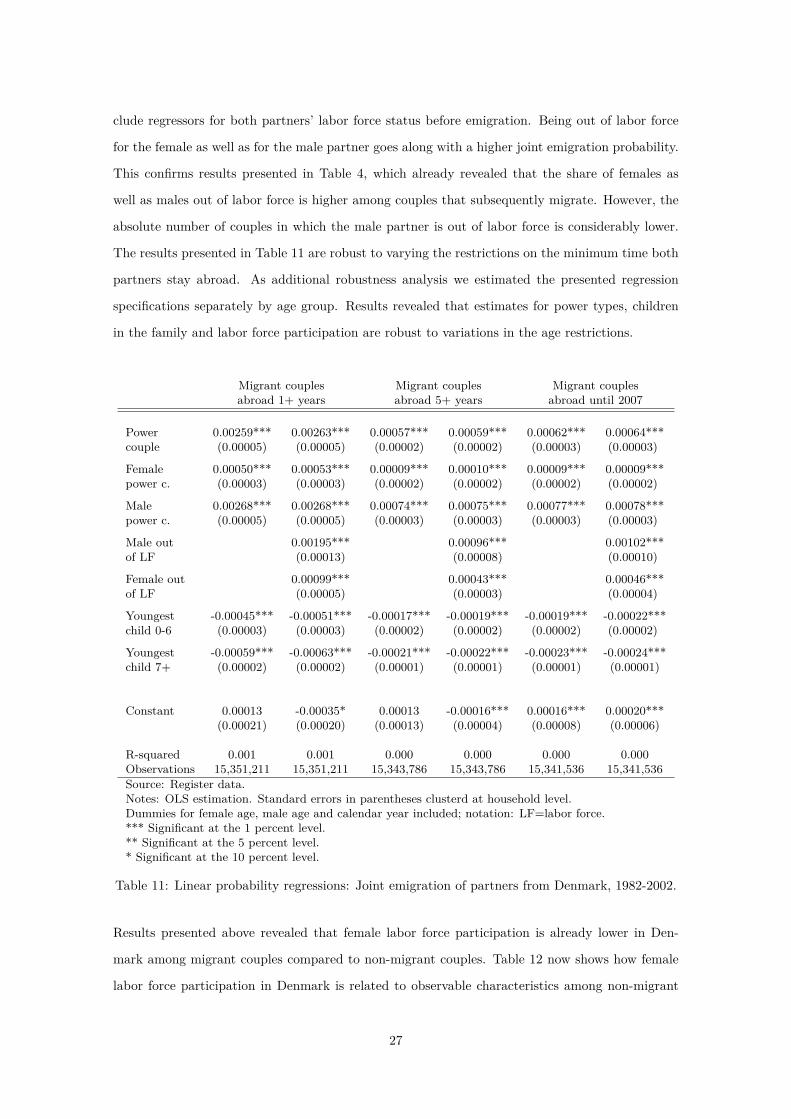
clude regressors for both partners’ labor force status before emigration. Being out of labor force
for the female as well as for the male partner goes along with a higher joint emigration probability.
This confirms results presented in Table 4, which already revealed that the share of females as
well as males out of labor force is higher among couples that subsequently migrate. However, the
absolute number of couples in which the male partner is out of labor force is considerably lower.
The results presented in Table 11 are robust to varying the restrictions on the minimum time both
partners stay abroad. As additional robustness analysis we estimated the presented regression
specifications separately by age group. Results revealed that estimates for power types, children
in the family and labor force participation are robust to variations in the age restrictions.
Migrant couples Migrant couples Migrant couplesabroad 1+ years abroad 5+ years abroad until 2007
Power 0.00259*** 0.00263*** 0.00057*** 0.00059*** 0.00062*** 0.00064***couple (0.00005) (0.00005) (0.00002) (0.00002) (0.00003) (0.00003)
Female 0.00050*** 0.00053*** 0.00009*** 0.00010*** 0.00009*** 0.00009***power c. (0.00003) (0.00003) (0.00002) (0.00002) (0.00002) (0.00002)
Male 0.00268*** 0.00268*** 0.00074*** 0.00075*** 0.00077*** 0.00078***power c. (0.00005) (0.00005) (0.00003) (0.00003) (0.00003) (0.00003)
Male out 0.00195*** 0.00096*** 0.00102***of LF (0.00013) (0.00008) (0.00010)
Female out 0.00099*** 0.00043*** 0.00046***of LF (0.00005) (0.00003) (0.00004)
Youngest -0.00045*** -0.00051*** -0.00017*** -0.00019*** -0.00019*** -0.00022***child 0-6 (0.00003) (0.00003) (0.00002) (0.00002) (0.00002) (0.00002)
Youngest -0.00059*** -0.00063*** -0.00021*** -0.00022*** -0.00023*** -0.00024***child 7+ (0.00002) (0.00002) (0.00001) (0.00001) (0.00001) (0.00001)
Constant 0.00013 -0.00035* 0.00013 -0.00016*** 0.00016*** 0.00020***(0.00021) (0.00020) (0.00013) (0.00004) (0.00008) (0.00006)
R-squared 0.001 0.001 0.000 0.000 0.000 0.000Observations 15,351,211 15,351,211 15,343,786 15,343,786 15,341,536 15,341,536Source: Register data.Notes: OLS estimation. Standard errors in parentheses clusterd at household level.Dummies for female age, male age and calendar year included; notation: LF=labor force.*** Significant at the 1 percent level.** Significant at the 5 percent level.* Significant at the 10 percent level.
Table 11: Linear probability regressions: Joint emigration of partners from Denmark, 1982-2002.
Results presented above revealed that female labor force participation is already lower in Den-
mark among migrant couples compared to non-migrant couples. Table 12 now shows how female
labor force participation in Denmark is related to observable characteristics among non-migrant
27

and migrant couples when estimating a linear probability model on the administrative data. We
restrict attention to female labor force participation as this is the relevant margin in our empirical
setting.19 We do not observe large differences between the coefficient estimates for the sample of
non-migrant couples and migrant couples with different minimum durations of stay abroad. We
include the couple’s power type (reference category: low power couples) and indicator variables for
children in the household as explanatory variables. Females in power couples and in female power
couples are more likely to participate in the labor market than females in low power couples. A
youngest child below the age of seven is associated with reduced female labor force participation.
However, the magnitude of the coefficient estimate suggests a reduction of female labor force par-
ticipation of only around 4 to 5% in case a couple has young children.
Migrant couples Migrant couples Migrant couplesNon-migrant couples abroad 1+ years abroad 5+ years abroad until 2007
Power couple 0.046*** 0.065*** 0.053*** 0.055***(0.000) (0.006) (0.012) (0.015)
Female power couple 0.044*** 0.042*** 0.050*** 0.046**(0.000) (0.008) (0.016) (0.021)
Male power couple -0.009*** -0.006 -0.025** -0.014(0.001) (0.006) (0.012) (0.015)
Youngest child 0-6 -0.048*** -0.055*** -0.053*** -0.054***(0.000) (0.006) (0.012) (0.015)
Youngest child 7+ -0.019*** -0.007 -0.004 -0.010(0.000) (0.008) (0.014) (0.018)
Constant 0.814*** 0.751*** 0.436*** 0.910***(0.002) (0.074) (0.161) (0.312)
R-squared 0.028 0.049 0.064 0.058Observations 15,338,599 15,982 5,090 2,937Source: Register data.Notes: OLS estimation. Standard errors in parentheses.Female age and year dummies included.*** Significant at the 1 percent level.** Significant at the 5 percent level.* Significant at the 10 percent level.
Table 12: Linear probability regressions: Female labor force participation in Denmark amongnon-migrant and migrant couples in 1982 - 2002.
Table 13 analyzes the sorting of migrant couples into destination countries with respect to female
labor force participation in Denmark. Again, we analyze separately migrant couples in which both
partners stay abroad more than one year, more than five years and for those in which neither part-
ner has returned until the end of 2007. The GINI coefficient for the migrants’ future destination
country indicates whether the dispersion of incomes in this country is small or large. The GINI19The analysis again excludes couples in which either partner is retiree or student. In all specifications we control
non-parametrically for calendar year and age of the female partner.
28

refers to inequality in disposable incomes on the individual level taken from the UN World Income
Inequality (WIID) database (2016) for the year 2008. We also include country group dummies
(reference category: other Western countries) in alternative specifications. Including the GINI
coefficient shows that female labor force participation in Denmark is lower among couples later
migrating to countries with a larger dispersion of income and staying abroad at least until the
end of 2007. These findings provide some evidence that couples sort into different destinations
according to their family model in Denmark. The coefficient estimate for the GINI is statistically
insignificant in the specification for emigrant couples staying at least one year as well as in the
specification for those staying at least five years abroad. When controlling for destination country
groups in the sample of migrant couples, results reveal that female labor force participation before
emigration is statistically significantly lower among couples migrating to the US.
Migrant couples Migrant couples Migrant couplesabroad 1+ years abroad 5+ years abroad until 2007
Power couple 0.060*** 0.067*** 0.051*** 0.055*** 0.054*** 0.059***(0.007) (0.006) (0.013) (0.012) (0.016) (0.015)
Female power couple 0.054*** 0.044*** 0.055*** 0.051*** 0.053** 0.047**(0.010) (0.008) (0.018) (0.017) (0.022) (0.021)
Male power couple -0.006 -0.006 -0.024* -0.022* -0.013 -0.008(0.007) (0.006) (0.013) (0.012) (0.016) (0.016)
Youngest child 0-6 -0.052*** -0.055*** -0.061*** -0.054*** -0.060*** -0.056***(0.007) (0.006) (0.012) (0.012) (0.016) (0.015)
Youngest child 7+ -0.014 -0.007 -0.016 -0.004 -0.018 -0.010(0.009) (0.008) (0.015) (0.014) (0.019) (0.018)
Gini 0.026 -0.135 -0.298**(0.049) (0.102) (0.129)
Nordic countries -0.010 -0.016 -0.004(0.007) (0.012) (0.014)
United States -0.010 -0.061*** -0.073***(0.008) (0.016) (0.019)
Non-Western countries -0.015*** -0.024* -0.016(0.006) (0.013) (0.019)
Constant 0.736*** 0.758*** 0.473*** 0.444*** 0.990*** 0.915***(0.073) (0.074) (0.164) (0.161) (0.315) (0.311)
R-squared 0.057 0.049 0.067 0.067 0.061 0.063Observations 12,423 15,982 4,492 5,090 2,669 2,937Source: Register data.Notes: OLS estimation. Standard errors in parentheses.Female age and year dummies included.*** Significant at the 1 percent level.** Significant at the 5 percent level.* Significant at the 10 percent level.
Table 13: Linear probability regressions: Female labor force participation in Denmark amongmigrant couples in 1982 - 2002.
29

5.2 Female Labor Force Participation Abroad
Female labor force participation among emigrant couples is considerably lower in 2008 compared to
before emigration. With our survey data we are able to analyze the determinants of lower female
labor force participation abroad in more detail and explicitly test the hypotheses derived from
the theoretical model against alternative explanatory channels. We estimate a linear probability
regression on the sample of survey respondents and their partners to analyze the determinants
for female labor force participation abroad.20 In Table 14, we include as baseline explanatory
variables the couple’s power type (reference category: low power couples) and indicator variables
for children in the household. We also include the GINI coefficient for the country of residence in
2008 as a regressor. In an alternative specification, we include country group dummies (reference
category: other Western countries) which additionally control for between-country variation in
language, culture and other factors which might be related to female labor force participation in
those countries. In all specifications female age dummies are included as control variables.21
Estimates in Table 14 show that female labor force participation is particularly low in male power
couples confirming Hypothesis 1 derived from our model. In Table B9 we additionally include a
variable for the female being tied mover which indicates whether the survey respondent stated
that the job of the male partner was the main motivation to emigrate. Among couples having
migrated mainly for male job opportunities, female labor force participation is particularly low.
This confirms Hypothesis 2 from our model. Furthermore, estimation results in Table 14 reveal
that the presence of children is negatively associated with female labor force participation. This
is especially the case if the youngest child is below the age of 7 which is in line with Hypothesis
3 from our model. The second column indicates that female labor force participation is lower in
countries with wider income differences, which confirms Hypothesis 4. Comparing the R-squared
measure between columns 1 and 2 indicates that differences in income inequality between desti-
nation countries explain a considerable part of the variation in female labor force participation.
Estimates for the country group dummies in column 3 suggest that female labor force participa-
tion in the Nordic countries is more likely than in the non-Nordic countries.22 In column 4 we
interact the Nordic country dummy with dummy variables for the youngest children below age
seven and for the youngest child aged seven or older. Results reveal that higher female labor force
participation among couples in the Nordic countries is driven by higher female labor force partici-20We exclude couples in which either partner is retiree or student in 2008.21We are not able to match register data information on age for all partners of the respondents. This is the reason
for a reduced number of observations compared to the analysis in section 4.22We do not include the GINI coefficient in these regressions as most of the variation in the GINI is between the
country groups rather than within them.
30
pation among the group in which the youngest child is below the age of seven. On the other hand,
there are strong negative effects of having young children on female labor force participation in the
non-Nordic countries. In Table B10 we also present results including the "Starting Well Index",
an index capturing the availability, affordability and quality of child care services in a subset of
countries (The Economist Intelligence Unit, 2012). Results reveal that a higher value of this index
is associated with higher female labor force participation which is also in line with our theory. The
effect of the GINI coefficient is robust to including the "Starting Well Index". In case a couple has
children the public provision of child care services provides incentives for labor market participa-
tion of both partners. Our model predicts that a lower price of child care would incentivize higher
female labor force participation. Moreover, couples emigrating to a country where the provision of
child care is low might be those preferring to spend more time with their children.
In Table B11 we additionally include an indicator of the work status of the female in Denmark
before migration. If the female worked before migration, we estimate a significantly higher prob-
ability for actual labor force participation abroad. The size and significance of most coefficient
estimates still remain unchanged.
Table 15 shows that actual labor force participation generally reflects the preferred division of
labor among the partners. In a similar framework to Table 14, we relate the explanatory variables
to an indicator of whether the respondent prefers that either both partners work or only the fe-
male partner works. In almost all cases this means a preference for both partners working. Most
coefficient estimates are similar in sign and size to the specifications in Table 14. The presence of
young children is negatively correlated with positive attitudes towards female labor force partici-
pation. Again, we observe for the non-Nordic countries that the presence of children is negatively
related to positive attitudes towards the female partner participating in the labor market. On the
other hand, among couples with the youngest child below the age of seven in the Nordic countries,
preferences for female labor force participation are statistically significantly higher than in the
non-Nordic countries.
Coefficient estimates for the GINI variable indicate that larger income differences in the country of
residence are associated with lower preferences towards the female partner being in the labor mar-
ket, as reflected in actual labor force participation outcomes. Estimation results for the explanatory
factors described above are in line with predictions from our theoretical model. Differences in child
care prices and in wage distribution can rationalize differences in preferences for female labor force
31

Power couple -0.011 -0.031 0.007 0.018(0.059) (0.059) (0.057) (0.058)
Female power couple 0.026 -0.005 -0.004 0.010(0.082) (0.082) (0.079) (0.079)
Male power couple -0.233*** -0.202*** -0.170** -0.162**(0.070) (0.071) (0.067) (0.067)
Youngest child 0-6 -0.229*** -0.191*** -0.186*** -0.254***(0.069) (0.067) (0.066) (0.075)
Youngest child 7+ -0.151** -0.133** -0.139** -0.178***(0.060) (0.059) (0.057) (0.064)
Gini -2.296***(0.400)
Nordic countries 0.215*** 0.070(0.053) (0.103)
United States -0.206*** -0.201***(0.056) (0.055)
Non-Western countries -0.143** -0.138**(0.063) (0.063)
Youngest child 0-6 * Nordic 0.246*(0.130)
Youngest child 7+ * Nordic 0.140(0.129)
Constant 0.747*** 1.448*** 0.669*** 0.727***(0.115) (0.165) (0.113) (0.119)
R-squared 0.180 0.242 0.262 0.268Observations 474 437 474 474Sources: Survey and register data.Notes: OLS estimation. Standard errors in parentheses.Female age dummies included.*** Significant at the 1 percent level.** Significant at the 5 percent level.* Significant at the 10 percent level.
Table 14: Linear probability regressions: Female labor force participation abroad in 2008.
32

Power couple 0.074 0.059 0.100 0.112*(0.064) (0.064) (0.062) (0.063)
Female power couple -0.035 -0.064 -0.045 -0.031(0.090) (0.091) (0.087) (0.088)
Male power couple -0.165** -0.174** -0.112 -0.103(0.077) (0.078) (0.075) (0.075)
Youngest child 0-6 -0.262*** -0.230*** -0.227*** -0.298***(0.074) (0.073) (0.072) (0.083)
Youngest child 7+ -0.234*** -0.205*** -0.217*** -0.257***(0.065) (0.065) (0.063) (0.071)
Gini -1.981***(0.428)
Nordic countries 0.178*** 0.039(0.058) (0.112)
United States -0.218*** -0.215***(0.060) (0.060)
Non-Western countries 0.015 0.018(0.070) (0.070)
Youngest child 0-6 * Nordic 0.248*(0.141)
Youngest child 7+ * Nordic 0.123(0.014)
Constant 1.003*** 1.613*** 0.934*** 0.991(0.121) (0.177) (0.120) (0.127)
R-squared 0.154 0.219 0.216 0.222Observations 440 408 440 440Sources: Survey and register data.Notes: OLS estimation. Standard errors in parentheses.Female age dummies included.*** Significant at the 1 percent level.** Significant at the 5 percent level.* Significant at the 10 percent level.
Table 15: Linear probability regressions: Preference for female labor force participation.
33

participation between the countries of residence. Child care programs in the Nordic countries are
far more generous compared to other countries. This could explain why having young children
does not seem to be a strong impediment to female labor force participation among couples living
in other Nordic countries and why preference towards female labor force participation among the
emigrant couples is higher in those countries. The provision of subsidies in the Nordic countries
lowers the price for child care services and increases incentives for female labor force participation.
The coefficient estimates for the Nordic country and the US dummy in Table 15 are similar in sign
and size as in Table 14. We interpret this as evidence that the differences in labor force participa-
tion reflect actual preferences and are to a lesser extent driven by legal work restrictions for family
migrants. The coefficient estimate for the non-Western country dummy indicates that actual labor
force participation of the female partner is lower than preferred labor force participation. This sug-
gests that other restrictions or the lack of employment opportunities for the female partner might
play a role in explaining low female labor force participation among couples in these countries.
We can show that our results as in Tables 14 and 15 are robust to weighting respondents with the
inverse probability for being in the sample given the target population of survey. We explain the
weighting procedure and present the corresponding results in Appendix C.
Fernández et al. (2004) find evidence for the US that wives of men whose mothers worked are
themselves significantly more likely to work. Along the same lines, Moen et al. (1997) provide
evidence that daughters’ and mothers’ gender role identities are closely related, including prefer-
ences towards the division of labor in the household. For Table 16, we take the second and the
third specification from Table 14 and Table 15 and add an additional regressor capturing labor
force participation of the mother of the respondent at the age of 12. The idea is, first, to test
whether preferences towards the division of labor are transmitted to the children. Columns 1 and
2 indicate that the respondent is slightly more likely to prefer a male breadwinner model if the
parents’ household economy was more traditional - after including the same covariates as in Table
15. Robustness analysis confirms that these results do not depend on whether the respondent
was male or female. However, when explaining actual female labor force participation abroad, the
coefficient estimate for labor force participation of the respondent’s mother becomes insignificant.
A potential alternative explanation for our findings is that labor force participation among females
in our sample converges systematically to the average female labor force participation rates in the
destination countries. MacPherson and Steward (1989) provide evidence on assimilation of female
34

Preference for Actualfemale labor force female labor force
participation participation
Power couple 0.056 0.099 -0.035 0.006(0.064) (0.062) (0.059) (0.057)
Female power couple -0.059 -0.039 -0.003 -0.003(0.091) (0.087) (0.082) (0.079)
Male power couple -0.170** -0.107 -0.201*** -0.170**(0.078) (0.075) (0.071) (0.067)
Youngest child 0-6 -0.238*** -0.235*** -0.195*** -0.187***(0.073) (0.072) (0.067) (0.066)
Youngest child 7+ -0.189*** -0.205*** -0.120** -0.135**(0.065) (0.063) (0.059) (0.058)
Gini -2.035*** -2.353***(0.428) (0.400)
Nordic countries 0.170*** 0.214***(0.058) (0.053)
United States -0.225*** -0.208***(0.060) (0.056)
Non-Western countries 0.017 -0.143**(0.070) (0.063)
Mother out of labor force -0.097* -0.091* -0.078 -0.024at respondent’s age 12 (0.052) (0.050) (0.048) (0.046)
Constant 1.670*** 0.973*** 1.498*** 0.679***(0.179) (0.122) (0.168) (0.114)
R-squared 0.226 0.222 0.247 0.263Observations 408 440 437 474Sources: Survey and register data.Notes: OLS estimation. Standard errors in parentheses.Female age dummies included.*** Significant at the 1 percent level.** Significant at the 5 percent level.* Significant at the 10 percent level.
Table 16: Linear probability regressions: Intergenerational transmission and female labor forceparticipation.
35

Non-NordicAll countries countries
Power couple -0.013 -0.031 0.021 -0.002(0.059) (0.059) (0.072) (0.076)
Female power couple 0.026 -0.0055 0.012 0.020(0.083) (0.082) (0.107) (0.113)
Male power couple -0.228*** -0.201*** -0.143* -0.146*(0.070) (0.071) (0.082) (0.086)
Youngest child 0-6 -0.229*** -0.190*** -0.242*** -0.217**(0.069) (0.068) (0.086) (0.089)
Youngest child 7+ -0.151** -0.134** -0.206*** -0.200***(0.060) (0.059) (0.072) (0.074)
Gini -2.306*** -1.472**(0.401) (0.624)
FLFP rate at destination 0.021 0.182 -0.688* -0.375(0.352) (0.401) (0.402) (0.535)
Constant 0.735*** 1.347*** 0.925*** 1.248***(0.235) (0.278) (0.273) (0.318)
R-squared 0.179 0.242 0.216 0.236Observations 473 437 372 336Sources: Survey data, register data, and ILO.Notes: OLS estimation. Robust standard errors in parentheses.Female labor force participation (FLFP) rate according to estimatesby International Labour Organization for 2008.*** Significant at the 1 percent level.** Significant at the 5 percent level.* Significant at the 10 percent level.
Table 17: Linear probability regressions: Actual female labor force participation of emigrants andfemale labor force participation rates in the country of residence.
36

labor force participation rates among immigrants in the US. Female labor force participation rates
among the native population are generally higher in the Nordic countries while they are lower in
other Western countries and the US (OECD, 2015). However, the differences of these rates be-
tween the considered country groups are considerably smaller compared to differences we observe
among the emigrant couples in our sample. Other research (e.g. Antecol (2000), Fernández and
Fogli (2009) and Blau et al. (2011)) has argued that cultural background has a lasting impact
on migrant families’ labor supply decisions. Female labor force participation tends to be higher
among families coming from countries with historically stronger female labor force attachment.
Couples in our sample have the same cultural background but are exposed to different prices and
institutional environments in the countries of residence.
In Table 17 we include female labor force participation rates in the country of residence to explain
female labor force participation in our sample abroad. Column 1 shows that the probability for
the female partner participating in the labor force seems to be higher when the female labor force
participation rate in the country of residence population is high. However, this relationship is
statistically insignificant and breaks down when excluding the Nordic countries from the sample:
then a higher female labor force participation rate in the country of residence is not anymore asso-
ciated with an increase in female labor force participation among the couples. Including the GINI
coefficient in the regressions in Table 17 increases the R-squared substantially suggesting that the
partners’ relative wages play an important role for female labor force participation as suggested
by our model. The alternative hypothesis that female labor force participation converges to the
prevailing rate in the country of residence fails to explain our findings.
Table B12 provides sensitivity analysis for the results with respect to the emigration years in our
data. We do not find differences between the results for couples having emigrated in the earlier
years 1987/88, 1992/93, 1997/98 compared with the later cohorts having emigrated in 2001/02.
This additionally confirms that our results do not seem to be driven by an assimilation process
towards average labor force participation rates in the destination countries.
6 Conclusion
Using administrative data we analyzed self-selection of Danish couples into emigration and sorting
across different destinations with respect to the partners’ pre-migration labor force participation.
37
Survey data on couples having emigrated permanently allowed us to gain insights into the partners’
motivations to emigrate and their labor force participation abroad. Despite Denmark being one of
the most gender-equal countries worldwide, we found big gender differences in main motivations
to emigrate and in female labor force participation abroad. Own work was the main reason to
emigrate for 74.7% of men and 21.7% of women, partner’s job or other family reasons for 6.0%
of men and 53.0% of women. Accordingly, Danish emigrant couples often adopt more traditional
gender roles in non-Nordic countries with a male breadwinner and the female staying at home. In
the US, the male works in almost all couples and the female in half of the couples. In the other
Western countries, both partners work in two thirds of couples, and the male works while the
female stays at home in one quarter of couples. The male stays at home and the female works in
less than one percent of couples that have emigrated and live in destinations outside other Nordic
countries.
Lower female labor force participation could reflect both demand and supply side effects. Potential
legal constraints or a lack of labor market opportunities could force the female partner out of the
labor force, but it could also be that lower female labor supply is an adjustment to wider wage
differences abroad. Furthermore there could be Tiebout sorting so that couples preferring a more
traditional male breadwinner model would be more likely to migrate outside the Nordic countries.
Our results suggest that both demand and supply side mechanisms are important. Demand side
restrictions appear to play a role especially in non-Western countries, where the share of couples in
which only the male works is considerably larger than the share of couples stating that they prefer
such a situation. In the Western countries, preferred and actual female labor force participation
are closely in line, suggesting the primacy of labor supply decisions. Our theoretical framework
illustrates the role of incentives in this context: wider income differences as well as higher prices for
child care can economically rationalize that the female partner reduces labor supply or stays out
of the labor force. The empirical findings for female labor force participation abroad confirmed the
hypotheses derived from our model. After migration female labor force participation is lower in
countries with wider income differences, such as the US. Reduced female labor force participation
in the US and non-Western countries is particularly evident among couples with pre-school age
children.
We also found evidence that couples self-selected into emigration according to their division of
labor in Denmark: despite the prevalence of the dual-earner model among couples before emi-
gration in Denmark, couples were more likely to emigrate in case one partner, in most cases the
38
female, had been out of the labor force. We found some evidence for sorting into destinations
according to pre-migration labor force participation patterns. Couples having emigrated to the
US had slightly more often adopted a male breadwinner model already before migration. These
pre-migration differences are rather small compared with the decline in female labor force partic-
ipation among the migrant couples outside the Nordic countries. Moreover, a significant fraction
of couples with children migrating outside the Nordic countries viewed considerations related to
children as a reason to emigrate, and very few as a reason against emigration. Among couples
migrating to other Nordic countries, very few viewed considerations related to children being ei-
ther in favor or against emigration. One possible explanation for this is that those parents who
prefer that one of them, most likely the mother, takes care of their children at home, would be
more likely to emigrate outside the Nordic countries. There they switch from the dual-earner
model to the male breadwinner model. This explanation is in line with the observation that the
presence of young children significantly reduces female labor force participation outside the Nordic
countries, while its effect is small and statistically insignificant in the other Nordic countries. In
the light of increasingly international competition for talent, this might reduce incentives for fe-
males to invest in their careers if they expect to accompany their partner as tied movers later in life.
39

References
Akerlof, G. A. and R. E. Kranton, Economics and identity. The Quarterly Journal of Economics,
115(3): 715-753, 2000.
Angelov, N., P. Johansson, and E. Lindahl, Parenthood and the gender gap in pay. Journal of
Labor Economics, 34(3): 545-579, 2016.
Antecol, H.: An examination of cross-country differences in the gender gap in labor force partic-
ipation rates. Labour Economics, 7(4): 409-426, 2000.
Apps, P. F. and R. Rees, Taxation and the household. Journal of Public Economics, 35(3):
355-369, 1988.
Baker, M., J. Gruber and K. Milligan, Universal child care, maternal labor supply, and family
well-being. Journal of Political Economy, 116(4): 709-745, 2008.
Becker, G. S., A theory of marriage: Part ii. Journal of Political Economy, 82(2): S11-S26, 1974.
Becker, G. S., A Treatise on the family. Enlarged edn. Harvard University Press, Cambridge,
1991.
Bertrand, M., New perspectives on gender, In Handbook of Labor Economics. O. Ashenfelter
and D. Card eds., 1545-1592, 2011.
Bertrand, M., E. Kamenica and J. Panet, Gender identity and relative income within households.
Quarterly Journal of Economics, 130(2): 571-614, 2015.
Blau, F. D., L. M. Kahn and K. L. Papps, Gender, source country characteristics, and labor
market assimilation among immigrants. The Review of Economics and Statistics, 93(1):
43-58, 2011.
Borjas, G. J., Self-Selection and the earnings of immigrants. American Economic Review, 77(4):
531-553, 1987.
Borjas, G. J. and B. Bratsberg, Who leaves? The outmigration of the foreign-born. Review of
Economics and Statistics, 78(1): 165-176, 1996.
Borjas, G. J. and S.G. Bronars, Immigration and the family. Journal of Labor Economics, 9(2):
123-148, 1991.
40

Borjas, G. J., I. Kauppinen and P. Poutvaara, Self-selection of emigrants: Theory and evidence
on stochastic dominance in observable and unobservable characteristics. CESifo WP NO.
5567, 2015.
Browning, M., P.-A. Chiappori and Y. Weiss, Economics of the family. Cambridge: Cambridge
Univ. Press, 2014.
Cherchye, L., B. De Rock and F. Vermeulen, Married with children: A collective labor sup-
ply model with detailed time use and intrahousehold expenditure information. American
Economic Review, 102(7): 3377-3405, 2012.
Chiappori, P.-A., Rational household labor supply. Econometrica, 56(1): 63-90, 1988.
Chiappori, P.-A., Collective labor supply and welfare. Journal of Political Economy, 100(3):
437-67, 1992.
Cochran, W., The effectiveness of adjustment by subclassification in removing bias in observa-
tional studies. Biometrics, 24: 295-313, 1968.
Costa, D. L. and M. E. Kahn, Power couples: Changes in the locational choice of the college
educated, 1940-1990. The Quarterly Journal of Economics, 115(4): 1287-1315, 2000.
Del Boca, D., C. Flinn and M. Wiswall, Household choices and child development. Review of
Economic Studies, 81(1): 137-185, 2014.
Docquier, F., and H. Rapoport, The Economics of migrants’ remittances. Handbook on the
Economics of Giving, Reciprocity and Altruism, 2006.
Dustmann, C. and J.-S. Görlach, The economics of temporary migrations. Journal of Economic
Literature, 54(1): 98-136, 2016.
Fernández, R. and A. Fogli, Culture: An empirical investigation of beliefs, work, and fertility.
American Economic Journal: Macroeconomics, 1(1): 146-177, 2009.
Fernández, R., A. Fogli and C. Olivetti, Mothers and sons: Preference formation and female labor
force dynamics. The Quarterly Journal of Economics, 119(4): 1249-1299, 2004.
Foerster, M and P. Whiteford, How much redistribution do welfare states achieve? The role of
cash transfers and household taxes. CESifo DICE Report, 3/2009: 34-41, 2009.
Foged, M., Family migration and relative earnings potentials. Labour Economics 42: 87-100,
2016.
41
Goldin, C., The quiet revolution that transformed women’s employment, education, and family.
American Economic Review, 96(2): 1-21, 2006.
Grogger J. and G. Hanson, Income maximization and the selection and sorting of international
migrants. Journal of Development Economics, 95(1): 42-57, 2010.
Havnes, T. and M. Mogstad, Is universal childcare leveling the playing field? Journal of Public
Economics, 127: 100-144, 2015.
Herbst, C. M., Universal child care, maternal employment, and children’s long-run outcomes:
evidence from the U.S. Lanham Act of 1940. Journal of Labor Economics, forthcoming.
John, D and B. A. Shelton, The division of household labor. Annual Review of Sociology, 22:
299-322, 1996.
Junge, M., M.D. Munk and P. Poutvaara, International migration of couples. IZA Discussion
Paper No. 8352, 2014.
Kiernan, K., Unmarried cohabitation and parenthood in Britain and Europe. Law and Policy
26(1): 33-55, 2004.
Klugman, J., Human Development Report 2011. Sustainability and equity: A better future for
all. UNDP-HDRO Human Development Reports, 2011.
Kottelenberg, M. J. and S. F. Lehrer, Do the perils of universal childcare depend on the child’s
age? CESifo Economic Studies, 60(2): 338-365, 2014.
Lewis, T., Weighting adjustment methods for nonresponse in surveys, WUSS proceedings 162,
2012.
MacPherson, D. and J.B. Stewart, The labor force participation and earnings profiles of married
female immigrants. Quarterly Review of Economics and Business, 29(3): 57-72, 1989.
Mincer, J., Family migration decisions. Journal of Political Economy, 86: 749-773, 1978.
Moen, P., M. A. Erickson and D. Dempster-McClain, Their mother’s daughters? The intergen-
erational transmission of gender attitudes in a world of changing roles. Journal of Marriage
and Family, 59(2): 281-293, 1997.
Mont, D., Two earner family migration. Journal of Population Economics, 2(1): 55-72, 1989.
OECD, OECD Employment Outlook 2015.
42

Statistics Denmark, Denmark in Figures 2009.
The Economist Intelligence Unit, Starting well: Benchmarking early education across the world.
2012.
Tiebout, C.M., A pure theory of local expenditures. Journal of Political Economy, 64(5): 416-424,
1956.
United Nations, Department of Economic and Social Affairs, Trends in international migrant
stock: Migrants by destination and origin. United Nations database, POP/DB/MIG/Stock/Rev.2013,
2015.
United Nations, WIID - World Income Inequality Database. www.wider.unu.edu/project/wiid,
2016.
43

Appendix A
Household utility maximization in the model
We present the solutions of our model separately for five cases. Under (i) and (ii), we consider the
case where wa ≥ wb and partners specialize according to comparative advantage, i.e. a on labor
market and b on household work. We also assume this specialization pattern if wa = wb. Under
(i) child care is provided privately in the household (wb < pD and D = 0), under (ii) child care
is bought on the market (wb ≥ pD and D = D̄). For both (i) and (ii), we present three different
household labor supply regimes: First, a might specialize fully on working in the labor market
while b divides time between labor market and household production. Second there might be full
specialization with a working full-time in the labor market and b in household production. Third,
b might specialize fully on household production and a divides time between labor market and
household production. The solutions for (iii), when wb > wa and λ = 0 or sufficiently small, follow
by switching indices in (i) and (ii). In (iv) and (v), we present the solutions for wb > wa, when
λ >> 0. Under (iv) child care is provided privately (wb < pD and D = 0), under (v) it is bought on
the market (wb ≥ pD and D = D̄). For both (iv) and (v), there are two different household labor
supply regimes: First, a might specialize fully on working in the labor market while b divides time
between labor market and household production. Second, b might specialize fully on household
production and a divides time between labor market and household production. We will show that
under (iv) and (v) there is no regime where one partner fully specializes in working in the labor
market while the other partner works full-time in the household. First, we analyze the interior
solutions for labor supply of partner b while a works full-time in the labor market. For (i), (ii),
(iv) and (v), the first-order conditions to the utility maximization problem are as follows.
∂U
∂Hb
∣∣∣∣Ha=0
= 0
⇒ H∗b = (1− α)(wawb
+ 1)
+ αD̄, if wb < pD and D = 0;
∂U
∂Hb
∣∣∣∣Ha=0
= 0
⇒ H∗b = (1− α)(wawb
+ 1− pDwbD̄
), if wb ≥ pD and D = D̄.
The corresponding first-order conditions for an interior solution for labor supply of partner a while
b works full-time in the household are
44
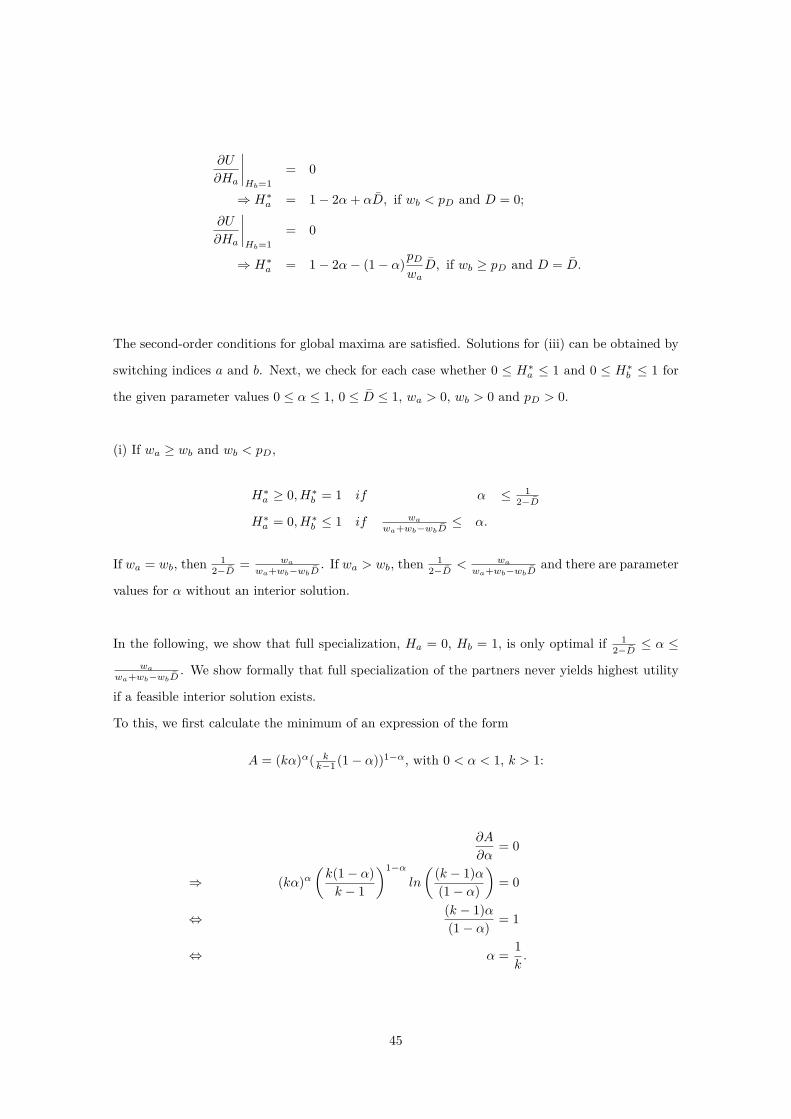
∂U
∂Ha
∣∣∣∣Hb=1
= 0
⇒ H∗a = 1− 2α+ αD̄, if wb < pD and D = 0;∂U
∂Ha
∣∣∣∣Hb=1
= 0
⇒ H∗a = 1− 2α− (1− α)pDwa
D̄, if wb ≥ pD and D = D̄.
The second-order conditions for global maxima are satisfied. Solutions for (iii) can be obtained by
switching indices a and b. Next, we check for each case whether 0 ≤ H∗a ≤ 1 and 0 ≤ H∗b ≤ 1 for
the given parameter values 0 ≤ α ≤ 1, 0 ≤ D̄ ≤ 1, wa > 0, wb > 0 and pD > 0.
(i) If wa ≥ wb and wb < pD,
H∗a ≥ 0, H∗b = 1 if α ≤ 12−D̄
H∗a = 0, H∗b ≤ 1 if wa
wa+wb−wbD̄≤ α.
If wa = wb, then 12−D̄ = wa
wa+wb−wbD̄. If wa > wb, then 1
2−D̄ < wa
wa+wb−wbD̄and there are parameter
values for α without an interior solution.
In the following, we show that full specialization, Ha = 0, Hb = 1, is only optimal if 12−D̄ ≤ α ≤
wa
wa+wb−wbD̄. We show formally that full specialization of the partners never yields highest utility
if a feasible interior solution exists.
To this, we first calculate the minimum of an expression of the form
A = (kα)α( kk−1 (1− α))1−α, with 0 < α < 1, k > 1:
∂A
∂α= 0
⇒ (kα)α(k(1− α)k − 1
)1−αln
((k − 1)α(1− α)
)= 0
⇔ (k − 1)α(1− α) = 1
⇔ α = 1k.
45

The second-order condition is satisfied as
∂2A
∂α∂α= (kα)α
(k(1− α)k − 1
)1−α((
ln
((k − 1)α(1− α)
))2+ 1
1− α
)> 0,
and A obtains its minimum at α∗ = 1k with value (kα∗)α∗( k
k−1 (1− α∗))1−α∗ = 1.
We can apply this insight to the following inequalities.
• U(H∗a , Hb = 1) > U(Ha = 0, Hb = 1)
⇒ ((2− D̄)αwa)α((2− D̄)(1− α))1−α > wαa (1− D̄)1−α
⇔ ((2− D̄)α)α((2− D̄1− D̄
)(1− α))1−α > 1
which holds for all α 6= 12−D̄ .
• U(Ha = 0, H∗b ) > U(Ha = 0, Hb = 1)
⇒ ((wa + wb − wbD̄)α)α((wawb
+ 1− D̄)(1− α))1−α > wαa (1− D̄)1−α
⇔ (wa + wb − wbD̄wa
α)α(wa
wb+ 1− D̄1− D̄
(1− α))1−α > 1
which holds for all α 6= wa
wa+wb−wbD̄.
(ii) If wa ≥ wb ≥ pD,
H∗a ≥ 0, H∗b = 1 if α ≤ wa−pDD̄2wa−pDD̄
H∗a = 0, H∗b ≤ 1 if wa−pDD̄wa+wb−pDD̄
≤ α.
If wa = wb, then wa−pDD̄2wa−pDD̄
= wa−pDD̄wa+wb−pDD̄
. If wa > wb, wa−pDD̄2wa−pDD̄
< wa−pDD̄wa+wb−pDD̄
and there are
parameter values for α without an interior solution.
We show that full specialization, Ha = 0, Hb = 1, is only optimal if wa−pDD̄2wa−pDD̄
≤ α ≤ wa−pDD̄wa+wb−pDD̄
.
We show also for (ii) that full specialization of the partners never yields highest utility if a feasible
interior solution exists.
46

• U(H∗a , Hb = 1) > U(Ha = 0, Hb = 1)
⇒ ((2wa − pDD̄)α)α((2− pDwa
D̄)(1− α))1−α > (wa − pDD̄)α
⇔ (2wa − pDD̄wa − pDD̄
α)α((2− pDwa
D̄)(1− α))1−α > 1
which holds for all α 6= wa−pDD̄2wa−pDD̄
.
• U(Ha = 0, H∗b ) > U(Ha = 0, Hb = 1)
⇒ ((wa + wb − pDD̄)α)α( 1wb
(wa + wb − pDD̄)(1− α))1−α > (wa − pDD̄)α
⇔ (wa + wb − pDD̄wa − pDD̄
α)α( 1wb
(wa + wb − pDD̄)(1− α))1−α > 1
which holds for all α 6= wa−pDD̄wa+wb−pDD̄
.
(iii) If wa < wb and λ = 0 or sufficiently small, we obtain the solutions by reversing indices a and
b in (i) and (ii).
(iv) If wb > wa, λ >> 0, and wb < pD, we have the same solutions as under (i), despite now1
2−D̄ > wa
wa+wb−wbD̄. In this case there are no parameter values for which full specialization yields
highest utility. For the parameter range where wa
wa+wb−wbD̄< α < 1
2−D̄ we check which interior
solution yields highest utility. Using the first- and second-order conditions of the utility maximiza-
tion problem described above one can show that there exists α̂(iv) =ln( wa+wb−wbD̄
(2−D̄)wb)
ln( wawb
) for which
U(Ha = H∗a , Hb = 1) > U(Ha = 0, Hb = H∗b ) if α < α̂(iv),
U(Ha = H∗a , Hb = 1) < U(Ha = 0, Hb = H∗b ) if α > α̂(iv),
U(Ha = H∗a , Hb = 1) = U(Ha = 0, Hb = H∗b ) if α = α̂(iv).
(v) If wb > wa, λ >> 0, and wb ≥ pD, we obtain the same solution as under (ii), despite nowwa−pDD̄2wa−pDD̄
> wa−pDD̄wa+wb−pDD̄
. In this case there are also no parameter values for which full special-
ization yields highest utility. For the parameter range where wa−pDD̄wa+wb−pDD̄
< α < wa−pDD̄2wa−pDD̄
we
check which interior solution yields highest utility. As in (iv) one can show that there exists
α̂(v) =ln( w2
a+wawb−wapDD̄
2wawb−wbpDD̄)
ln( wawb
) for which
U(Ha = H∗a , Hb = 1) > U(Ha = 0, Hb = H∗b ) if α < α̂(v),
U(Ha = H∗a , Hb = 1) < U(Ha = 0, Hb = H∗b ) if α > α̂(v),
U(Ha = H∗a , Hb = 1) = U(Ha = 0, Hb = H∗b ) if α = α̂(v).
47
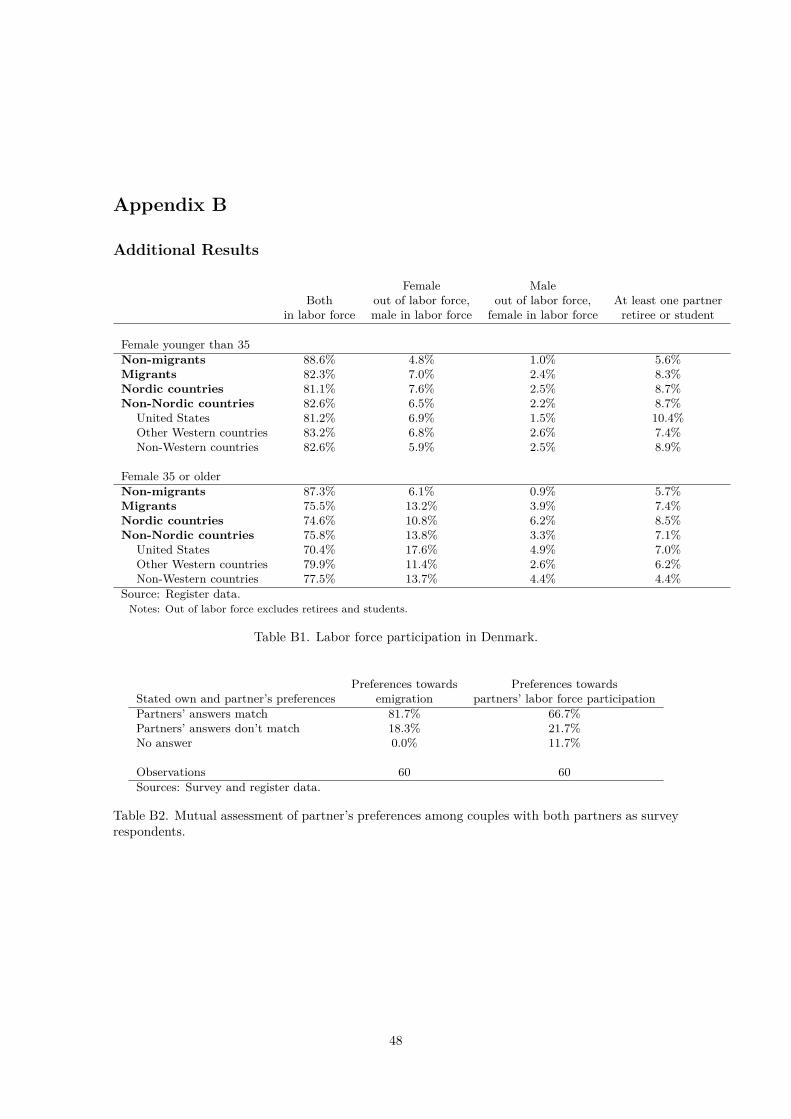
Appendix B
Additional Results
Female MaleBoth out of labor force, out of labor force, At least one partner
in labor force male in labor force female in labor force retiree or student
Female younger than 35Non-migrants 88.6% 4.8% 1.0% 5.6%Migrants 82.3% 7.0% 2.4% 8.3%Nordic countries 81.1% 7.6% 2.5% 8.7%Non-Nordic countries 82.6% 6.5% 2.2% 8.7%
United States 81.2% 6.9% 1.5% 10.4%Other Western countries 83.2% 6.8% 2.6% 7.4%Non-Western countries 82.6% 5.9% 2.5% 8.9%
Female 35 or olderNon-migrants 87.3% 6.1% 0.9% 5.7%Migrants 75.5% 13.2% 3.9% 7.4%Nordic countries 74.6% 10.8% 6.2% 8.5%Non-Nordic countries 75.8% 13.8% 3.3% 7.1%
United States 70.4% 17.6% 4.9% 7.0%Other Western countries 79.9% 11.4% 2.6% 6.2%Non-Western countries 77.5% 13.7% 4.4% 4.4%
Source: Register data.Notes: Out of labor force excludes retirees and students.
Table B1. Labor force participation in Denmark.
Preferences towards Preferences towardsStated own and partner’s preferences emigration partners’ labor force participationPartners’ answers match 81.7% 66.7%Partners’ answers don’t match 18.3% 21.7%No answer 0.0% 11.7%
Observations 60 60Sources: Survey and register data.
Table B2. Mutual assessment of partner’s preferences among couples with both partners as surveyrespondents.
48

Male in the Female in theBoth in the labor force, labor force, At least one partnerlabor force female home male home retiree or student
In DenmarkUnited Kingdom 80.9% 2.9% 0.0% 16.2%Other Western Europe 84.9% 3.0% 0.0% 12.1%AUS, CAN, NZ 89.7% 0.0% 0.0% 10.3%
Abroad, in 2008United Kingdom 67.6% 27.9% 0.0% 4.4%Other Western Europe 66.3% 27.7% 1.2% 4.8%AUS, CAN, NZ 75.9% 20.7% 0.0% 3.5%
Source: Survey data.
Table B3. Percentage shares for actual labor force participation in other Western countries (withoutNordic countries and the US).
Male in the Female in theBoth in the labor force, labor force, Bothlabor force female home male home at home No answer
United Kingdom 57.4% 35.3% 0.0% 1.5% 5.9%Other Western Europe 62.7% 27.1% 0.6% 2.4% 7.2%AUS, CAN, NZ 75.9% 17.1% 3.5% 3.5% 0.0%
Source: Survey data.
Table B4. Percentage shares for preferred labor force participation in other Western countries(without Nordic countries and the US).
Other Non-Nordic Western West.
A: Household economy in DK countr. US countr. countr. TotalSeparate economies 15.6% 10.7% 12.9% 9.1% 12.6%Joint economies, male brings in more 54.1% 75.0% 58.9% 78.8% 63.0%Joint economies, female brings in more 11.0% 1.2% 9.1% 4.6% 7.7%Joint economies, equal contributions 11.9% 10.7% 14.4% 7.6% 12.5%Male brings in all money, female stays home 6.4% 1.2% 3.0% 0.0% 3.1%Female brings in all money, male stays home 0.0% 1.2% 0.4% 0.0% 0.4%No answer 0.9% 0.0% 1.1% 0.0% 0.8%
B: Household economy in 2008Separate economies 7.3% 0.0% 1.9% 0.0% 2.5%Joint economies, male brings in more 47.7% 47.6% 55.1% 54.6% 52.3%Joint economies, female brings in more 22.9% 2.4% 9.5% 3.0% 10.3%Joint economies, equal contributions 14.7% 6.0% 8.8% 3.0% 8.8%Male brings in all money, female stays home 5.5% 44.1% 22.4% 37.9% 24.3%Female brings in all money, male stays home 1.8% 0.0% 1.1% 1.5% 1.2%No answer 0.0% 0.0% 1.1% 0.0% 0.6%
Observations 109 84 263 66 522Source: Survey data.
Table B5. Percentage shares of household economies before migration and in 2008.
49

Household economy before emigration Emigration 1987-1998 Emigration 2001, 2002Separate economies 12.6% 12.8%Joint economies, the male brings in more money 63.1% 63.0%Joint economies, the female brings in more money 8.1% 7.2%Joint economies, both partners bring in the same amount 12.2% 12.8%Man brings in all money, female stays home 2.2% 4.0%Woman brings in all money, male stays home 0.4% 0.4%No answer 1.5% 0.0%
Household economy in 2008Separate economies 1.5% 3.6%Joint economies, the male brings in more money 56.1% 48.2%Joint economies, the female brings in more money 10.0% 10.8%Joint economies, both partners bring in the same amount 9.2% 8.4%Man brings in all money, female stays home 21.0% 27.9%Woman brings in all money, male stays home 1.1% 1.2%No answer 1.1% 0.0%
Observations 271 251Source: Survey data.
Table B6. Percentage shares of household economies before migration and 2008 by year of emigra-tion.
1987/1988 1992/1993 1997/1998 2001/2002Nordic countries 23.3% 14.5% 14.5% 26.3%United Kingdom 2.3% 11.6% 12.6% 15.5%Rest of Western Europe 37.2% 44.9% 34.6% 25.5%US 18.7% 16.0% 20.1% 13.2%Other Western countries 9.3% 4.3% 4.4% 6.0%Non-Western countries 9.3% 8.7% 13.9% 13.5%
Observations 43 69 159 251Source: Survey data.
Table B7. Percentage shares of countries of residence by emigration years.
A: All couples. Other AUS,UK Western Europe CAN, NZ
Male tied mover 100.0% 92.0% 100.0%(5) (25) (6)
No tied mover 82.4% 74.2% 71.4%(17) (31) (14)
Female tied mover 65.2% 64.5% 77.8%(46) (110) (9)
B: Couples withoutpre-school age children.Male tied mover 100.0% 100.0% 100.0%
(4) (16) (5)No tied mover 100.0% 80.7% 90.0%
(10) (26) (10)Female tied mover 69.0% 64.2% 83.3%
(29) (81) (6)Source: Survey data.Notes: Numbers of observation in parentheses.
Table B8. Female labor force participation and tied mover status among emigrant couples in otherWestern countries (without other Nordic countries and the US) in 2008.
50

Power couple 0.008 -0.013 0.017 0.028(0.059) (0.060) (0.057) (0.058)
Female power couple 0.040 0.009 0.005 0.019(0.082) (0.082) (0.079) (0.079)
Male power couple -0.199*** -0.180** -0.155** -0.147**(0.070) (0.071) (0.068) (0.068)
Youngest child 0-6 -0.233*** -0.195*** -0.190*** -0.258***(0.068) (0.067) (0.066) (0.075)
Youngest child 7+ -0.134** -0.122** -0.131** -0.171***(0.060) (0.059) (0.057) (0.064)
Gini -2.188***(0.402)
Nordic countries 0.207*** 0.061(0.053) (0.103)
United States -0.195*** -0.191***(0.056) (0.056)
Non-Western countries -0.130** -0.126**(0.064) (0.064)
Youngest child 0-6 * Nordic 0.245*(0.130)
Youngest child 7+ * Nordic 0.145(0.129)
Female tied mover -0.128*** -0.090** -0.069 -0.069(0.045) (0.044) (0.044) (0.044)
Constant 0.811*** 1.458*** 0.706*** 0.764***(0.117) (0.165) (0.115) (0.121)
R-squared 0.196 0.250 0.267 0.273Observations 474 437 474 474Sources: Survey and register data.Notes: OLS estimation. Standard errors in parentheses.Female age dummies included.*** Significant at the 1 percent level.** Significant at the 5 percent level.* Significant at the 10 percent level.
Table B9. Female labor force participation 2008 and tied mover status.
51

Preference for Actualfemale labor force female labor force
participation participation
Power couple 0.016 -0.034(0.070) (0.062)
Female power couple -0.100 -0.023(0.095) (0.084)
Male power couple -0.160* -0.184**(0.086) (0.075)
Youngest child 0-6 -0.336 -0.941***(0.237) (0.207)
Youngest child 7+ -0.187*** -0.160***(0.070) (0.061)
Gini -2.141*** -1.811***(0.491) (0.445)
"Starting well" index 0.170 0.955***(0.291) (0.254)
Constant 1.700*** 1.306***(0.196) (0.179)
R-squared 0.217 0.283Observations 369 397Sources: Survey data, register data, and The Economist Intelligence Unit.Notes: OLS estimation. Standard errors in parentheses.Female age dummies included.*** Significant at the 1 percent level.** Significant at the 5 percent level.* Significant at the 10 percent level.
Table B10. Linear probability regressions: Actual and preferred female labor force participationand "Starting Well" Index.
52

Power couple -0.039 -0.067 -0.022 -0.010(0.060) (0.060) (0.058) (0.058)
Female power couple 0.005 -0.033 -0.026 -0.012(0.082) (0.082) (0.079) (0.079)
Male power couple -0.255*** -0.234*** -0.192*** -0.184***(0.070) (0.071) (0.067) (0.067)
Youngest child 0-6 -0.211*** -0.168** -0.167** -0.234***(0.069) (0.067) (0.066) (0.075)
Youngest child 7+ -0.136** -0.118** -0.124** -0.163**(0.060) (0.058) (0.057) (0.064)
Gini -2.289***(0.395)
Nordic countries 0.217*** 0.073(0.053) (0.103)
United States -0.204*** -0.199***(0.055) (0.055)
Non-Western countries -0.144** -0.140**(0.063) (0.063)
Youngest child 0-6 * Nordic 0.241*(0.129)
Youngest child 7+ * Nordic 0.142(0.128)
Female labor force participation in DK 0.309** 0.381*** 0.312*** 0.309***(0.121) (0.120) (0.116) (0.115)
Constant 0.445*** 1.077*** 0.363** 0.424***(0.165) (0.201) (0.159) (0.163)
R-squared 0.193 0.261 0.275 0.281Observations 474 437 474 474
Source: Survey and register data.Notes: OLS estimation. Standard errors in parentheses.Female age dummies included.*** Significant at the 1 percent level.** Significant at the 5 percent level.* Significant at the 10 percent level.
Table B11. Linear probability regressions: Female labor force participation abroad in 2008.
53

Emigration Emigration87/88, 92/93, 97/98 01/02
Preference for Actual Preference for Actualfemale labor force female labor force female labor force female labor force
participation participation participation participation
Power couple 0.213 0.144 0.119 0.041(0.135) (0.096) (0.121) (0.086)
Female power couple 0.059 0.048 0.002 0.095(0.188) (0.128) (0.167) (0.114)
Male power couple -0.056 0.009 -0.005 -0.126(0.148) (0.119) (0.131) (0.104)
Youngest child 0-6 -0.407** -0.168* -0.260* -0.160*(0.177) (0.091) (0.155) (0.082)
Youngest child 7+ -0.287** -0.201** -0.217* -0.121(0.143) (0.099) (0.121) (0.089)
Nordic countries 0.153 0.207** 0.240** 0.200***(0.136) (0.081) (0.119) (0.073)
United States -0.382*** -0.206** -0.355*** -0.221**(0.112) (0.101) (0.099) (0.091)
Non-Western countries -0.035 0.078 -0.199* -0.174*(0.125) (0.109) (0.111) (0.097)
Constant 1.041** 0.817*** 0.900* 0.606***(0.505) (0.144) (0.467) (0.131)
Observations 132 220 143 234R-squared 0.353 0.273 0.421 0.350Source: Survey and register data.Notes: OLS estimation. Standard errors in parentheses.Female age dummies included.*** Significant at the 1 percent level.** Significant at the 5 percent level.* Significant at the 10 percent level.
Table B12. Preferred and actual female labor force participation separately for earlier and lateremigration cohorts.
54
Appendix C
Regression Results with Sample Weighting
Tables C1 and C2 show regression specifications as in Tables 14 and 15 using inverse probability
weights which account for the probability that an individual is included in our sample. We construct
these weights following the propensity cell method described in Cochran (1986) and Lewis (2012).
In the administrative population data, we can observe the target population of emigrants who
satisfy the restrictions to be included in the survey according to the sampling design. To be
included in the survey, individuals must have emigrated in 1987, 1988, 1992, 1993, 1997, 1998,
2001 or 2002, and must not have returned by the end of 2007. Emigrants had to be aged 18
or more when they emigrated, and at most 59 in 2007. As the probability for an individual to
be included in our sample depends, for example, on the availability of contact information and
on response behavior, this can potentially induce a bias in our regression results if this sample
selection is non-random. To account for a potential bias in our results we first estimate a logit
model predicting the probability for an individual to be in the sample based on a set of observable
characteristics, including gender, emigration year, destination country, age and education. These
variables are included as dummy variables derived from the following categories: We distinguish
between male and female individuals, 4 emigration year-pairs, 4 age categories intervals (22-29,
30-39, 40-49, 50-59), as well as destination country groups as presented in Table 2, excluding
emigrants to the Faroe Islands and Greenland. As weighting of survey responses is based on the
initial destination country of the migrants according to the administrative data, we exclude some
observations for which information on the initial emigration country differs from our information
in the survey. According to the probabilities predicted by the model we calculate the share of
respondents in five strata of equal size in the migrant population, as suggested by Cochran (1968).
The inverse of these shares are then used as probability weights in the regressions in Tables C1
and C2. The results do not show any qualitative difference to the unweighted regressions. The
similarity of the results with and without weighting alleviates the concern that a potential sample
selection bias affects our results.
55

Power couple -0.032 -0.069 -0.033 -0.014(0.069) (0.063) (0.066) (0.067)
Female power couple 0.061 -0.016 0.0018 0.019(0.080) (0.075) (0.074) (0.073)
Male power couple -0.227*** -0.185** -0.157* -0.148*(0.086) (0.086) (0.088) (0.088)
Youngest child 0-6 -0.137* -0.130* -0.125* -0.203**(0.072) (0.068) (0.066) (0.091)
Youngest child 7+ -0.099 -0.108 -0.113* -0.147*(0.069) (0.067) (0.064) (0.079)
Gini -2.045***(0.490)
Nordic countries 0.149*** 0.031(0.052) (0.073)
United States -0.232*** -0.228***(0.074) (0.073)
Non-Western countries -0.207** -0.206**(0.096) (0.097)
Youngest child 0-6 * Nordic 0.229**(0.104)
Youngest child 7+ * Nordic 0.103(0.113)
Constant 0.731*** 1.378*** 0.699*** 0.754***(0.132) (0.181) (0.122) (0.128)
R-squared 0.177 0.235 0.261 0.268Observations 451 419 451 451Sources: Survey and register data.Notes: Weighted linear probability regressions. Standard errors in parentheses.Female age dummies included.*** Significant at the 1 percent level.** Significant at the 5 percent level.* Significant at the 10 percent level.
Table C1. Weighted linear probability regressions: Female labor force participation abroad in 2008.
56

Power couple 0.069 0.025 0.078 0.101(0.072) (0.068) (0.072) (0.073)
Female power couple 0.002 -0.082 -0.039 -0.021(0.096) (0.094) (0.090) (0.088)
Male power couple -0.111 -0.120 -0.056 -0.044(0.089) (0.093) (0.093) (0.092)
Youngest child 0-6 -0.227*** -0.210*** -0.220*** -0.318***(0.073) (0.072) (0.070) (0.092)
Youngest child 7+ -0.255*** -0.232*** -0.256*** -0.297***(0.067) (0.070) (0.067) (0.075)
Gini -1.921***(0.515)
Nordic countries 0.176*** 0.041(0.060) (0.089)
United States -0.195** -0.192**(0.078) (0.076)
Non-Western countries -0.014 -0.014(0.089) (0.088)
Youngest child 0-6 * Nordic 0.280**(0.110)
Youngest child 7+ * Nordic 0.103(0.136)
Constant 0.975*** 1.588*** 0.920*** 0.985***(0.115) (0.179) (0.121) (0.129)
R-squared 0.165 0.222 0.222 0.232Observations 420 391 420 420Sources: Survey and register data.Notes: Weighted linear probability regressions. Standard errors in parentheses.Female age dummies included.*** Significant at the 1 percent level.** Significant at the 5 percent level.* Significant at the 10 percent level.
Table C2. Weighted linear probability regressions: Preference for female labor force participation.
57