Embed Size (px)
Citation preview
International Financial Integration and Entrepreneurship
November 2006
Laura Alfaro Andrew CharltonHarvard Business School London School of Economics
The views expressed in this paper are those of the author(s) only, and the presenceof them, or of links to them, on the IMF website does not imply that the IMF, its
Executive Board, or its management endorses or shares the views expressed in the paper.
What Do We Do in This Paper?
• Explore the relation between:
International Financial Integration (IFI) and Entrepreneurship
• New micro data set of 24 million firms in 98 developed and developing countries, 2004/1999.
• Preliminary evidence:
– IFI positively associated with higher levels of firm activity.– Robust: different measures of entrepreneurship (entry, size,
skewness, age, vintage); de jure and de facto measures of IFI; different controls and specifications.
– Credit channel and FDI channel: consistent with evidence.
h11
Slide 2
h11 IFI: a country's linkages with international capital markets/financial market / international capita.hbsuser, 8/23/2006
Why Is this Interesting?
• Entrepreneurship and firm creation are often described as keys to economic growth.
• International competition and IFI: important sources of creativedestruction.
– Capital Mobility: ↑concerns in public and academic circles about the effects of international financial flows on the domestic entrepreneurial class and development.
• Theoretical effects of IFI on entrepreneurship: ambiguous.
Entrepreneurship and IFI: Negative Effects
• International capital and in particular FDI, can crowd out local efforts, negative effects local development [Hirschman (1958), Grossman (1984), Rodriguez-Clare (1996), Markusen and Venables (1999), Hausmann and Rodrik (2003)].
• In the presence of pre-existing distortions and weak institutional settings, international capital mobility can increase the likelihood of financial crises.
– Higher volatility and risk from financial crisis can reduce entrepreneurship and innovative efforts in a country.
Entrepreneurship and IFI: Positive Effects
• Foreign capital: countries can borrow to invest,
• IFI can lead to the improvement of domestic financial sectors (increased competition),
– The availability of funds has been found to be an important determinant of entrepreneurship.
• IFI should also facilitate international risk sharing.
• Potential positive role of knowledge spillovers and linkages from foreign firms on domestic firm activity and innovation.
IFI and Entrepreneurship: Evidence?
• A critical question in academic and policy circles is then:
Is international capital mobility fostering or destroying entrepreneurship?
• Little empirical work on effects of international capital mobility on firm dynamism:
Lack of an international firm data set comprehensive enough to allow studying both developed and developing countries.
• D&B data set: overcome this problem – study close to 24 million firms in 98 developing and developed countries.

Relation to the Literature
• Effects of the external environment and financial markets on entrepreneurship; [Desai, Gompers, and Lerner (2003) and Klapper, Laeven, and Rajan (2005); Black and Strahan (2002)].
– We explore the determinants of entrepreneurship and firm dynamism in developed and developing countries using data for private and public firms
• Related micro work: Chari and Herny (2004) and Harrison, Love and McMillian (2004) study effects of IFI on firms’ cost of capital and financing constraints.
– Channels analysis: consistent with this evidence.
Debate: Effects of IFI
• By focusing on the micro effects: contribute to the broader debate on the effects of international financial integration.
“Capital account liberalization, it is fair to say, remains one of the most controversial and least understood policies of our day.” Eichengreen(2001).
• Empirical (macro) evidence is mixed [Prasad, Rogoff, Wei,Kose (2003)].
• A new set of papers focuses on narrower aspects/potential mechanisms through which financial liberalization can lead to faster growth [Forbes (2006), Kose, Prasad, Rogoff, Wei (2006)].
• Our results suggest IFI has been associated with more firm activity.

Outline
• Introduction and Motivation• The D&B Data Set• Definitions
– How to measure entrepreneurship?– How to measure IFI?
• Results– Cross-Section– Robustness– Rajan and Zingales Methodology– Differences in Differences (2004/1999)– Endogeneity Discussion
• Channels– FDI Channel– Credit Channel
• Preliminary Conclusions
The D&B Data Set
• Worldbase data: database of both public and private companies in more than 213 countries and independent territories in 2004. Complied by Dun and Bradstreet.
• The unit of record is the ‘establishment’ rather than the firm.
• 4-digit SIC-1987 code of the primary industry in which firm operates; for several countries, SIC codes of up to 5 secondary industries listed in descending order of importance (analysis: 2 digit level).
• Exclude: information for which primary industry and year started; territories with less than 80 observations; government related firms (SIC 9).
• Final data: more than 24 million observations in 98 countries.
Issues: Sample Frame
• Variation in sample across countries: country sizes, sampling intensity.
• D&B collects data from various sources (not only official ones).
• Potential Biases:
– Compare 2004/1999 (diff in diff): changes in firm activity and changes in IFI.
• Although it still possible that sampling intensities may be correlated to changes in IFI –data/conversations did not suggest this to be the case.
– Regional Dummies;– Weighted regressions;– Country sampling intensity (number of firms) and change in the
sampling intensity of old firms;– Measure of informal sector;– Exclude outliers.
How to Measure Entrepreneurship?
• No one view, no one definition:
– Innovation (Schumpeter), the bearing of risk (Knight), the bringing together of factors of production (Say), the creation of organizations (Gartner), the pursuit of opportunity without regard to resources currently controlled (HBS).
• Various proxies:
– Entry, average firm size, the skewness of the firm size, age, vintage; [(Black and Strahan (2002), Desai, Gompers, and Lerner (2003) and Klapper, Laeven, and Rajan (2005).]
Entrepreneurship: Measures
• Firm Size Distribution: Small firms: source of innovation, change and employment.
– Skewness of the distribution. IFI (↓ capital constraints) + skewed firm-size distribution.
• Size: log of the average number of employees. IFI (more capital) + (-) small firms enter and survive in the market
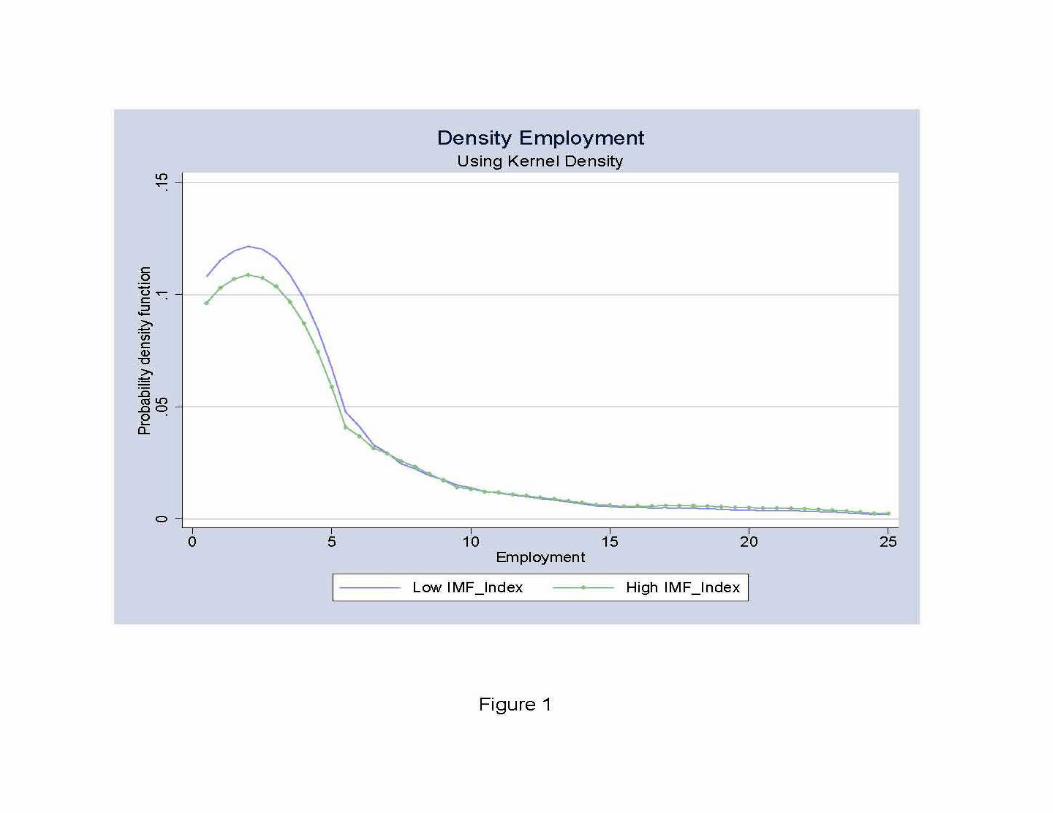
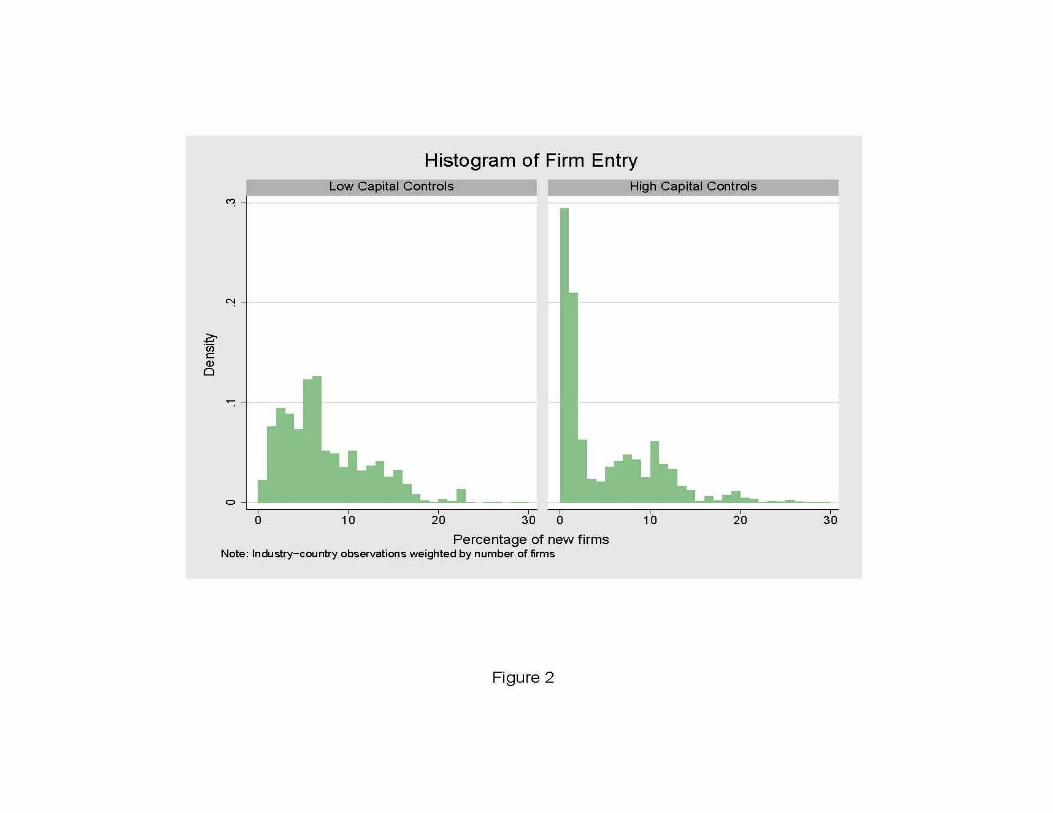
• Firm Entry: % new firms (two years or less). IFI (dynamic markets) + opportunities for startups.
• Average age: IFI (more dynamic environments) lower average age of firms.
• Vintage: a weighed average measure of age (how important young firms are to the productive capacity of an industry). IFI (more dynamic environment, more capital) smaller and younger firms.
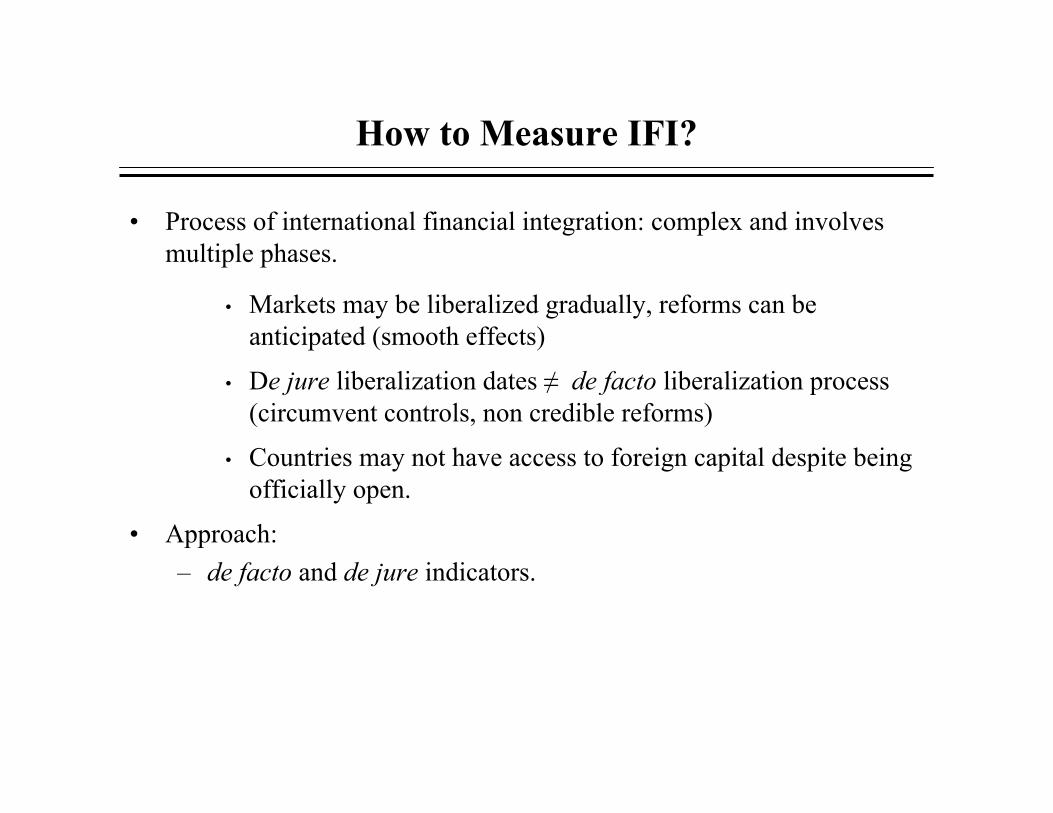
How to Measure IFI?
• Process of international financial integration: complex and involves multiple phases.
• Markets may be liberalized gradually, reforms can be anticipated (smooth effects)
• De jure liberalization dates ≠ de facto liberalization process (circumvent controls, non credible reforms)
• Countries may not have access to foreign capital despite being officially open.
• Approach: – de facto and de jure indicators.

De Jure Measure: IMF Index
• Annual Report on Exchange Arrangements and Exchange Restrictions (AREAER), average dummy variables:
– Capital market securities; – Money market instruments; – Collective investment securities; – Derivatives and other instruments: – Commercial credits; – Financial credits; – Guarantees, securities and financial backup facilities; – Direct investment; – Real estate transactions;– Personal capital transactions.
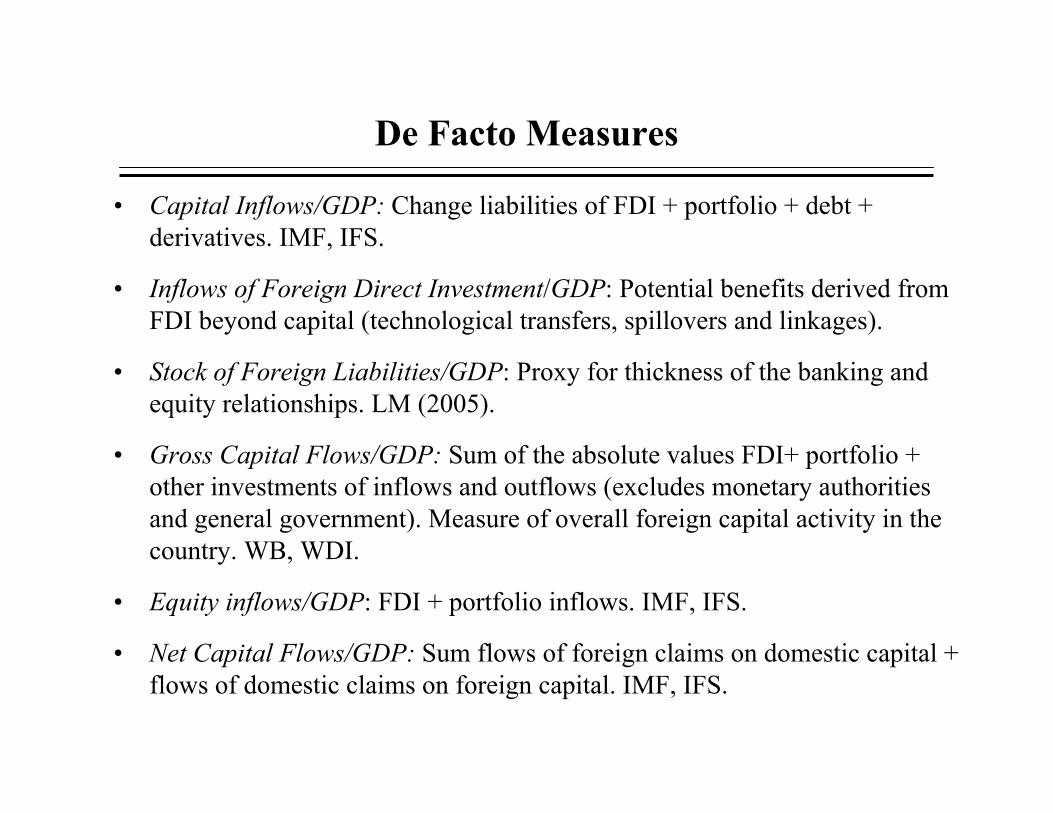
De Facto Measures
• Capital Inflows/GDP: Change liabilities of FDI + portfolio + debt + derivatives. IMF, IFS.
• Inflows of Foreign Direct Investment/GDP: Potential benefits derived from FDI beyond capital (technological transfers, spillovers and linkages).
• Stock of Foreign Liabilities/GDP: Proxy for thickness of the banking and equity relationships. LM (2005).
• Gross Capital Flows/GDP: Sum of the absolute values FDI+ portfolio + other investments of inflows and outflows (excludes monetary authorities and general government). Measure of overall foreign capital activity in the country. WB, WDI.
• Equity inflows/GDP: FDI + portfolio inflows. IMF, IFS.
• Net Capital Flows/GDP: Sum flows of foreign claims on domestic capital + flows of domestic claims on foreign capital. IMF, IFS.
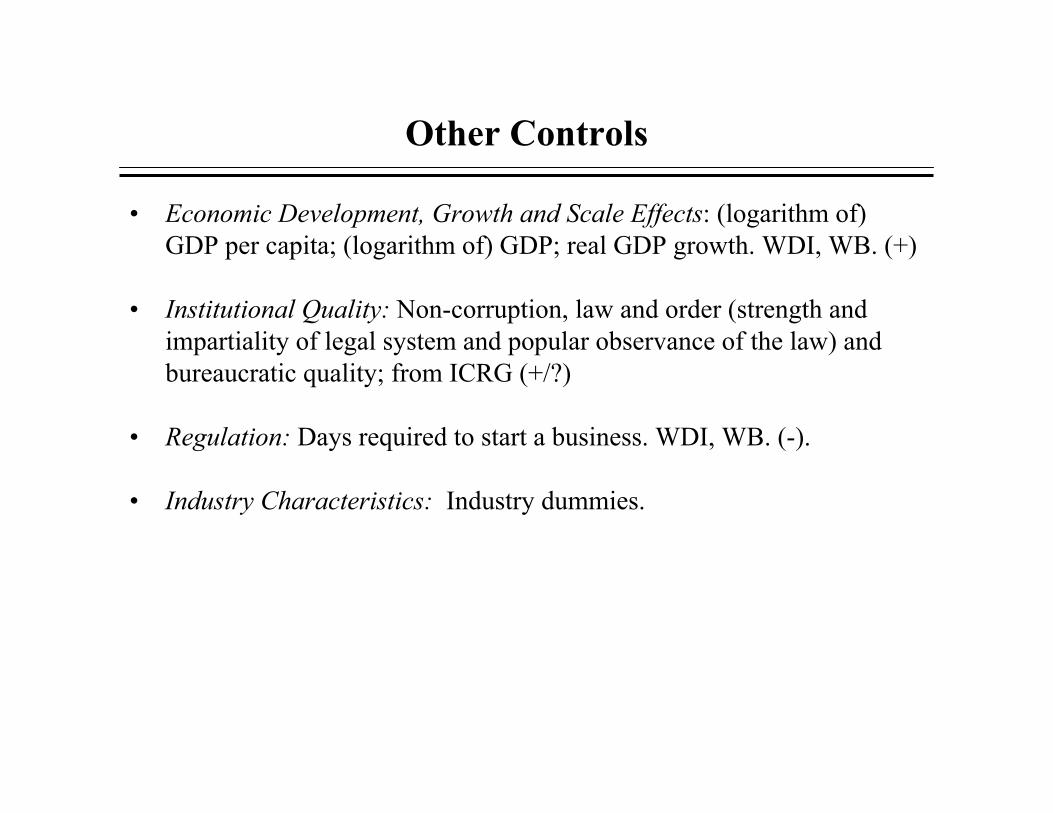
Other Controls
• Economic Development, Growth and Scale Effects: (logarithm of) GDP per capita; (logarithm of) GDP; real GDP growth. WDI, WB. (+)
• Institutional Quality: Non-corruption, law and order (strength and impartiality of legal system and popular observance of the law) and bureaucratic quality; from ICRG (+/?)
• Regulation: Days required to start a business. WDI, WB. (-).
• Industry Characteristics: Industry dummies.
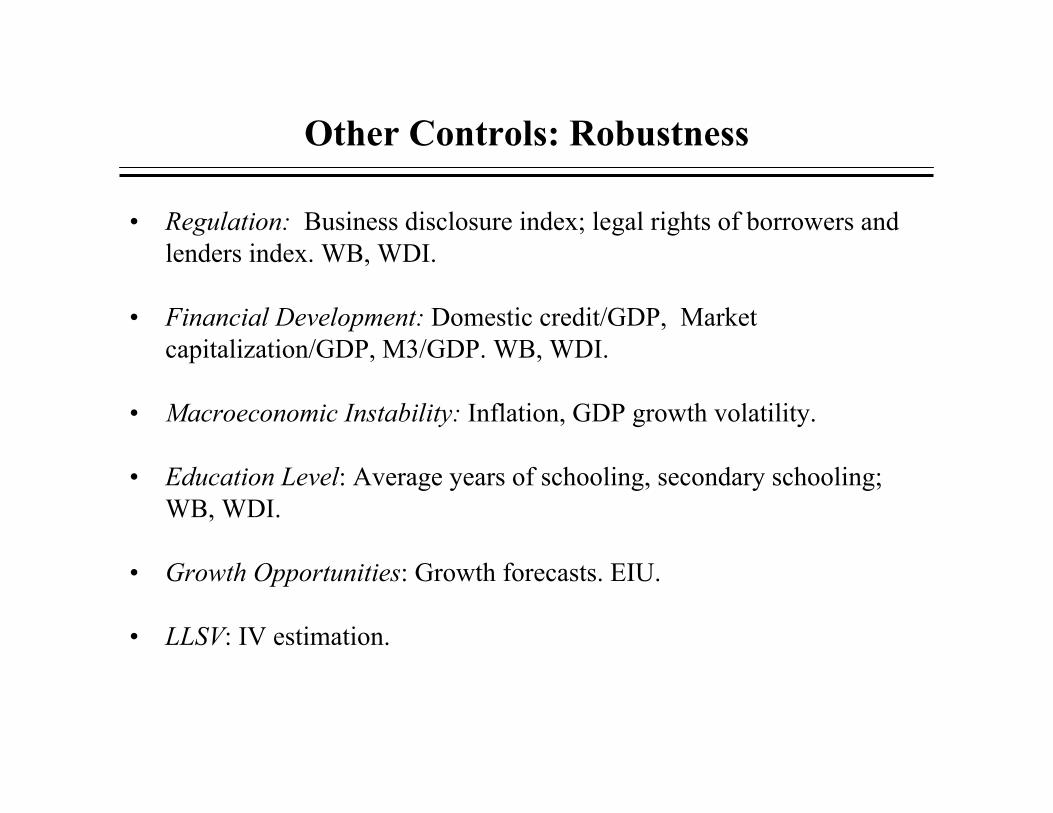
Other Controls: Robustness
• Regulation: Business disclosure index; legal rights of borrowers and lenders index. WB, WDI.
• Financial Development: Domestic credit/GDP, Market capitalization/GDP, M3/GDP. WB, WDI.
• Macroeconomic Instability: Inflation, GDP growth volatility.
• Education Level: Average years of schooling, secondary schooling; WB, WDI.
• Growth Opportunities: Growth forecasts. EIU.
• LLSV: IV estimation.

Empirical Strategy: Cross Section
• Eic: activity measure in industry i of country c; Kc capital integration measure; Xc country level controls; εci error term (White’s correction for heteroskedasticity and clustering).
• Industry dummies: cross-industry differences in the technological level or other determinants of entrepreneurship.
– Do firms in a country with more capital mobility exhibit more entrepreneurial activity relative to firms in a country with less capital mobility in the same industry?
• Weighted regressions (number of firms, employment).
• For entry: Tobit.
iciccic XK εδβα +++=Ε
Entrepreneurship and IFI: Entry (Tobit/Weighted)
IMF index Capital Inflows/GDP
FDI Inflows/GDP
Foreign Liabilities/GDP
Gross Capital Flows/GDP
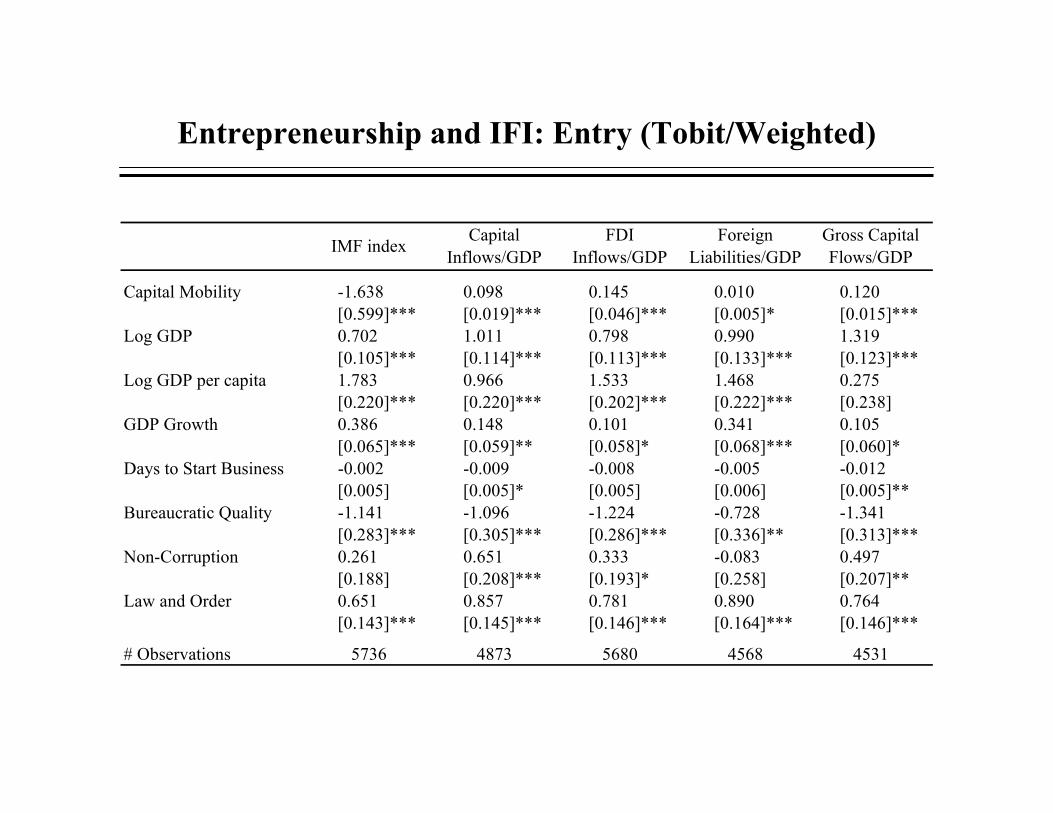
Capital Mobility -1.638 0.098 0.145 0.010 0.120[0.599]*** [0.019]*** [0.046]*** [0.005]* [0.015]***
Log GDP 0.702 1.011 0.798 0.990 1.319[0.105]*** [0.114]*** [0.113]*** [0.133]*** [0.123]***
Log GDP per capita 1.783 0.966 1.533 1.468 0.275[0.220]*** [0.220]*** [0.202]*** [0.222]*** [0.238]
GDP Growth 0.386 0.148 0.101 0.341 0.105[0.065]*** [0.059]** [0.058]* [0.068]*** [0.060]*
Days to Start Business -0.002 -0.009 -0.008 -0.005 -0.012[0.005] [0.005]* [0.005] [0.006] [0.005]**
Bureaucratic Quality -1.141 -1.096 -1.224 -0.728 -1.341[0.283]*** [0.305]*** [0.286]*** [0.336]** [0.313]***
Non-Corruption 0.261 0.651 0.333 -0.083 0.497[0.188] [0.208]*** [0.193]* [0.258] [0.207]**
Law and Order 0.651 0.857 0.781 0.890 0.764[0.143]*** [0.145]*** [0.146]*** [0.164]*** [0.146]***
# Observations 5736 4873 5680 4568 4531
Example: Results for Entry
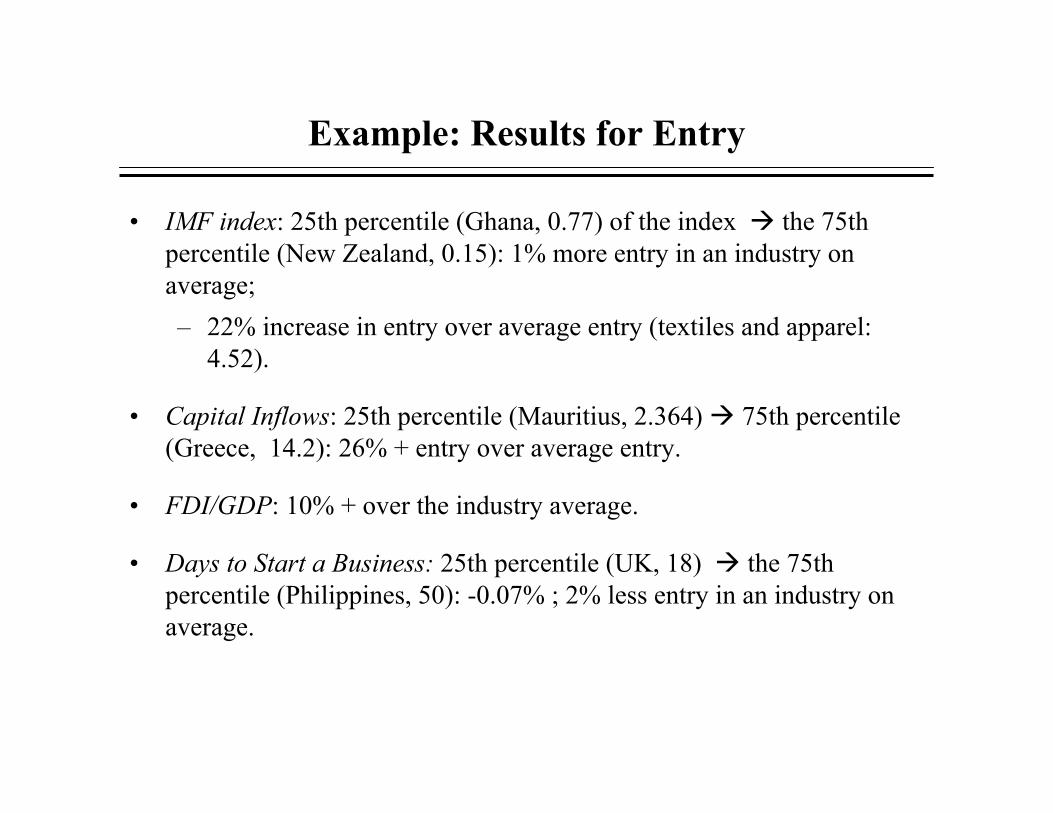
• IMF index: 25th percentile (Ghana, 0.77) of the index the 75th percentile (New Zealand, 0.15): 1% more entry in an industry on average; – 22% increase in entry over average entry (textiles and apparel:
4.52).
• Capital Inflows: 25th percentile (Mauritius, 2.364) 75th percentile (Greece, 14.2): 26% + entry over average entry.
• FDI/GDP: 10% + over the industry average.
• Days to Start a Business: 25th percentile (UK, 18) the 75th percentile (Philippines, 50): -0.07% ; 2% less entry in an industry on average.
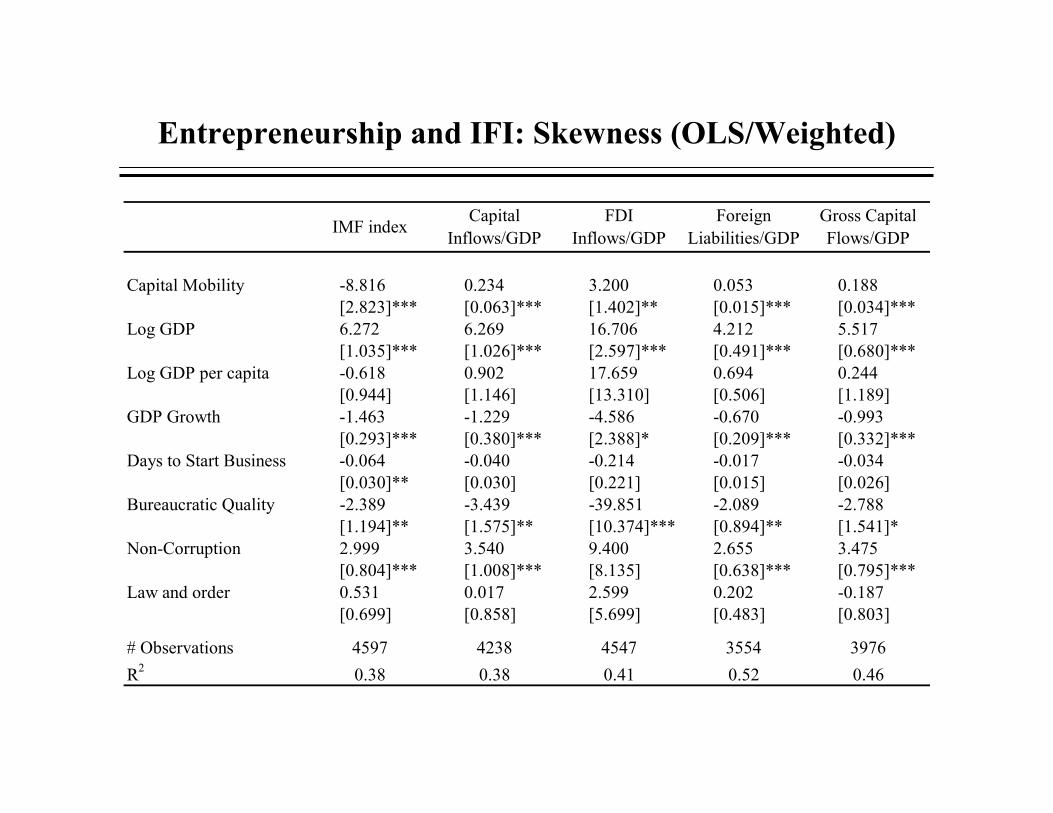
Entrepreneurship and IFI: Skewness (OLS/Weighted)
IMF index Capital Inflows/GDP
FDI Inflows/GDP
Foreign Liabilities/GDP
Gross Capital Flows/GDP
Capital Mobility -8.816 0.234 3.200 0.053 0.188[2.823]*** [0.063]*** [1.402]** [0.015]*** [0.034]***
Log GDP 6.272 6.269 16.706 4.212 5.517[1.035]*** [1.026]*** [2.597]*** [0.491]*** [0.680]***
Log GDP per capita -0.618 0.902 17.659 0.694 0.244[0.944] [1.146] [13.310] [0.506] [1.189]
GDP Growth -1.463 -1.229 -4.586 -0.670 -0.993[0.293]*** [0.380]*** [2.388]* [0.209]*** [0.332]***
Days to Start Business -0.064 -0.040 -0.214 -0.017 -0.034[0.030]** [0.030] [0.221] [0.015] [0.026]
Bureaucratic Quality -2.389 -3.439 -39.851 -2.089 -2.788[1.194]** [1.575]** [10.374]*** [0.894]** [1.541]*
Non-Corruption 2.999 3.540 9.400 2.655 3.475[0.804]*** [1.008]*** [8.135] [0.638]*** [0.795]***
Law and order 0.531 0.017 2.599 0.202 -0.187[0.699] [0.858] [5.699] [0.483] [0.803]
# Observations 4597 4238 4547 3554 3976R2 0.38 0.38 0.41 0.52 0.46
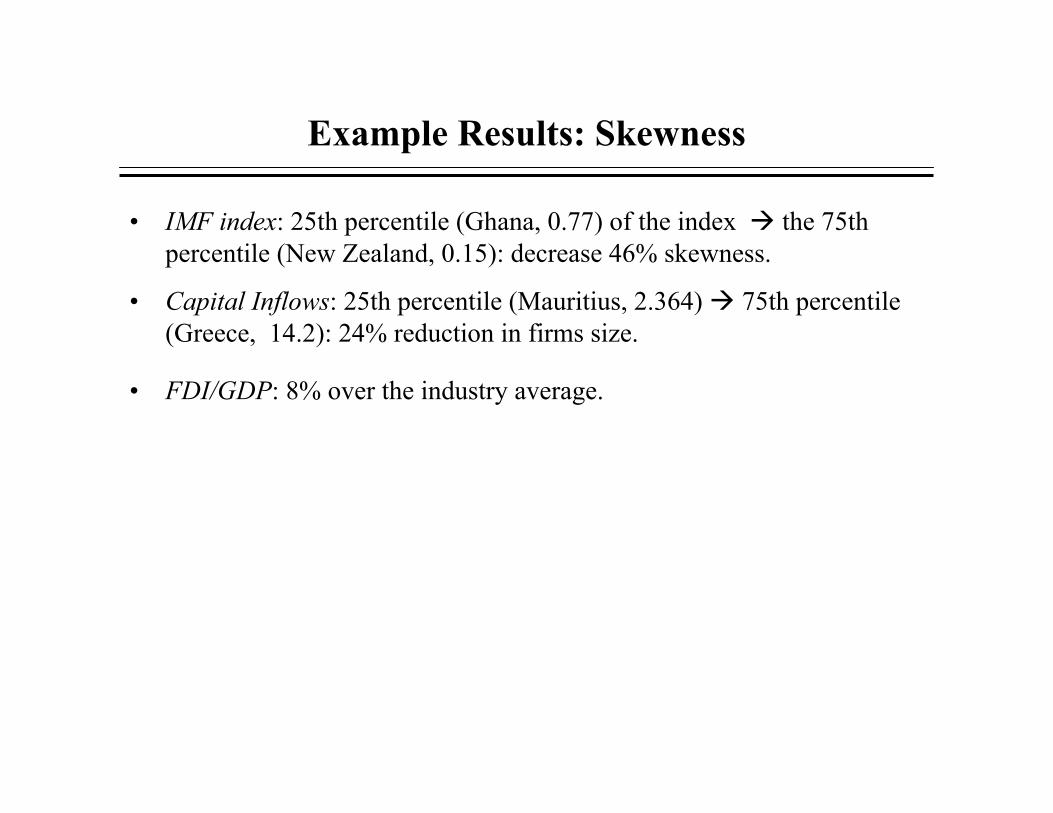
Example Results: Skewness
• IMF index: 25th percentile (Ghana, 0.77) of the index the 75th percentile (New Zealand, 0.15): decrease 46% skewness.
• Capital Inflows: 25th percentile (Mauritius, 2.364) 75th percentile (Greece, 14.2): 24% reduction in firms size.
• FDI/GDP: 8% over the industry average.
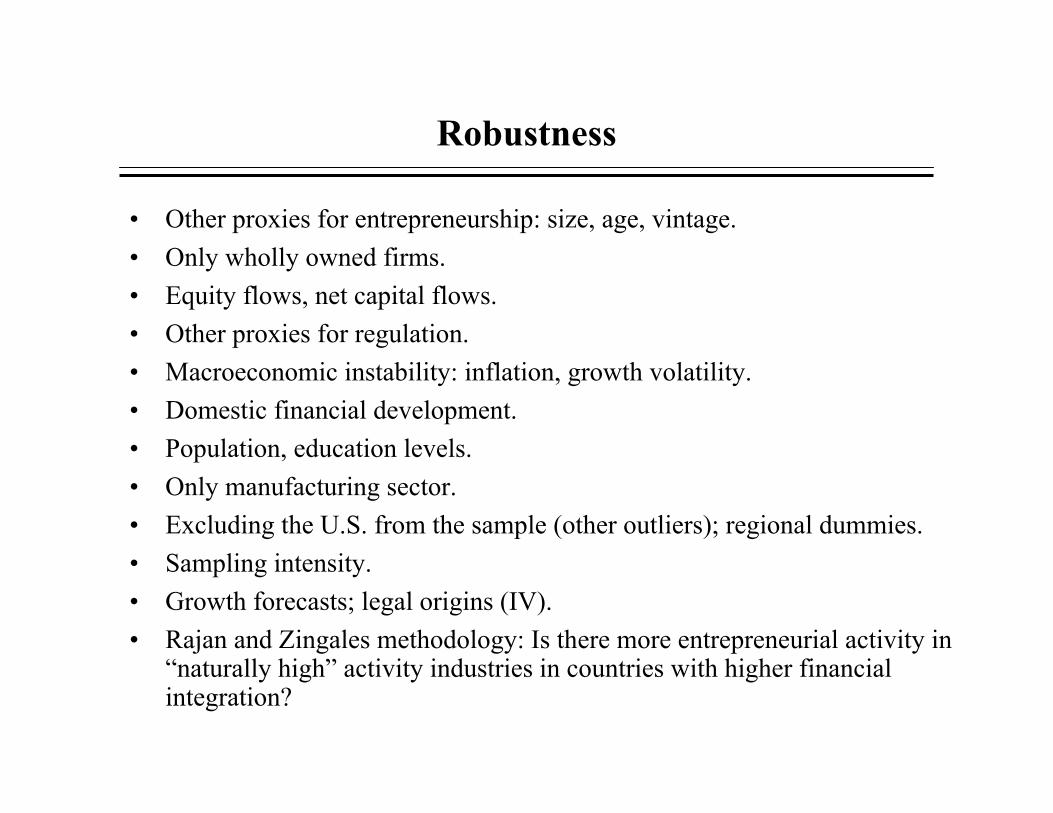
Robustness
• Other proxies for entrepreneurship: size, age, vintage.• Only wholly owned firms.• Equity flows, net capital flows.• Other proxies for regulation.• Macroeconomic instability: inflation, growth volatility.• Domestic financial development.• Population, education levels.• Only manufacturing sector.• Excluding the U.S. from the sample (other outliers); regional dummies.• Sampling intensity.• Growth forecasts; legal origins (IV).• Rajan and Zingales methodology: Is there more entrepreneurial activity in
“naturally high” activity industries in countries with higher financial integration?
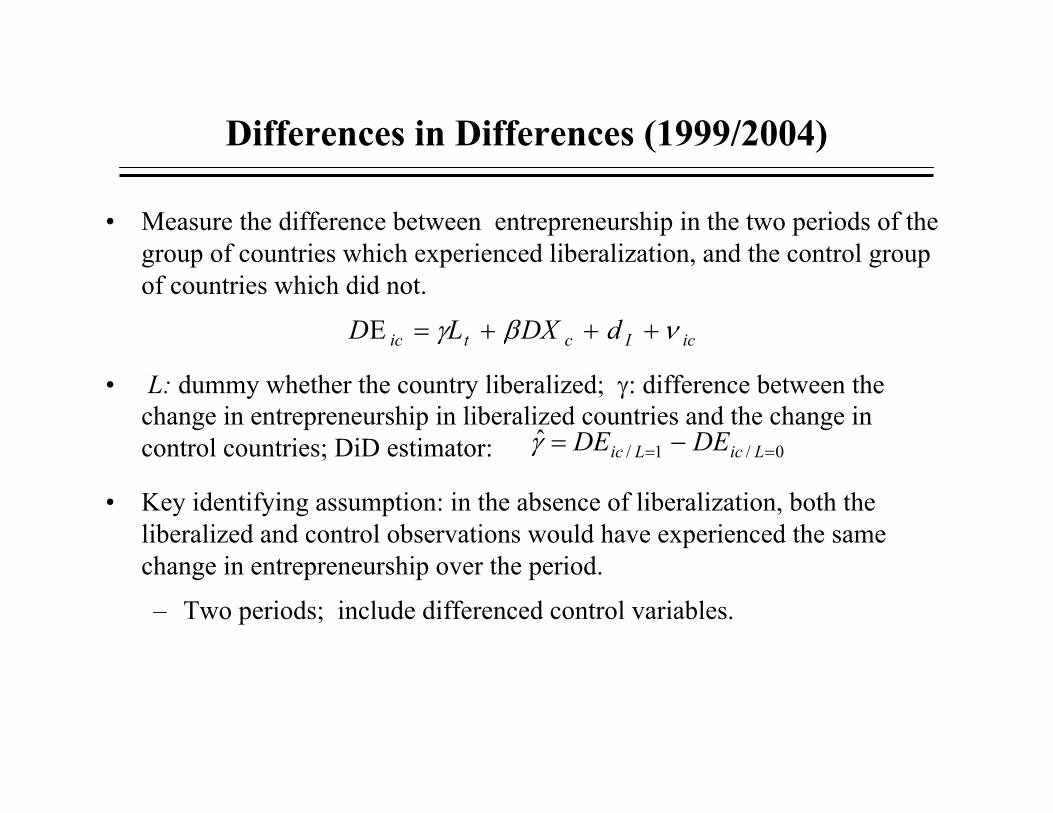
Differences in Differences (1999/2004)
• Measure the difference between entrepreneurship in the two periods of the group of countries which experienced liberalization, and the control group of countries which did not.
• L: dummy whether the country liberalized; γ: difference between the change in entrepreneurship in liberalized countries and the change in control countries; DiD estimator:
• Key identifying assumption: in the absence of liberalization, both the liberalized and control observations would have experienced the same change in entrepreneurship over the period.
– Two periods; include differenced control variables.
icIctic dDXLD νβγ +++=Ε
0/1/ˆ == −= LicLic DEDEγ
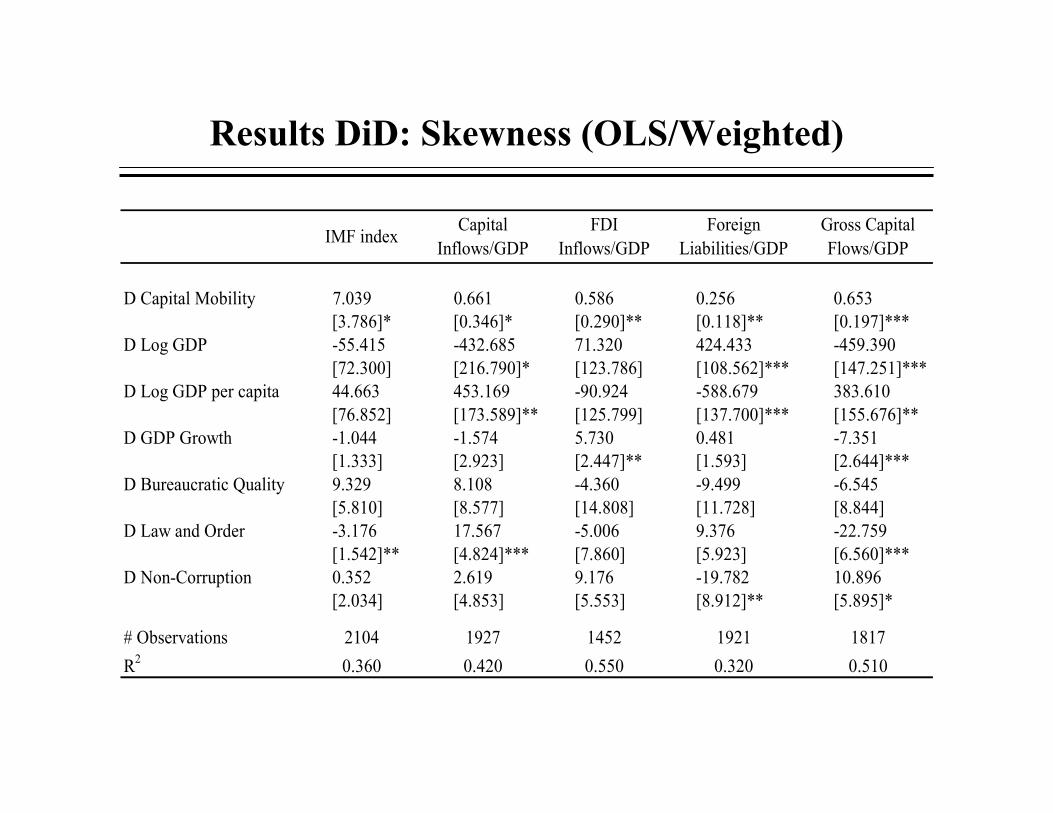
Results DiD: Skewness (OLS/Weighted)
IMF index Capital Inflows/GDP
FDI Inflows/GDP
Foreign Liabilities/GDP
Gross Capital Flows/GDP
D Capital Mobility 7.039 0.661 0.586 0.256 0.653[3.786]* [0.346]* [0.290]** [0.118]** [0.197]***
D Log GDP -55.415 -432.685 71.320 424.433 -459.390[72.300] [216.790]* [123.786] [108.562]*** [147.251]***
D Log GDP per capita 44.663 453.169 -90.924 -588.679 383.610[76.852] [173.589]** [125.799] [137.700]*** [155.676]**
D GDP Growth -1.044 -1.574 5.730 0.481 -7.351[1.333] [2.923] [2.447]** [1.593] [2.644]***
D Bureaucratic Quality 9.329 8.108 -4.360 -9.499 -6.545[5.810] [8.577] [14.808] [11.728] [8.844]
D Law and Order -3.176 17.567 -5.006 9.376 -22.759[1.542]** [4.824]*** [7.860] [5.923] [6.560]***
D Non-Corruption 0.352 2.619 9.176 -19.782 10.896[2.034] [4.853] [5.553] [8.912]** [5.895]*
# Observations 2104 1927 1452 1921 1817R2 0.360 0.420 0.550 0.320 0.510
Are Results Causal?
• Issues: policy endogeneity and omitted variables biases.– Different proxies for entrepreneurial activity; de facto de jure measures
of IFI; control for other variables that might affect entrepreneurial activity.
– Industry characteristics as opposed to country characteristics.– Imperfect control for exogenous growth: growth forecast from (EIU).– Imperfect attempt to account for possible endogeneity biases: IV with
LLSV. – DID, RZ
• Channels: mechanisms consistent with such an interpretation are supported by the empirical evidence.
• Even after all of these tests, our preliminary evidence should be interpreted with caution.
Channels
• Investigate several possible channels through which international financial integration might affect entrepreneurial activity:
– FDI Channel: Does capital mobility affect entrepreneurship through a change in the activity foreign firms?
– Credit Channel: Does capital mobility affect entrepreneurship through a credit availability channel?
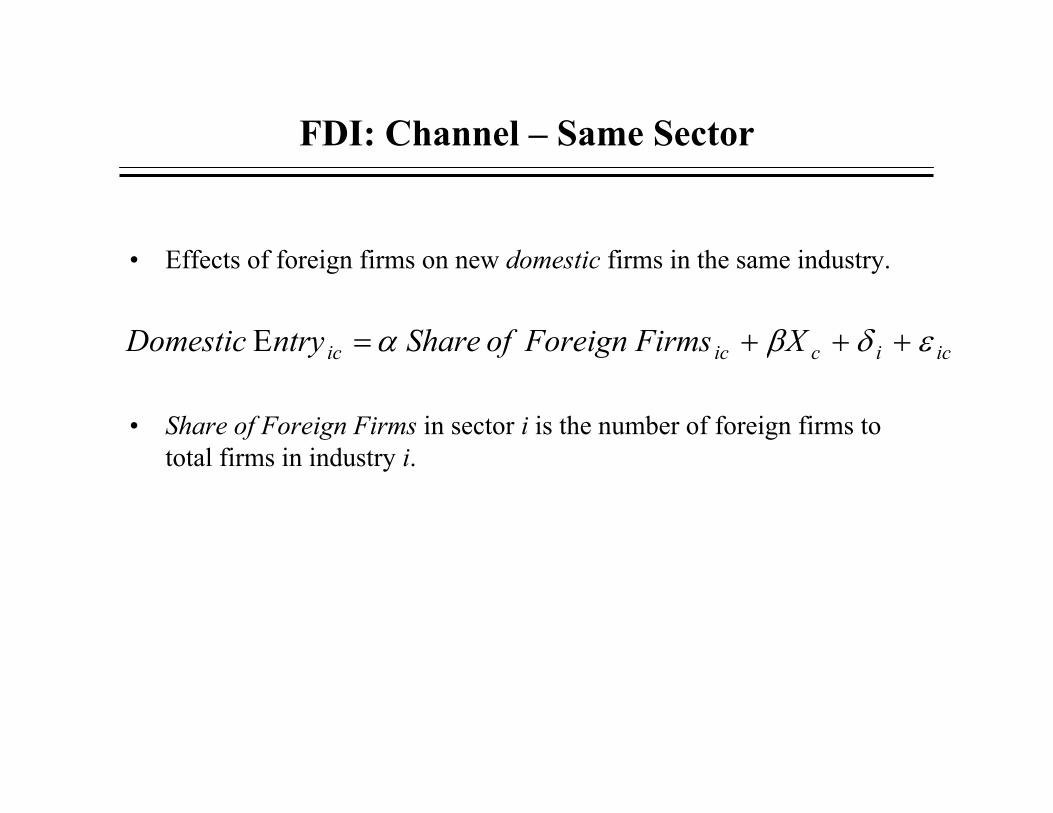
FDI: Channel – Same Sector
• Effects of foreign firms on new domestic firms in the same industry.
• Share of Foreign Firms in sector i is the number of foreign firms to total firms in industry i.
icicicic XFirmsForeignofSharentryDomestic εδβα +++=Ε
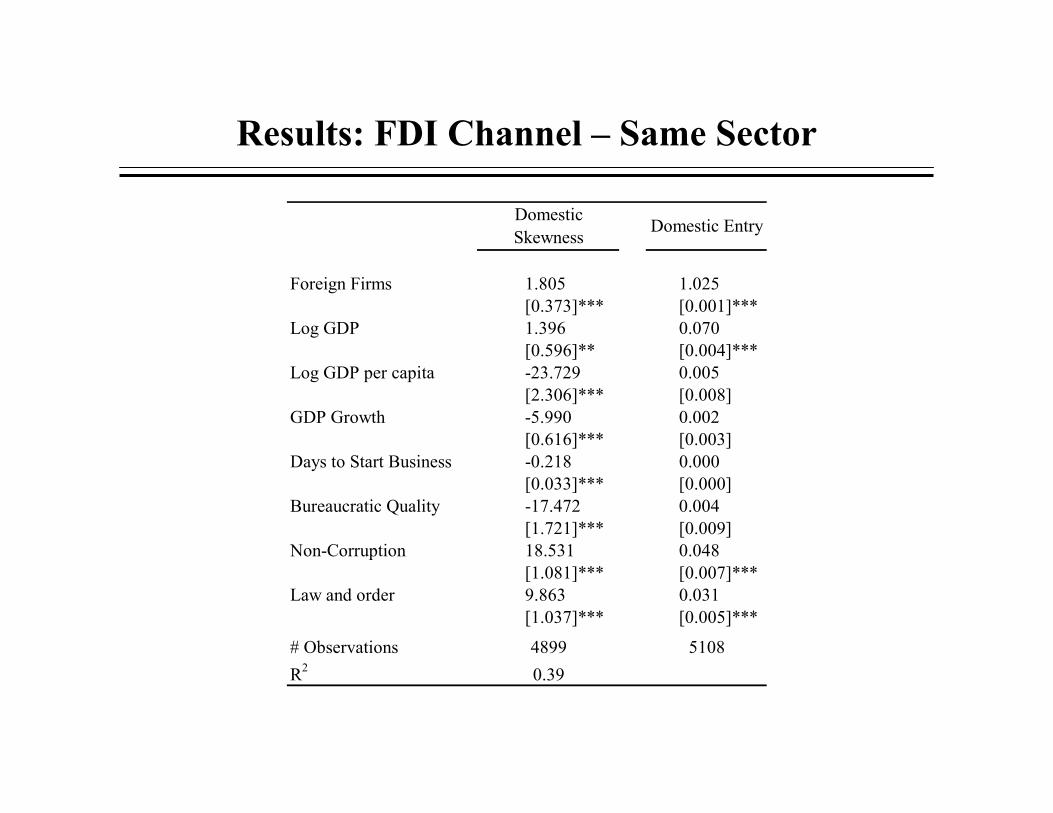
Results: FDI Channel – Same Sector
Domestic Skewness Domestic Entry
Foreign Firms 1.805 1.025[0.373]*** [0.001]***
Log GDP 1.396 0.070[0.596]** [0.004]***
Log GDP per capita -23.729 0.005[2.306]*** [0.008]
GDP Growth -5.990 0.002[0.616]*** [0.003]
Days to Start Business -0.218 0.000[0.033]*** [0.000]
Bureaucratic Quality -17.472 0.004[1.721]*** [0.009]
Non-Corruption 18.531 0.048[1.081]*** [0.007]***
Law and order 9.863 0.031[1.037]*** [0.005]***
# Observations 4899 5108R2 0.39
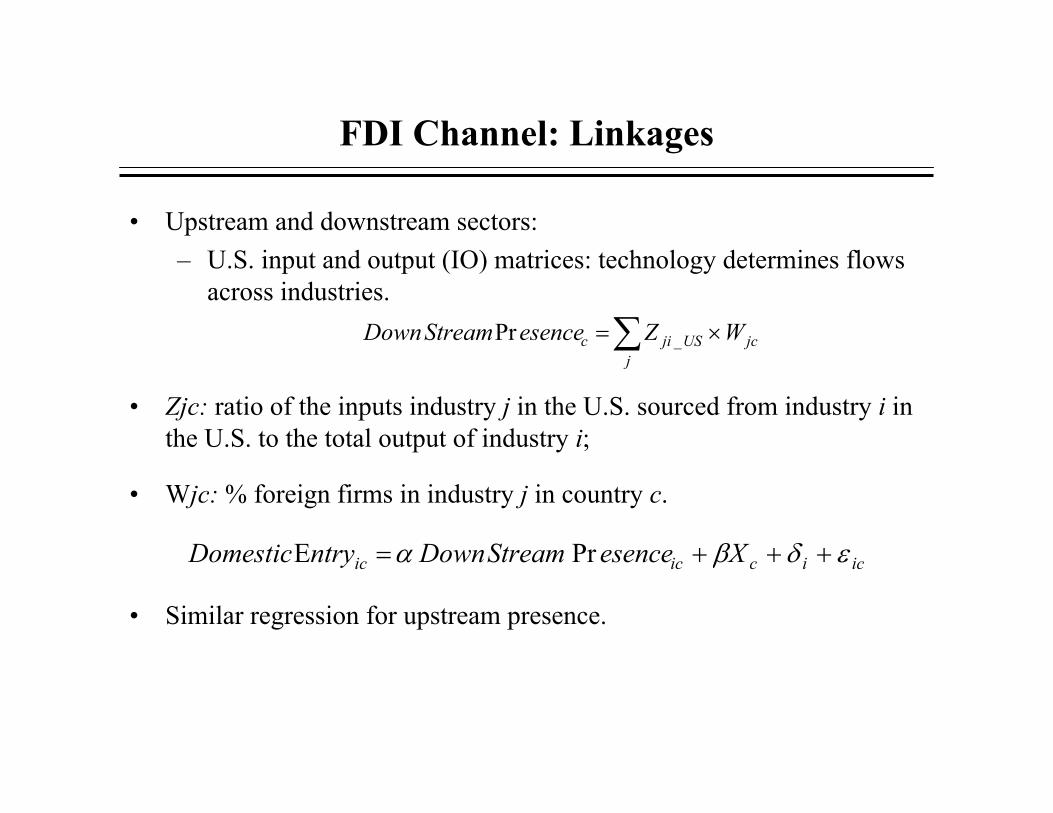
FDI Channel: Linkages
• Upstream and downstream sectors: – U.S. input and output (IO) matrices: technology determines flows
across industries.
• Zjc: ratio of the inputs industry j in the U.S. sourced from industry i in the U.S. to the total output of industry i;
• Wjc: % foreign firms in industry j in country c.
• Similar regression for upstream presence.
∑ ×=j
jcUSjic WZesenceStreamDown _Pr
icicicic XesenceStreamDownntryDomestic εδβα +++=Ε Pr
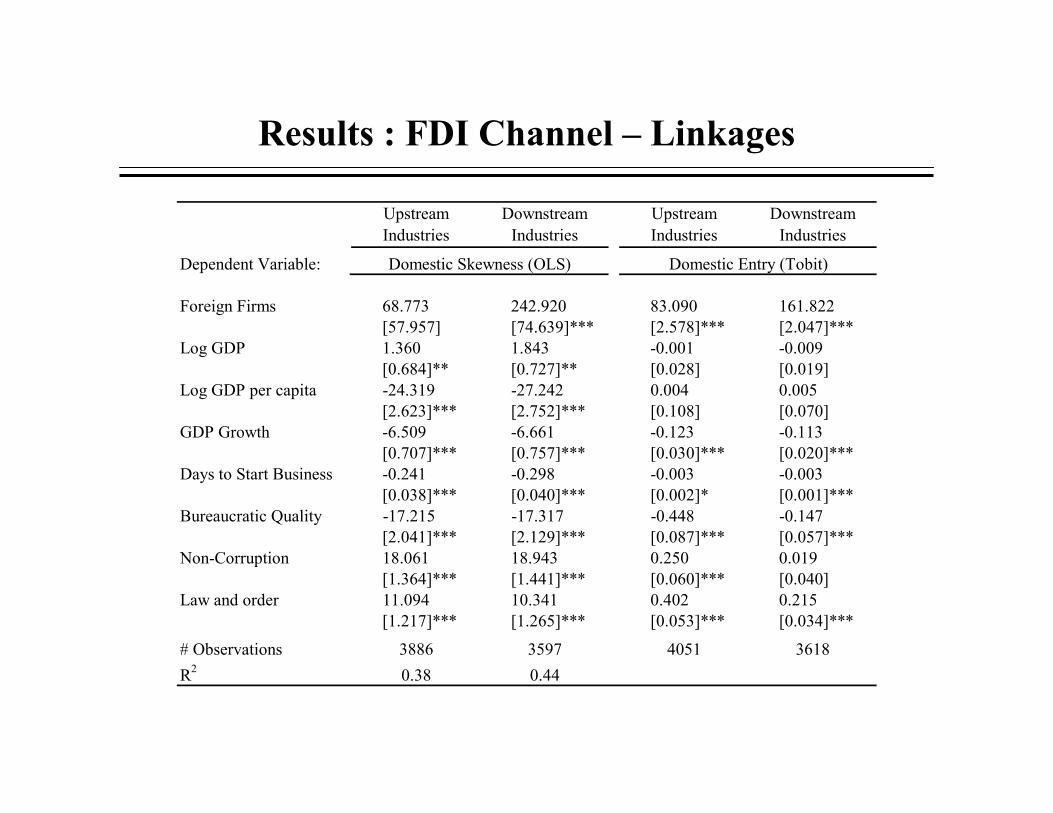
Results : FDI Channel – Linkages
Upstream Industries
Downstream Industries
Upstream Industries
Downstream Industries
Dependent Variable:
Foreign Firms 68.773 242.920 83.090 161.822[57.957] [74.639]*** [2.578]*** [2.047]***
Log GDP 1.360 1.843 -0.001 -0.009[0.684]** [0.727]** [0.028] [0.019]
Log GDP per capita -24.319 -27.242 0.004 0.005[2.623]*** [2.752]*** [0.108] [0.070]
GDP Growth -6.509 -6.661 -0.123 -0.113[0.707]*** [0.757]*** [0.030]*** [0.020]***
Days to Start Business -0.241 -0.298 -0.003 -0.003[0.038]*** [0.040]*** [0.002]* [0.001]***
Bureaucratic Quality -17.215 -17.317 -0.448 -0.147[2.041]*** [2.129]*** [0.087]*** [0.057]***
Non-Corruption 18.061 18.943 0.250 0.019[1.364]*** [1.441]*** [0.060]*** [0.040]
Law and order 11.094 10.341 0.402 0.215[1.217]*** [1.265]*** [0.053]*** [0.034]***
# Observations 3886 3597 4051 3618R2 0.38 0.44
Domestic Skewness (OLS) Domestic Entry (Tobit)
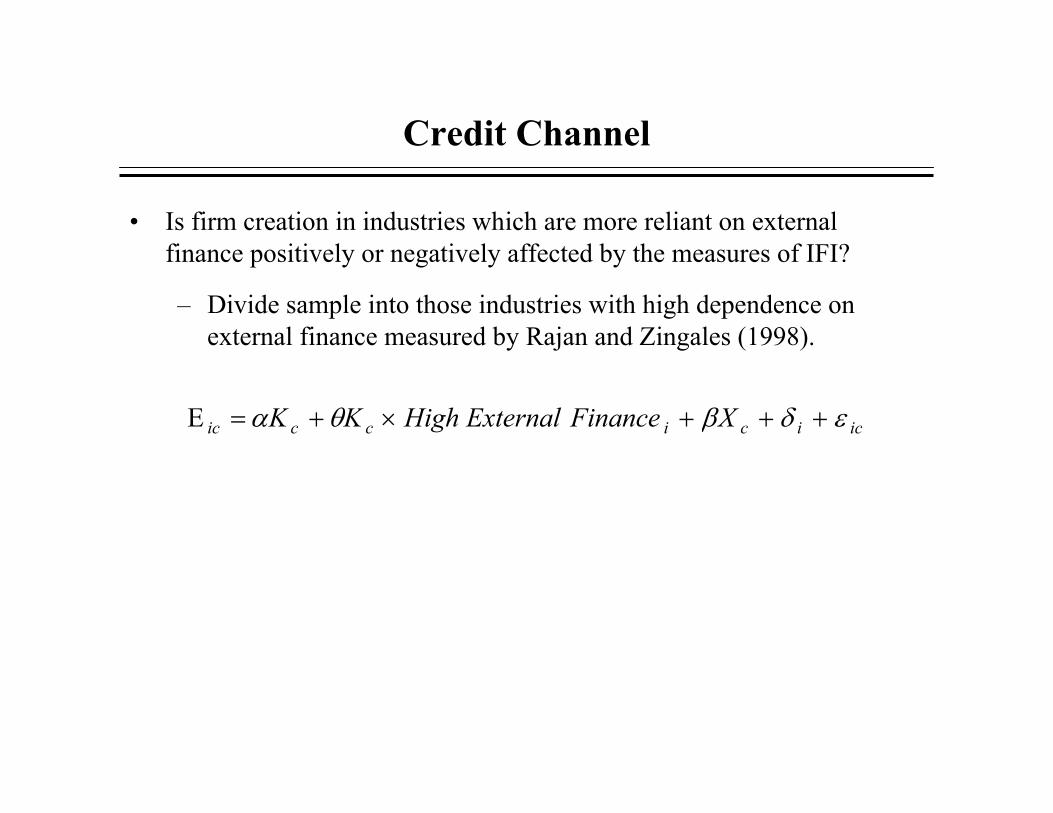
Credit Channel
• Is firm creation in industries which are more reliant on external finance positively or negatively affected by the measures of IFI?
– Divide sample into those industries with high dependence on external finance measured by Rajan and Zingales (1998).
iciciccic XFinanceExternalHighKK εδβθα +++×+=Ε
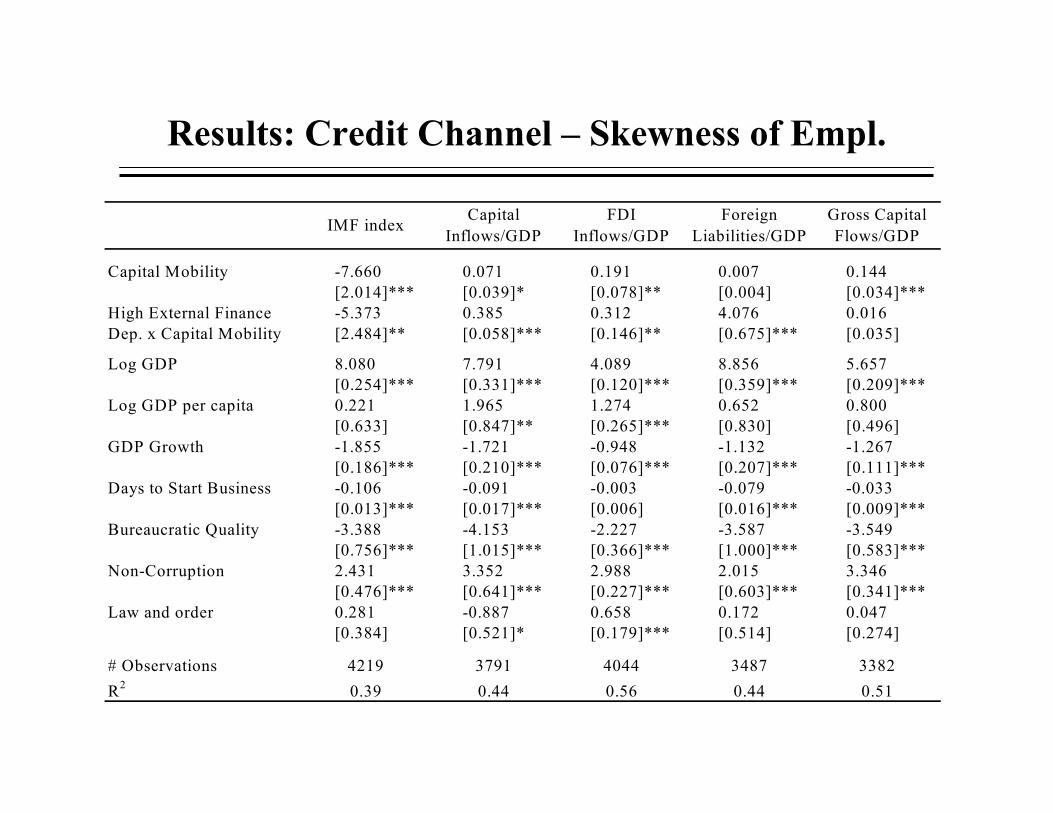
Results: Credit Channel – Skewness of Empl.
IMF index Capital Inflows/GDP
FDI Inflows/GDP
Foreign Liabilities/GDP
Gross Capital Flows/GDP
Capital Mobility -7.660 0.071 0.191 0.007 0.144
[2.014]*** [0.039]* [0.078]** [0.004] [0.034]***High External Finance -5.373 0.385 0.312 4.076 0.016Dep. x Capital Mobility [2.484]** [0.058]*** [0.146]** [0.675]*** [0.035]
Log GDP 8.080 7.791 4.089 8.856 5.657[0.254]*** [0.331]*** [0.120]*** [0.359]*** [0.209]***
Log GDP per capita 0.221 1.965 1.274 0.652 0.800[0.633] [0.847]** [0.265]*** [0.830] [0.496]
GDP Growth -1.855 -1.721 -0.948 -1.132 -1.267[0.186]*** [0.210]*** [0.076]*** [0.207]*** [0.111]***
Days to Start Business -0.106 -0.091 -0.003 -0.079 -0.033[0.013]*** [0.017]*** [0.006] [0.016]*** [0.009]***
Bureaucratic Quality -3.388 -4.153 -2.227 -3.587 -3.549[0.756]*** [1.015]*** [0.366]*** [1.000]*** [0.583]***
Non-Corruption 2.431 3.352 2.988 2.015 3.346[0.476]*** [0.641]*** [0.227]*** [0.603]*** [0.341]***
Law and order 0.281 -0.887 0.658 0.172 0.047[0.384] [0.521]* [0.179]*** [0.514] [0.274]
# Observations 4219 3791 4044 3487 3382R2 0.39 0.44 0.56 0.44 0.51
Conclusions
• Preliminary results: within correlation of capital account integration and entrepreneurship is positive and significant.
– Credit and FDI channel: consistent with evidence.
• Note: our work is silent on growth and welfare.
• More micro firm level data should enhance the general understanding of the process by which the effects of liberalization are transmitted to the real economy.
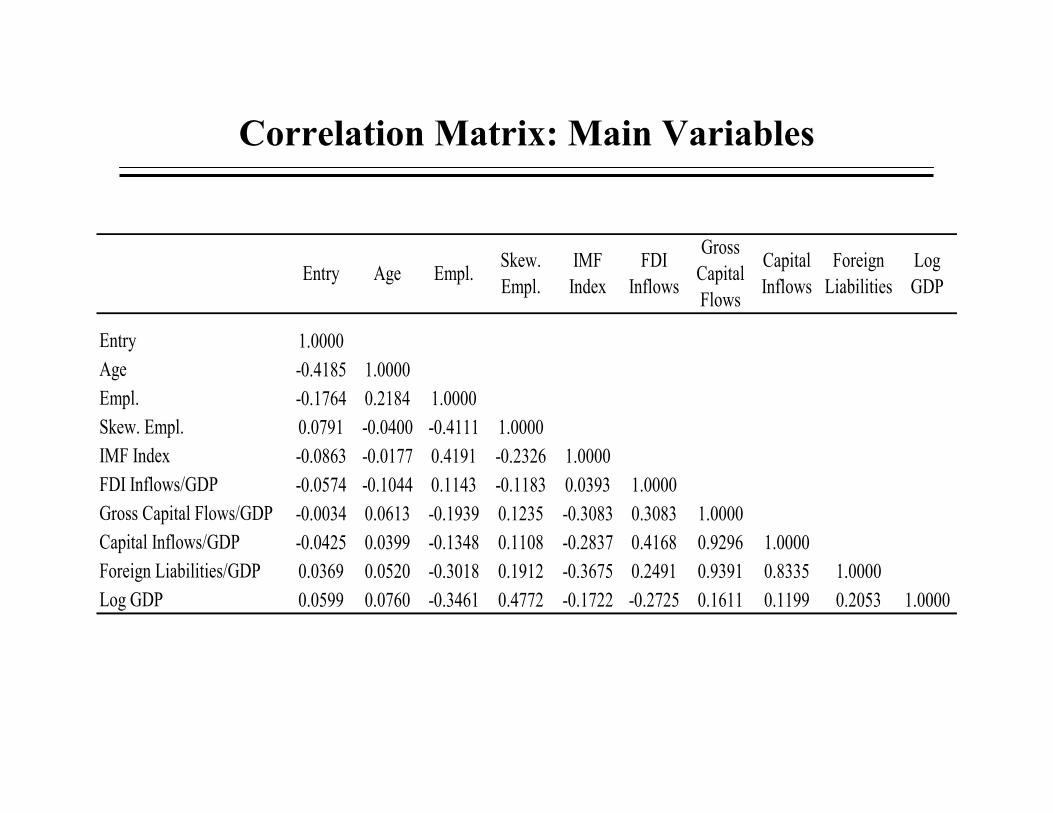
Correlation Matrix: Main Variables
Entry Age Empl. Skew. Empl.
IMF Index
FDI Inflows
Gross Capital Flows
Capital Inflows
Foreign Liabilities
Log GDP
Entry 1.0000Age -0.4185 1.0000Empl. -0.1764 0.2184 1.0000Skew. Empl. 0.0791 -0.0400 -0.4111 1.0000IMF Index -0.0863 -0.0177 0.4191 -0.2326 1.0000FDI Inflows/GDP -0.0574 -0.1044 0.1143 -0.1183 0.0393 1.0000Gross Capital Flows/GDP -0.0034 0.0613 -0.1939 0.1235 -0.3083 0.3083 1.0000Capital Inflows/GDP -0.0425 0.0399 -0.1348 0.1108 -0.2837 0.4168 0.9296 1.0000Foreign Liabilities/GDP 0.0369 0.0520 -0.3018 0.1912 -0.3675 0.2491 0.9391 0.8335 1.0000Log GDP 0.0599 0.0760 -0.3461 0.4772 -0.1722 -0.2725 0.1611 0.1199 0.2053 1.0000
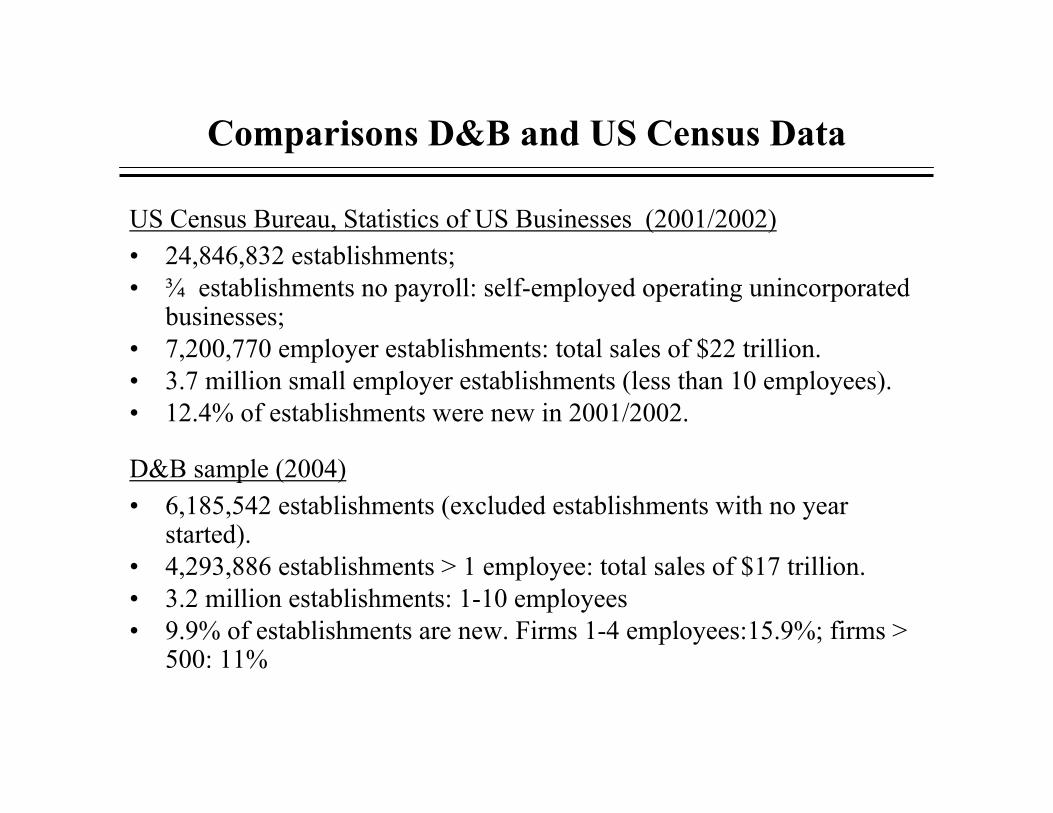
Comparisons D&B and US Census Data
US Census Bureau, Statistics of US Businesses (2001/2002)• 24,846,832 establishments;• ¾ establishments no payroll: self-employed operating unincorporated
businesses;• 7,200,770 employer establishments: total sales of $22 trillion.• 3.7 million small employer establishments (less than 10 employees). • 12.4% of establishments were new in 2001/2002.
D&B sample (2004)• 6,185,542 establishments (excluded establishments with no year
started).• 4,293,886 establishments > 1 employee: total sales of $17 trillion. • 3.2 million establishments: 1-10 employees• 9.9% of establishments are new. Firms 1-4 employees:15.9%; firms >
500: 11%
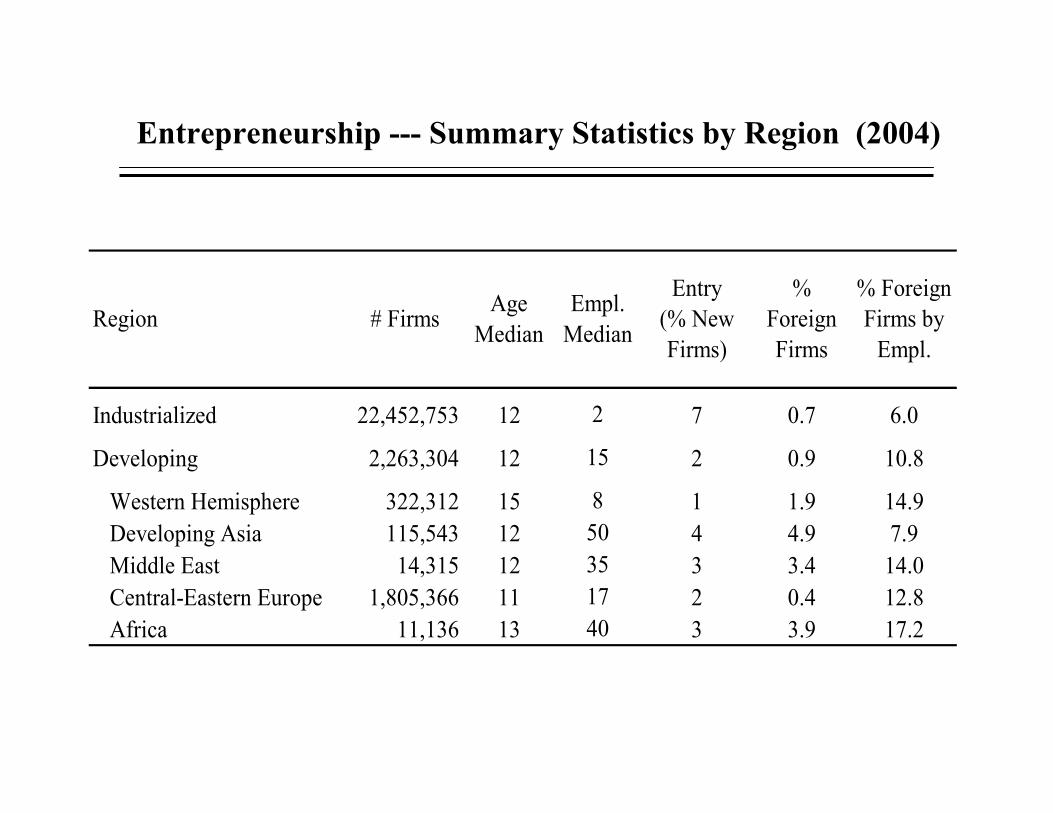
Entrepreneurship --- Summary Statistics by Region (2004)
Region # Firms Age Median
Empl. Median
Entry (% New Firms)
% Foreign Firms
% Foreign Firms by
Empl.
Industrialized 22,452,753 12 2 7 0.7 6.0
Developing 2,263,304 12 15 2 0.9 10.8
Western Hemisphere 322,312 15 8 1 1.9 14.9Developing Asia 115,543 12 50 4 4.9 7.9Middle East 14,315 12 35 3 3.4 14.0Central-Eastern Europe 1,805,366 11 17 2 0.4 12.8Africa 11,136 13 40 3 3.9 17.2
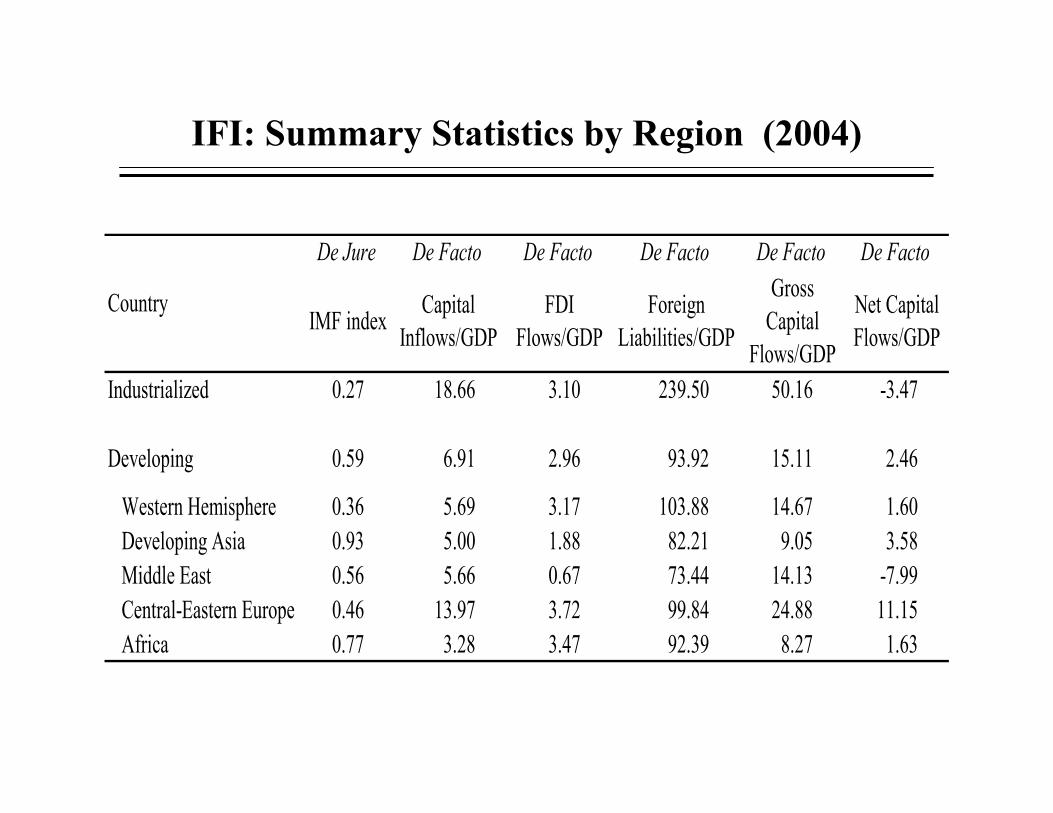
IFI: Summary Statistics by Region (2004)
De Jure De Facto De Facto De Facto De Facto De Facto
IMF index Capital Inflows/GDP
FDI Flows/GDP
Foreign Liabilities/GDP
Gross Capital
Flows/GDP
Net Capital Flows/GDP
Industrialized 0.27 18.66 3.10 239.50 50.16 -3.47
Developing 0.59 6.91 2.96 93.92 15.11 2.46
Western Hemisphere 0.36 5.69 3.17 103.88 14.67 1.60Developing Asia 0.93 5.00 1.88 82.21 9.05 3.58Middle East 0.56 5.66 0.67 73.44 14.13 -7.99Central-Eastern Europe 0.46 13.97 3.72 99.84 24.88 11.15Africa 0.77 3.28 3.47 92.39 8.27 1.63
Country

Entrepreneurship and IFI: Size Log Employ (OLS/Weighted)
IMF index Capital Inflows/GDP
FDI Inflows/GDP
Foreign Liabilities/GDP
Gross Capital Flows/GDP
Capital Mobility 0.518 -0.064 -0.006 -0.010 -0.020[0.232]** [0.019]*** [0.055] [0.004]*** [0.009]**
Log GDP 0.001 -0.037 0.124 -0.041 -0.020[0.054] [0.057] [0.110] [0.075] [0.094]
Log GDP per capita -0.102 -0.571 -1.835 -1.133 -1.777[0.103] [0.187]*** [0.464]*** [0.339]*** [0.418]***
GDP Growth 0.143 0.104 0.048 -0.042 -0.011[0.030]*** [0.050]** [0.083] [0.093] [0.073]
Days to Start Business 0.001 0.005 -0.005 0.000 -0.007[0.003] [0.004] [0.008] [0.005] [0.007]
Bureaucratic Quality -0.027 0.462 1.557 0.496 1.878[0.131] [0.251]* [0.434]*** [0.224]** [0.380]***
Non-Corruption -0.467 -0.537 -0.317 -0.002 -0.297[0.083]*** [0.134]*** [0.242] [0.205] [0.208]
Law and order 0.020 0.203 -0.060 0.262 -0.213[0.066] [0.101]** [0.196] [0.127]** [0.175]
# Observations 5625 4644 5570 4470 4445R2 0.48 0.67 0.69 0.81 0.75
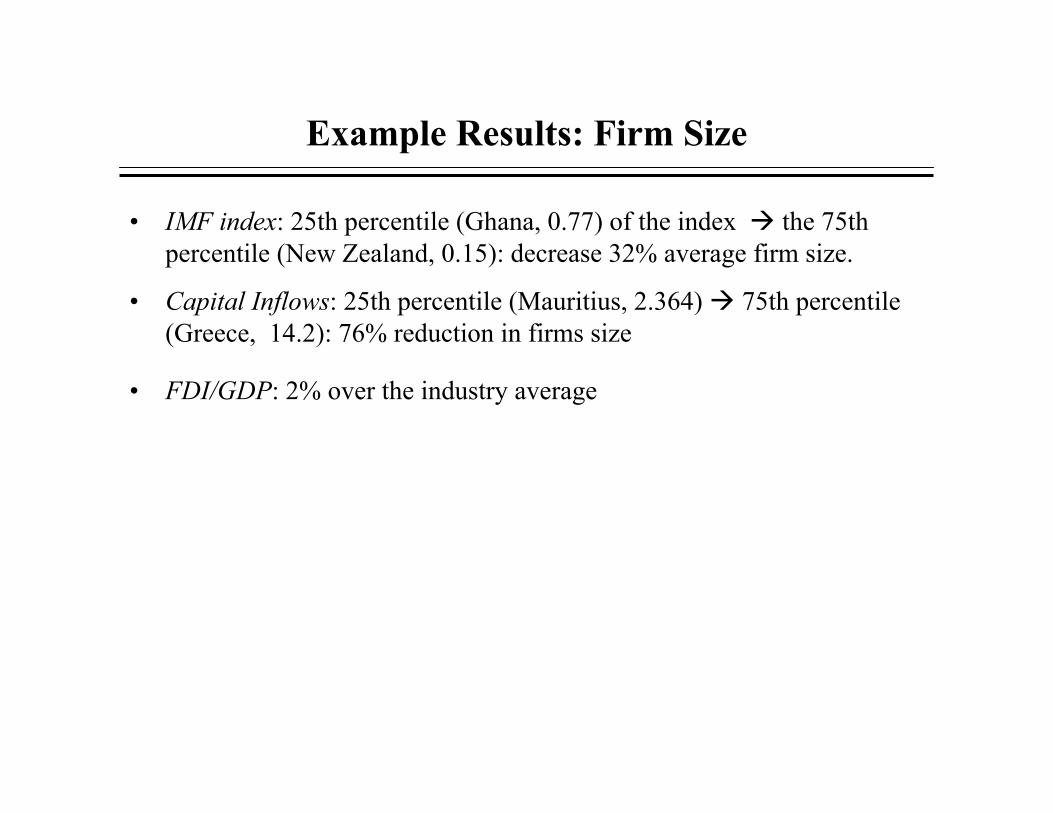
Example Results: Firm Size
• IMF index: 25th percentile (Ghana, 0.77) of the index the 75th percentile (New Zealand, 0.15): decrease 32% average firm size.
• Capital Inflows: 25th percentile (Mauritius, 2.364) 75th percentile (Greece, 14.2): 76% reduction in firms size
• FDI/GDP: 2% over the industry average
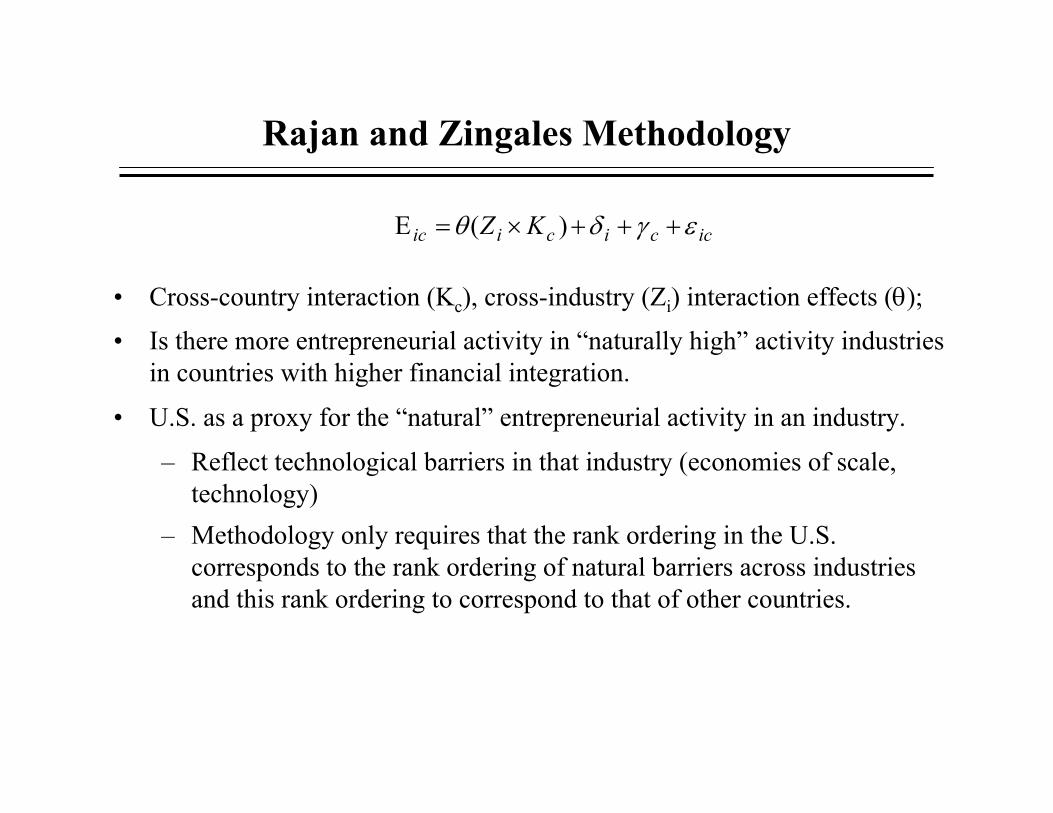
Rajan and Zingales Methodology
• Cross-country interaction (Kc), cross-industry (Zi) interaction effects (θ);
• Is there more entrepreneurial activity in “naturally high” activity industries in countries with higher financial integration.
• U.S. as a proxy for the “natural” entrepreneurial activity in an industry.
– Reflect technological barriers in that industry (economies of scale, technology)
– Methodology only requires that the rank ordering in the U.S. corresponds to the rank ordering of natural barriers across industries and this rank ordering to correspond to that of other countries.
icciciic KZ εγδθ +++×=Ε )(
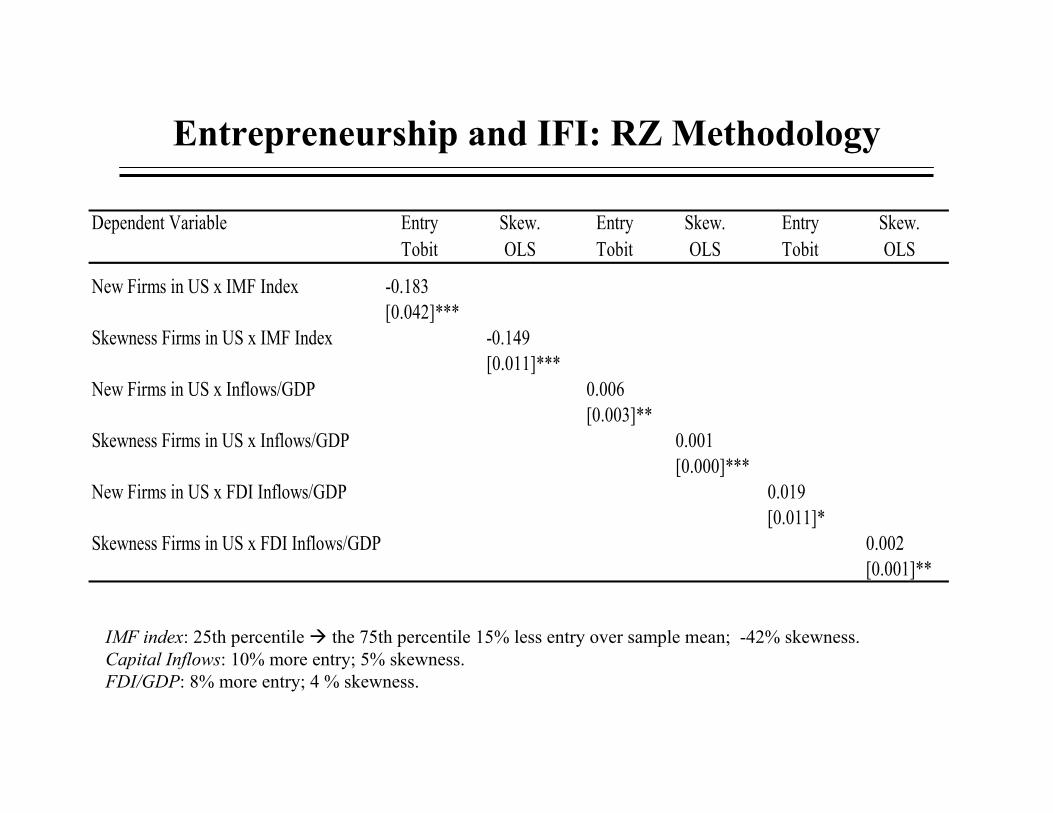
Entrepreneurship and IFI: RZ Methodology
IMF index: 25th percentile the 75th percentile 15% less entry over sample mean; -42% skewness.Capital Inflows: 10% more entry; 5% skewness.FDI/GDP: 8% more entry; 4 % skewness.
Dependent Variable Entry Skew. Entry Skew. Entry Skew.Tobit OLS Tobit OLS Tobit OLS
New Firms in US x IMF Index -0.183[0.042]***
Skewness Firms in US x IMF Index -0.149[0.011]***
New Firms in US x Inflows/GDP 0.006[0.003]**
Skewness Firms in US x Inflows/GDP 0.001[0.000]***
New Firms in US x FDI Inflows/GDP 0.019[0.011]*
Skewness Firms in US x FDI Inflows/GDP 0.002[0.001]**