Embed Size (px)
Citation preview

Sevastopol
Ukraine
29th June 2012
International Forum of ceramic
tile manufacturers' associations

Who are Sibelco?
1872
Founded
228
Production
sites
41
Countries
5 Contintents
€2bn Turnover
10,000 Employees

Who are Sibelco?
Five decentralised yet co ordinated operating regions

Who are Sibelco?
Products
123 plants
Silica
Calcium
Feldspar
Olivine
Clay & Kaolin
Recycled Materials
Mineral Sands
Other Minerals
Other Products

What do we do?
Commercial
Electronic
Construction
& Engineering
Functional
fillers
Metals/
Castings Energy
Ceramics
Glass
Industrial
Markets

What do we do?
Silica sand and flour
Crisotbalite
Frac sand & resin coated sand
High purity quartz (HPQ)
Clay & Kaolin
Feldspar & Nepheline
Lime & Limestone
GCC & PCC
Olivine
Glass cullet
Mineral sands
Barytes
Wollastonite
Manganese dioxide
Chromite
Aluminium hydroxide

Glass
Industrial
Commercial
Electronic
Construction
& Engineering
Functional
fillers
Metals/
Castings
Energy
Ceramics
What do we do?

What do we do?
Silica sand
and flour
Plastic Clay
& Kaolin
Feldspar
& nepheline
Mineral sands
Wollastonite
Manganese dioxide
Chromite
Ceramics

Glass
Industrial
Commercial
Electronic
Construction
& Engineering
Functional
fillers
Metals/
Castings
Energy
Ceramics
Who do we do it for?

What does Sibelco Ukraine do?
Core
Applications
Ceramics
Glass
Foundry
Functional Fillers
Core
Minerals Silicas
Plastic Clays
Ceramic Bodies/ Composites
+ Group Portfolio
400 K Tonnes
silica
1 200 K Tonnes
Plastic Clay
300 Customers
21 Destinations
€ 45 M Turnover

Where do our products come from?
0 100 200 300 400 500km
DONETSK
Dnieper-Donets Depression
Primary kaolin
Secondary kaolin
Crystalline shield
Ball (plastic) clay
Silica: Our Novoselovsky silica plant is
located near Kharkiv
Plastic Clay & Prepared
Body: Body plants is located in Slavyansk
with our composite located in
Mertsalovo
Geology of Ukraine plastic clay desposits for tiles: • The highest quality deposits are limited to the Donetsk Oblast (region)
• They are from the Miocene age (~12 million years old)
• Clay sequence is from 1.5 to 5m thick and consists of 4 or 5 seams or layers and
extends over an area of 60km x 25km
• Total Sibelco reserves and resources of clay 46 million t

Why
Sibelco clays
for Tiles
?

Ukrainian Plastic Clay Production
Pre Planned Extraction & Quality optimistation
• At Sibelco, product quality is
taken very seriously, control starts whilst the
minerals are still in the
ground
extensive geological mapping
and resource planning pre
extraction
Planned operating to ensure
longevity and consistent
supply can be maintained

Ukrainian Plastic Clay Production
High Reserves & global resources
• Total reserves & resources of
plastic clay @ 46 Million t
• Total reserves & resources of
sand > 23.% Million t

Ukrainian Plastic Clay Production
Exploration & evaluation of mineral quality
• Extensive geological surveys
map the quality of the minerals
before & during extraction Improves selection &
blending
Maximises end product
quality

Ukrainian Plastic Clay Production
Controlled mineral extraction
• Excavator’s are used to carefully
extract each seam or clay
selection
• The key clay selection criteria
are Al2O3 and Fe2O3 content
• Up to 10 different selections are
extracted & stored separately at
Mertsalovo (16km from quarries)
• The clay benches are regularly
sampled for chemical analysis to
determine the quality of the clay
selections

Ukrainian Plastic Clay Production
Blending and storage
• Quality assurance continues
throughout the various
blending and processing
stages

Fired
Properties
Plastic Clay Analysis & Selection
Why have good mineral QC?
Quality
Product
XRD
Rheology XRF
PSA
> 125µm
Surface
Area
Strength
Carbon
Materials effect end manufacturing
process efficiency
Preparation
Forming
Drying & Firing
Finished product quality
Routine Quality Control
Quality
Assurance
Yield Productivity Product Quality

Innovation
Sibelco has a culture of innovation and actively uses customer
collaboration to develop new ways of working

Resources
Energy
Environment
More
For
Less
Industrial Mega Trends
We actively identify future mega trends and develop new
solutions to address them

Resources
In-process Recycling
Longevity of supply
Use of External
waste streams’
Efficient use of
Raw Materials

Continuous
Improvement
Yield
Improvement
Cost Reduction
Best Quality
More
For
Less

Recycling
Environment
Local Solutions
Carbon Dioxide Emissions Linked to Resources

Reduction in Use
Reduction in Cost
Reduction in
Carbon Dioxide
Energy

Case
Study
1
Examples of Addressing the
Mega Trends Using Ukrainian Clay
Mega Trends
More for Less Environment Resources Energy
Case
Study
2
Case
Study
3
YIELD IMPROVEMENT
IMPROVED ENVIRONMENT
REDUCED ENERGY

Laboratories and Technical Network
We have an extensive network of Technical Centres in each of
the key regions which we use for customer projects

Technical support
Foundry
Functional Filler
Structural
Cement
Tile
Water Filtration
Sanitaryware
Sports Surface
Glass
Glaze/Englobe

Case Study 1 – YIELD IMPROVEMENT
Profit Model - Traditional
CostsVolumePriceProfit
In most manufacturing industries, focus is given to reducing
costs as a way to improving profits

Manufacturing Focus
Profit Model - Revised
Costs
YieldfProfit
In the ceramics industry most factories have the opportunity to
improve the yield which does have a greater impact on the
manufacturing EBIT, but is quite often overlooked.

An Example from India
Before
m2 produced 1,000,000
Yield 79%
Saleable m2 790,000
Av. Selling Price/m2 $3.50
Sales Revenue $2,765,000
Body Cost / Tonne $60.00
Body Cost / Year $1,320,000
Sales Revenue – Body Costs
$1,445,000
After Body Development
m2 produced 1,000,000
Yield 90%
Saleable m2 900,000
Av. Selling Price/m2 $3.50
Sales Revenue $3,150,000
Body Cost / Tonne $68.00
Body Cost / Year $1,496,000
Sales Revenue – Body Costs
$1,654,000
Financial Benefit $209,000
~10% Raw Material Cost
Reduction
m2 produced 1,000,000
Yield 79%
Saleable m2 790,000
Av. Selling Price/m2 $3.50
Sales Revenue $2,765,000
Body Cost / Tonne $54.00
Body Cost / Year $1,188,000
Sales Revenue – Body Costs
$1,577,000
Financial Benefit $132,000
Now Consider the Impact of
Reducing ALL of The Body Raw
Materials by Approximately 10%
Finally; Consider the Impact of
Using High Quality Sibelco
Materials to Optimise the
Factory Yield – (With Increased
Raw Material Costs)
By reformulating the customers body using a reasonably small
amount of Ukrainian DBK-1, the yield was significantly improved

Acheived By?
Low impurities
Batch to Batch Consistency
Lower Shrinkage
Stable Firing
Improved Slip Rheology
Improved Milling
Better Spray-drying
Consistent Pressing

Case Study 2 - ENVIRONMENTAL
Whilst the towards thinner format tiles has enabled tile
producers to enter new markets; the technology also offers
environmental benefits to the supply chain by reducing the
amount of raw material required and the mass per square metre
of product

0
4
8
12
0 0.02 0.04 0.06 0.08 0.1
Gre
en
MO
R / k
g/c
m2
Deformation
Original DBY-4
An Example from Europe
By changing to Sibelco Ukraine DBY-4, the customer was able to
produce high quality large format 3mm tile sheets due to
improved plasticity
Toughness (T) is the ability of a material to absorb energy before rupturing
T = 𝟏
𝟐 𝝈𝜺 (
𝑱
𝒎𝟑)

Acheived By?
Low impurities
Batch to Batch Consistency
Lower Shrinkage Stable Firing
High Strength
Consistent Pressing
Improved Plasticity

Case Study 3 - ENERGY REDUCTION
The largest impact on manufacturing energy reduction can be
achieved by focusing on Spray-Drying and Firing
200; 3%
1590; 25%
21; 0%
1000; 15%
3350; 52%
313; 5%
Energy Required to produce 1 kilogram of tile body / kJ/kg
Milling
Spray-drying
Glazing
Drying
Firing
Packaging

Market example for Brazil
Gas
Slip
Water
Traditional Formulation
Slip Density = 1.67 g/cm3
Gas Consumption = 44.8 m3/t
Cost per m2 = 0.423$
Using Ukrainian Clay
Slip Density = 1.75 g/cm3
Gas Consumption = 35.7 m3/t
Cost per m2 = 0.337$
It might not appear to be significant, but the raw material costs
were the same delivered and per year equates to a saving of
86,000$ for 1 million m3 production; before considering the other
benefits of Ukrainian clay!
Example; Spray-dryer

% W
ate
r A
bso
rpti
on
Market example for India
By Replacing the local bentonitic clay we were able to reduce the
required heatwork, allowing for faster kiln throughput and
increased production
Example; Firing

Acheived By?
Low impurities
Batch to Batch Consistency
Lower Shrinkage
Stable Firing
Improved Slip Rheology
Improved Milling
More Efficient Spray-drying
Higher Alkali Content

The Technical Bit!
- What Makes Ukrainian Clay Unique?

Introduction – Plastic Clay
Westerwald,
Germany
Donbas,
Ukraine
Devon,
UK
Bikaner,
India
Traditionally:
UK used for sanitaryware with some tile
Germany used for tiles and structural
Ukraine used for tile

Chemistry of the Samples
SiO2 Al2O3 Fe2O3 TiO2 K2O Na2O L.O.I
Indian Plastic Clay
54.0 30.5 1.3 1.4 0.4 0.6 11.3
UK
(Premiere HV) 60.7 26.3 0.9 1.5 2.6 0.4 7.2
Germany
(FT-1513) 64.8 22.8 1.0 1.4 2.0 0.3 7.1
Ukraine
(DBK-0) 60.0 26.6 1.0 1.4 2.43 0.5 7.3
All of these four plastic clays have similar chemistries and all are
used for tile manufacture

XRD
Braggs’ Law
sin.2
.nd
Let us compare the four clay minerals
using a technique known as X-Ray
Diffraction to examine the structure
XRD Patterns
Sqrt
(C
ounts
)
0
10
100
1000
200
300
400
500
600
2000
3000
4000
5000
6000
7000
8000
9000
2-Theta - Scale
3 10 20 30 40 50 60 70
Green = UK Plastic Clay Blend
Red = UA Plastic Clay Blend
Blue = DE Plastic Clay Blend
Orange = IN Plastic Clay
The traces produced from the instrument
of the four clay blends appear to be very
similar at first glance

Mineral Phases
Lin
(C
ou
nts
)
0
1000
2000
3000
4000
5000
6000
2-Theta - Scale
3 10 20 30
M F
K
M
Q
Q
K
K
Green = UK Plastic Clay Blend
Red = UA Plastic Clay Blend
Blue = DE Plastic Clay Blend
Orange = IN Plastic Clay
M = Muscovite Mica
K = Kaolinite
Q = Quartz
F = Feldspar
Fitting peaks to the patterns shows
all four clay blends to compose of
Quartz, kaolinite and Mica (Illite),
and possibly feldspar

Quartz and Feldspar - Introduction
Comment:
Quartz – is an ancillary mineral, present
from the initial silicate rock the plastic clay
was formed from and not removed during
subsequent geological or mineral
processing
None clay minerals
found in plastic clay
Feldspar – In general, the ‘clay’ minerals are
produced by the geological weathering of
feldspar. Some feldspar is not converted and
therefore remains in the plastic clay

Quartz S
qrt
(C
ou
nts
)
0
10
100
1000
200
300
400
500
600
2000
3000
4000
5000
6000
7000
8000
9000
10000
2-Theta - Scale
20.3 21 22 23 24 25 26 27 28 29 30
Quartz
Quartz
Green = UK Plastic Clay Blend
Red = UA Plastic Clay Blend
Blue = DE Plastic Clay Blend
Orange = IN Plastic Clay
It can be seen that
the Indian clay
has less quartz
than the German
and Ukrainian,
which all have
similar quartz
content, UK is in
between

Kaolinite - Introduction
Pure crystals of kaolinite
Kaolinite stacks as found in
primary natural deposits
Kaolinite typical of Plastic clay
kaolinite primarily forms during the
hydrothermal alteration or
weathering of feldspars under acid
conditions

Kaolinite (1)
Sq
rt (
Co
un
ts)
0
10
100
1000
200
300
400
500
600
2000
3000
4000
5000
6000
7000
8000
9000
10000
2-Theta - Scale
11 12 13 14 15 16 17 18 19 20 21 22 23 24 25 26 27 28
Green = UK Plastic Clay Blend
Red = UA Plastic Clay Blend
Blue = DE Plastic Clay Blend
Orange = IN Plastic Clay
Concentrating on the group of
kaolinite peaks between 19 and 23
degrees 2 theta
Kaolinite (2)
Sq
rt (C
ou
nts
)
0
10
100
1000
200
300
400
500
600
2000
2-Theta - Scale
18.6 19 20 21 22
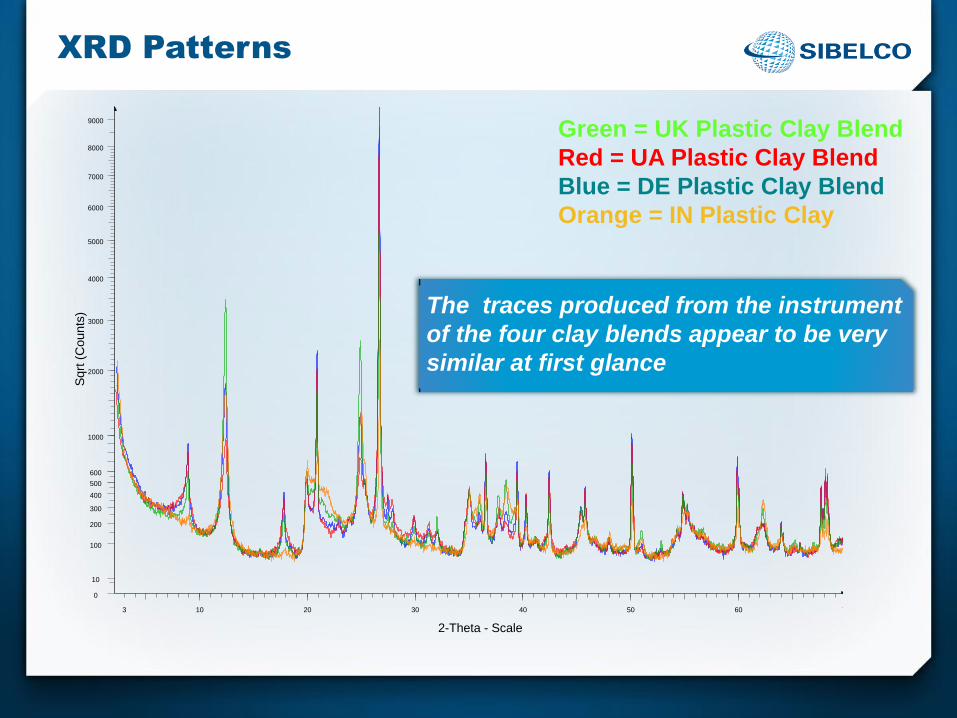
Green = UK Plastic Clay Blend
Red = UA Plastic Clay Blend
Blue = DE Plastic Clay Blend
Orange = IN Plastic Clay
The definition of the pattern
and ‘loss’ of kaolinite peaks
indicates the order of the
kaolinite in the sample; edge
damage, stack dislocation and
size all affect the pattern.
The UK clay is moderately
disordered, whereas the Indian,
German and Ukrainian clays
are very disordered

Mica/Illite - Introduction 10 A
Muscovite and Illite have similar However,
illite has on average slightly more Si, Mg,
Fe, and water and slightly less tetrahedral
Al and interlayer K than muscovite. The
weaker interlayer forces caused by fewer
interlayer cations in illite also allow for
more variability in the manner of stacking
and thus to different properties
Illites form by the
weathering of
silicates (primarily
feldspar), through
the alteration of
other clay minerals,
and during the
degradation of
muscovite

Mica/Illite
Sqrt
(C
ounts
)
0
10
100
1000
200
300
400
500
600
2000
3000
4000
2-Theta - Scale
7.4 8 9 10 11 12 13 14 15 16 17 18 19
Mica
Mica
Green = UK Plastic Clay Blend
Red = UA Plastic Clay Blend
Blue = DE Plastic Clay Blend
Orange = IN Plastic Clay
The ratio of the mica peak area at
17.7 versus 8.9 gives an idea of how
illitic the mica is
Muscovite = 1:3.2, UK = 1:2.5, UA = 1:2.2, DE = 1:2.0

Smectite
17 A
Smectites commonly result from the
weathering of basic rocks and clays.
Smectite formation is favoured by level to
gently sloping terrains that are poorly
drained, mildly alkaline, and have the high
Si and Mg potentials.

Smectite
Sqrt
(C
ounts
)
0
10
100
1000
200
300
400
500
600
2000
3000
4000
2-Theta - Scale
2.2 3 4 5 6 7 8 9 10 11 12 13
Green = UK Plastic Clay Blend
Red = UA Plastic Clay Blend
Blue = DE Plastic Clay Blend
Orange = IN Plastic Clay
Glycolating the samples and re-
running the XRD at low angle
reveals the presence of any
expandable smectite

Smectite – United Kingdom S
qrt (C
ou
nts)
0
10
100
1000
200
300
400
500
600
2000
3000
4000
5000
6000
2-Theta - Scale
2.2 3 4 5 6 7 8 9 10 11 12 13 14 15
17 A
ng
str
om
s
On glycolation a small peak appears,
showing that this clay blend contains a
small amount of expandable smectite
(montmorillonite):
It is the combination of this phase along
with the moderately disordered kaolinite
and moderately illitic mica that gives the
UK clay some of its rheological properties

Smectite - India S
qrt (C
ou
nts)
0
10
100
1000
200
300
400
500
600
2000
3000
4000
5000
2-Theta - Scale
2.1 3 4 5 6 7 8 9 10 11 12 13 14 15 16
17 A
ng
str
om
s
A definite peak appears at 17 angstroms
on glycolation revealing the presence of
significant amounts of smectite
It is predominantly this phase that is
responsible for the rheological behavior
and plasticity of this clay

Smectite - Germany S
qrt (C
ou
nts)
0
10
100
1000
200
300
400
500
600
2000
3000
4000
5000
6000
2-Theta - Scale
2.2 3 4 5 6 7 8 9 10 11 12 13 14 15
17 A
ng
str
om
s
Possibly a small amount of smectite is
present.
The main phases responsible for the
rheological behavior and plasticity are the
disordered kaolinite and illite content

Smectite - Ukraine S
qrt (C
ou
nts)
0
10
100
1000
200
300
400
500
600
2000
3000
4000
5000
6000
2-Theta - Scale
2.2 3 4 5 6 7 8 9 10 11 12 13 14 15
13.5
An
gstr
om
s
27 A
ng
str
om
s
10 A
ng
str
om
s
On glycolation the mica peak at 10
Angstroms sharpens and new peaks
appear at 27 and 13.5 Angstroms. These
peaks are thought to be the 001 and 002
reflections of a illite-smectite mixed layer
mineral.
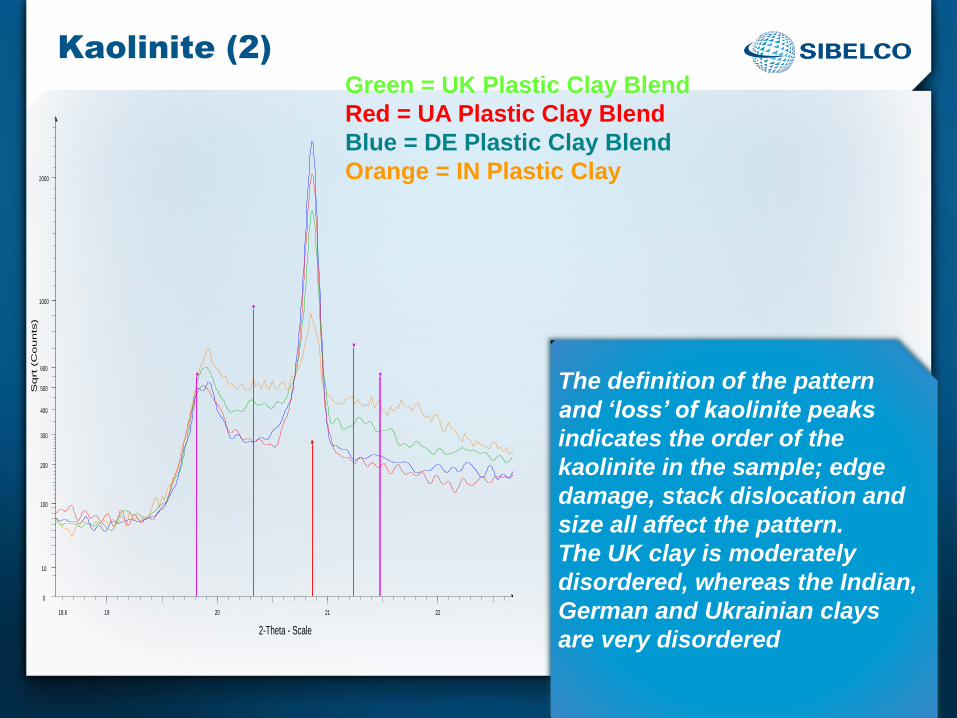
Mixed Layer Mineral
Illite Illite - Smectite
10 A
10 A
17 A
27 A
Along with the highly
disordered kaolinite, it is this
material that is responsible
for the rheological properties
and plastic nature of the
Ukrainian clay
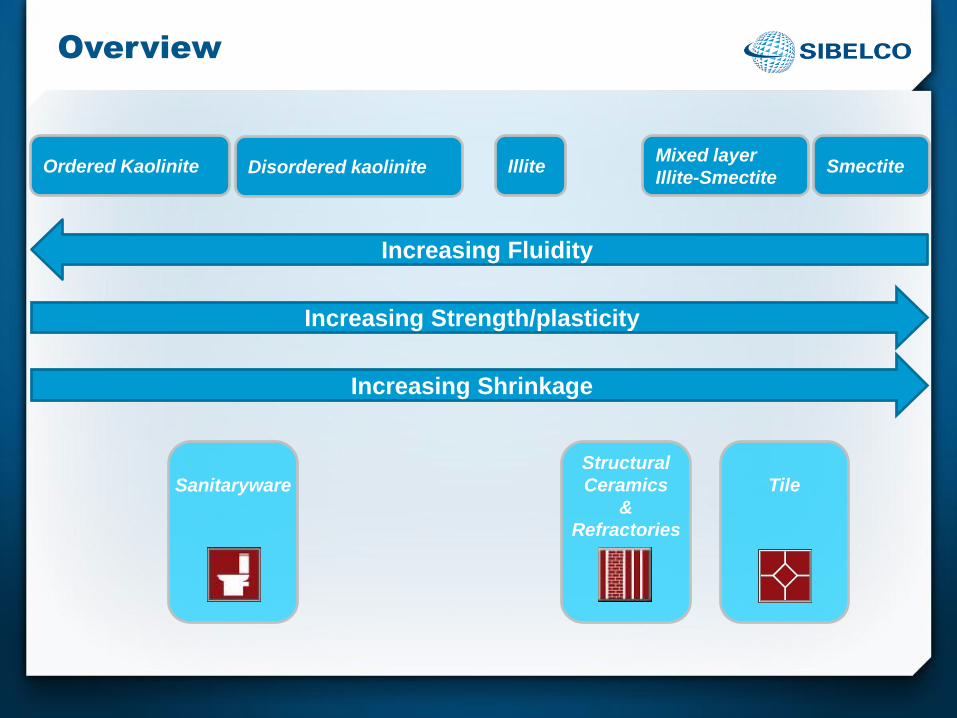
Overview
Ordered Kaolinite Disordered kaolinite Illite Smectite
Tile
Sanitaryware
Structural
Ceramics
&
Refractories
Mixed layer
Illite-Smectite
Increasing Shrinkage
Increasing Fluidity
Increasing Strength/plasticity

Most clay deposits have subtle differences in clay mineralogy, which give rise
to unique properties. In the case of the Ukrainian plastic clay it is a mixed
layer illite-smectite phase, coupled with disordered kaolinite and low iron
which are responsible for its superior properties for vitreous tile manufacture:
• Highly Plastic
• Reasonable Shrinkage
• White Firing
• Good Vitrification
Summary

Thank You For Your Attention