Embed Size (px)
Citation preview

International Higher Education Student Flows
Final Report
June 2019

Nous Group | International Higher Education Student Flows | i |
Project funder
This project is supported by the Australian International Education: Enabling Growth and Innovation
program project fund, Department of Education and Training.
For further information, please visit the website www.internationaleducation.gov.au or
www.education.gov.au
Acknowledgements
The project team would like to acknowledge the members of the project Steering Committee for their
contribution to the direction of the project. The following individuals were members of the Steering
Committee during the course of the project:
• Kadi Taylor, Navitas (Co-Chair)
• Rebecca Hall, Austrade (Co-Chair)
• Conor King, Innovative Research Universities
• Steve Nerlich, Department of Education and Training
• Vanessa Lao, Study Queensland
• Susy Trier, Study Queensland
• Darragh Murray, Navitas
• Amy Godfrey, Austrade
• Tim Praill, Navitas
International data agencies
The following global international education agencies have provided access to data and information to
support the project:
• Department of Education, Australia
• Statistics Canada
• Higher Education Authority, Ireland
• Higher Education Statistics Agency, UK
• German Centre for Higher Education Research and Science Studies
• Council on Higher Education, South Africa
• Campus France.
Nous Group | International Higher Education Student Flows | ii |
Contents
1 Introduction ..................................................................................................................................................................................... 1
2 Existing data available ................................................................................................................................................................. 3
3 Insights on global student flows............................................................................................................................................. 4
3.1 International student mobility has enjoyed a period of sustained growth .................................................... 4
3.2 US, UK and Australia are dominant destination countries, but new countries are emerging ................ 5
3.3 China is the key source country globally, but India and Nigeria have both grown .................................... 5
3.4 Key source country to key destination country flows make up a large share of all global student
mobility .................................................................................................................................................................................................. 6
3.5 Three standalone case studies have provided further depth of insight .......................................................... 7
3.6 A public tool has also been developed to allow users to explore global student flows ....................... 11
4 Approach and methodology ................................................................................................................................................. 12
4.1 Approach adopted.............................................................................................................................................................. 12
4.2 Data integration methodology ...................................................................................................................................... 13
4.2.1 Proposed integration approach ......................................................................................................................... 13
4.2.2 Challenges with approach .................................................................................................................................... 13
4.2.3 Revised integration methodology ..................................................................................................................... 15
5 Insights on global data available ......................................................................................................................................... 16
5.1 There are limitations with the accuracy of the UNESCO global student mobility data ......................... 16
5.2 Definitional differences exist across key global sources that can make comparison difficult ............. 17
5.3 Project Atlas is a valuable resource but there are some limitations .............................................................. 19
5.4 There is limited understanding of when data is current ..................................................................................... 20
Assessment of national data available globally ......................................................................................... 1
Gaps in UNESCO country-to-country reporting ....................................................................................... 1
Definitional differences between UNESCO and OECD ........................................................................... 3

Nous Group | International Higher Education Student Flows | 1 |
1 Introduction
This report has been prepared as part of the project ‘International Higher Education Student Flows via
Global Data Integration’. The project is supported by the ‘Enabling Growth and Innovation’ programme
under the National Strategy for International Education 2025.
The project has focused on integrating disparate sources of international higher education data to better
understand the macro-trends in global student mobility from source countries to major destination
countries and gain greater insight on the trends in the global higher education sector.
The importance of data in the international education and training sector has also been raised in many
contexts. Multiple sector-specific reports, including Australian Trade and Investment Commission’s
Australian International Education 2025 emphasise the importance of harnessing the power of data in
improving education offerings. The same report reflects on the growing competition and the need for
Australia to understand its competitors and craft longer-term growth strategies.
This document represents the Final Report for the project. It outlines the process adopted through the
project, outlines limitations in the approach and draws out key insights from the project. The report also
outlines key considerations moving forward for the sector to improve upon and better utilise existing
global enrolment data.
Project objectives
Student mobility data, which includes enrolment data and visa data, is valuable to understand the
dynamics of the global international education sector. It provides insights for universities and other higher
education providers in planning and driving market and recruitment efforts. It also supports governments
in determining the most appropriate policy settings and promoting countries as destinations for
international students. The project aimed to better understand this data and draw out insights that would
be valuable for stakeholders within the sector.
Specifically, the project had three key objectives – assessing and integrating discrete data sets,
understanding key macro-trends based on this data and identifying drivers of source country and
destination country relationships. The three project objectives are included in Figure 1.
Figure 1 | Three project objectives
Project approach
The project was delivered from October 2018 to May 2019, across three stages.
1. Data collection and integration – focused on undertaking a stock-take of existing global data
sources and engaging with global data agencies to access comparable enrolment data from a range
of key destination countries and integrating these data sets for key destination countries.
To develop a tool to
integrate significant
international education
data to understand
country specific trends and reconcile/seek to
explain any
discrepancies across
sources
1
To understand macro
trends in the global
higher education
market, painting a
clear picture of student mobility in
higher education
2
To identify drivers of
trends in key source
country/destination
country relationships.
3

Nous Group | International Higher Education Student Flows | 2 |
2. Identify macro-trends and case studies – reconciling existing public data sets and undertaking
analysis on overall volume of international students, student flows between key source countries and
destination countries and initial assessment of market position for key destination countries –
including Australia.
3. Refine analysis and determine implications for policy – through three case studies focused on
different elements of the global international education system and drawing out lessons for the
Australian international education sector.
Project partners and funder
The project is being delivered through a collaboration between Navitas, Nous Group and Austrade. Further
information on each partner is included in Figure 2.
Figure 2 | Project partners
This project has been facilitated by the Australian Government through the Department of Education and
Training. The ‘Enabling Growth and Innovation’ grant supports the National Strategy for International
Education 2025, through $3 million per year to deliver big picture projects that develop Australia’s role as
a global leader in education, training and research.
Purpose and structure of this document
This document represents the final deliverable for the project. It has been structured in three sections:
• Section 2 – Existing Data available, which provides an overview of existing resources
• Section 3 – Insights on global student flows, which outlines the key macro-trends and presents
high-level insights from the three case studies undertaken.
• Section 4 – Approach and methodology, which presents the projects conceptual approach to the
reconciliation of the discrete data and the methods used.
• Section 5 – Insights on global data available, which outlines limitations in the data available and
lessons that have been drawn from the EGI grant process
The document is supplemented by three separate deep-dive case studies on topics aimed at better
understanding the nature of the international education sector and key trends, and an interactive tool
which is publicly available for use by the sector.
Navitas is a world leader in
developing and providing educational services and learning solutions with
locations throughout Australia, North America,
Europe, Africa and Asia.
Nous Group is an award-
winning management consulting firm with over 350 people across eight locations
in Australia and the UK. Nous is an expert in higher
education and international education.
Austrade is the Australian
Government’s trade, investment and education
promotion agency. It supports
Australian education providers market intelligence, in-market
support and thought and policy leadership.

Nous Group | International Higher Education Student Flows | 3 |
2 Existing data available
The project builds on existing work and research in this area. A range of existing data and resources are
available publicly which provide insight on global student flows. This includes at a global level with
resources such as UNESCO and Project Atlas – which are outlined in further detail in Figure 3.
Figure 3 | Resources available to understand global student flows
At the national level, more detailed information is also available on the inbound flows which is captured
and reported by several key destination countries. This includes:
• Australia – where resources are available through Austrade’s Market Information Package for
subscribers, including through a regularly updated pivot table and interactive visualisations, as well as
through the Department of Education’s International Student Data.
• The United Kingdom – where data on international education inbound mobility is available through
the Higher Education Statistics Agency (HESA) as part a broader national collection of higher
education data in table and interactive formats.
• The United States – where information on international student mobility is captured from universities
and higher education providers through the Open Doors survey, conducted by the Institute for
International Education (IIE) and supported by the U.S. Department of State.
• Netherlands – where information on inbound mobility (amongst other things) is publicly available in
dashboard format through Nuffic – the Dutch organisation for international education.
Despite these resources there are current limitations faced by the sector to get a more fulsome picture of
the worldwide market for international education. While detailed information is available for Australia as a
destination country, there is clear limitation in the information used by government, providers and the
industry more broadly to make important decisions. Similarly, relatively limited work appears to have been
undertaken to reconcile inbound flows for key destination countries to understand the macro-picture.
This project builds upon these resources and attempts to utilise these and other resources to provide
further consistency and granularity, improve the quality of data available and better understand the
macro-flows of students globally.
UNESCO
Which collects
and reports global flows of international
tertiary students between source
and destination countries
PROJECT ATLAS
A global research
initiative that collects and disseminates comparable student
mobility data for participating
countries
Provides more detail
than UNESCO but limited to certain
source and destination countries
Nous Group | International Higher Education Student Flows | 4 |
3 Insights on global student flows
This project has enabled a comprehensive assessment of the key trends in global student mobility based
on integration of discrete sources of student mobility data. This has allowed an assessment of the scale of
international student mobility, the share and growth for source and destination countries and the scale of
flows and how these have changed over time.
Analysis of the macro-level flows have focused on two key elements:
• Key question 1 – what is the global flow of international higher education students across countries?
• Key question 2 – what are the key drivers of global student mobility in higher education? (with a
focus on destinations, source countries and policy settings.
A series of key insights from analysis of the macro-trends are presented in this section based on the
macro-analysis of student mobility, before insights are presented from the three case studies on specific
areas of the global international education sector.
3.1 International student mobility has enjoyed a period of
sustained growth
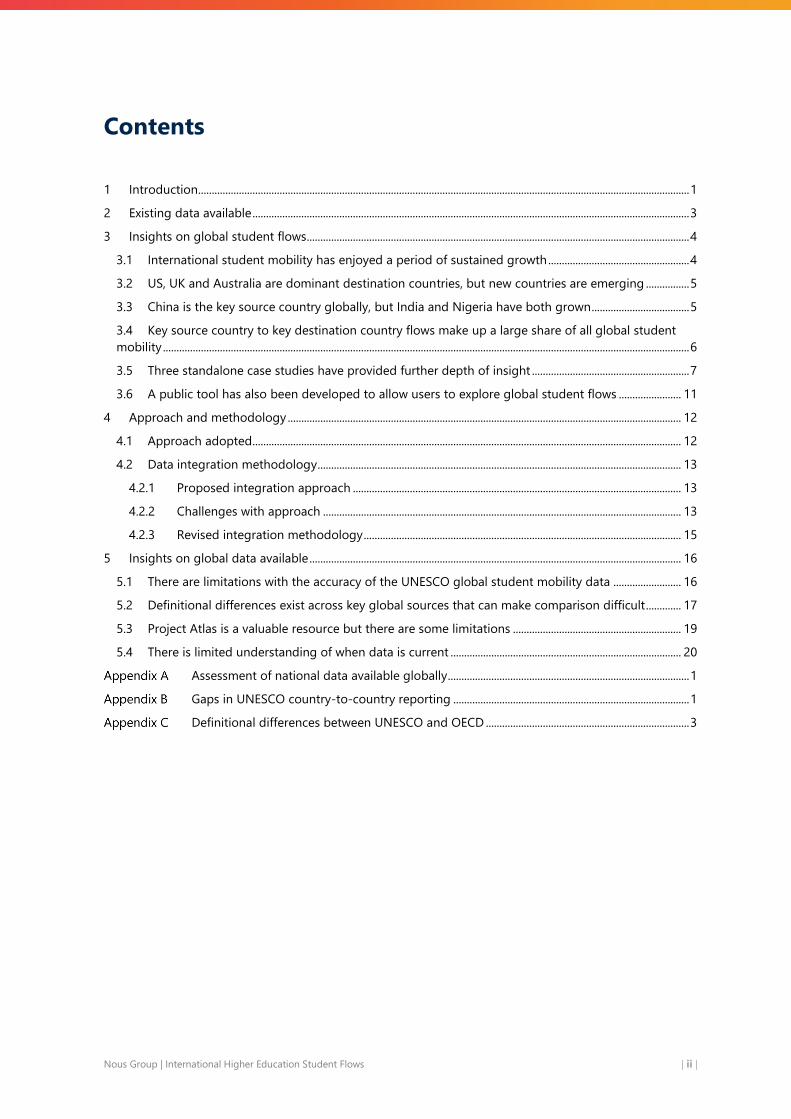
Our modelled figures have identified that in 2016 total global student mobility comprised almost 5.5
million students studying in tertiary programs in countries outside their home country. This has built on a
period of growth from 2004 comprised of three distinct phases – as shown in Figure 4.
Figure 4 | Three phases of student mobility growth
Despite a slowing of growth between 2010 to 2013, strong recovery from 2013 has indicated year-on-year
growth of almost 8 percent in more recent years.
Source: Nous global student flow integrated dataset
Layer 1, based on modelled UNESCO student
mobility data.
There have been three distinct
phases of growth over the most
recent twelve years – long term
growth, a short-term slow down
and a recent strong recovery
0
500,000
1,000,000
1,500,000
2,000,000
2,500,000
3,000,000
3,500,000
4,000,000
4,500,000
5,000,000
5,500,000
2004 2006 2008 2010 2012 2014 2016
2004 to 2010
Long term growth
+5.7% CAGR
2011 to 2013
Slow down
+3.4% CAGR
2013 to 2016
Strong recovery
+7.8% CAGR
Nous Group | International Higher Education Student Flows | 5 |
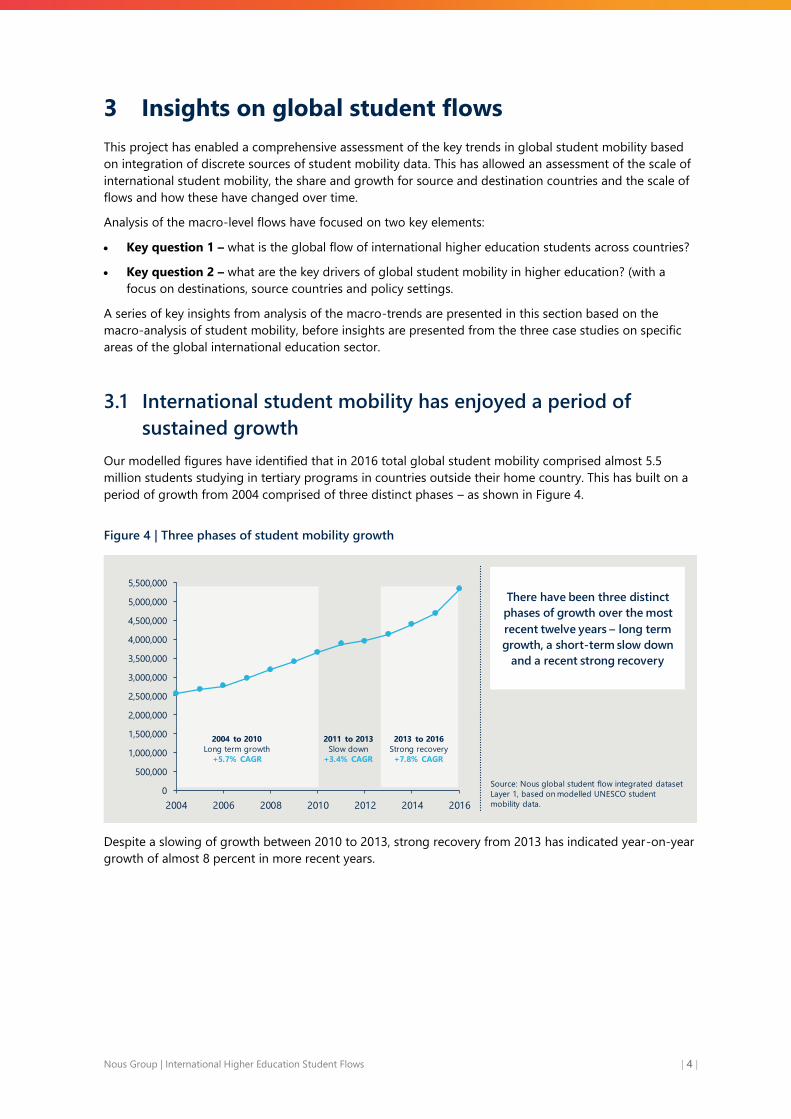
3.2 US, UK and Australia are dominant destination countries, but
new countries are emerging
Australia is the third largest destination for international students – behind the United States and the
United Kingdom. These three players have retained their market position but are increasingly being
challenged by new players in recent years. The strongest relative growth has come from emerging
destinations – such as Malaysia, China, Netherlands, Russia and Canada. This is shown in Figure 5 below.
Figure 5 | Share of inbound tertiary student flows, by destination country, 2011 and 2016
3.3 China is the key source country globally, but India and
Nigeria have both grown
China is the largest source country for international students globally – sending 20% of all students
studying overseas. Growth and decline have characterised other key countries – as shown in Figure 6.
Figure 6 | Share of outbound tertiary student flows, by source countries, 2011 and 2016
The UK and France have
experienced declining share, while
competitors such as Russia,
Canada, China and Malaysia have
increased theirs
19.5%
11.1%
7.2%
6.9%
3.9%
4.0%
4.0%
2.8%
2.0%
1.7%
0.8%
19.6%
8.9%
6.7%
4.6%
4.7%
4.2%
2.9%
3.7%
2.8%
2.5%
2.8%
Russia
Germany
United States
Canada
United Kingdom
Australia
Japan
France
China
Malaysia
Netherlands
2010
2016
Increase in share of global students
Decrease in share of global students
Source: Nous global student flow integrated
dataset Layer 1, based on modelled UNESCO
student mobility data.
Increase in % global students
Decrease in % global students
Source: Nous global student flow integrated
dataset Layer 1, based on modelled UNESCO
student mobility data.
Globally, India and China are the
largest source countries, but new
markets have emerged in recent
years with strong outbound
growth
19.8%
6.3%
3.9%
3.5%
1.3%
1.3%
1.6%
1.7%
1.6%
1.0%
1.5%
1.6%
19.6%
6.8%
2.3%
2.2%
2.2%
2.1%
2.1%
1.9%
1.9%
1.7%
1.5%
1.5%
China
India
Saudi Arabia
Malaysia
South Korea
France
Germany
Nigeria
Kazakhstan
Viet Nam
Ukraine
United States
2011
2016
Nous Group | International Higher Education Student Flows | 6 |
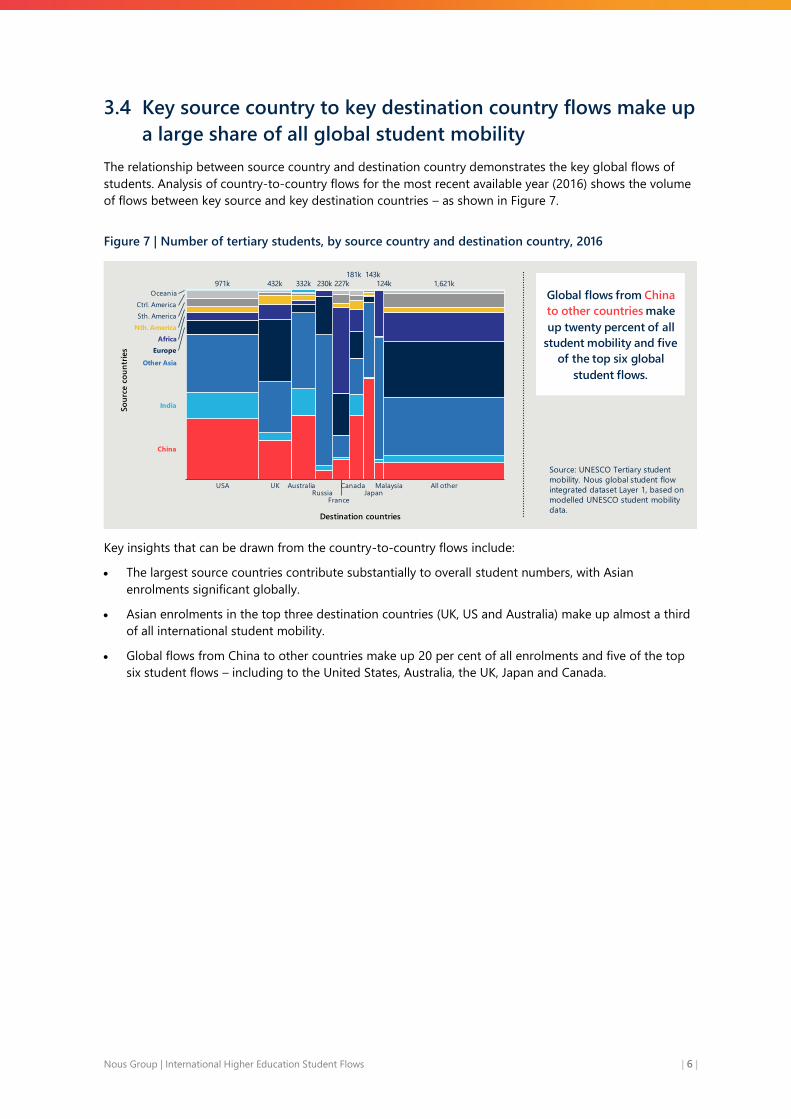
3.4 Key source country to key destination country flows make up
a large share of all global student mobility
The relationship between source country and destination country demonstrates the key global flows of
students. Analysis of country-to-country flows for the most recent available year (2016) shows the volume
of flows between key source and key destination countries – as shown in Figure 7.
Figure 7 | Number of tertiary students, by source country and destination country, 2016
Key insights that can be drawn from the country-to-country flows include:
• The largest source countries contribute substantially to overall student numbers, with Asian
enrolments significant globally.
• Asian enrolments in the top three destination countries (UK, US and Australia) make up almost a third
of all international student mobility.
• Global flows from China to other countries make up 20 per cent of all enrolments and five of the top
six student flows – including to the United States, Australia, the UK, Japan and Canada.
Source: UNESCO Tertiary student
mobility. Nous global student flow
integrated dataset Layer 1, based on
modelled UNESCO student mobility
data.
Global flows from China
to other countries make
up twenty percent of all
student mobility and five
of the top six global
student flows.
Canada
Sth. America
USA MalaysiaUK All other
India
Other Asia
Europe
China
Africa
AustraliaRussia
124k
France
Ctrl. America
Japan
Oceania
971k 432k 332k 230k 227k
181k 143k
1,621k
Nth. America
Destination countries
So
urc
e c
ou
ntr
ies

Nous Group | International Higher Education Student Flows | 7 |
3.5 Three standalone case studies have provided further depth
of insight
The project has also delivered three standalone case studies on the drivers for global student mobility.
Potential topics were assessed against four principles, as shown in Figure 8, to ensure they would be
valuable for the sectors and utilises the data that was collected through the project.
Figure 8 | Considerations for selection of case study 'deep dive' topics
The three topics focus on the breadth of the international education sector – one focused on destination
countries and where students are choosing to study, one focused on source countries and where students
are coming from, and one focused on how policy settings can influence this.
The full case studies are available as separate documents with a summary of high-level findings and
avenues for further exploration presented below.
RELEVANCE
Four principles were utilised…
TIMELY
ANALYTICAL FOCUS
NOVEL
…to determine three case study topics.
Understanding the maturity of destination countries and the drivers for emerging destinations
Understanding global product preferences for key source countries and the impact on global mobility
Understanding the impact of country-specific policy responses on student mobility

Nous Group | International Higher Education Student Flows | 8 |
Case study 1 focused on emerging destination countries
The first case study focuses on emerging destination countries in the international education system,
providing insight on destination country trends in global higher education and the implications for
Australia as a destination country.
Detailed cluster analysis found that there were five key groups of destination countries – established
countries (United States, the United Kingdom and Australia), mature destination countries, and three types
of emerging destination country groups. Analysis found that while Australia is increasingly competing with
both emerging and established destination countries, lost share was most commonly to other established
destination countries.
A summary of the key findings from case study 1 are presented in Figure 9.
Figure 9 | Summary of findings for case study 1
Avenue for further research
There are several avenues for further research coming out of this case study:
1. Deep dive on domestic drivers of declining outbound growth – there is an opportunity for further
research to explore the domestic drivers of outbound growth – as countries transition from
international student ‘exporters’ to international student ‘importers’. This includes increasingly
available and high-quality domestic institutions. Data was not captured on domestic student numbers
for key source countries (such as China or South Korea) where domestic institutions may have an
impact on future outbound mobility trends.
2. Alternatives for geographic distance – our definition of ‘Pulling Power’ considered the
‘geographical distance’, calculated as the straight-line distance based on countries’ centre latitudes
and longitudes. While our approach has used geographical distance, flights times or other measures
could provide a more accurate assessment of distance.
NEXT WAVE – which are two countries with ‘high pulling power’ attracting students
from diverse source countries
The three emerging country groupings are:
Canada has experienced rapid
growth in recent years – driven by
Indian and Chinese student in major
cities.
New Zealand which is a small
destination country but has
very high ‘pulling power’.
LATENT – a series of large destination countries with low pulling power which
could increase its pull in future years
Russia, which has become
a key destination country –
but primary driven by local
neighbour countries in
specialist areas.
China, which has a faster
growth rate than all
other larger destination
– 12% year-on-year.
Germany is also a
latent emerging
destination.
PROMISING – smaller destination countries that have shown promise as
international education destination through strong recent growth
Malaysia is the key promising destination,
experiencing strong growth (22% per
annum) due to increasing student
numbers from developing countries.
UAE, Netherlands, Turkey
and Saudi Arabia are all also
promising emerging
countries.
Emerging destination countries have been
driven by different categories of source countries – with some competing directly
with established destinations while others
have grown from neighbouring countries.
Emerging countries global share of all international students grew to 18% in 2016,
up from only 15% in 2011.
For Australia’s top five markets…
…the growth of ‘Next Wave’ emerging countries has been comparable to
established destinations.
However, for other countries Australia has
experienced declining share of international students – this has been mostly due to other
established countries which have increased
their share in these countries.
Nous Group | International Higher Education Student Flows | 9 |
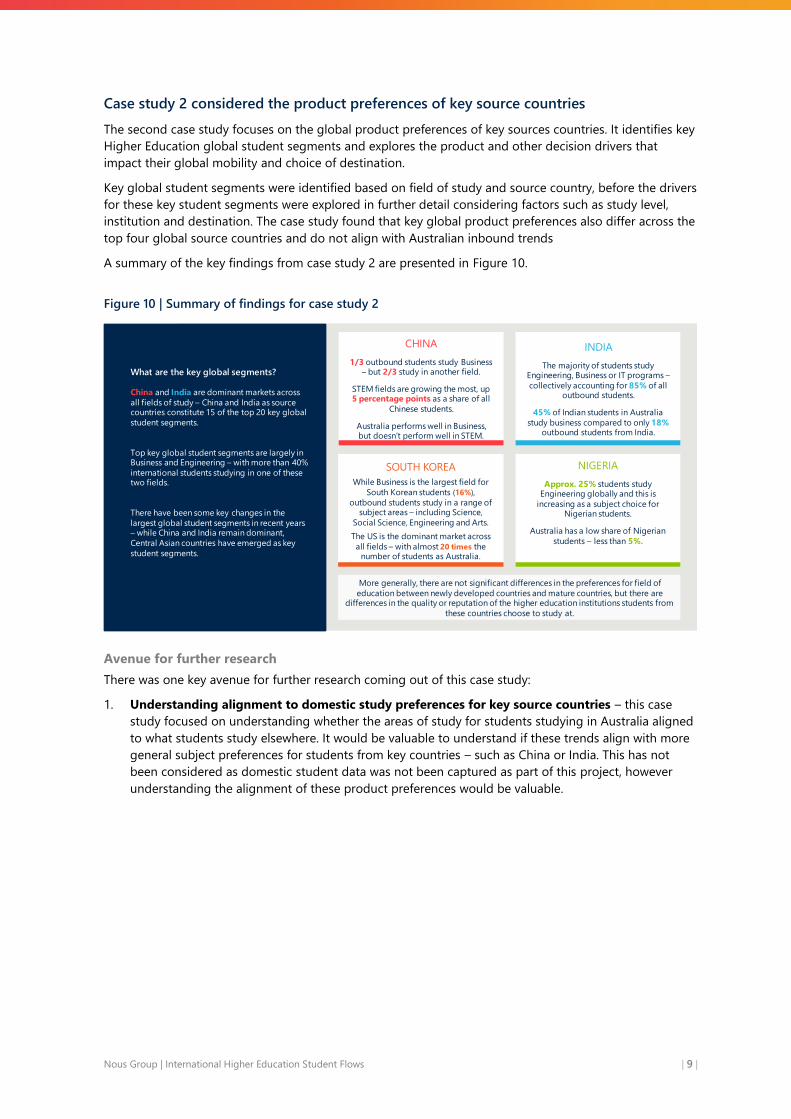
Case study 2 considered the product preferences of key source countries
The second case study focuses on the global product preferences of key sources countries. It identifies key
Higher Education global student segments and explores the product and other decision drivers that
impact their global mobility and choice of destination.
Key global student segments were identified based on field of study and source country, before the drivers
for these key student segments were explored in further detail considering factors such as study level,
institution and destination. The case study found that key global product preferences also differ across the
top four global source countries and do not align with Australian inbound trends
A summary of the key findings from case study 2 are presented in Figure 10.
Figure 10 | Summary of findings for case study 2
Avenue for further research
There was one key avenue for further research coming out of this case study:
1. Understanding alignment to domestic study preferences for key source countries – this case
study focused on understanding whether the areas of study for students studying in Australia aligned
to what students study elsewhere. It would be valuable to understand if these trends align with more
general subject preferences for students from key countries – such as China or India. This has not
been considered as domestic student data was not been captured as part of this project, however
understanding the alignment of these product preferences would be valuable.
What are the key global segments?
China and India are dominant markets across
all fields of study – China and India as source countries constitute 15 of the top 20 key global
student segments.
Top key global student segments are largely in Business and Engineering – with more than 40%
international students studying in one of these two fields.
There have been some key changes in the
largest global student segments in recent years – while China and India remain dominant,
Central Asian countries have emerged as key
student segments.
More generally, there are not significant differences in the preferences for field of
education between newly developed countries and mature countries, but there are differences in the quality or reputation of the higher education institutions students from
these countries choose to study at.
CHINA
1/3 outbound students study Business – but 2/3 study in another field.
STEM fields are growing the most, up 5 percentage points as a share of all
Chinese students.
Australia performs well in Business, but doesn’t perform well in STEM.
INDIA
The majority of students study Engineering, Business or IT programs –
collectively accounting for 85% of all outbound students.
45% of Indian students in Australia
study business compared to only 18% outbound students from India.
SOUTH KOREA
While Business is the largest field for
South Korean students (16%),
outbound students study in a range of subject areas – including Science,
Social Science, Engineering and Arts.
The US is the dominant market across
all fields – with almost 20 times the number of students as Australia.
NIGERIA
Approx. 25% students study Engineering globally and this is
increasing as a subject choice for Nigerian students.
Australia has a low share of Nigerian
students – less than 5%.

Nous Group | International Higher Education Student Flows | 10 |
Case study 3 identified the impact of policy settings on global student flows
The final case study sought to understand the impacts of policy settings and policy changes on student
mobility between a selection of source countries and destination countries. Four destination countries
were considered – Australia, the United Kingdom, Canada and the United States – and four source
countries were included – India, South Korea, Nigeria and Vietnam.
A summary of the key lessons drawn from case study 3 are presented in Figure 11.
Figure 11 | Summary of findings for case study 3
Avenue for further research
Others could build on this work to:
1. Consider impacts on other countries – by broadening out the source countries the analysis
considered. It would be valuable in particular to understand the impact policy settings and policy
changes have on mobility flows from China given it is the largest source country globally. Inclusion of
New Zealand may also be considered as a destination country given its alignment to the other four
countries selected.
2. Undertake further primary research to understand impacts on agent and student behaviour –
while some discussions occurred to understand the impact of policy settings, further primary research
could build on project findings to fully understand the impact policy changes have on the behaviours
and preferences of agents, parents and students.
2
FOUR KEY LESSONS
Different policy types appear to have different levels of impact. Based on the case study topics the biggest
changes in student flows were tied to changes in policy settings which restricted or enhanced to work after study. In
Australia and the UK changes in post-study work rights during this period, resulting in significant declines, while
recent changes to enhance the PR pathway for students in Canada appear to have resulted in increased student
numbers.
Changes in policy settings, especially in visa, work rights and academic requirements, can have a large impact.
Throughout the case studies, examples are presented where changes in policy settings appear to have had a
significant impact on inbound student mobility. These support positive flows, where favourable changes can result in
increasing student numbers, and negative flows, resulting in a declining number of students.
Subsequent policy changes, if quick, can lessen the damage but are unlikely to reverse the change. The UK and
Australia’s policy response shows that reverting policy settings can minimise the damage. While Australia responded
three years later by reverting its policy settings, the UK instead doubled down on its changes introducing tougher visa
settings. This has been reflected in student markets – particularly in the UK. While changes in Australian settings did
begin to reverse the change in Indian students, it took eight years from the initial policy impact, to return to its
previous market share position.
Different markets react in different ways to changes in policy settings. As an example, India is highly volatile
with many changes in flows as destination preferences over the 12 year period. This is likely due to drivers in this
market being tied to price, migration outcomes and the influence of agents on the market.
1
3
4

Nous Group | International Higher Education Student Flows | 11 |
3.6 A public tool has also been developed to allow users to
explore global student flows
The project has also delivered an interactive data visualisation tool that allows users to explore:
• Inbound flows to destination countries
• Outbound flows from key source countries
• Long term enrolment trends between a source country to a destination country
• Fields of study for higher education students from key source countries studying in certain destination
countries.
A screenshot of the global student flow tool is shown in Figure 12.
Figure 12 | Global student flows tool
Avenue for further development
There is an opportunity for the Australian Government to invest in maintaining the tool through:
• Continued updating of the tool – by updating the tool as new data becomes available through key
international data sources – such as UNESCO and Project Atlas. This will need to account for the data
gaps that have been identified through this project. Consistent data for 2017 tertiary student mobility
will be available in late 2019.

Nous Group | International Higher Education Student Flows | 12 |
4 Approach and methodology
This section outlines our approach to delivering the project, our data integration method and challenges
faced during the data collection and integration process.
4.1 Approach adopted
The proposed approach for the project comprised of three key elements.
Focusing efforts on inbound flows to key destination countries
The project intentionally focused its efforts to capture information on the inbound flows for key
destination countries. It did so for two reasons:
1. The quality of data captured on inbound flows – i.e. information on students coming into a country to
study – was likely to be more comprehensive than information captured by the source country as they
choose to study overseas.
2. Collectively, inbound student mobility for the top ten international education destination countries
accounts for approximately two-thirds of all global student mobility.
Therefore, focusing on key destination countries provided the most effective approach to capture
additional data that may be available. UNESCO student mobility data was used to identify and priorities
the key global destinations.
Stocktake of data publicly available to the sector
The second step was to identify the existing resources that were publicly available and aggregate existing
information that existed on global student mobility. This included:
• Identification and cleaning of macro-level data sets – such as UNESCO and Project Atlas.
• Desktop review to identify information that was publicly available for inbound national data sets on
student mobility for key identified destination countries.
• Engagement with Austrade in-market representatives for all key destination countries to request data
currently held and information on key contacts for the data.
A full summary of the stock-take and data available publicly for each destination country is included in
Appendix A.
Targeted discussions with key data agencies to better understand and access non-public data
Finally, targeted discussions were undertaken with data custodians from a number of key destination
countries to both understand the limitations of the data that was available and to seek access to data that
may exist, but that was not publicly reported. From these discussions data was received based on tailored
requests from Ireland Higher Education Authority, German Centre for Higher Education Research and
Science Studies (DAAD), Council on Higher Education (South Africa) and the Higher Education Statistics
Agency (HESA).
The data collection process sought to identify information on student mobility for the purposes of Higher
Education study. Some resources available, including the data collected by UNESCO, refers to tertiary
education – which includes both higher education and vocational education. Where the broader term is
used in project outputs, this has been specified.
Nous Group | International Higher Education Student Flows | 13 |
4.2 Data integration methodology
This section outlines the data integration methodology that was adopted, as well limitations and
challenges with the initial methodological approach.
4.2.1 Proposed integration approach
The project initially intended to develop a comprehensive data set based on reconciliation across a
number of data sets. It intended to do this through undertaking a detailed ‘bottom up’ approach which
integrated detailed source level data at the national level to ‘stitch together’ a data set that provided
granularity on mobility flows (and the nature of those flows) globally. A summary on what was intended
from this approach is outlined in Table 1.
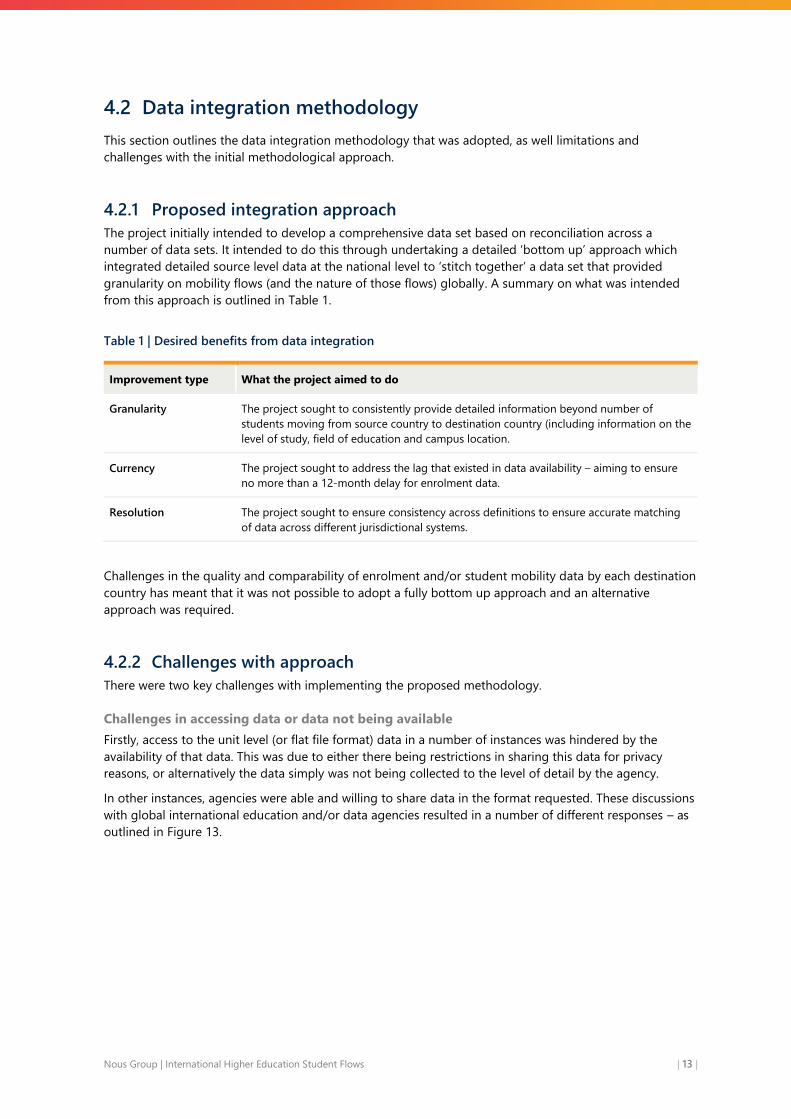
Table 1 | Desired benefits from data integration
Improvement type What the project aimed to do
Granularity The project sought to consistently provide detailed information beyond number of
students moving from source country to destination country (including information on the
level of study, field of education and campus location.
Currency The project sought to address the lag that existed in data availability – aiming to ensure
no more than a 12-month delay for enrolment data.
Resolution The project sought to ensure consistency across definitions to ensure accurate matching
of data across different jurisdictional systems.
Challenges in the quality and comparability of enrolment and/or student mobility data by each destination
country has meant that it was not possible to adopt a fully bottom up approach and an alternative
approach was required.
4.2.2 Challenges with approach
There were two key challenges with implementing the proposed methodology.
Challenges in accessing data or data not being available
Firstly, access to the unit level (or flat file format) data in a number of instances was hindered by the
availability of that data. This was due to either there being restrictions in sharing this data for privacy
reasons, or alternatively the data simply was not being collected to the level of detail by the agency.
In other instances, agencies were able and willing to share data in the format requested. These discussions
with global international education and/or data agencies resulted in a number of different responses – as
outlined in Figure 13.

Nous Group | International Higher Education Student Flows | 14 |
Figure 13 | Typical responses to data requests from global agencies
As an example, while Australian inbound data can be accessed by providers which provides granularity on
inbound student flows across a number of variables (such as source country, field of education, level of
study and provider), most international data sets only collected, reported or provided access to more
aggregated forms of student data.
This included:
• The United States – where the information Open Doors collected from US. universities was at a far
higher level that that collected by Australia (through the HEIMS system).
• Canada – where granular enrolment intelligence was not collected at all, with available data limited to
high-level study permit data (and therefore not offering provider level insights).
As a result, the ‘bottom up’ matching initially planned by the project was not possible to undertake.
Inconsistent definitions or form of data making consistent comparison challenging
In addition to the availability of data (either due to restrictions of access or collection limitations),
inconsistencies in definitions adopted or the form of the data available also created challenges for a
bottom-up matching approach. A summary of the implications of this are outlined in Figure 14.
Figure 14 | Challenges with global data integration
This required an alternate methodological approach to be adopted that leveraged existing integrated
global data sets.
THE DATA IS
AVAILABLE AND CAN BE
PURCHASED OR
ACCESSED BY ANYONE
THE DATA IS
AVAILABLE AND WE CAN SUPPORT YOU WITH A TAILORED
REQUESTED
THE DATA IS
AVAILABLE, BUT CANNOT BE SHARED FOR
PRIVACY REASONS
THE DATA IS NOT
AVAILABLE OR NOT COLLECTED IN THAT FORMAT
Nous Group | International Higher Education Student Flows | 15 |
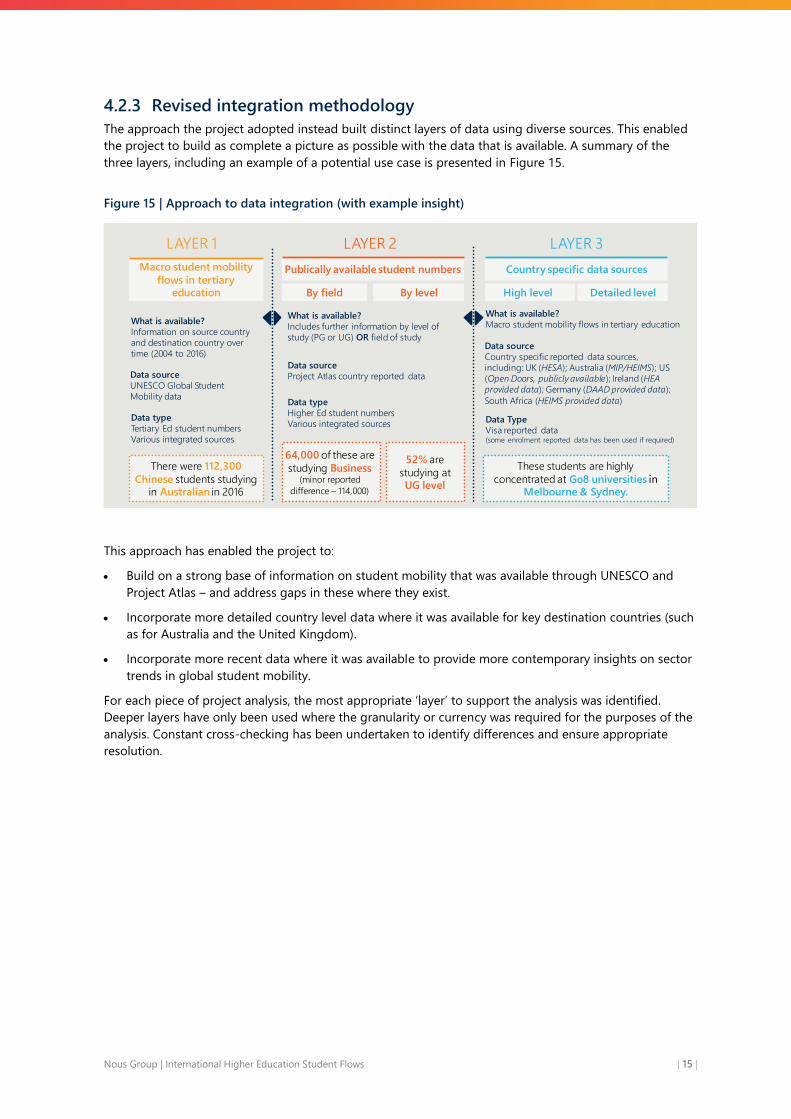
4.2.3 Revised integration methodology
The approach the project adopted instead built distinct layers of data using diverse sources. This enabled
the project to build as complete a picture as possible with the data that is available. A summary of the
three layers, including an example of a potential use case is presented in Figure 15.
Figure 15 | Approach to data integration (with example insight)
This approach has enabled the project to:
• Build on a strong base of information on student mobility that was available through UNESCO and
Project Atlas – and address gaps in these where they exist.
• Incorporate more detailed country level data where it was available for key destination countries (such
as for Australia and the United Kingdom).
• Incorporate more recent data where it was available to provide more contemporary insights on sector
trends in global student mobility.
For each piece of project analysis, the most appropriate ‘layer’ to support the analysis was identified.
Deeper layers have only been used where the granularity or currency was required for the purposes of the
analysis. Constant cross-checking has been undertaken to identify differences and ensure appropriate
resolution.
Macro student mobility
flows in tertiary education High level Detailed level
What is available?
Information on source country
and destination country over
time (2004 to 2016)
Data source
UNESCO Global Student
Mobility data
Data type
Tertiary Ed student numbers
Various integrated sources
What is available?
Includes further information by level of
study (PG or UG) OR field of study
Data source
Project Atlas country reported data
Data type
Higher Ed student numbers
Various integrated sources
What is available?
Macro student mobility flows in tertiary education
Data source
Country specific reported data sources,
including: UK (HESA); Australia (MIP/HEIMS); US
(Open Doors, publicly available); Ireland (HEA
provided data); Germany (DAAD provided data);
South Africa (HEIMS provided data)
Data Type
Visa reported data(some enrolment reported data has been used if required)
There were 112,300
Chinese students studying in Australian in 2016
64,000 of these are
studying Business(minor reported
difference – 114,000)
52% are
studying at UG level
These students are highly
concentrated at Go8 universities in Melbourne & Sydney.
LAYER 1
Country specific data sources
LAYER 3
By field By level
Publically available student numbers
LAYER 2

Nous Group | International Higher Education Student Flows | 16 |
5 Insights on global data available
This section outlines the key insights drawn from the process of integrating the data, including the
inconsistencies that exist and limitations in key data sources.
5.1 There are limitations with the accuracy of the UNESCO global
student mobility data
The initial integration process identified and addressed gaps that existed in UNESCOs reported global
flows and identified challenges with information reported through the system. A number of key data
limitations were identified during the course of the project. These included:
• Delay in reporting by countries for most recent years – which meant that the macro-level
information was not reliable and recent data could not be used on face value. Despite some countries
having reported data up to 2018, only mobility data from 2016 are consistently reported.
• Inconsistency in reporting practices – resulting in significant gaps in country-to-country reported
flows (even prior to 2016). As an example, some countries only reported their information every
second year, while for other source countries unreported data by key destination countries for some
years meant the total outbound student numbers from that country was underestimated.
• Inconsistent granularity of reported information for students studying certain countries – these
destination countries, including China, report the total numbers of inbound students studying in the
country to UNESCO each year, but do not provide further information on the country that they are
coming from.
Through detailed modelling, Nous has reassigned 360,000 students studying overseas in 2016 to close the
country-to-country gaps in UNESCO data. Over the period from 2003 to 2016 it is estimated that this
represented a 25% underreporting in UNESCO data.
How we filled the gaps
The gap that resulted from unreported country-to-country flows was filled through:
• Assuming consistent growth where gaps existed between reported data points across multiple years
• For more recent gaps, applying a conservative forecast growth rate (calculated as half of the forward
compound annual growth rate (CAGR) from the previous four years).
As shown in Figure 16, these assumptions produced absolute values that were very similar to UNESCO’s
own estimated figures. The methodology for UNESCO’s estimates is not available and the country-to-
country granularity on the estimates is not available.
This revised data sets represents layer 1 of the Nous student mobility integrated data set and is used in
the student flow tool available.
Full information on the nature of the country-to-country gaps in UNESCO reported data is presented in
Appendix B.

Nous Group | International Higher Education Student Flows | 17 |
Figure 16 | Total number of tertiary students studying overseas, 2004 to 2016
Key lessons
Several key lessons can be identified based on the project’s experiences interrogating and integrating the
UNESCO global student mobility data:
• There is a significant delay as to when the reported data is sufficiently complete to allow for use. In
October 2019, international student mobility data from 2017 will be mostly reported and reconciled.
• Some countries report data at different times which makes it difficult to assess the status of country-
to-country flow data.
• UNESCO’s student mobility data refers to ‘tertiary students’ and includes students that have been
enrolled with an offshore institution for more than 12 months for a qualification (i.e. it does not
include study abroad and non-award students).
5.2 Definitional differences exist across key global sources that
can make comparison difficult
There are significant differences in the data definition practices that exist across available global data sets,
as well as across the different national data collections. There are not consistent and agreed practices in
place which can make it challenging to compare trends across different sources of data to draw out
insights. Broadly, definitional differences exist across four key areas:
1. what an ‘international’ student is
2. what the ‘higher education’ sector is
3. what the unit of measurement is
4. differences across level of study and field of study.
Each is discussed in further detail below.
There are different definitions on what an ‘international student’ is
The definition of ‘international student’ varies significantly across available data sources. These differences
can result from a number of different elements – for example the citizenship of the student, the length of
time they are studying and the visa category of a student.
Source: UNESCO Tertiary student mobility. Nous
global student flow integrated dataset Layer 1,
based on modelled UNESCO student mobility data.
Nous modelled data addresses
country to country gaps in line
with UNESCO’s assumptions –
addressing around 24% of
unreported country-to-country
through robust estimates.
0
500,000
1,000,000
1,500,000
2,000,000
2,500,000
3,000,000
3,500,000
4,000,000
4,500,000
5,000,000
5,500,000
2004 2006 2008 2010 2012 2014 2016
UNESCO reported country-to-country data
UNESCO total reported data
Nous modelled country-to-country data
Nous Group | International Higher Education Student Flows | 18 |
While these differences exist across national data sets (for example between definitions used in Australia
and Canada), there are also differences in how students studying overseas are reported in global data sets.
As an example, there are differences between how student studying overseas are typically reported by the
OECD and UNESCO. OECD data refers to foreign students, while UNESCO reports on international
students. The differences between the two are:
• Foreign students, which refers to students that do not have citizenship of the country in which they
are studying.
• International students, which refers to students that have moved to another country for the purpose
of study.
As a result, there can be significant differences in the reported absolute mobility flows between sources. In
2005, UNESCO reported a total of 2.8 million ‘international’ students in 2005, while OECD reports 3.0
million ‘foreign’ students in 2005.
Where possible project outputs refer to ‘international students’ and where this is not possible, the specific
definition used by the source itself is specified. Further information on this is presented on the
implications of this for OECD modelling assumptions in Appendix A.
There are differences in how ‘higher education’ is conceptualised across different sources
Based on the Australia definition ‘higher education’ refers to qualification programs from Diploma to PhD
level. These programs may be delivered by a university or alternatively by a non-university higher
education provider (NUHEP). Australia’s definition does not include programs delivered through the
Vocational Education and Training (VET) sector – including programs that are delivered by TAFE providers.
This definition can differ from other countries where alternate tertiary education systems have emerged.
In some other jurisdictions the separation between higher education and VET is less clear. For example, in
some European countries, Institutes of Technology or Technical Colleges are classified as part of the
country’s higher education sector. This is the case for Germany and Ireland and is reflected in the data that
was provided by agencies from these countries.
Existing global data sources report different numbers based on the level, sector and qualification type:
• UNESCO global mobility data – which reports ‘tertiary students’ based on reported information,
which for inbound students to Australia includes VET students. Non-award students, those that are not
studying for a qualification are also not included in the reported data.
• Project Atlas student data – where student numbers are presented for ‘higher education’ students,
and some includes some information on non-award students (study abroad only).
Project outputs use both definitions – ‘tertiary education’ and ‘higher education’, but do not include non-
award students. High level analysis typically refers to ‘tertiary students’ based on modelled UNESCO data,
while more detailed analysis is specifically ‘higher education’ students.
The key unit of measurement for global international mobility can vary between sources
– and may refer to either student numbers, enrolments or EFTSL
There are a range of different units to describe international student mobility. These are not consistent
across different key global sources and national data sets. Typically, the measures used are:
• Student numbers – which refers to the annual number of students studying in a country – which may
include across multiple courses. This measure is adopted by both UNESCO global mobility data and
Project Atlas data.
• Enrolments – which refers to the number of students enrolled in a relevant course. This may mean
that a single student represents multiple enrolments if they study more than one course in a year.
Most national data sets, including Austrade’s Market Information Package, adopt this definition.

Nous Group | International Higher Education Student Flows | 19 |
• Equivalent Full Time Student Load (EFTSL) – which refers to the student load, with one EFTSL
equivalent to a full-time study load for one year. Many national data collection agencies use this unit –
including HESA in the United Kingdom and the HEIMS system in Australia.
Due to data availability, the project has accessed a range of data sources that utilise all three of the above
measures. To ensure consistent comparison, data sources that utilise the same units have been used for
individual pieces of comparison. Where other data has been utilised, for example, to provide greater detail
on certain variables, this has been noted.
The nature of data collection can also differ across sources. Some sources report information through the
visa system (through a visa being awarded), while others refer to university reported student data.
Differences also exist across annual period reported. While for Australia the calendar year and academic
year generally closely align, Northern hemisphere countries (Europe, US and Canada) may report on the
calendar year or academic year (typically September to August) depending on the specific data set.
Taxonomy for fields of education also differs across countries
Each country has their own way of categorising which subjects’ students are studying. There are significant
differences across these definitions which can make it challenging to gain a full understanding of student
mobility in more detailed fields – such as economics or law. Project Atlas collects information from
different countries through a consistent framework which includes high-level fields, but some reporting
differences still exist. As an example, while information is available on field of education through data
reported by participating countries on the field of education students are studying, Australia does not
report any enrolments for ‘Humanities’ which is a category used by other destination countries and
instead reports enrolments under the ‘Arts’ category. This is likely to result from different interpretations of
‘Arts’ across different countries but can make consistent understanding challenging.
Insights and implications
• There are numerous definitional differences that exist across the data sets used for this project –
including global data collections and national data sets. This includes in defining ‘higher
education’ and ‘international students’, the unit used and definitions for level and field.
• The project has attempted to integrate these where possible, however this has not always been
possible due to the differences that exist.
• There would be value in working towards a more consistent approach to enable comparison
across different data sets.
5.3 Project Atlas is a valuable resource but there are some
limitations
Project Atlas is a partnership of public and private national level higher education data collection agencies.
The United States’ Institute of International Education serves as its Secretariat. Country partners of Project
Atlas include national data agencies which share data with Project Atlas on student mobility to allow
comparison. Information is published online and is publicly available.
There are a number of benefits from the Project Atlas collection compared to other available sources on
global student mobility. These include:
• Increased currency – with the reported data typically more current than mobility data reported
through the UNESCO Institute of Statistics data.
• More granular insights – with information reported on either field of education or level of study (UG
and PG) which is not available through the less detailed UNESCO Institute of Statistics data.

Nous Group | International Higher Education Student Flows | 20 |
• Some level of consistency – allowing comparison across inbound and outbound flows for key
countries.
While Project Atlas does provide more granular information than other resources available, there are also
a number of limitations:
• Limited source country scope – reported information on inbound mobility in Project Atlas only
includes information for the top 10 source countries. While this means high level trends can be
identified it can be challenging to see the full global picture.
• Interaction across variables – while information is presented on level and field, information is not
presented on both – for example the number of PG Business students.
• Some missing data – there are some inconsistencies in the data reported to Project Atlas. This means
that for some countries, information may only be reported every second year while for others
information is not reported on supplementary variables such as field and level.
Insights and implications
• Project Atlas is a valuable resource that provides a greater level of detail that in available through
UNESCO on some elements.
• There are limitations in what is collected and reported by Project Atlas – with some gaps and
inconsistencies.
• Increasing the number of source countries data is reported by participating countries, as well as
the consistency of reporting, would greatly improve the value of the resource.
5.4 There is limited understanding of when data is current
As outlined, there is a significant delay as to when information can be attained regarding mobility flows of
international students globally. The primary data set, UNESCO global mobility data, has a significant delay
with reliable data available in October for two years prior (i.e. reliable data for 2017 will be available
around October 2019). Further, this information is reported to the UNESCO collection at different times by
different participating countries. This can make it difficult to assess the currency of the data, with reported
outbound flows dependent on which source countries have reported their inbound flows.

Nous Group | International Higher Education Student Flows | 1 |
Assessment of national data available globally
Through the course of the project, Nous engaged with multiple international data agencies to attempt to access robust, detailed and comparable data on inbound
student mobility flows to key destination countries. Through this process a ‘stocktake’ was able to be completed which has identified which data is available
globally and how this compares to Australia’s own collection(s). It should be noted that there are significant differences in the quality of the data available for major
international education destination countries and that the quality of the information available for Australia is typically of a higher quality (more detailed, current and
accessible) than most if not all major education destinations.
Nous was able to access resources from several key destination countries. Full integration was prioritised to ensure that resources were used effectively, and
information gathered and integrated would provide insight. This has meant that data integration has been prioritised for the major destination countries – in
particular Australia, the United Kingdom, the United States.
A high-level summary is included below:
• Despite some limitations in data elements for key English-speaking countries and inconsistency with Australian collections – the data the project was able to
access has provided relatively strong granularity.
• Detailed data for Asian destination countries is relatively limited, which means the project has relied on publicly available data sources.
• Information for European markets has been relatively mixed. While more detailed data was available for the Netherlands and Germany, the project has
otherwise had to rely on aggregated publicly available information.
• Information for smaller destination countries is minimal with the project primarily relying on reported UNESCO data. Data accessed through South Africa is an
exception to this.
Full detail on the ‘data stocktake’ by destination country is presented in Table 2 below. Information is presented for the top 15 destination countries by size, with
information also presented for select other destination countries. Detailed data refers to inclusion of all relevant variables – such as field of study, level, provider,
destination, and source country – with the ability to analyse across multiple dimensions. Summary data refers to information on inbound country to country flows
with information on the source country. Priority was assessed based on the size of inbound flows and the similarity to Australia as a destination country.

Nous Group | International Higher Education Student Flows | 2 |
Table 2 | Assessment of available data, by destination country (hyperlinks included where applicable)
Inbound destination
country (priority)
% total inbound
mobility (2016)
Detailed
data
Summary
data
Commentary Source Project access
English speaking markets
United States
HIGH 18.2% ✓ ✓
Some limitations – with high level data available for the United
States through Open Doors. More detailed information is available,
but university-reported data collection survey does not allow for full
understanding of multiple dimensions – i.e. provider, field and source
country.
IIE – Open
Doors
NOT PURCHASED
Costs for a tailored request
were deemed as high
given level of likely insight
from data.
United Kingdom
HIGH 8.3% ✓ ✓
Comprehensive data was available for the UK through university
reported enrolment data. Includes information on provider, level,
field and source country. Data has some limitations with rounded
totals presented due to privacy.
HESA
ACCESSED
Detailed file received
through paid tailored
request.
Australia
HIGH 6.3% ✓ ✓
Some limitations – information through PRISMS (visa data) available
does not include information on Provider and Campus Location. Older
HEIMS data (university reported) has been used to supplement this
but has a delay in availability.
Austrade
MIP
ACCESSED
Explore access to more
granular data (incl.
provider).
Canada
HIGH 3.6% ✓ ✓
Some limitations – information on Provider enrolments and Field of
Study are not available through information collected by the Canadian
Government (study permit data) and are therefore not reported to
Project Atlas. Data on destination available.
Stats-
Canada,
IRCC data
PUBLIC
Education Canada
provided information
available internally.
New Zealand
HIGH 1.0% ✓ ✓
Comprehensive data is collected by Education NZ, but this was not
able to be accessed by the project, with access restricted to NZ
education providers only. Some publicly available information has
been used which includes field, level and destination within NZ.
ENZ
IntelliLab
PUBLIC
Data used restricted to
publicly available
information.
Ireland
MEDIUM 0.3% ✓ ✓
Some limitations – but information provided from the agency
on commencements/enrolments by level, field for study and
provider. Limited interaction across variables.
HEA Ireland
ACCESSED
HEA provided information
available internally to the
agency.

Nous Group | International Higher Education Student Flows | 3 |
Inbound destination
country (priority)
% total inbound
mobility (2016)
Detailed
data
Summary
data
Commentary Source Project access
Key Asian destination countries
China
MEDIUM/ HIGH 2.6% x ✓
Significant limitations – summary enrolment data is available on key
source markets for China from 2011 to 2015 through Project Atlas.
The source country of inbound students is not reported to UNESCO.
No detailed information is available for inbound or outbound
students.
Project Atlas
(via Chinese
Ministry of
Education).
PUBLIC
None. Will rely on Project
Atlas data that is publicly
reported for high level
trend analysis.
Japan
MEDIUM 2.7% ✓ ✓
Comprehensive summary data is available through Project Atlas.
Additional information is available through JASSO for countries
outside the top 10, but this could not be accessed by the project.
JASSO /
Project Atlas
PUBLIC
Relied on publicly available
data as tailored request
not accessed.
Malaysia
MEDIUM 2.3% x ✓
Significant limitations – summary enrolment data is available
through Project Atlas – with discreet information on FOE and level of
study for key source countries.
Project Atlas
PUBLIC
Relied on data available
through Project Atlas data
set.
Singapore
MEDIUM 1.0% x x
No data available – Austrade representatives have advised that the
Singapore Ministry of Education and the Dept. Statistics Singapore do
not share any data relating to international students.
None
(UNESCO)
PUBLIC
Have relied on data
reported to UNESCO.
Republic of Korea
MEDIUM 1.2% x ✓
Significant limitations – Detailed enrolment data available in Korean
only, including field, level and provider. Information is not provided to
Project Atlas at all.
Korean
Government
ACCESSED
Data received on student
mobility was accessed but
has not been used.
Taiwan
LOW - x x
Significant limitations – Very limited data available with no data
reported through Project Atlas.
Ministry of
Education
PUBLIC
Public high-level
information available for
case studies. UNESCO data
to be used also.

Nous Group | International Higher Education Student Flows | 4 |
Inbound destination
country (priority)
% total inbound
mobility (2016)
Detailed
data
Summary
data
Commentary Source Project access
European destinations
France
MEDIUM 4.6% ✓ ✓
Significant limitations – summary information reported by Project
Atlas only has high level source country information over time. High
level overall FOE information also reported for most recent year.
Campus
France
PUBLIC
Some additional
information available
through Campus France
publication.
Russia
MEDIUM 4.6% ✓ ✓ Comprehensive summary data is available through Project Atlas.
Project Atlas
/ Center for
Social
Research
PUBLIC
None. Project Atlas
reported data provides
sufficient granularity.
Germany
MEDIUM 4.6% ✓ ✓
Comprehensive summary data is available through Project Atlas.
Detailed information is available through DAAD annual publication
and tailored request. Flat-file not available due to data limitations.
Project Atlas
/ DAAD
ACCESSED
Additional information
accessed to support case
studies.
Netherlands
MEDIUM 1.7% ✓ ✓
Some limitations – in data available through Project Atlas. More
detailed data across all requested variables is also available through
Nuffic in the form of a publicly available dashboard and trough
tailored requests.
Nuffic PUBLIC
Data available as an
interactive tool.
Italy
MEDIUM/ LOW 1.7% x X
No data available – Austrade representatives have advised that there
is no official source available on inbound and outbound data. n/a
PUBLIC
No additional data
available, so utilised
UNESCO data set.
Turkey
MEDIUM/ LOW 1.6% ✓ X
No information available through Project Atlas. Summary information
on total international student numbers provided through self-service
website portal.
The Higher
Education
Council of
Turkey
ACCESSED
Information available from
self-serve website.

Nous Group | International Higher Education Student Flows | 5 |
Inbound destination
country (priority)
% total inbound
mobility (2016)
Detailed
data
Summary
data
Commentary Source Project access
Other identified source countries
United Arab Emirates
MEDIUM/
LOW
1.5% x ✓ Significant limitations – with Project Atlas data only available for
most recent year for limited variables. Austrade post reports that
additional information is not available.
Project Atlas PUBLIC
None. Limited Project Atlas
data UNESCO is primary
source. Saudi Arabia
MEDIUM/
LOW
1.5% x x Austrade representatives have not yet provided information on data
available for inbound student to Saudi Arabia. n/a
South Africa
MEDIUM/
LOW
0.8% ✓ ✓ Some limitations – data not available as a flat file due to privacy
protocols. Does provide detailed information on provider, level and
field of study by nationality.
Council on
Higher
Education
ACCESSED
Custom request provided
by CHE South Africa.
Mexico
LOW 0.2% x ✓
Significant limitations – Minimal additional information reported
through Project Atlas. Level and FOE reported for 2016. Project Atlas
PUBLIC
None. Limited Project Atlas
data UNESCO is primary
source.
Chile
LOW 0.1% x ✓
Some limitations – however most recent year reports full breakdown
by level and FOE. Project Atlas
India
LOW 0.8% x ✓
Significant limitations – Minimal additional information reported
through Project Atlas. Level and FOE reported for 2016. Project Atlas

Nous Group | International Higher Education Student Flows | 1 |
Gaps in UNESCO country-to-country
reporting
The project has identified that there are gaps in the country-to-country information that is reported by
UNESCO. While overall estimates are provided by UNESCO in addition these country-to-country figures,
information is not available on the underpinning method for these estimates or where the gaps in
country-to-country reported flows exist. This makes use of the country-to-country flows challenging due
to these inconsistencies.
Full information on which countries are under or unreported is outlined in the two sections below. These
represent ‘gaps’ that have been filled by Nous through its modelling approach.
Origin countries with a significant underreport (2004 to 2016)
A total of 138 origin countries were backfilled using our model. The most significant underreports were:
1. China, 308,300 (4%)
2. Nigeria, 165,800 (29%)
3. United States, 114,500 (18%)
Table 3 | Overview of origin countries with >1% backfill
Source country Difference between modelled and reported % difference (compared to total modelled)
Total 4,815,785
China 308,352 6%
Nigeria 165,802 3%
United States 114,476 2%
Malaysia 109,092 2%
Russia 107,070 2%
India 105,256 2%
Cyprus 83,787 2%
Azerbaijan 80,353 2%
Poland 76,554 2%
Ukraine 75,287 2%
Turkey 74,559 2%
Kazakhstan 74,435 2%
Congo 73,286 2%
Nous Group | International Higher Education Student Flows | 2 |
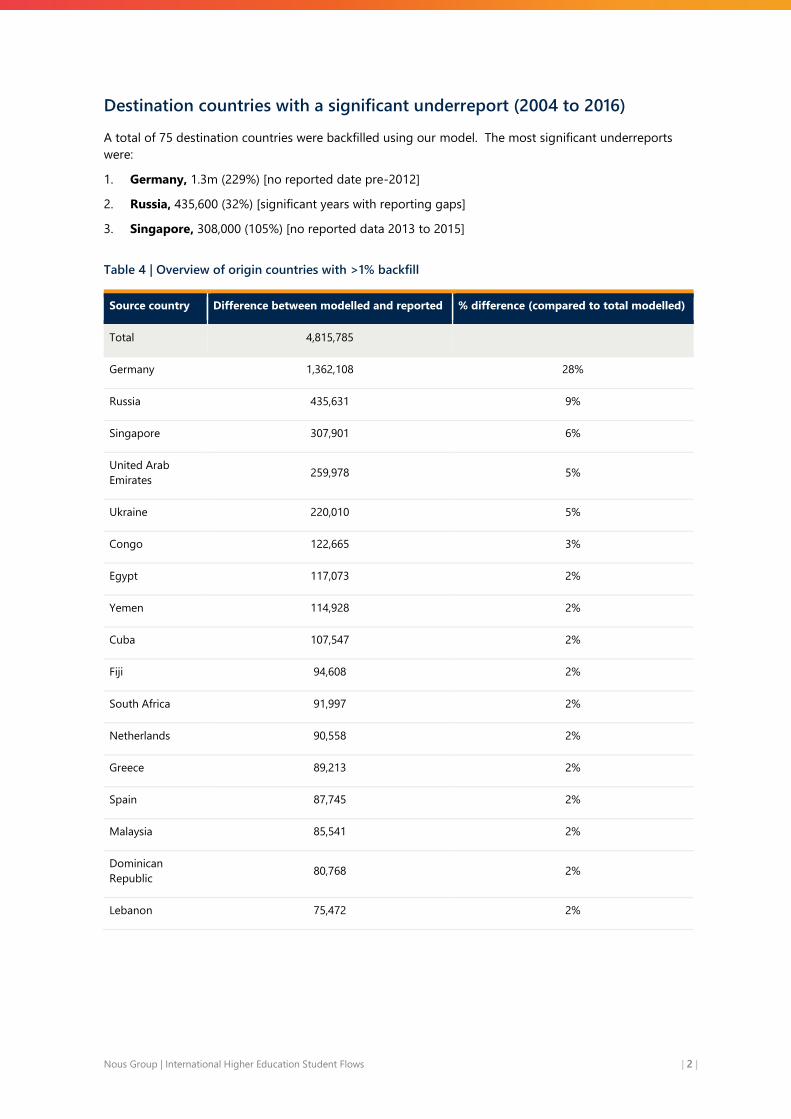
Destination countries with a significant underreport (2004 to 2016)
A total of 75 destination countries were backfilled using our model. The most significant underreports
were:
1. Germany, 1.3m (229%) [no reported date pre-2012]
2. Russia, 435,600 (32%) [significant years with reporting gaps]
3. Singapore, 308,000 (105%) [no reported data 2013 to 2015]
Table 4 | Overview of origin countries with >1% backfill
Source country Difference between modelled and reported % difference (compared to total modelled)
Total 4,815,785
Germany 1,362,108 28%
Russia 435,631 9%
Singapore 307,901 6%
United Arab
Emirates 259,978 5%
Ukraine 220,010 5%
Congo 122,665 3%
Egypt 117,073 2%
Yemen 114,928 2%
Cuba 107,547 2%
Fiji 94,608 2%
South Africa 91,997 2%
Netherlands 90,558 2%
Greece 89,213 2%
Spain 87,745 2%
Malaysia 85,541 2%
Dominican
Republic 80,768 2%
Lebanon 75,472 2%

Nous Group | International Higher Education Student Flows | 3 |
Definitional differences between
UNESCO and OECD
Further information is presented in this section on the differential differences that are used by UNESCO
and the OECD.
Definitional differences exist between OECD and UNESCO student data
Both organisations used different definitions of what constitutes a student. OECD combines foreign
student enrolment data for OECD countries with international student enrolment data for non-OECD
countries (from UNESCO) in its analysis.
• Foreign students: do not have citizenship of the country in which they studied (e.g. studying on
working visa)
• International students: moved to another country for the purpose of study. (i.e. student visa)
For example, UNESCO reports a total of 2.8 million international students in 2005, while OECD reports 3.0
million students in 2005.
These different definitions can impact forecasts for the global education sector
Different definitions can have significant impacts on student mobility flows and forecasts – as outlined by
the annotated OECD graph in Figure 17. Understanding these differences is important.
Figure 17 | OECD growth forecasts (Nous annotated)1
There are several issues with the figure:
• Change in scale – the OECD graph is misleading, as the data is plotted on a distorted scale that with
an exaggerated difference between the two time periods (pre-2010 and 2010-2015) which accentuates
the slowing growth pattern to indicate decline.
• Change in student definition - foreign OECD student data ceased to be available post-2012, so
international OECD student data was used as a proxy. This change has contributed to the reduced
numbers (4.6 million) and ‘flattened’ growth in 2015.
1 ICEF Monitor (2017) “OECD charts a slowing of international mobility growth” Available at:
http://monitor.icef.com/2017/09/oecd-charts-slowing-international-mobility-growth/; OECD (2017) Education at a glance
Source: OECD charts a
slowing of international
mobility growth, ICEF
Monitor (2017)
http://monitor.icef.com/20
17/09/oecd-charts-
slowing-international-
mobility-growth/
Changes in how
a student is
defined can
impact overall
mobility
forecasts
Space
between two dots
represent
5 years (Nous
addition)

Nous Group | International Higher Education Student Flows | 4 |