Embed Size (px)
Citation preview

INTERNATIONAL HYDROGRAPHIC ORGANIZATION
SPECIFICATIONS FOR CHART CONTENT AND DISPLAY ASPECTS OF ECDIS
Edition 6.0, March 2010
Publication S-52
Published by the
International Hydrographic Bureau MONACO

© Copyright International Hydrographic Organization [2010]
This work is copyright. Apart from any use permitted in accordance with the Berne Convention for the Protection of Literary and Artistic Works (1886), and except in the circumstances described below, no part may be translated, reproduced by any process, adapted, communicated or commercially exploited without prior written permission from the International Hydrographic Bureau (IHB). Copyright in some of the material in this publication may be owned by another party and permission for the translation and/or reproduction of that material must be obtained from the owner.
This document or partial material from this document may be translated, reproduced or distributed for general information, on no more than a cost recovery basis. Copies may not be sold or distributed for profit or gain without prior written agreement of the IHB and any other copyright holders.
In the event that this document or partial material from this document is reproduced, translated or distributed under the terms described above, the following statements are to be included:
“Material from IHO publication [reference to extract: Title, Edition] is reproduced with the permission of the International Hydrographic Bureau (IHB) (Permission No ……./…) acting for the International Hydrographic Organization (IHO), which does not accept responsibility for the correctness of the material as reproduced: in case of doubt, the IHO’s authentic text shall prevail. The incorporation of material sourced from IHO shall not be construed as constituting an endorsement by IHO of this product.”
“This [document/publication] is a translation of IHO [document/publication] [name]. The IHO has not checked this translation and therefore takes no responsibility for its accuracy. In case of doubt the source version of [name] in [language] should be consulted.”
The IHO Logo or other identifiers shall not be used in any derived product without prior written permission from the IHB.
INTERNATIONAL HYDROGRAPHIC ORGANIZATION
SPECIFICATIONS FOR CHART CONTENT AND DISPLAY ASPECTS OF ECDIS
Edition 6.0, March 2010
Publication S-52
Published by the International Hydrographic Bureau
4 quai Antoine Ier B.P. 445 - MC 98011 MONACO Cedex
Principauté de Monaco Telefax: (377) 93.10.81.40
E-mail: [email protected] Web: www.iho.int

Page intentionally left blank
i
S-52, Edition 6.0 March 2010
CHANGE CONTROL HISTORY SINCE 1996
Amendment Abbreviations IA Immediate Amendment
: MD Maintenance Document
DA Deferred Amendment
Specifications for Chart Content and Display Aspects of ECDIS (S-52)
Previous Edition Amendments Applied Resulting Edition
Edition 5.0 (Dec 1996) Mar 1999 " 5th Edition, amended Mar 1999"
" 5th Edition, amended Mar 1999" Dec 2001 " 5th Edition, amended
Mar 1999 & Dec 2001"
" 5th Edition, amended Mar 1999 & Dec 2001"
MD7 + Merging with former S-52
App. 2 (C&S specs) Edition 6.0 (March 2010)
Guidance on Updating the Electronic Navigational Chart (S-52, Appendix 1)
Current Edition Amendments Applied
Edition 3.0 (Dec 1996) No revisions since 1996
Colours & Symbols Specifications (Former S-52, Appendix 2) Previous Edition Amendments Applied Resulting Edition
Edition 3.0 (July 1996) July 1997 Edition 4.0 (July 1997)
Edition 4.0 (July 1997) MD1 IA i01 Edition 4.1 (Jan 1999)
Edition 4.1 (Jan 1999) MD2 DA d02 MD4 DA d6 Edition 4.2 (Mar 2004)
Edition 4.2 (Mar 2004) MD5 DA d7 Edition 4.3 (Jan 2008)
Glossary of ECDIS-Related Terms Specifications (Former S-52, Appendix 3)
Previous Edition Amendments Applied Resulting Edition
Edition 3.0 (Dec 1997) Transferred to S-32 S-32, Appendix 1 (Sep 2007)
Presentation Library (Annex A to former S-52, Appendix 2)
Previous Edition
Amendments Applied Resulting Edition Digital PresLib
Paper Addendum
to Part I
Edition 3.0 (July 1997) MD1 IA i01 Edition 3.1 (Jan 1999) PRSLIB03.dai (July 1997)
PSLB03_1.dai (Dec 1998)
Edition 3.1 (Jan 1999) MD 3 IA i04 Edition 3.2 (May 2000) PSTY03_0.dai (June 1999)
PSLB03_2.dai (May 2000) Users’ Manual
(2003)
Edition 3.2 (May 2000)
MD2 DA d02 MD3 DA d05 MD4 DA d6
Edition 3.3 (2004) PSTY3_2b.dai (Oct 2001) PSLB03_3.dai (Mar 2004)
Users’ Manual (2007)
Edition 3.3 (2004)
MD5 IA i5 MD5 DA d7 MD6 IA i6
Edition 3.4 (2008) PSLB03_4.dai (Jan 2008) Users’ Manual (2008)
Edition 3.4 (2008) MD7 DA d8

ii
S-52, Edition 6.0 March 2010
Page intentionally left blank
iii
S-52, Edition 6.0 March 2010
TABLE OF CONTENTS page
1 INTRODUCTION ........................................................................................................... 1
1.1 Aims and Background .................................................................................................... 1 1.2 Concept and limitations of ECDIS ................................................................................. 5 1.3 Function and Use of S-52 .............................................................................................. 6 1.4 Structure of the Specifications ....................................................................................... 6
2 CONSIDERATIONS; ORGANISING THE DISPLAY ................................................. 13
2.1 General Considerations ............................................................................................... 13 2.2 Operational Considerations ......................................................................................... 15 2.3 Organising the Information for Display ........................................................................ 18
3 SPECIFICATIONS FOR SYMBOLISING AREAS, LINES & POINTS AND FOR TEXT. 26
3.1 General ........................................................................................................................ 26 3.2 New Symbols for ECDIS .............................................................................................. 31 3.3 Existing Chart Symbols ................................................................................................ 38 3.4 Text, Diagrams etc. ...................................................................................................... 38
4 SPECIFICATIONS FOR COLOURS ........................................................................... 40
4.1 General ........................................................................................................................ 40 4.2 Colour Assignment ....................................................................................................... 40
5 SPECIFICATIONS FOR THE DISPLAY SCREEN .................................................... 46
5.1 Physical display requirements ..................................................................................... 46 5.2 Additional Requirements .............................................................................................. 46
ANNEX A IHO ECDIS PRESENTATION LIBRARY ........................................................ 58
ANNEX B PROCEDURE FOR INITIAL CALIBRATION OF COLOUR DISPLAYS ....... 60
ANNEX C PROCEDURE FOR MAINTAINING THE CALIBRATION OF DISPLAYS .... 80
Notes: 1) Throughout these specifications, italics are used to distinguish discussion or
recommendations from the specifications. The specifications are in plain type. 2) Quotations from these specifications may be used in the manufacturer’s manuals. The
source should be acknowledged.
__________
iv
S-52, Edition 6.0 March 2010
Page intentionally left blank
1
S-52, Edition 6.0 March 2010
1 INTRODUCTION 1.1 Aims and Background 1.1.1
Aims
These Specifications for Chart Content and Display Aspects of ECDIS are intended to contribute to the safe operation of ECDIS by:
- ensuring a base and supplementary levels of display for ENC data; standards of
symbols, colours and their standardized assignment to features; scale limitations of data presentation; and appropriate compatibility with paper chart symbols as standardized in the Chart Specifications of the IHO.
- ensuring the display is clear and unambiguous,
- ensuring that there is no uncertainty over the meaning of colours and symbols on
the display,
- establishing an accepted pattern for ECDIS presentation that becomes familiar to mariners and so can be recognized instantly without confusion.
1.1.2
Definitions
ECDIS terminology used in these Specifications is defined in the IHO S-32 “IHO Hydrographic Dictionary”, Appendix 1, “Glossary of ECDIS Related Terms."
1.1.3
Historical Background
In 1986 the North Sea Hydrographic Commission completed a study on the consequences of the development of Electronic Chart Display and Information Systems (ECDIS) for Hydrographic Offices (HOs). Its conclusions included: (1) Specifications for standardized data content, format and updating procedures should be arrived at by a new IHO ECDIS Working Group as a matter of high priority. (2) To assure the integrity of Electronic Navigational Charts (ENC's), their production should be the responsibility of the Hydrographic Offices; the ENC's will be made available in a standard format and all equipment should be designed to accept it. (3) When official ENC's are available, ECDIS users should be required to carry them in full, and ECDIS manufacturers or other intermediaries should not make preliminary selections of data before supplying them to the mariners. It was then decided to establish an International Hydrographic Organization (IHO) Committee on ECDIS (COE *).
As several manufacturers were now developing these systems, it was of immediate importance to all concerned (Hydrographic Offices, mariners, national shipping authorities, and manufacturers) to have at least a first draft of the IHO and International Maritime Organization (IMO) guidance for both the Electronic Navigation Chart (ENC) and its display systems.
* Subsequently renamed the Committee on Hydrographic Requirements for Information Systems (CHRIS) and
now known as the Hydrographic Services and Standards Committee (HSSC).

2
S-52, Edition 6.0 March 2010
Therefore, the COE asked the Netherlands Hydrographer to prepare a working paper on ECDIS specifications to address the following issues: (1) Minimum and supplementary data content of the ENC and required characteristics of that data base such as the cataloguing of sea areas, density of digitization of chart data and reliability and worldwide compatibility of chart data and other nautical information produced. (2) Minimum and supplementary content of the ENC display, standards of symbols, colours and their standardized assignment to features, scale limitations of data presentation, and appropriate compatibility with paper chart symbols as standardized in the Chart Specifications of the IHO. (3) Methods for the timely updating of the ENC, and means to ensure worldwide compatibility of the correction system data. (4) Criteria for a standard format for exchange of digital data for the ECDIS between Hydrographic Offices and for supply to the data user, and procedures and financial aspects of such an exchange and supply A first draft of the specifications was presented to IHO Member State Hydrographers in May 1987 at the 13th International Hydrographic Conference in Monaco. This draft was also widely distributed to National Shipping Authorities, mariner associations and manufacturers, for comment. In November 1988, the COE established the Colours & Symbols Maintenance Working Group (CSMWG) to develop specifications and guidelines for chart symbol and colour definition for evaluation by hydrographic offices, ECDIS users, and manufacturers. In January 1989, the Safety of Navigation sub-committee of the IMO Maritime Safety Committee noted the need to define symbols and colours for both chart and navigation purposes, and invited the Comité International Radio-Maritime (CIRM) and the IHO to make detailed technical proposals. Work on ECDIS display design had already started, exemplified by the Canadian E.C. Testbed on the Norwegian "North Sea Project" in 1988. The CSMWG made its first report in September 1989, based on a study for the Netherlands HO by the TNO Perception Institute, and a review by the DCIEM Perception Institute, Toronto. The initial performance specifications were prepared in June 1990. Seven Cs GmbH, of Hamburg, developed a digital Provisional Presentation Library, under contract to Canada and the United States, leading to the development of the Presentation Library over the next two years, and culminating in the issue of the first operational editions after a meeting of CSMWG in November 1994. Meanwhile, more research and development in colours and symbols was carried out in Canada. Australia also provided support for completing the Presentation Library and the Mariner's Navigational Object catalogue which implements the IEC Navigational Symbols. In parallel with the development of the IHO Specifications, the IMO/IHO Harmonizing Group on ECDIS developed Provisional Performance Standards for ECDIS, which were first published in May 1989 by the IMO. An amended version of the Provisional Performance Standards was prepared in the light of experience and it was adopted in 1995 through IMO resolution A.817(19). The Performance Standards have
3
S-52, Edition 6.0 March 2010
incorporated many of the elements of the original IHO Specification. Therefore, S-52 now only provides the details of the hydrographic requirements for ECDIS. Another parallel effort was carried out by the IHO Committee on Hydrographic Requirements for Information Systems (CHRIS), which developed the S-57, “IHO Transfer Standard for Digital Hydrographic Data.” S-57 describes the standard to be used for the exchange of ENC data. It was adopted by the 14th International Hydrographic Conference, Monaco, May 1992. The IHO Transfer Standard Maintenance and Application Development Working Group (TSMAD) currently maintains S-57. While many of the general elements of S-52 were being incorporated into the IMO Performance Standards, the specifics were being expanded in the S-52, Appendix 2, "Colour & Symbol Specifications” into a model for presenting all chart and navigational objects on the ECDIS display, according to the developing IMO requirements. IHO published a provisional edition of the S-52, Appendix 2 in 1991 and the first operational edition, complete with Annex A, "Presentation Library", was issued in 1994. After 1994, considerable maintenance to adapt the colours and symbols Specifications and Presentation Library to sea experience and to changes in S-57 was carried out in Canada, first by USL/CARIS of Fredericton and later by NDI of St. Johns, funded by the Canadian Hydrographic Service and the Canadian Coast Guard. In 2001, the Federal Maritime and Hydrographic Agency of Germany (BSH), relieved the Canadian Hydrographic Service as the HO responsible for ECDIS Colours and Symbols. In 2004, a new edition bringing all accumulated deferred amendments into effect was issued. It included a detailed 'hard-copy' version of the symbol library developed at Hochschule Wismar, Fachbereich Seefahrt Warnemunde; in addition Furuno, Helsinki, provided the updated digital version for those who use it. The version of S-52 published in 2008 focused on adapting Appendix 2, Annex A to the revised IMO ECDIS Performance Standards and the introduction of new symbology for Particular Sensitive Sea Areas, Archipelagic Sea Lanes and generic objects which may be used for future cartographic requirements initiated by the IMO. In 2008, the 20th meeting of CHRIS endorsed the recommendation of the CSMWG to revise and restructure S-52 to accommodate the revised IMO ECDIS Performance Standards, MSC.232(82) and the associated new IEC 61174 Specification for ECDIS type approval testing. This has resulted in the creation of Edition 6 of S-52. All references to the previous IMO Performance Standards have been replaced with the appropriate references to MSC.232(82). The structure of S-52 has also been simplified; the S-52, Appendix 2 has been incorporated into the main portion of S-52 and the three annexes of the former Appendix 2 have become annexes to the main document. All of the Appendix 2 paragraph numbers have been retained in the newly integrated S-52 main document so that references to the former S-52, Appendix 2 may be mapped directly to the revised main portion of S-52. CHRIS, which changed its name to the Hydrographic Services and Standards Committee (HSSC) in 2009, also changed the name of the CSMWG to the Digital Information Portrayal Working Group (DIPWG). The scope of the DIPWG was also redefined to include maintenance of all components of S-52, except for Appendix 1, “Guidance on Updating the Electronic Navigational Chart," which was delegated to the new ENC Updating Working Group (EUWG) to “review and revise.”
4
S-52, Edition 6.0 March 2010
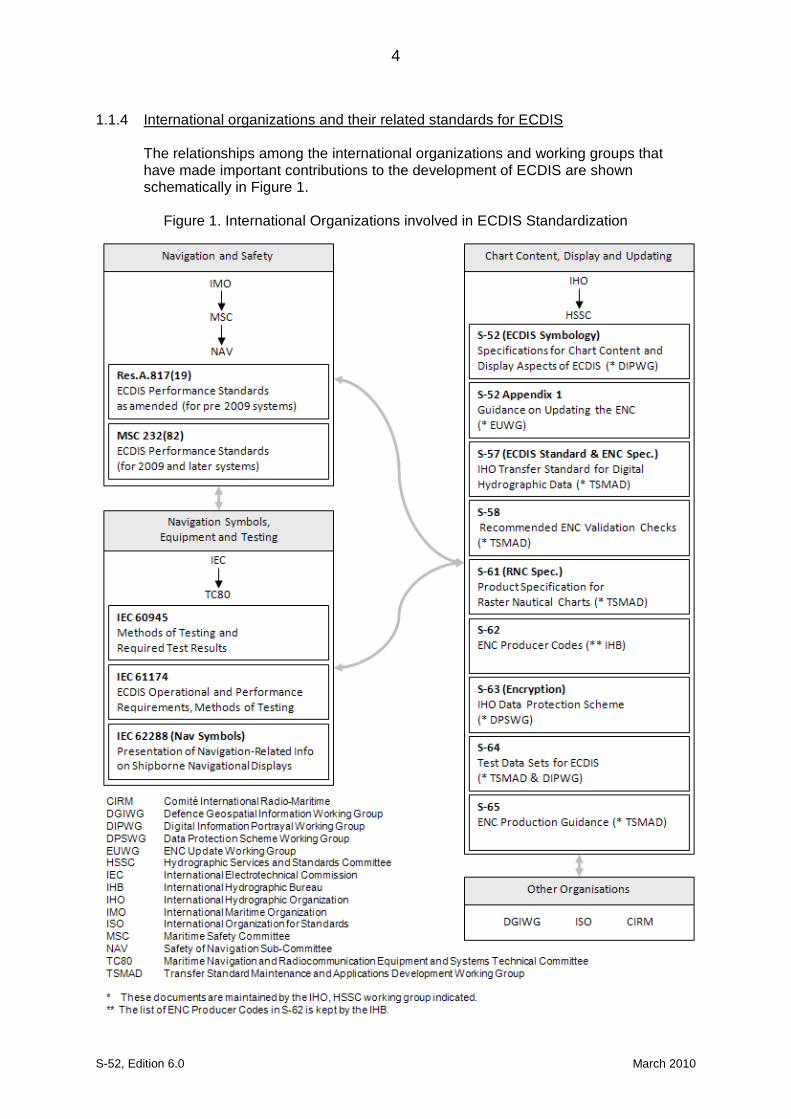
1.1.4
International organizations and their related standards for ECDIS
The relationships among the international organizations and working groups that have made important contributions to the development of ECDIS are shown schematically in Figure 1.
Figure 1. International Organizations involved in ECDIS Standardization
5
S-52, Edition 6.0 March 2010
The following have been used as references within these Specifications: (1) IMO Performance Standards for ECDIS, 1995 edition (Resolution A.817(19) refers) and current edition (Resolution MSC.232(82) refers)); (2) IHO S-57 "IHO Transfer Standard for Digital Hydrographic Data", current edition,
IHB, Monaco; (3) IHO INT 1 "Symbols, Abbreviations, Terms used on Charts". BSH, Hamburg,
current edition; (4) IEC 62288 “Presentation of navigation related information - General
requirements, methods of test and required test results”, current edition; (5) IEC 61174 "ECDIS - Operational and performance requirements, methods of
testing and required test results", current edition;
(6) IEC 60945 "Maritime Navigation and Radio Communication Equipment and Systems – General Requirements – Methods of Testing and Required Test Results", current edition;
(7) IHO S-32 Appendix 1: "Hydrographic Dictionary - Glossary of ECDIS-related
terms", current edition. (8) IHO S-60 "User´s Handbook on Datum Transformations involving WGS-84",
current edition Excerpts from the above references are quoted where they form a necessary part of these specifications.
1.2 Concept and limitations of ECDIS
It may be noted that the concept of ECDIS is outlined in the introduction section of the IMO Performance Standards. The following contains additional ECDIS related considerations.
(a) ECDIS, used together with official data, [is] accepted as complying with the up-
to-date charts carriage requirements for nautical publications required by regulation V/19 of the 1974 SOLAS Convention amended in 2009. It may be noted that electronic chart systems not meeting these ECDIS specifications of IHO and IMO, or ECDIS using non-official data, are known as ECS (Electronic Chart Systems).
(b) Chart information may be used in conjunction with a radar overlay on ECDIS.
Integration of tracked radar targets provided for collision avoidance radar (ARPA) and targets tracked by AIS (Automatic Identification System) into the ECDIS display is another option.
(c) The colours and symbols defined in this Specification are conceptually based on
the familiar symbology of conventional paper charts. However, due to the special conditions of the ECDIS chart display as a computer generated image, the ECDIS presentation of ENC data does not match the appearance of a conventional paper chart closely. Instead, there are considerable differences in symbology in shape, colour and size, and in the placement of text in particular.
6
S-52, Edition 6.0 March 2010
The display of the ENC data and the conventional paper chart do not necessarily have to be identical in their appearance.
(d) ECDIS combines chart and navigational positioning information. It should be
noted that modern navigation systems (e.g. differential GPS) may offer a more accurate positioning than was available to position some of the surveys from which the digital chart data ENC was derived.
(e) The display categories specified in the IMO Performance Standards and the IHO
priorities of the various types of chart information (alarms, updates, mariners and non-HO chart data, etc.) are applied to every object by the display category and draw priority assignments of the look-up tables and symbolisation procedures of Annex A of this Specification.
(f) Depth information should only be displayed as it has been provided in the ENC
and not adjusted by tidal height. 1.3 Function and Use of S-52
(a) The IHO has produced Specifications for the Chart Content and Display Aspects of ECDIS that appear in this publication (S-52), in order to ensure that hydrographic data supplied by its Member States' HO is used in a manner that will enhance the safety and efficiency of navigation by satisfying the requirements set out in the IMO Performance Standards for ECDIS.
(b) The objective stated in (a) is also met through the publication of the "IHO
Transfer Standard for Digital Hydrographic Data" (S-57) which includes the "ENC Product Specification" (S-57, Appendix B.1).
(c) S-52 should be read with the IMO Performance Standards. It should also be
read in conjunction with the ENC Product Specification in S-57.
(d) Users of these Specifications should also refer to publications of the International Electrotechnical Commission (IEC) when dealing with equipment design and tests.
(e) Not all operational aspects of the updating mechanism of ECDIS contained in
Appendix 1 “Guidance on Updating the Electronic Navigational Chart” are mandatory for an ECDIS and should primarily be read as guidance. Since Appendix 1 was drafted, much practical experience with ECDIS and its updating mechanisms have been gained and advanced requirements for operational behaviour of ECDIS updating mechanisms may supersede the guidance given in Appendix 1 of this Specification.
1.4 Structure of the Specifications 1.4.1
S-52 components
These Specifications consist of the following components (see Figure 2): .1 The Specifications for Chart Content and Display Aspects of ECDIS, which
describes the requirements and methods in relatively general terms. .2 Annex A, the Presentation Library as a separate document, which gives full
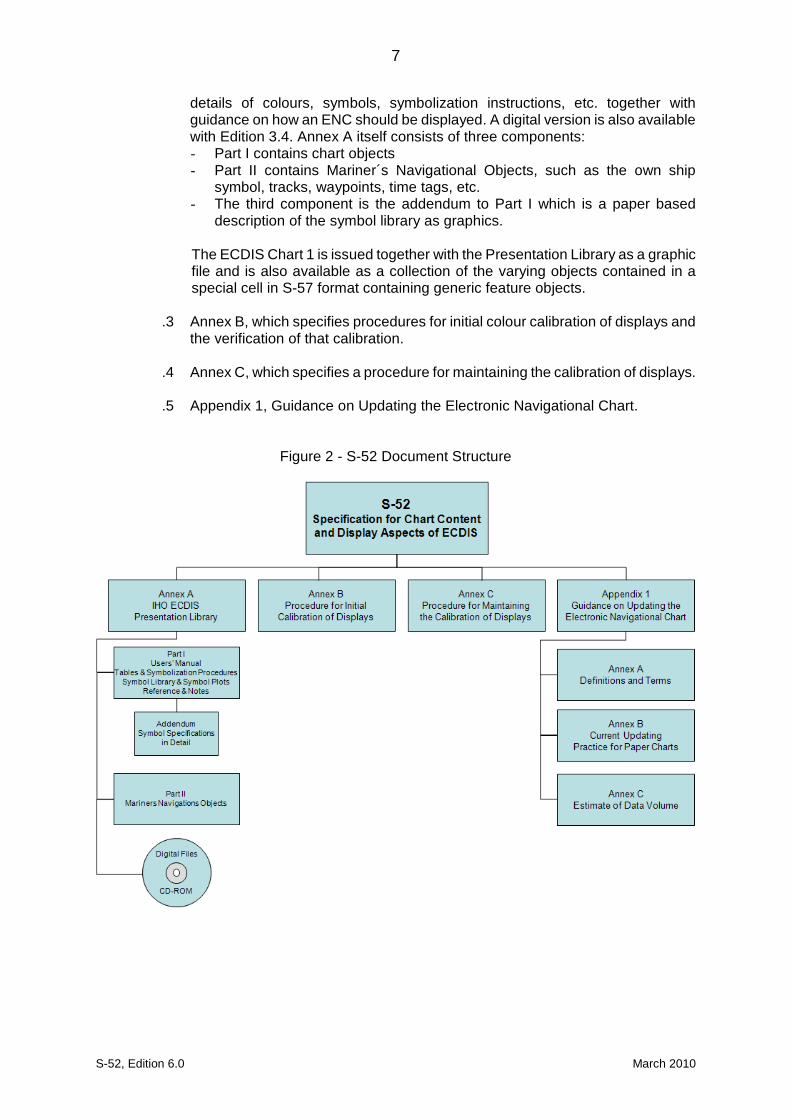
7
S-52, Edition 6.0 March 2010
details of colours, symbols, symbolization instructions, etc. together with guidance on how an ENC should be displayed. A digital version is also available with Edition 3.4. Annex A itself consists of three components: - Part I contains chart objects - Part II contains Mariner´s Navigational Objects, such as the own ship
symbol, tracks, waypoints, time tags, etc. - The third component is the addendum to Part I which is a paper based
description of the symbol library as graphics.
The ECDIS Chart 1 is issued together with the Presentation Library as a graphic file and is also available as a collection of the varying objects contained in a special cell in S-57 format containing generic feature objects.
.3 Annex B, which specifies procedures for initial colour calibration of displays and
the verification of that calibration. .4 Annex C, which specifies a procedure for maintaining the calibration of displays. .5 Appendix 1, Guidance on Updating the Electronic Navigational Chart.
Figure 2 - S-52 Document Structure
8
S-52, Edition 6.0 March 2010
1.4.2
Presentation Library and its status
The Presentation Library links every object class and attribute of the SENC, including the IEC Mariner's Navigational Objects, to the appropriate presentation on the ECDIS display. It carries all the details of these specifications, organised as shown on figure 2.
A digital version in .dai format containing the Symbol Library, Colour Tables and Look-up Tables is provided as a manufacturer's option for edition 3.4, but may not be provided for succeeding editions.
Note that the Presentation Library contains some features and procedures which are not required in the IMO standards or IEC specifications, such as four depth shades, etc. These are identified, and their use is optional.
References to the Presentation Library in this document refer to its Part I unless otherwise stated.
1.4.3
Amending the Colour & Symbol Specifications and the Presentation Library
1.4.3.1 In the life of each edition of S-52, amendments to the structure of the Presentation Library which might affect the ECDIS software (for example changing the number of fields in the look-up tables, or changing the logic of a conditional symbology procedure) will be avoided as far as possible. However incremental changes to detail in these Specifications and the Presentation Library will be required.
In a major revision, changes in structure will be made if necessary. Details of the
amendment process are given in 1.4.4 below. 1.4.3.2 The current editions of S-52 remain in force until the issue of either: (a) an immediate correction which is essential for reasons of safety of navigation, or (b) a new edition which is identified as bringing outstanding deferred amendments
into force.
Either of these will result in a new edition of these Specifications and/or the Presentation library, whichever is affected.
1.4.3.3 Amendments will be distributed as described in section 1.4.4 for information or for
implementation. As noted above, immediate correction amendments may have to be issued under certain circumstances.
The manufacturer should implement any immediate corrections in all his ECDIS systems fitted onboard ship, as soon as possible. When an amendment is implemented in a type-approved ECDIS, the manufacturer should inform the type approval authority in case re-testing may be required.
1.4.4
Amendment Procedures
1.4.4.1
Definitions of three classes of amendments.
(i) "Clarification": an improvement to the wording of S-52 which does not result in any substantive change to the specifications. A substantive change is one which would result in a change in symbolization.
9
S-52, Edition 6.0 March 2010
(ii) "Correction": a relatively specific change to S-52 to correct errors of commission or omission; or to improve the ECDIS presentation in the light of practical experience; or to take into account changes in another specification; etc.
(iii) "Extension": an extension has no immediate effect. It is a more general change
to S-52 intended to improve the ECDIS presentation. 1.4.4.2 Amendments.
An amendment may consist of more than one item, as follows:
- an immediate amendment will contain only immediate correction items, - a deferred amendment may contain either:
(a) clarifications and deferred correction items, or (b) extension items, which are distributed separately.
1.4.4.3 Immediate and deferred amendments.
In exceptional cases, applying only to corrections and only where a correction affects safety of navigation, an immediate amendment will be made.
Normally, the implementation of amendments will be deferred until the next edition which is identified as bringing outstanding deferred amendments into force.
1.4.4.4 Edition number of these Specifications and the PresLib.
The respective edition numbers of these Specifications and of the PresLib are of the form “mm.n” where “mm” is the edition number which changes for a major change in the specification, and “n” is an incremental change number which increases by one for every immediate amendment applied. The edition number does not change for a deferred amendment.
Major revisions of these Specifications and the PresLib will be identified by an increment in the "mm" number, followed by a zero, i.e. 04.0, 05.0, etc. Smaller revisions involving immediate amendments, and also revisions which are not major but bring outstanding deferred amendments into force, will be identified by an increment in the "n" number, e.g. 04.1, 04.2, etc.
It should be possible to identify the edition number in use on the ECDIS.
Edition numbers refer only to these Specifications and to the Presentation Library. Edition numbers are used in the numbering of amendment items in order to point to the particular edition of these Specifications or PresLib to which that item should be applied. For example amendment item no. “PL03.4.d7.co.2” should be applied to the Presentation Library Edition 3.4.
1.4.4.5 Amendment item identifiers.
Each item within an amendment is assigned a unique identifier, with the following form "ssmm.n.aa.dd.nnn", where:
ss = Specifications for Chart Content and Display Aspects of ECDIS (CS) or Presentation Library (PL), depending on which the amendment applies to,
mm.n = the edition number to which the amendment applies, aa. = deferred (d) or immediate (i) amendment followed by the sequential
number of the amendment, dd. = clarification (cl), correction (co) or extension (ex), n = sequential number of the item within the amendment.
For example, look at item no: "PL03.4.d7.co.2", reading from the last number group
10
S-52, Edition 6.0 March 2010
back to the first: "2" this is item 2 of the amendment,
"co" this item is a correction, "d7" it is a part of deferred amendment 7,
"PL03.4" it applies to PresLib edition 3.4 ( Note that:
i) the edition number of the PresLib would not advance after applying this deferred amendment.
ii) If this example had been an immediate amendment the item number would have been PL03.4.i7
iii) The next amendment would have been numbered "amendment 8" whether it was an immediate amendment or a deferred amendment. )
.co.2". In the case of an immediate amendment the edition number of the PresLib would have automatically advanced to 3.5 once the amendment was applied.
1.4.4.6
Distribution
1.4.4.6.1 Immediate corrections to both these Specifications and the Presentation Library are posted on the IHO website www.iho.int. They will need to be applied to the current edition of S-52.
1.4.4.6.2 Clarifications and deferred corrections. These deferred amendments will be
posted on the IHO website www.iho.int.
All existing deferred amendments will be implemented in the next edition of S-52 which is identified as bringing them into force. However an ECDIS manufacturer may implement a deferred amendment earlier if he wishes to do so, except when it is specifically stated that a particular amendment should not be implemented before the edition bringing deferred amendments into force is issued (in order to preserve uniformity in symbolising the ENC).
When an amendment is implemented in a type-approved ECDIS, the manufacturer should inform the type approval authority in case re-testing may be required.
1.4.4.6.3 Extensions are working documents, available from the IHB for test purposes on
request. A description of the extension will be put on the IHO website www.iho.int. 1.4.4.6.4 Before and after plots.
Where appropriate, before and after plots will, whenever possible, accompany amendments that make a change in symbolization.
1.4.4.6.5 Change control history.
Amendments will include a change control history and a reference to the current editions. The history of the previous changes to these specifications and the Presentation Library is provided at the beginning of this document.
1.4.4.7 The grace periods from the issuing date of a new edition after which changes are required to be included in an ECDIS are:
Application and entry in to force.
- for new development one year - for new selling (already type-approved before date of issue) one year

11
S-52, Edition 6.0 March 2010
1.4.5
Note on the Specifications as a whole
The effective use of chart colours and symbols on the ECDIS display requires consideration of a variety of factors: purpose (e.g. route planning/route monitoring); bridge lighting conditions (e.g. day/night lighting); human factors (e.g. colour perception, stress); interaction with "non-chart" information on the display (e.g. ship's tracks, navigator's notes, radar); interaction with other displays on the bridge (e.g. ARPA); ECDIS interactions (e.g. relation between ENC structure and display capability); technology (e.g. display calibration); and so on.
The working group has used good advice from ergonomic professionals and ECDIS manufacturers, and has taken advantage of the limited opportunities to test the standards at sea. However the group is conscious that operational sea experience, adaptations in the mode of use of ECDIS and technology developments will probably bring about the need for considerable modifications to the standards in the future.
Reports of experience with these specifications will be welcomed. They should be sent to: The Chairman, IHO DIPWG, International Hydrographic Bureau, BP 445, MC 98011, Principality of Monaco. E-mail: [email protected].
1.4.6
Type Approval - Minor Deviations to the Presentation Library
It is acknowledged that the manufacturers of navigational equipment and software are in constant contact with ECDIS users. To allow for fast response to suggestions for improvement to the chart display, the IHO Presentation Library for ECDIS is designed to provide a framework and guideline for chart symbolization from which the ECDIS manufacturer can derive a customized Presentation Library. The following criteria shall serve as a guide for judging whether any symbolization on an ECDIS which is visibly different from the symbolization provided by the IHO Presentation Library and as demonstrated by the IHO Test Data Set print-outs is still compliant. The symbolization used:
1.) should be the same in general shape and size as the IHO version; 2.) should be clear and sharp so that there is no uncertainty over meaning; 3.) should be close enough to the IHO version to avoid ambiguity in meaning
between that model and any other model of ECDIS; 4.) should use only the colours as specified in S-52; 5.) should comply with the various considerations of scientific design described in
S-52; 6.) should comply with the priority of prominence on the display in proportion to
importance to safety of navigation which is built into the Presentation Library, and
7.) should avoid any increase in clutter. Any symbolization which does not meet these criteria is not compliant.
The type-approval authority is strongly encouraged to contact the chairman of the IHO DIPWG in any case of uncertainty over differences in symbolization, ideally attaching graphics to illustrate the situation. The chairman of the WG will give the reason for the particular symbolization on the Test Data Plots, and will comment on any perceived advantages or disadvantages of the manufacturer's version, with reasons.
Manufacturers, type-approval authorities, and above all mariners, are always encouraged to contact the IHO over any improvements, criticisms, questions or
12
S-52, Edition 6.0 March 2010
comments that they may have about the ECDIS display, in order that the specifications can be kept effective and up to date. Send informal notes to the address in paragraph 1.4.5.
13
S-52, Edition 6.0 March 2010
2 CONSIDERATIONS; ORGANISING THE DISPLAY 2.1 General Considerations 2.1.1
Design considerations
The aim is to ensure that the ECDIS display is always clear and unambiguous. As an operational navigation display, there must be no doubt what the features shown are and what they mean. The basic principle of good display design is to keep the display simple and un-cluttered, and to use well-designed symbols and colours.
A number of guidelines have been used for designing this operational ship-handling display:
- Contrast is needed to carry information; this may be colour contrast or luminance
contrast, or contrast from differing linestyles or symbol shapes. All these inter-relate with each other,
- When planning colours, begin with the background colours, the area fills for
depth zones and land. Then work on the foreground lines and symbols, making sure they have good contrast with all their backgrounds,
- Use redundant coding for important features. For example the ship's planned
route is a prominent dark red, which shows well against both the white deep water of the daytime colour table and the black deep water at night, and it is also a thick dotted line, the only such line on the display,
- Design for the worst case; fit the rest in afterwards. For the ECDIS this means
setting up the display for bright sunlight, when all but the starkest contrast will disappear, and for night when so little luminance is tolerated that area colours are reduced to shades of dark grey (maximum luminance of an area colour is 1.3 cd/sq.m compared with 80 cd/sq.m. for bright sun) and only fine lines can be bright,
- Keep the software simple. For example, line weights are not changed for
different colour tables as this would require a conditional symbology procedure. 2.1.2
The diversity and flexibility of ECDIS
The challenge presented by the versatility of ECDIS is illustrated below: The diversity of information may include: - physical chart information, (e.g. coastline, depth contours, buoys), - traffic routeing; specified areas; cautions; etc., - supplementary HO information from light list, etc., - mariner's notes; additional local chart information; manufacturer's information, - chartwork such as planned route; electronic bearing lines and range rings; etc., - own ship's position and velocity vector; ship's head and rate of turn; past track, - fix accuracy, or position check from secondary positioning system, - possibly, shiphandling options, based on ship's characteristics, alphanumeric
navigation information (ship's latitude, longitude, heading, course, etc.), - information from radar and other sensors, - information from AIS, - navigational indications and alarms generated by ECDIS, - possibly, telemetered information from shore authorities, (traffic, real-time tides
14
S-52, Edition 6.0 March 2010
etc.), - possibly, ice information, - reminders, (e.g. time to contact pilot station), - possibly, messages from other displays (e.g. alarm on engine room display). The flexibility of presentation may include: - displaying/removing various types of chart and non-chart information, - selecting standard chart display or a thinned out display, and full or simplified
symbols, - using cursor interrogation for further detail, - overlaying/removing radar video or radar target information (in order to: confirm
ship's positioning; aid radar interpretation; show the entire navigation situation on one screen),
- overlaying/removing various other sensor information, or information telemetered from shore,
- changing the scale or orientation of the display, - selecting true motion or relative motion, - changing screen layout with windowed displays, text information in the margins,
etc., - possibility of pull-down menus and other operator interaction devices being
alongside the operational navigation display and so interacting with it, - giving navigation and chart warnings such as "too close approach to safety
contour"; "about to enter prohibited area"; "overscale display"; "more detailed (larger scale) data available"; etc.,
- possibly, a diagrammatic representation of a computer evaluation of grounding danger,
- possibly, a diagrammatic representation of the immediate vicinity of the ship to aid in close quarters manoeuvring,
- other future developments. (Further presentation requirements and techniques appropriate to ECDIS are likely to be developed in future).
2.1.3
Colour discrimination on the display: perception effects and display calibration
Since colour is a prime means of distinguishing features, the maximum range of colours should be available. However the colours selected must be such that they can be clearly discriminated by a mariner with normal colour vision, and colour induction effects must be avoided (for example a small green object on a saturated blue background will tend to appear yellow).
Absolute accuracy in colour reproduction is not required but relative colour fidelity is important. To ensure clear contrast between colour-coded features the display screen should be calibrated before use, and this calibration should as far as possible be maintained while in service. If this is not done, lines, symbols, and area shades may become indistinct, and information may then be lost or become misleading. This problem is discussed in section 4 and 5 and Annexes B and C.
The ambient lighting on the bridge varies between the extremes of bright sunlight, which washes out information on the display, and night, when the light emitted by the display has to be low enough that it does not affect the mariner's night vision. These specifications have been designed to meet these difficult requirements rather than less demanding normal day conditions.
15
S-52, Edition 6.0 March 2010
2.2 Operational Considerations 2.2.1
Similarity to the paper chart
Because much experience is embodied in the paper chart, and to avoid confusion in the extended period while paper charts and ENCs co-exist, the two presentations should be similar wherever possible. While recognising that the application of ECDIS extends beyond that of the paper chart, paper chart practice should be followed unless otherwise specified in these specifications.
However, because the ECDIS display uses emitted light, compared with reflected light for the paper chart, ECDIS must switch to a negative image of the chart at night, using a dark background in place of the white background of the paper chart, in order not to impair night vision.
In addition, studies and early experience indicate that the need for good visual communication between the ECDIS display and the user may require simplification and change of symbols traditionally used on paper charts. Some alternative display methods have been introduced as options in the Presentation Library.
2.2.2
Distinguishing between features and between sources
It should be possible to distinguish clearly on the display between a very large number of features. These are listed as classes in section 2.1, such as different water depths, various types of buoys and beacons, chart lines compared with navigators lines, and so on. It should also be possible to distinguish between sources, such as ENC information; hand-entered N to Ms, local information, and mariner's notes and manufacturer's additional information.
The means available for coding these distinctions are limited. They include:
- coloured areas, lines and symbols, - coded lines (e.g. dashed) and areas (e.g. patterned), - symbols, - text labels (but these cause clutter), - cursor interrogation, - switching a class of information on/off either automatically or by hand, - splitting information into separate windows, - common sense interpretation (e.g. a red buoy, a red arc indicating a light sector,
and a dotted red line indicating planned route, are unlikely to be confused, even though all are coloured red).
Because there are more demands for making distinctions than there are coding methods available, duplicate coding will sometimes be unavoidable, as in the above example. Distinctions should be made logically and systematically, giving priority to features that have greater operational significance.
2.2.3
Route Planning / Route Monitoring: Look-ahead
The IMO Performance Standards for ECDIS distinguish between the route planning and route monitoring modes of using ECDIS. It is expected that in route planning the display will be viewed, without urgency, from the normal screen viewing distance of about 70 cm, and so the display can contain considerable detail without causing confusion.
16
S-52, Edition 6.0 March 2010
Experience up to now of route monitoring indicates that in that mode the display will be used for immediate decision-making, sometimes under stress, and that it may be viewed from a distance of several metres. The route monitoring display should therefore be planned to present only the immediately relevant information, in a manner that ensures it can be taken in quickly, clearly and without ambiguity.
In particular, text is difficult to read and tends to cause clutter. It should be kept to a minimum on the route monitoring display.
If there is a delay in preparing data for the route monitoring display (e.g. due to a request for scale change, or look-ahead to another area) the ECDIS should inform the mariner. The previous display should be maintained, and updated, until the new display is ready for draw.
Because the display screen is smaller than the paper chart, the IMO PS specify that the ECDIS display should have the capacity for local as well as distant look-ahead. To provide this will be an important consideration in presentation design. While, for example, manufacturers may provide a smaller scale look-ahead display by windowing, these Specifications must take into account the fact that important features such as lights, future waypoints, etc., may often lie out of sight off the screen.
2.2.4
Important features should always be clear and conspicuous
These specifications are designed to make important features (e.g. own-ship symbol, own-ship safety contour, etc.) more conspicuous than minor features.
Ergonomic specialists point out that, to avoid ambiguity, important features, such as those in the IMO PS Display Base, should be redundantly coded. (Two examples are the own-ship safety contour, which is a thick line and has a sharp change in the colour of the depth shade, and the planned route, which is red and is the only heavy dotted line on the display). This serves to improve the visibility of important features on the route monitoring display, and it also helps to distinguish features in bright sun or at night.
Chart features should normally be written over the radar image. See section 2.3.2b for details.
2.2.5
Scale and range indicators
The "(indication of) scale and range" required as part of the Display Base by IMO PS Appendix 2 is intended to give the mariner an immediate appreciation of (a) how close to his ship are hazards seen on the display, and (b) how much time he has to decide on any necessary avoiding action. Two indicators should be provided:
- a one-mile scale bar for a large scale display and a ten-mile latitude scale for a
small scale display (see section 3.2.3(9) for details). This indicates roughly how close display features are; the cursor or VRM should be used for exact range measurement,
- an emphasized six-minute marker on the course and speed made good vector
(see IEC symbol 3 and Part II of the Presentation Library).
17
S-52, Edition 6.0 March 2010
2.2.6
Effect of bright sunlight, and the dark night display
It will not be possible to read the ECDIS display if the sun is shining directly onto it. Even diffused bright sunlight on the bridge tends to wash out the colours of the display so that they tend to look grey. The "day" colour table has strong contrast to combat this effect. But it helps to shield the face of the screen. The face of the display screen acts as a mirror to white shirts, sometimes seriously obscuring the chart display. Wearing a black cotton (not synthetic) watch-coat will greatly improve viewing on a sunlit bridge.
At night several factors combine to reduce colour discrimination:
- the display must be darkened to a level at which it does not impair the mariner's
night vision, hence his ability to keep a look-out, - the ability of the human eye to distinguish colour is reduced at low light levels, - the display screen is less capable of discriminating between colours at low
levels. A dark colour may drop below the screen cut-off and become black.
Note that ships tend to arrive in port at 0800 and sail by 1700, to reduce port charges; thus the critical passage through the port approaches often occurs at night.
The night colour tables are designed to overcome night viewing problems as far as possible, and some other measures are taken as well:
- important features are distinguished by redundant symbol/linestyle coding as well
as colour, (e.g. own-ship is a unique double circle , in heavy white at night), - if it happens that the entire night display area consists of only one depth zone,
the mariner will not be able to judge by absolute colour discrimination which of these depth zones the ship is in. A clearly visible "depth less than safety contour" pattern is provided to indicate shallow water (section 3.2.3(15)),
- the mariner should be advised to adjust the night display of a display screen by
contrast control, not by brightness, which may shift dark colours below cut-off.
Use of a 0.9 ND optical filter over a relatively bright display is a better solution for night viewing than reducing the display brightness.
2.2.7 Location for the ECDIS display
Experience in sea tests has shown that it is important to select an appropriate location for ECDIS. For example: - the navigator should be able to see the display clearly, and to reach the controls,
from his normal conning position, - it is an advantage to locate radar and ECDIS side by side, - the face of the display should be shaded from direct sunlight, and the display
should not be located where the viewer may find the sun directly behind it.
2.2.8 Displaying text
The power of ECDIS lies in conveying operational information quickly, clearly and comprehensively through a picture, a birds-eye view of the ship and her surroundings. Text should be avoided on this graphical operational display unless it is
18
S-52, Edition 6.0 March 2010
absolutely necessary, because it conveys limited information and, since it has to be written large to be readable, causes confusing clutter. However some text may be unavoidable, both on the operational display (e.g. buoy numbers if these are required for VTS reporting) or on a separate text display (e.g. course to steer, heading; alarms; tidal information; user interaction to control the ECDIS, etc.). (See also sections 2.3.3c, 3.1.5 and 3.4, and section 7.1.3 of the Presentation Library).
2.2.9 Flashing to draw attention
The capability to flash a symbol should be used only rarely in very special cases. It should be used to draw attention rather than to simulate a real flashing object.
2.2.10 Operator control of information should be effective and simple
In order to handle the diversity of information and flexibility of display options provided by ECDIS without confusion, the presentation of information must be designed carefully. In particular, the operator interface should provide clear, simple control of the display such that there is no danger of confusion, or of failure to retrieve important chart information in a stressful situation. "Viewing Groups", as an optional way of giving the mariner control over the information on the display, are described in section 8.3.4.4 of the Presentation Library. The mariner should have full control over any automatically linked display changes, including the option to inhibit such changes. Examples of linked display changes include changing the source of data when a larger scale becomes available, or displaying lights automatically when the mariner selects the "Dusk" colour table.
There should be enough commonality between the user interfaces of the various makes of ECDIS that a pilot, or watch officer new to the ship, can use an unfamiliar type of ECDIS. However, over-strict standardisation will hamper development of an effective interface.
2.3 Organising the Information for Display 2.3.1
Display of non-chart information
2.3.1a
Distinguishing between chart data and additional data
IMO PS section 1.5 states that ECDIS should enable the mariner to execute the chartwork at present performed on the paper chart and section 3.3 states that the SENC may contain information from other sources than ENCs. This specification requires that ECDIS distinguish between chart data and additional data from users (mariners) and manufacturers. The following colour and symbol usage for mariners and manufacturers data is designed to implement this while ensuring the display remains clear and uncluttered.
Part II of Annex A "Presentation Library" describes "Mariner's Navigational Objects" for route planning and route monitoring chartwork, and for adding mariner's and manufacturer's information to the SENC. The descriptions are in the same format as
19
S-52, Edition 6.0 March 2010
chart objects, in order to avoid the ECDIS having to deal with two differently coded types of data. The colours, symbols, categories and display procedures that apply to all these objects are included in Part I of the Presentation Library, along with the procedures for chart objects.
Mariners may alter the IMO categories for Mariner's Objects (but not for chart objects). Note, however, that IMO PS 11.4.1 requires that own ship and selected planned route should always appear, and should therefore remain in Display Base.
Note that Mariner's Objects should be kept independent of chart data in the SENC, and that mariners' information does not need to be split into cells.
In referring to Mariner's Objects it is important to distinguish between:
"Add/Enter", "Revise" or "Delete" mariner's or manufacturer's information; this refers to the contents of the SENC, and:
"Display" or "Remove" the information; this refers to the ECDIS display. 2.3.1b
Mariner's Information on the route monitoring display
In addition to the ability to enter manual chart corrections and to carry out route planning and route monitoring chartwork, the mariner should be provided with the capability of adding at least the following symbols, lines and areas to the SENC, and should be able to revise or delete them:
.1 the caution “(!)” or information “[i]” symbol section 3.2.3 (6b), (6c), used to call up
a note on the text display by cursor picking, .2 simple lines and areas with or without colour fill, set up for cursor picking to give
an explanatory note in the text display, .3 any of the chart symbols in the Presentation Library, .4 text notes.
Non-ENC chart information added by the mariner should be in normal chart colours, identified as described in the Presentation Library, Part I, section 8.7.2.
Other information added by the mariner should be distinguished by the colour orange (colour token NINFO) except for colour fill, which should use transparent yellow (colour token ADINF). (Transparent orange tends to look magenta in colour over blue backgrounds).
Mariner's information should not overwrite ENC information.
The symbols and instructions for using the IEC "Mariners' Navigational Objects" are given in Part II of the Presentation Library.
2.3.1c
Manufacturer’s Information on the route monitoring display
.1 If the manufacturer should add non-chart information to the SENC, he should use the following symbols, lines and areas:
(i) the circled “!” caution symbol SY(CHINFO11), or boxed “i” information
symbol SY(CHINFO10), used to call up a note on the alphanumeric display by cursor picking,
20
S-52, Edition 6.0 March 2010
(ii) simple lines, or areas without colour fill, set up for cursor picking to give an explanatory note in the alphanumeric display (colour fill should not be used).
(iii) Non-chart information entered by the manufacturer should be distinguished
by the colour yellow (colour token ADINF). It should not overwrite HO ENC information.
.2 If the manufacturer should add non-HO (non- ENC) chart information to the
SENC it should be symbolised in the same way as HO chart information and distinguished from HO chart information as described for the various cases below:
(i) Limited non-HO data is added to existing HO data to augment the chart
information. Each object should be marked by the special identifiers described in the Presentation Library, section 8.7.2.
(ii) An area of non-HO data is located in waters for which HO chart data
exists; it is superimposed on the HO data. In some cases the non-HO data may be more appropriate for the intended purpose, for example it may be more detailed.
In this situation it is at the mariner’s discretion whether to use the HO or the non-HO data.
If the mariner selects the non-HO data, the boundary of this data should be identified on the ECDIS display by the line LC(NONHODAT) and the warning “Unofficial data displayed; refer to official RNC or paper chart” should be displayed.
Note that the LC(NONHODAT) is a “one-sided line”, and the boundary of the area of non-HO data must be drawn according to S-57 rules to ensure that the diagonal stroke of the line is on the non-HO data side of the line. More details are given in PresLib section 12 conditional symbology procedure DATCVR section 2.1.
(iii) An area of non-HO data is located wholly outside the area covered by HO
data (although it may share a boundary with the HO data) but is shown on the same display as HO data. The non-HO data should be bounded by the line LC(NONHODAT) and the warning “Unofficial data displayed; refer to official RNC or paper chart.” should be displayed.
(iv) The entire display contains nothing but non-HO data. The warning “No
official data available; refer to official RNC or paper chart.” should be displayed. In this case, special identifiers need not be used."
.3 The mariner should be able to remove all manufacturer's information if the need
should arise. 2.3.1d
Displaying the radar image
The radar image may be displayed by an opaque overlay or a transparent overlay, using colour tokens RADHI and RADLO. Further details are given in section 4.2.7.
21
S-52, Edition 6.0 March 2010
2.3.1e
Displaying pick reports
The following information should be shown on demand on the same screen as the chart display or on an additional graphic or text display: - Positional data and time;
- legend; - object description and associated attributes (result of "cursor query") in human
readable language, including the meaning given in the Presentation Library for any symbol selected by cursor-pick; textual information from ENC, e.g. cell name, compilation date, date of issue;
- record of ENC-updates; - ECDIS Chart 1 [formerly mistakenly named “list of abbreviations" (from INT 1)]; - [colour differentiation diagram]; - [black adjust symbol for contrast adjustment]; - list of categories which are removed from Standard Display; - Edition number of Presentation Library in use.
2.3.1f
Units
There should be no ambiguity about the units in use at a particular time. The units listed below should be indicated in the display legend:
(1) Position: latitude and longitude in degrees, minutes and decimal
minutes.
(2) Depth: metres and decimetres.
(3) Height: metres.
(4) Distance: nautical miles and decimal miles, or metres.
(5) Speed: knots and decimal knots. 2.3.1g
Legend
A standard legend of general information relating to the area displayed, applicable to the ships position, should be shown on a graphic or text display. This legend should contain at minimum:
(1) units for depth
(2) units for height
(3) scale of display; in addition overscale indication where appropriate
(4) data quality indicator
(5) sounding/vertical datum
(6) horizontal datum
(7) the value of the safety depth if used
(8) the value of the safety contour selected by the mariner, as well as the
value of the safety contour displayed (which may be different from that
22
S-52, Edition 6.0 March 2010
selected by the mariner)
(9) magnetic variation
(10) date and number of last update affecting the chart cells currently in use
(11) edition number and date of issue of the ENC
(12) chart projection 2.3.2
Priority of information
2.3.2a
Priority layers
The IMO PS divides SENC information into three categories that determine what data is to be on the display: Display Base (always present on the display); Standard Display (the default display); and Other Information (displayed on demand). (IMO PS section 3 and Appendix 2). (See section 2.3.3a).
There are 10 priority layers for the drawing sequence of the data on the display:
(1) ECDIS visual alarms/indications (e.g. caution, overscale)
(2) HO-data: points/lines and areas + official updates
(3) NtMs, manual input and Radio Navigational Warnings
(4) HO-caution (ENC cautions)
(5) HO-colour-fill area data
(6) HO's on demand data
(7) Radar information
(8) Mariners data: points/lines and areas
(9) Manufacturer's data: points/lines and areas
(10) Mariners colour-fill area data
This list is not intended to indicate a drawing sequence, but to specify that the information content of category n+1 must not obscure the information content of category n, or any higher category (i.e. n-1 etc.).
Category (7) should have a radar off switch to facilitate its removal.
The look-up tables and conditional procedures of the Presentation Library assign a category, and a display priority (drawing sequence), to every object (object class-attribute combination) in the ENC.
2.3.2b
Radar priority
The priority of HO chart data over radar is carried out by the single action "remove radar" control (IMO PS 7.2). When present, the radar data is always written over the
23
S-52, Edition 6.0 March 2010
eight opaque area fills (see 3.1.2). Chart line and point features should normally be written over the radar image, with some exceptions, as described in the "over-radar" field of the Presentation Library look-up table. But in order to meet the requirements of IMO PS 11.4.14 to adjust the ship's position, the ECDIS may incorporate the capability of changing the radar priority of the Presentation Library. Operation of this feature should be clearly indicated.
2.3.3
Display categories
2.3.3a
IMO categories
The IMO "Standard Display" provides a starting point. It is a list of objects that the mariner may either add further objects to, or remove objects (except Display Base) from, in deciding what is to be displayed. Note that as soon as any object on this list is removed from the display, or any object not on this list is added to the display, the display no longer shows the IMO "Standard Display".
The IMO "Display Base" is that part of the Standard Display that should never be removed. It is a list of basic objects which the IMO consider are required at all times, in all geographic areas and under all circumstances. Note that the IMO do not intend the Display Base to be sufficient for safe navigation on its own; therefore it should not be a display option to "Show Display Base" without any additions.
The IMO category "Other Information" contains every object in the SENC which is not classed as "Standard Display".
The mariner should be able to remove information selectively from "Standard Display", except that he cannot remove any object of the "Display Base". And he should be able to add selectively to the Standard Display any items of the "Other" category.
Field 6 of the look-up table of the Presentation Library assigns the IMO category in detail to every object in the SENC, including Mariner's Navigational Objects. The mariner may override the category for mariner's objects, but not for chart objects.
2.3.3b
Selecting objects for the route monitoring display
Section 5.5 of the IMO Performance Standard requires that "It should be easy to add or remove information from the ECDIS display". For example, the mariner might want to retain "caution areas" from the Standard Display (see Table 4 of this document) but remove the remaining thirteen areas, including such as protected areas (e.g. "game preserve"). Another example is that he might want to add soundings from "Other", but omit submarine cables (which cause serious clutter at certain ocean terminals).
As an aid to adding and removing information from the display, field 7 of the look-up table also assigns every feature in the SENC to a viewing set, and these sets are arranged in groups of ten which are related to the lettered groups of INT 1 for the paper chart, a classification which is familiar to the mariner. The details are given in the Presentation Library, Part I, section 8.3.4.4 and Table 13.2.
The manufacturer is responsible for organising SENC features, viewing sets and viewing groups for display in such a way that the mariner has reasonable flexibility in selecting what he sees without the selection process becoming too complex. Note that it is not necessary to provide access to each feature, viewing set or even viewing group individually.
24
S-52, Edition 6.0 March 2010
Note that combined groups which include features from different IMO categories should not be linked permanently, since doing so would, in effect, drag additional features into the Display Base or Standard Display. For example, if a combined group includes soundings (which are "Other") and lights (which are "Standard Display"), this link should not cause soundings to be shown with the Standard Display on first switching on the ECDIS.
2.3.3c
Selecting text for the route monitoring display
The ECDIS manufacturer should provide the mariner with control over the selection and display of text on the route monitoring display.
Text should not appear automatically whenever the object it is associated with appears on the display. It should always be possible to remove text independently of the object. The IMO Display Category for text is "other".
As a guide to adding and removing text from the display, the Presentation Library distinguishes between "Important text" and "Other text", and provides suggested groupings for text display, in section 7.1 and Table 13.3 of the Presentation Library.
Section 3.4 of this document gives further details on text.
2.3.3d
Linkages in selecting mariner's options
Many other options are available to the mariner in addition to those discussed above. Although these may at first be confusing, linkages which reduce these options but which also reduce the performance of the ECDIS should not be used. For example:
- lights should not be automatically displayed when the night colour table is
selected. (Lights cause clutter and under certain circumstances the mariner may not want them on the display.)
- as stated in section 3.1.1, symbolized area boundaries should not be
automatically selected when paper chart point symbols are selected. (Symbolized area boundaries are needed for large scale displays showing a number of overlapping areas, whereas the selection of paper chart point symbols is a personal preference and is independent of display scale.)
Because vessels vary widely in their requirements and their operational procedures, linkages between options which reduce the flexibility of the ECDIS should be avoided.
2.3.4
Displaying ECDIS updates
For guidance on updating the ENC, see Appendix 1. This section deals with how updates should be displayed. It is keyed to the relevant sections of the IMO PS.
IMO PS 4.5 Automatic and semi-automatic updates: these should be
displayed in the same manner as ENC information, using standard colours and symbols.
IMO PS 4.6 Manual updates: these should be displayed in standard colours
and symbols and distinguished as described in the Presentation Library , Part I, section 8.7.
25
S-52, Edition 6.0 March 2010
IMO PS 4.8 The mariner should be able to display updates for review as follows:
For automatic updates: the manufacturer should provide a
means of distinguishing these. One method suggested is to identify automatic updates temporarily in the same manner as manual updates. The temporary switch-on/switch-off of the identifiers would distinguish automatic from manual updates.
For manual updates: display all SENC information. The
manual updates should be distinguishable as described in the Presentation Library , Part I, section 8.7.
26
S-52, Edition 6.0 March 2010
3 SPECIFICATIONS FOR SYMBOLISING AREAS, LINES & POINTS AND FOR TEXT 3.1 General 3.1.1
Mariner's options in symbols and linestyles
Although buoys and beacons are aids to navigation, they may also become a collision hazard if their presence is not noticed. The Presentation Library therefore provides, as a mariner's option, an alternative set of symbols for buoys and beacons which are more prominent than the paper chart symbols, particularly on the night display. Two look-up tables are provided, to display either simplified or paper-chart type buoy and beacon symbols.
Areas are difficult to symbolise on an ECDIS, for reasons given below. The Presentation Library therefore provides, as a mariner's option, symbolised area boundary linestyles for use on large scale displays. These make the areas easier to figure out than the plain linestyles recommended for small scale displays, where symbolised lines would cause clutter. Two look-up tables are provided, to display either symbolised or plain area boundary linestyles.
The mariner should be given the option of selecting the buoy symbols and area boundary linestyles that best fit the situation, without linkages. For example, boundary linestyle should be selectable independent of the choice of buoy symbol, and independent of the actual display scale.
3.1.2
Areas
The moving display window of ECDIS, coupled with the possibility of the mariner using a large scale (small area) display window that could lie wholly within a given area, so that the border is not visible, give problems in symbolising.
Areas can be identified both by symbolising the area itself and by symbolising its boundary.
The mariner has to be made aware of any important area, and its identity, but the symbolising should not cause clutter.
3.1.2.1
The following methods of symbolising the area are used:
.1 Opaque colour fill
: depth areas and land areas. These consist of (with colour token):
deep water, and also user interface - background (DEPDW & UIBCK) medium deep water (DEPMD) medium shallow (DEPMS) very shallow (DEPVS) intertidal area (DEPIT) land in general (LANDA) built-up areas (CHBRN) no chart data (NODTA)
Eight colours are used, which matches 8-bit graphics devices. They form a subdued background giving maximum contrast to foreground information, including the radar image, all of which are drawn on top.
27
S-52, Edition 6.0 March 2010
.2 Semi-transparent colour fill
- traffic separation zone and mariners chartwork area fill.
: Depth zones should show through this, and all other information is drawn on top, e.g.:
.3 Patterns of lines
- traffic junctions - closely spaced magenta diagonal lines - AP(TSSJCT 02),
: for important area features in busy waters; the pattern should not be distracting, e.g.:
- grossly overscale part of chart display compiled from two compilation scales - faint grey vertical lines - AP(OVERSC 01)
.4 Continuous textures
- area with no data - AP(NODATA 03),
: need to show up in small areas; may be used for features in busy waters and so should not be distracting, e.g.:
- dredged area - ordered dot pattern, AP(DRGARE 01), - ice area - random short lines, AP(ICEARE 04). .5 Patterns of symbols
- aquaculture - AP(MARCUL 02)
: used in less busy areas, or displayed temporarily and then removed, so can be more distracting, e.g.:
- quality of bathymetry - AP(DQUAL 11) .6 Single centred symbol
- traffic lane - SY(TSSLPT 51)
: used for important features in busy waters, such as traffic lanes, restricted areas. The symbol is large to give it visibility, but faint in colour to reduce clutter, e.g.:
- anchorage prohibited or restricted - SY(ACHRES 51)
These artificial areas are difficult to symbolise because one symbol must apply to all sizes, for example from the case when the display window is wholly inside a traffic lane, to an "area to be avoided" the size of a postage stamp on the display.
In addition, some areas such as traffic routeing systems often have multiple conditions (e.g. “traffic direction” + "deep water route" + "entry restricted"). Many of the symbols in the Presentation Library have deliberate offsets from the pivot point to avoid overwriting.
The Presentation Library provides large transparent symbols for centred symbols and small symbols for pattern coverage:
(a) Centred symbols are used where it is important to avoid clutter, particularly in
traffic lanes. The symbol must be placed within the area. See Presentation Library 7.4 for one method of centring a symbol.
(b) (i) For a pattern of small symbols, the spacing between the symbols lies
within the limits: minimum distance apart: 2 cm. maximum distance apart: 10 cm. (ii) It would be ideal to space the symbols further apart for a large area and
closer together for a smaller area. However reliable symbolising is more important, and a constant fixed-space symbol pattern should be used until "scale dependent spacing" has been developed and proved. See Symbol Library in Addendum.
28
S-52, Edition 6.0 March 2010
(iii) While a good-looking solution is desirable, identification without clutter is more important. Pattern symbols need not line up exactly between cells; and they need not stay in the same geographic position on re-draw.
(c) It should always be possible to identify an area by cursor picking on any point
within the area.
(d) If the ECDIS offers a ship-centred display mode, the manufacturer should avoid overwriting between the ship symbol and a centred symbol for an area which wholly encloses the display (for example the traffic direction arrow (TSSLPT) in a very large traffic lane such as Dover Strait).
3.1.2.2
Symbolising the area boundary:
.1 Discussion
: on a large scale display of busy waters the boundaries of many areas may appear without the whole of each area being on the display. While the centred symbols will be there, it will often be difficult to know which area they apply to. It may also be difficult to decide which side of a particular boundary line is the inside of the area.
To help clarify this situation, the Presentation Library includes two area look-up tables: (i) the "symbolised area boundaries" table, using symbolised and "one-sided" versions of the boundary lines of important areas. This is for use at large scale as a mariner-optional alternative to (ii) the "plain area boundaries" table, which uses simple linestyle area boundaries. This will normally be preferred at smaller scales to avoid clutter.
.2 Symbolised complex linestyles
anchoring prohibited or restricted - LC(ACHRES 51)
: to identify the area, symbols (or letters acting as symbols) are embedded in the line, e.g.:
deep water route - LC(DWRUTE 51) .3 One-sided complex linestyles
entry prohibited or restricted - LC(ENTRES 51).
: to identify the side of the boundary line on which the area lies, restricted areas use the traditional "T" linestyle of the paper chart, e.g.:
Other important areas use a boundary linestyle like the cold front on a weather map, e.g.:
waiting area - LC(CTYARE 51) fairway - LC(NAVARE 51)
.4 Simple linestyles:
dashed lines are generally used for area boundaries. In ECDIS, the dotted line is reserved for the danger line around foul areas, etc.
.5 Colours
traffic areas, caution areas - magenta
: the colour magenta is used for important areas, grey for less important areas, e.g.:
harbour limits - grey 3.1.3
Symbol Specifications: Presentation Library
All symbols are specified in the Symbol Library for ECDIS, which is in the addendum to the Presentation Library.
29
S-52, Edition 6.0 March 2010
Some object classes do not have a symbol (e.g. territorial sea). Such "no symbol" objects may be picked up by cursor interrogation of the area.
Should an "unknown object" occur in the SENC which is not adequately defined or for which no symbol exists, its presence should be indicated on the display by a magenta"?" SY(QUESMRK1) with the IMO category "Standard Display".
Some objects are symbolised differently depending on circumstances (for example the symbol for a contour depends on whether it is the safety contour.) The Presentation Library includes conditional symbology procedure diagrams for features whose symbols cannot be supplied by a fixed look-up table. Some of these procedures are unavoidably complex, and they should be evaluated carefully.
3.1.4
Paper chart INT 1 and ECDIS Chart 1
IHO INT 1 for paper charts is both the starting point for the new simplified symbols and the check-list for paper-chart type symbols on the ECDIS. The new symbols simplify the paper chart symbols where operationally proved necessary, to improve readability and drawing speed on the display; they also symbolise new features introduced for ECDIS, such as the Daymark.
Note
: the digital version of ECDIS Chart 1 depends on a volunteer to update it, and it may be omitted from editions after 3.4.
Section 14 of the Presentation Library includes an ECDIS chart 1, a graphical index of ECDIS symbols including both simplified and paper-chart point symbols, and also the symbolized lines and area boundary linestyles. This is intended to familiarize the mariner with the colour and symbol coding used by the ECDIS. The symbols are grouped according to INT1, which is familiar to the mariner, but are numbered with a look-up sheet, not labelled. A digital version of ECDIS Chart 1 is part of the PresLib; the manufacturer should provide linking by cursor interrogation between the symbols and the explanations given in the symbol library.
The ECDIS Chart 1 is intended for use off-line and in route planning. It is not needed during route monitoring, when the mariner can use cursor enquiry to find the meaning of symbols.
Technical details of the digital ECDIS Chart 1 are given in sections 18.8 and 19.3 of the Presentation Library.
3.1.5
Size of lines, symbols and text; fonts
Lines and symbols and text should be large enough that they can be easily interpreted at the operational viewing distance. This will be about 70 cm for route planning, but experience to date indicates that the viewing distance for important features during route monitoring may be several metres. Human factors experts quote a minimum requirement that symbols and characters subtend 20 arc minutes at the observers eye (for example, a symbol viewed from 70cm for route planning should be about 4mm in size, 1.5 times the size of a normal chart symbol. Two times chart size is a good general rule.). Symbols and characters important for route monitoring may have to be significantly bigger.
For clear representation, symbols require a minimum number of screen units (pixels), depending on their complexity. A simple chart symbol should extend about 12 pixels
30
S-52, Edition 6.0 March 2010
(that is about 4 mm for an IHO standard screen).
The minimum sizes for all symbols should be as shown in the Presentation Library.
In addition, the symbols should always be drawn with at least the same number of pixels as are required to draw the symbol at the size defined in the Library for the minimum resolution and minimum chart display area (270x270 mm). That is, the minimum height in pixels
of a symbol is: (symbol height in mm) divided by 0.312 mm (where 0.312 mm is the "pixel size" for the minimum size chart display in Section 5.1 – Physical Display Requirements).
When the display scale is enlarged by zooming in, it should be possible to hold symbol size constant. The same applies to text. Symbol and text size should never be decreased when zooming out.
The text on the ECDIS should be readable from 1 metre.* Sans serif, non-italic fonts should be used. The computer ø should not be used.
Because several appropriate commercial fonts are available, the Presentation Library does not specify alphanumerics, except for soundings. The manufacturer should make his own arrangements for the use of a font. A plain, clearly readable font such as Univers should be used. In most fonts, pica 8 is too small to read.
*IEC 60945 specifies that character size in mm be not less than 3.5 x the viewing
distance in metres. Hence "readable from 1 metre" requires that characters be not less than 3.5 mm in size.
3.1.6
Display Orientation
It should always be possible to display the chart north-up (IMO PS section 8.1), but other orientations are allowed. (Human factors specialists point out that course-up orientation offers some safety advantages, and operational reports support this)
Symbols and text should always be drawn screen-up, no matter what the orientation of the screen may be. Symbols which include “rotate” in the symbology instruction (eg light flares) should be rotated with respect to the top of the screen. However symbols that are oriented according to an S-57 attribute such as ORIENT should be oriented with respect to true north. Further details are given in the Presentation Library, Part I, section 7.2.3.
If the display is oriented course-up, the orientation should not be altered too frequently, in order to avoid jitter from frequent rewriting of chart information.
The north arrow is always required on the display, as part of the IMO Performance Standards Display Base.
3.1.7
ENC scale; Graphical Index of ENCs by Navigational Purpose; Limit of HO data
.1 ENC scale. The compilation scale of the ENC is the scale at which the ENC was designed to be displayed. It may not be the same as the scale of the source data. As required by IMO Performance Standards, section 6.1.1, an overscale indication should be shown whenever the mariner selects a display scale that is larger than the compilation scale. See Presentation Library, Part I, section 12.2.2 DATCVR for details.
31
S-52, Edition 6.0 March 2010
.2 Automatic overscale at a scale boundary.
Where ENCs of different navigational purpose overlap, the ECDIS display of the overlap area should show two “chart compilation scale boundaries”, at the beginning and end of the overlap. Beyond one boundary the part of the display taken from the smaller scale ENC will often be grossly overscale. (See section 3.2.3 8(b))
Only the major changes in compilation scale resulting from a change in “navigational purpose” should be shown as scale boundaries on the display. Small changes in compilation scale within a navigational purpose should not be shown.
The Presentation Library, Part I, section 12.2.2 DATCVR, specifies how the scale
boundaries and the overscale area should be symbolised.
When the display cannot be completely covered with ENC data for the selected navigational purpose, the remaining part of the display should be filled with data based on a more general navigational purpose (if available).
.3 Graphical Index of ENCs by Navigational Purpose.
Without cursor enquiry of the chart area it will not always be clear what compilation scale applies to a given part of a mixed source display. S-52 requires a graphical index of the navigational purpose of the data to clarify the situation. This is also needed for route planning.
.4 Limit of HO data.
The end of HO chart data on this graphical index defines the limit of HO ENC coverage. Details are given in the Presentation Library, Part 1, section 12.2.2 DATCVR.
3.1.8
Chart data quality indicator
A bathymetric data quality indicator by zones of confidence (M_QUAL CATZOC) will cover the entire area of depth data or bathymetry for the ENC (although not all data will be assessed initially). The table of "CATZOC" values giving the meaning of each zone of confidence should be readily available to the mariner.
3.1.9
Cursor enquiry
It should be possible to call up any of the information associated with an object by cursor enquiry on its symbol. This should extend to areas (restricted area, depth area, etc.) and to "no symbol" areas (territorial seas, etc.) and meta-areas (information about the area such as compilation scale, etc.). The search for area information needs to extend only to the cell boundaries enclosing the position of the cursor.
See Presentation Library, Part I, section 8.8 for further discussion. 3.2 New Symbols for ECDIS (These are illustrated in the ECDIS Chart 1, provided in the Presentation Library). 3.2.1
Types of new symbols
Four types of new symbols have been introduced for ECDIS:
(1) Special ECDIS chart symbols to identify unsafe depths, such as the safety
32
S-52, Edition 6.0 March 2010
contour, safety depth, isolated dangers etc.
(2) Optional simplified chart symbols for buoys and beacons, and symbolized area boundary linestyles.
Since buoys and beacons are a potential hazard as well as an aid to navigation, simplified buoy and beacon symbols have been designed which are more compact and more prominent than the paper chart symbols, particularly at night.
On a large scale display, the boundary lines of areas can become confusing; symbolised area boundaries have been designed which identify the type of area involved and also indicate on which side of the boundary line the area lies.
The ECDIS should provide the mariner with the option of using either the traditional paper chart buoy and beacon symbols or the new simplified symbols, and either the symbolized or the plain area boundary linestyles, as best fits his purpose. The symbol tables of the Presentation Library are organised to facilitate these options.
(3) New chart symbols, such as north arrow, scale boundary, depth area less than
safety contour, etc., needed to explain the more flexible, electronic display based, presentation of ECDIS.
(4) IEC Mariner's Navigational Elements developed by IEC for IMO, which include
the important planned route and own ship symbols. The authority for these features is IEC Standard 61174 and IEC 62288, and they are included in the Presentation Library for convenient reference by agreement with the IEC. They are described by objects and attributes in the same manner as chart features so that only one symbolising routine is required (see Part II of the Presentation Library).
3.2.2
Special ECDIS chart symbols to identify unsafe depths
The ECDIS highlights in new ways four features that are important for safe navigation. These are the safety contour, depth shades, the safety depth and isolated dangers:
(1) The own-ship safety contour
, selected by the mariner from among the contours in the SENC, is double-coded by a thick line and a prominent change in depth shade.
If the safety contour selected by the mariner is not available in the SENC, the ECDIS should default to next deeper contour and inform the mariner. If, when the ship moves onto a new chart, the safety contour previously in use is no longer available, the ECDIS should again select the next deeper contour, and inform the mariner.
If the mariner does not select a safety contour, the value should default to 30 m. See Presentation Library, Part I, section 12.2.5 conditional procedure
DEPCNTnn for details.
(2) Depth zone shades
, defined by the safety contour and selected shallow and deep contours and the drying line.
The safety contour defines two depth zone shades and the drying line a third:
33
S-52, Edition 6.0 March 2010
deep water: deeper than the safety contour (colour token DEPDW), shallow water: shallower than the safety contour (colour token DEPVS), intertidal area: area exposed at low water (colour token DEPIT).
These are the only three depth shades that can be clearly distinguished on the night display, and they can only be distinguished by contrast, when seen on the display together. If, at night, the entire display consists of shallow water, the mariner will not be able to recognise this dangerous situation. Therefore, a "depth less than safety contour" pattern is provided in the Presentation Library to reinforce the depth shade. It is optional for the manufacturer to provide this feature, but its inclusion is strongly recommended as a safety feature.
The mariner should be given the option of whether to use this pattern, by night or by day (although it is not strictly necessary by day when the shallow water can be clearly identified by the difference in depth shade). This mariner’s option is built into conditional symbology procedure “SEABEDnn”. See Presentation Library , sections 8.5.7 and 12.2.18.
It is recommended that the ECDIS should also allow the mariner the option of selecting a deep contour and a shallow contour from among the contours in the SENC, thus establishing the following five depth zones:
deep water: deeper than the deep contour (colour token DEPDW), medium-deep water: depths between the deep contour and the safety
contour (DEPMD), medium-shallow: depths between the safety contour and the shallow
contour (DEPMS),
very shallow water: depths between the shallow contour and zero metre contour (DEPVS)
drying foreshore: intertidal area (DEPIT) The following depth zones may be used as default values:
deep water: deeper than 30 m (deep draught vessels) medium deep: own-ship safety contour to 30 m medium shallow: 2 m to the own-ship safety contour very shallow: 0 to 2 m (defines waters accessible to small craft) intertidal: exposed at low water
(3) The own-ship safety depth
is intended as an aid when no appropriate safety contour is available in the SENC. Soundings equal to or less than the safety depth selected by the mariner are made more conspicuous than deeper soundings. A separate set of sounding figures is provided in the Presentation Library.
(4) Isolated dangers
(small shoals, rocks, wrecks, obstructions) of depth less than the safety contour, and also lying within the 'safe' water defined by the safety contour, are highlighted by a special symbol. Because the mariner may sometimes have to navigate in water shallower than a default safety contour, the mariner may also select to show isolated dangers in the 'unsafe' water between the displayed safety contour and the zero metre contour.
34
S-52, Edition 6.0 March 2010
Instructions for these four procedures are given in the Presentation Library, Part I, section 12 'Conditional Symbology Procedures'.
3.2.3
Other new and simplified ECDIS symbols and their use
Other new chart symbols required by the difference in purpose between ECDIS and the paper chart, as well as the difference between paper and electronic presentation, are described below.
Note that all simplified point symbols are centred on the position of the feature.
(1) Simplified buoy symbols.
Sloping topmark symbols are used for lateral, cardinal, isolated danger and safe water buoys. They are coloured in the single most distinctive colour of the buoy (mixed colours in a small buoy symbol look faint on the night display). Special mark buoys are filled yellow circles, and all mooring buoys resemble the paper chart "installation buoy". The default buoy, used when a buoy is not fully described in the ENC or has no specific symbol in the Presentation Library, is a filled grey circle.
All symbols are centred on the position of the buoy.
When the name or number of the buoy is displayed, it is prefixed "By" by the Presentation Library, since otherwise a number can be mistaken for a sounding.
Note 1: this way of displaying buoys is designed primarily to show clearly that a
buoy is there, both to avoid collision with the buoy and as an aid to navigation. The details of buoy characteristics, which cause clutter and are difficult to show clearly on an electronic display under all bridge lighting conditions, should be provided by text command or by individual cursor interrogation.
Note 2: green radar on green buoys or light flares does not contrast well, hence
buoys and light flares are written over the radar and all light flares are surrounded by a black outline.
(2) Simplified beacon symbols.
Upright topmark symbols are used for cardinal and isolated danger beacons. Lateral beacons, safe water beacons and specials mark beacons are drawn as specific symbols for minor beacons, general beacons, and beacon towers. Beacons are shown in the same colour as buoys, except for the safe water beacon which is black (white at night). The default beacon is a grey general beacon symbol.
All symbols are centred on the position of the beacon. When the name or number of a beacon is displayed, it is prefixed "Bn".
(3) General symbol for isolated underwater danger.
This conspicuous magenta symbol is applied automatically to rocks, wrecks, small shoals, etc., of depth equal to or less than the own-ship safety contour
35
S-52, Edition 6.0 March 2010
and which are in deeper water than the safety contour. Optionally, the mariner may extend displaying isolated dangers to shallow waters between the safety contour and the zero metre contour, in case he is forced by circumstances to navigate in such waters.
(4) The dredged area is shown by a grey dotted area fill pattern.
(5) Radar conspicuous coastline.
This includes cliffs and abrupt coastlines that can be expected to return a strong radar echo consistently from the same part of the feature. The magenta highlight line is only used if the coastline is identified as "radar conspicuous" in the ENC.
(6) Prohibitions, cautions and information notes are symbolized with small
symbols for point application and with large centred symbols for areas, as illustrated in screens (AB), (JKL) and (MN) of the ECDIS Chart 1. Multiple symbols are used when necessary to convey more than one restriction.
Regulated areas are divided for symbolization into Cautionary Areas (including the existing caution area) and Information Areas, following the distinction established by the IMO/IHO Harmonisation Group on ECDIS in 1992. (See Table 4 of this document).
Point cautions and notes entered by the mariner and the manufacturer are distinguished by the colours orange and yellow respectively.
(7) Unknown object.
A magenta "?" marks the position of an object which cannot be identified or for which there is no entry in the Presentation Library look-up table.
(8a) Scale boundary.
This shows where the compilation scale of the chart data available changes. The ECDIS should warn the mariner of upcoming chart scale change. Only the major changes in compilation scale resulting from a change in "navigational purpose" should be shown. Small changes in compilation scale within a navigational purpose should not be shown. See Presentation Library, Part I, section 12.2.2 DATCVR for details.
(8b) Overscale area at scale boundary.
All the chart data on the display must be shown at the same scale. In order to avoid leaving part of the display blank, the chart display may extend beyond the edge of a relatively large scale ENC to include information from an adjoining smaller scale ENC, which may be from a different "navigational purpose". The smaller scale data will normally be enlarged to match the larger scale ENC, and in this case the "overscale area" symbol should be used to identify any part of the chart display shown at more than twice the compilation scale. See Presentation Library, Part I, section 12.2.2 DATCVR for details.
Note that this symbol applies only to the automatic overscaling performed by the ECDIS in matching ENCs at different compilation scales. It should not be applied to an overscale display deliberately requested by the mariner, which
36
S-52, Edition 6.0 March 2010
should trigger the overscale indication required by IMO Performance Standard section 6.1.1.
(8c) Change of units of depth. (This section is deleted) (8d) Change of horizontal (geodetic) datum.
The use of non-WGS 84 ENC data does not comply with IHO S-57, and the boundary at which the local geodetic datum changes is not symbolized by the Presentation Library.
The ENC may include information on the relation between the local geodetic datum and WGS 84 (M_HDAT, HORDAT), but this is intended for use in converting local data to WGS 84 for use in the SENC, should the need arise.
(9) Scale bar or latitude scale.
The IMO PS require an indication of scale and range as part of the Display Base. The display scale decides which should be used:
(a) for display scales larger than 1/80,000: always display the 1 mile scale
bar provided in the Presentation Library (b) for display scales at 1/80,000 or smaller: always display the 10 mile
latitude scale provided in the Presentation Library.
The scale bar or latitude scale should always be drawn vertically at the left side of the chart display, just clear of the border of the display.
The mariner should be able to remove any labels on the scales to avoid clutter.
"Display Scale" is defined as: [distance between two features on the display] / [distance between the same two features on the earth's surface]. This means that 1/75,000 is a larger
scale than 1/80,000.
(10) North arrow.
The IMO PS requires a north arrow as part of the Display Base. The north arrow should always be shown at the top left corner of the chart display, just clear of the scale bar or latitude scale.
(11) Manual chart correction.
Small orange identifiers are used to distinguish hand-entered chart corrections, which are subject to human error, from corrections entered automatically by electronic means. The original chart object should not be removed or altered. (See 2.3.4 for details).
(12) Ramark, Racon.
This is introduced to distinguish beacons that will appear on the radar display from other radio-beacons.
(13) Data from non-HO sources
37
S-52, Edition 6.0 March 2010
The non-HO data boundary LC(NONHODAT) serves to separate ENC data
from non-HO chart information. See section 2.3.1c for further details on identifying non-HO data.
(14) No data areas. The first action of the ECDIS display re-draw should be to cover the entire
screen with the NODTA area colour fill and the AP(NODATA03) area pattern. These will remain to identify any area not subsequently covered by chart information as a no data area.
(15) Identifying pattern for depth areas less than the safety contour. (this section is covered by section 3.2.2 (2)) (16a) Identifying pattern for traffic junctions, crossings and roundabouts. A pattern of diagonal magenta lines is used to identify the areas of a traffic
separation scheme which are traffic junctions, crossings or roundabouts, or precautionary areas.
(16b) Traffic routeing and regulated areas in general. New centred symbols are provided in the Presentation Library, to avoid the
clutter caused by a pattern of symbols in these often critical waters. Details are given on screens (JKL). (M) and (N) of the ECDIS Chart 1.
(17) Glacier or ice shelf. A random pattern of short lines symbolising "candled" ice is provided to
indicate a glacier or area of shore-fast ice. (18) Daymark. The daymark symbols are designed so that they can be over-written on a
beacon which is highlighted by a daymark. (19) Paper chart symbols for an opening bridge and a radar reflector on an
overhead cable have been revised to fit any orientation of the bridge or cable - see ECDIS Chart 1.
(20) A one-sided linestyle is provided for use on large-scale displays to indicate
the side of an area boundary on which the area lies, when only a part of the boundary can be seen on the display.
(21) Meta-data (information about the chart data), such as chart data confidence
areas. The "zones of confidence " in the chart data (section 3.1.8) are symbolised by
a system of stars. Other meta-data items, including compilation scale, IALA "A" or "B" buoyage, etc, are left to cursor picking.
(22) Special identifiers.
38
S-52, Edition 6.0 March 2010
In addition to the manual chart correction identifier of para. (11) above, identifiers are provided for low accuracy chart data and for ENC objects which have additional information for cursor picking under the "INFORM" attribute. The latter may cause clutter, and should only be displayed temporarily. Identifiers are shown on screen (AB) of the ECDIS Chart 1.
(23) IEC symbols. By agreement with the IEC, symbols for the "Navigational Elements and Parameters" of the IMO PS Appendix 3, and also symbols being developed by IMO for AIS vessel reports, are included in the Presentation Library. These are on the last diagram of the ECDIS Chart 1.
3.3 Existing Chart Symbols 3.3.1
Reproduction of paper chart symbols on ECDIS
Most of the symbols in IHO INT 1 "Symbols used on (paper) charts" have been translated for use on ECDIS. The ECDIS Chart 1 gives details, and is divided into lettered sections in the same way as INT 1.
The following notes apply to these symbols:
(1) Depth contours are not labelled by the ECDIS. The Safety Contour is highlighted,
and the mariner should use cursor picking for other contour values.
(2) Light sectors. It should be possible, on request, for the mariner to be capable of identifying the colour of the sectors affecting the ship, even if the lights involved are off the display.
3.4 Text, Diagrams etc. 3.4.1
Text as part of the route monitoring display
Text information should be used on the route monitoring display only when unavoidable, since it has to be written large to be readable and so causes clutter.
Details of displaying text are given in 3.1.5 and in the Presentation Library.
Soundings are treated by the Presentation Library as symbols to ensure they are legible and correctly located.
3.4.2
Text windows, explanatory diagrams etc. superimposed on the route monitoring display
The 270 mm by 270 mm minimum area of chart presentation for route monitoring should normally be used for chart and navigation information alone.
Any windows containing text, diagrams, etc superimposed on the route monitoring display should be temporary, and should not obscure important chart or navigational information. Such windows should use only the "User Interface" colours from the Presentation Library. It should be possible for the mariner to re-locate a window in a less important part of the display, such as on land, or behind the ship.
39
S-52, Edition 6.0 March 2010
3.4.3
Separate text panel on the same screen as the route monitoring display
A Mariner's Information Panel, consisting mainly of text (alphanumerics), might include:
- ECDIS alarms and indications, e.g." crossing safety contour", - navigation information, e.g. time, position, course to make good, etc., - chart information, e.g. contour selected for own-ship safety contour, - supplementary chart information, e.g. tide tables, sailing directions, - interface dialogue, e.g. "change to night colour table". - etc.
Sea experience has shown that the text panel on the route monitoring display may have a prominence out of proportion to its significance to safety of navigation. This is particularly damaging to ECDIS performance at night, when the strictly dimmed chart display, which carries nearly all of the information of importance to navigation, may be overwhelmed by the light emitted from large, bold or bright characters on the text display, some conveying relatively unimportant information.
The text panel should be outside the 270 by 270 mm minimum area designated for the route monitoring chart display by the IMO PS. The colours, symbols and luminance of this user interface panel should not degrade the SENC information on the chart display.
At night it is essential that any interface panel or other information added by the manufacturer to the screen carrying the chart display should never generate more light than the chart display itself. Great care is taken to reduce the light emitted by the chart in order to preserve the mariners night vision, and it is dangerous to ship safety if added non-chart information defeats that purpose.
It is particularly important to limit the information shown using the conspicuous colour token "UINFD", which is reserved for important information. Even a small panel of text in this colour can produce more light on the bridge than the entire route monitoring chart display.
3.4.4
Text shown on a separate auxiliary screen
A separate screen may be provided for text display, either instead of or in addition to a panel on the main screen used for the route monitoring display. The presentation on this auxiliary screen need not follow these specifications in detail, but should conform in general, to avoid confusion, and should meet the same bridge lighting constraints.
All information displays should be designed in accordance with ergonomic principles.
40
S-52, Edition 6.0 March 2010
4 SPECIFICATIONS FOR COLOURS 4.1 General
The ECDIS manufacturer can use any technology to build his display as long as his display fulfils the requirements of this specification. It is known that at least displays based on CRT, TFT or LCD can be made to fulfill the requirements of this standard.
The colours are specified in CIE (Commission Internationale de l'Eclairage) xy chromaticity coordinates and luminance L. CIE colour coordinates are used because any other colour specification, such as RGB, is specific to a particular monitor and so cannot be specified either in relative or in absolute terms. Procedures for converting these CIE coordinates to RGB values for the ECDIS display are described in sections 4.2.6, 5.2.3 and 5.2.4 below, and in Annex B. It is strongly recommended that these procedures be followed.
The ECDIS manufacturer may use other methodology if he wishes, however the colours of features on the ECDIS display should appear the same as would be obtained by following the procedures in this document.
The Colour Tables are in the Presentation Library, Part I, section 13. The Colour Tables are also included in the .dai file of the digital Presentation Library, however the maintenance of this file depends on a volunteer provider.
Note that these colour specifications apply to both the operational chart display (for route planning and route monitoring), and also to any text on the same screen as the chart display.
The colour tables have been carefully designed by perception specialists to give the maximum clarity and contrast between features on the display under all light conditions on the bridge.
4.2 Colour Assignment
Since chart and navigation lines and symbols must show clearly against the background shades, the colour tables were constructed by first selecting the background area shades and then selecting colours for lines and symbols that contrast with their background. In selecting foreground colours for point and line features, lines and symbols, the aim has been to highlight important information by giving it greater contrast with the background.
In order to accommodate the very large change in bridge lighting between bright sun and dark night , the colours switch from a light background with dark foreground details , which has been found to give the best contrast under bright sun, to a dark background with light foreground details by night. The night display has to be dim enough that it can be viewed without impairing the mariner's night vision. The Dusk table is also a black-background table, for optional use by day as well as at twilight.
The design of both colours and symbols has concentrated on ensuring that important chart and navigation features remain clearly visible under the extremes of bright sun and dark night viewing.
The general assignment of colours is given in Table 1 and condensed Colour Tables are in Table 2.
41
S-52, Edition 6.0 March 2010
4.2.2
Bright Sunlight or Night viewing - Use of filters, etc.
The information-carrying capability of the ECDIS display is curtailed at the extremes of bright sunlight and night viewing. The reasons, and some remedies, are described in this section.
Bright sun
. Some of the strong ambient light on the bridge is reflected off the back of the display screen face plate and arrives at the mariner's eye mixed with the light generated by the monitor which carries the image of the ECDIS display. This display image is further diluted by light entering the mariner's eye directly from the brightly-lit bridge. The effect is to make the display look washed out; contrast between features may be severely reduced. In the extreme case of sunlight shining directly on the screen, no information at all will be visible. In addition, reflections on the face of the monitor from objects close to the screen, particularly a mariner's white shirt, may mask parts of the display.
The ECDIS display should be situated where direct sunlight will not shine onto it, nor into the eyes of the mariner looking at it. A visor around the face of the screen may help. A filter may also help,(because it attenuates the sunlight twice, both when incident and when reflected, whereas the monitor image is attenuated only once). Low attenuation neutral density filters may be used, such as a 2 times attenuation filter designated (logarithmically) "0.3 ND". Polarised filters should be an advantage. Ideally, the bridge windows should have glare reducing glass and the inside of the bridge should have non-reflecting paint.
Night
. The need to preserve night vision requires that the illumination from the screen be reduced to a lower level than is desirable from considerations of clear viewing. The light level from night colour tables is below that which provides full contrast capability. Consequently some area-fill colours are indistinguishable on the night display, as noted in section 3.2.2 (2), and colours of lines may be difficult to distinguish.
An additional problem for CRT type of monitor is that the R,G & B guns of the CRT may drop to the cut-off point at these very low DAC (digital to analog converter) voltages, particularly on an ageing CRT. Because good quality neutral filters reduce illumination without significantly affecting colour, and even tend to enhance contrast their use is recommended for the night display.
4.2.3
Display calibration and verification
The ECDIS display should be calibrated initially in order to transform the CIE colour table coordinates to screen coordinates. The main components of the ECDIS display are the monitor and the image generator. Both the monitor and the image generator used to drive the ECDIS display can be calibrated together as a colour generating unit. Another alternative is to calibrate separately both the monitor and image generator. This process is described for CRT screens in Annex B1, and software for processing calibration and converting CIE colour coordinates to RGB, with worked examples, is included in the Presentation Library.
The ECDIS display calibration should be verified for type approval of all monitors as described in section 5.2.3, using a combination of instrumental testing for the bright sun colour table and subjective visual checking for the dusk and night colour tables.
42
S-52, Edition 6.0 March 2010
The procedure of calibrating all three colour tables by the current method used for CRTs, together with remote control of the calibration settings, should be used also for LCDs.
The visual checking is done by viewing all but the bright sun colour table on a multi-purpose Colour Differentiation Test Diagram carried in the Presentation Library and described in section 5.2.5 and the Presentation Library, Part I, section 19.4. The test diagram is also intended for use by the mariner for checking display performance and adjusting the controls as described below.
The colour performance of the display will deteriorate with age. The principal effect is overall loss of luminance (candle-power). For a CRT type of monitor this reduces the effectiveness of the bright sun colour table and may cause some colours of the night tables to drop below the cut-off point if cathode current stabilisation is not used. If at the same time relative luminance changes between the R,G & B guns should arise , colour reproduction will suffer and some distinctions between features may be lost. The night display is the most vulnerable. Self calibrating CRT type of monitors, generally using a detachable sensor to measure the white light emitted by the CRT and feed back any necessary corrections to RGB values through software, are available from manufacturers such as BARCO. Other methods of detecting and eventually correcting for colour drift are being investigated, and are discussed in Annex C.
4.2.4
Colour control; contrast and brightness controls
There are a variety of technologies available for monitors to be used for ECDIS display. Different technologies have different methods to control colour, contrast and brightness, but some basic rules apply for all of them.
4.2.4.1
Effect of controls.
The contrast control of a display generally shortens or extends the range of luminance available, making the display appear darker or brighter.
On the other hand, the brightness control shortens or extends the range of colour saturation available by adding white (which extends the range by making colours other than black less saturated), or subtracting white (colours become darker, more saturated.)
To the viewer, it has much the same apparent effect as contrast, but it achieves this by altering the colour contrast
of the colour tables between foreground and background colours, and this may result in some features becoming harder to see, particularly at night. More importantly, making the night display more saturated may drop some dark colours below the cut-off point, into black, thus losing distinctions such as shallow versus deep water.
4.2.4.2. Use of the controls.
Colour tables are provided for day, dusk and night. The mariner should be provided with the control to make fine adjustments between these tables; the calibration position should be marked as a reference for this.
For a CRT type of monitor the brightness control should be preset, i.e. used only when essential, with provision to return to the calibrated setting.

43
S-52, Edition 6.0 March 2010
LCD and other monitor technologies have a variety of controls. The general principle is that all available controls should have a provision to return to the calibrated settings and that only appropriate controls should be made available for the mariner. The ECDIS manual should carry a warning that careless use of the display controls may adversely affect the visibility of information on the display.
4.2.4.3. Initial setting of the controls.
The controls should be set up in preparation for initial calibration, as described in Annex B section 1.3, and their positions marked at that time (e.g. by a detent) so that they are recoverable.
4.2.4.4. Re-adjustment of the controls.
In case the controls go out of adjustment in use, they may be re-adjusted onboard ship by means of the Colour Differentiation Test Diagram provided in the Presentation Library, Part I, see section 5.2.5.
4.2.4.5. Setting the controls for route monitoring.
The ECDIS display carries far more detail than a radar display, and requires correspondingly more attention to the correct selection of colour table and the correct adjustment of the controls. This particularly affects the black-background displays, and is critically important at night, because all colours of the night table, particularly those for large areas, have to be set very dark to avoid loss of night vision, and if the control is turned down too far these colours will disappear into the black background. As a result, chart information will be lost. The situation will be worse if one of the day tables is improperly dimmed for use at night, instead of switching to the night table. It is important that the display be adapted to lighting conditions on the bridge by selecting the correct colour table: "Day" for bright sunlight; "Day” or "Dusk" for general daylight viewing; "Dusk" for twilight; and "Night" for the night-darkened bridge. The controls should only be used for fine adjustment within the appropriate colour table. To ensure that the controls are always set to a level above that at which information will be lost, the black-adjust symbol BLKADJ should be available to the mariner, treated as "Standard display", to be called up at any convenient point on the screen. The instructions for its use by the mariner should be incorporated in the "Users instructions" for the ECDIS.. Below is an example of instructions for a CRT type of Monitor: 1. First, set contrast to a maximum, brightness to a minimum. Look at the black-
adjust symbol. Then either: 2A. If the centre square is not visible, turn up the brightness until it just appears.
or: 2B. If the centre square is clearly visible (with contrast at maximum, brightness at
44
S-52, Edition 6.0 March 2010
minimum), turn the contrast down until the inner square disappears, then turn contrast back up until the inner square is just visible again.
(If the above adjustment is not successful, select a more appropriate colour table and
repeat this procedure). The "black level" is now correctly set. If a brighter display is required use the contrast
control, but it is better not to re-adjust the controls unless lighting conditions on the bridge change.
Note that the black-adjust symbol should be displayed to check that the inner square
remains visible on the following occasions: - every time that the brightness or contrast controls are adjusted, - every time that the display is switched to the night colour table. Below is an example of instruction for LCD type of Monitor. The LCD type of monitor
used in this example has only one mariner control, which is called brilliance. Internally the monitor has also other controls available for service engineers. These internal controls include also controls named as contrast and brightness.
1. First, set brilliance to calibration position. Look at the black-adjust symbol. Then
either: 2A. If the centre square is not visible, turn up the brilliance until it just appears.
or: 2B. If the centre square is clearly visible, turn down the brilliance until the inner
square disappears, then turn brilliance back up until the inner square is just visible again.
(If the above adjustment is not successful, select a more appropriate colour table and
repeat this procedure). The "black level" is now correctly set. If a brighter display is required use the brilliance
control, but it is better not to re-adjust the controls unless lighting conditions on the bridge change.
Note that the black-adjust symbol should be displayed to check that the inner square
remains visible on the following occasions: - every time that the brightness or contrast controls are adjusted, - every time that the display is switched to the night colour table. It is recommended that the BLKADJ symbol be displayed automatically all the time
that the night colour table is selected, with a mariner over-ride to remove it if necessary.
4.2.5
The colour tables
Earlier editions of S-57 App.2 provided five colour tables. To simplify the operation of ECDIS by the mariner these have been reduced to three colour tables, all of which should be made available to the mariner. These are listed in a condensed form in Table 2 and specified in detail in the Presentation Library. They are as follows:
DAY (table 2.1) The "Day" table uses a white background as a result of a
45
S-52, Edition 6.0 March 2010
comparative test outdoors in bright sunlight which showed that a display background of maximum luminance gives the best contrast achievable under near-washout conditions. This conclusion has been confirmed by subsequent sea experience.
DUSK (table 2.2) The "Dusk" colour table is a black background table, which may
also be used by day as a mariner's option. NIGHT (table 2.3) At night the light emitted by the display must be strictly limited to
avoid impairing night vision. In case the luminance needs to be further reduced, the "Night" colour table may be augmented by a luminance-reducing neutral density filter which should have 8 times attenuation, designated (logarithmically) "0.9 ND". (This is a manufacturer's option).
4.2.6
The colour scheme - colour tokens
The colour scheme of the Presentation Library is designed to fit current computer architecture. A digital look-up table assigns all object/attribute combinations of features from the SENC to one of 64 "colour tokens". A few tokens apply to only one feature, but most include a group of similar features; e.g. traffic lanes, traffic direction arrows, prohibited areas and other such features share the "trfcd" for "traffic control dominant (conspicuous)" colour token. In turn, each token is assigned colour coordinates in the digital colour tables of the Presentation Library. Tables 2 and 3 at the end of this document illustrate how this scheme works.
4.2.7
Transparency
Transparent area colour fill is used at present:
(i) so that the background colours, lines and symbols show through an area shade (e.g. depth shades and contours should show through a traffic separation zone),
(ii) to reduce the prominence of a large symbol (e.g. too prominent a centred
anchorage area symbol would cause clutter on the display). Transparent fill can be achieved in two ways:
1.) with a given percentage of the pixels having the transparent fill colour (see Presentation Library, Part I, section 7.4.2),
2.) by mixing the fill and underlay colour according to the procedure given in the
Presentation Library, Part I, section 4.2.3.2. This must be done in such a way that no appearance of change in colour or shape occurs in any SENC feature on the display, at any intermediate transparency value. The underlying SENC information must remain distinguishable, except when the overlay colour approaches 100%, in which case Section 2.3.2 (b) applies, and an indication is required.
46
S-52, Edition 6.0 March 2010
5 SPECIFICATIONS FOR THE DISPLAY SCREEN 5.1 Physical display requirements
The requirements of S-52 for the main graphic display are:
"Size: minimum effective size of the area for chart display: 270 x 270 mm.
"Resolution: minimum lines per mm (L) given by L=864/s, where s is the smaller dimension of the chart display area. (e.g. for the minimum chart area, s=270 mm and the resolution L=3.20 lines per mm, giving a "picture unit" size of 0.312 mm)
"Colours: 64.
Information should be displayed in the ECDIS on one or more physical screens, which
may be divided into more than one chart display. Information may be displayed automatically, on demand or as a result of mariners selection.
Redraw during route monitoring to follow the ship's progress, including scale changes
due to change in the scale of the chart information, should take less than 5 seconds. Demands by the mariner that cannot be predicted by the ECDIS, such as draw at a different scale or in a different area may take more than 5 seconds. In the latter case: - the mariner should be informed; - the display should continue route monitoring until the new information is ready to
draw within 5 seconds. 5.2 Additional Requirements 5.2.1
Reproducing small features and symbols
The specifications above permit a chart display whose minimum resolution (lines/mm) may vary depending on the size of the display. To maintain a clearly readable chart display under this flexibility requires the following constraints to ensure that enough "picture units" (pixels) are always used to draw small features and symbols clearly:
(1) Chart features
: Chart features should never be drawn with fewer "picture units" (ie. lines, pixels, dot-pitch intervals) than when drawn on a 270 x 270 mm chart area at SENC scale.
(2) Symbols
: For clear representation, symbols require a minimum number of picture units, depending on their complexity. A simple chart symbol should extend about 12 pixels (that is at least 3.5mm for an IHO standard screen.) See section 3.1.5 for details on the size of symbols.
5.2.2
Colour display capability
The colours, as specified in CIE x,y chromaticity co-ordinates and luminance L, are intended for a display capable of at least 256 luminance steps in each of red green and blue
For night performance it is essential that the ECDIS hardware has a graphics card capable of giving "blacker than black", ie complete control of colour, and that the
47
S-52, Edition 6.0 March 2010
software can control that function.
For CRT type of monitor cathode (beam) current stabilisation is desirable, to prevent dark colours dropping below the cut-off point.
5.2.3
Colour conversion tolerances and tests
5.2.3.1 Tolerances.
The tolerances quoted below apply only to the process of converting CIE colour coordinates to RGB values, and so should be evaluated shortly after the ECDIS leaves the manufacturer's plant.
Considerable operational experience will be needed before it will be possible to state colour maintenance tolerances for ECDIS onboard ship.
The colour tables developed have been selected to ensure maximum colour discrimination between features. Colour discrimination depends on both the colour difference and the luminance difference between two colours. Colour science (as represented by the C.I.E. colour convention) has defined colour difference units ΔE* and ΔC*. ΔE* is a measure of the overall discrimination (including both colour and luminance differences). ΔC* is a measure of the discrimination in colour alone, excluding luminance differences.
Note
: “Δ” represents the Greek letter “Delta”, although it may appear differently on some computers.
The tolerances for the conversion of the colour tables from the CIE colours defined in these specifications to the actual RGB values for the ECDIS CRT are defined in three terms:
1. Overall discrimination between actual colours within the converted table : ΔE*.
This is to ensure that all the colours within the RGB table remain discriminably separate, ie. that the relative colour distinctions have been maintained.
2. Colour discrimination differences between the defined and the actual values :
ΔC*. This is to ensure that the actual RGB colours resulting from the conversion remain reasonably close to the CIE colours defined in the specifications, ie. that the blues stay blue and the greens stay green.
3. Luminance differences between the defined values and the actual values : L.
This is to ensure that the luminance remains the same within acceptable limits.
Note: The CIE L*u*v* human perception colour model, which is the source of the tolerances described above, has not yet been evaluated at the low luminances of the night colour table, at which the less colour-sensitive rods of the eye take over from the daytime cones. Consequently these tolerances should not be applied to the night table, and for type-approval purposes they are restricted to the bright sun table.
Colour tolerance values:
1. The discrimination difference between any two colours displayed (except those with a tabular ΔE* less than 20 - see list in Annex B 4.5) should be not less than 10 ΔE* units.
2. The difference between the colour displayed and the CIE colour defined in these
specifications should be not greater than 16 ΔC* units. If a monitor is
48
S-52, Edition 6.0 March 2010
independently tested then the difference shall be not greater than 8 ΔC* units.
3. The luminance of the colour displayed should be within 20% of its specified value. Black is a special case and the luminance of it shall be not greater than 0.52 cd/m² for bright sun colour table.
5.2.3.2 Instrumental calibration verification test.
For CRT displays, an instrumental test to check that the results of the colour conversion calibration described in Annex B1 are within tolerance should be made by displaying the colours of the Day colour table (restricted to colour pairs of tabular ΔE* greater than 20); measuring their CIE coordinates x,y and L; and applying a tolerance test. The procedure is described in Annex B section 4. For LCD displays the instrumental test should be applied to all three colour tables.
Note that since the tolerance test is intended solely to check successful colour calibration, and not to test colour maintenance at sea, this test should be performed on the bench in the manufacturer's or type-approval authority's plant under normal conditions of temperature, humidity and vibration.
Should the colour tolerances be tested independently (as by a type approval authority) without also carrying out colour conversion calibration, a slightly extended procedure is necessary, involving individual control of the R, G and B colours. This is also described in Annex B4. Manufacturers of ECDIS can choose between two different methods of colour calibration. The first method is a test of a monitor as part of an integrated system. In this method both the monitor and the image generator parts of ECDIS display are tested together. The second method is an independent test of the monitor. In this method the monitor and the image generator of ECDIS display are separately tested against a reference (i.e. the monitor is tested against a reference image generator and the image generator is tested against a reference monitor). The second method has tighter tolerance for displayed colour than the first method (see section 5.2.3.1).
5.2.3.3 Test using Colour Differentiation Test Diagram.
The dusk and night tables should be checked subjectively by means of the colour differentiation test diagram, which is provided as a S-57 file on the Presentation Library CD (.tif file diagrams must not be used for this purpose), as follows:
(1) The person carrying out the test should have passed the Isihara colour blindness test, or other test used to qualify bridge watchkeepers, and should adapt to night viewing for 10 minutes before checking the night display;
(2) The controls should be set to their calibrated settings; (3) While the display is off, adjust the ambient light reflected from white paper
positioned on the display screen to the following values: Colour table Day 200 cd/sq m
Light level
Dusk 10 cd/sq m Night darkness (the ECDIS display is the predominant light source) Preferably use natural daylight for the day table. (4) Under each of the above conditions, display the appropriate colour differentiation
49
S-52, Edition 6.0 March 2010
test diagram described in section 5.2.5 for the colour tables. Select each table in turn and ensure that:
- each foreground diagonal line is clearly distinguished from its background; - the foreground lines representing yellow, orange, magenta (purple), green, blue
and grey may be clearly identified.
5.2.4
Software for colour calibration and tolerance verification
Software is provided in the Presentation Library to compute the instrumental calibration results, the CIE to RGB conversion, and the tolerance checks.
5.2.5 Colour Differentiation Test Diagram; grey scale
The use of symbol BLKADJ to adjust the controls every time that the night colour table is selected has been described in section 4.2.4.5. This section describes further checks on the colour performance of the ECDIS display. A multi-purpose colour differentiation test diagram is illustrated in the Presentation Library, Part I, section 15.4, and is described in the Presentation Library, Part I, sections 19.3 and 19.4. This consists of 20 squares each coloured with one of the 4 main background colour fills (such as shallow water blue), and each having a diagonal line in one of the six important foreground colours (such as mariner's orange). Each diagonal line is 2 pixels wide. The diagram is in the form of an ENC and so can be displayed using any of the three colour tables. This diagram is intended: (1) for use by the mariner to check and if necessary re-adjust the controls,
particularly for use at night; (2) for use by the mariner to satisfy himself that an ageing ECDIS display remains
capable of providing the necessary colour differentiation; (3) for initial colour verification of the day, dusk and night colour tables. Both the Colour Test Diagram and the instructions for its use (see Presentation Library, Part I, sections 18.8 and 19.4) should be made available to the mariner. In addition, a grey scale is described in Annex C for use by maintenance technicians in checking colour tracking in an ageing display. The Colour Differentiation Test diagram is intended for use off-line. It is not needed during route monitoring. Note that the Colour Differentiation Test Diagram will not be true to colour unless it is projected on a calibrated screen and is generated using the digital format described in the Presentation Library, Part I, section 19.4 which correctly reproduces the colour tokens of the Presentation Library.

50
S-52, Edition 6.0 March 2010
TABLE 1: GENERAL COLOUR ASSIGNMENT FOR ECDIS FEATURES black/white
(black by day / white by night) is used for critical navigation features which need highlighting by contrast against their background to give them adequate prominence. Examples are the own-ship symbol, dangerous soundings less than the safety depth, buoys, conspicuous objects on land etc. It is also used for text, which is less clear in any other colour.
white/black
(white by day / black by night) as a background area shade is used for deep, safe, water.
magenta
is used to highlight critically important features such as isolated dangers, traffic routes, anchorages; and for restricted areas, submarine cables, gas pipelines etc. It is also used for aids to navigation and services such as daymarks, racons, and pilot stations.
grey
is used for many features which are black on the paper chart. It is used with thick lines for critical physical objects such as bridges and overhead cables, and with thin lines for important but less critical physical features such as non-dangerous soundings, sandwaves, overfalls, water pipelines and fish farms. It is similarly used for chart features such as fairways, harbour areas, tidal information and for information about the chart such as quality of chart data, overscale areas, etc.
grey
as a background area shade is used with a prominent pattern for no-data areas.
blue as a background area shade is used to distinguish depth zones. blue
as foreground colour for AIS and VTS information; also reserved for future requirements.
green
is used for the radar image and synthetics, and for buoy and lights colours.
blue-green
is used for transferred ARPA.
yellow-green
('moss-green') as a background area shade is used for the intertidal area between high and low waterlines,
yellow
is used as the manufacturer's colour; for the mariner's transparent colour fill; and for buoy and lights colours.
red
is used for the important planned route, for the mariner's danger highlight, and for buoy and lights colours.
orange
is the mariner's colour, for notes, chartwork, chart corrections. The scale bar, north arrow, and mariner's navigation objects such as EBLs and VRMs are also orange.
brown as a background area shade is used for the land, and dark brown is used for features on land and in the intertidal area that do not have any strong significance for navigation.

51
S-52, Edition 6.0 March 2010
TABLE 2: CONDENSED COLOUR TABLES Note
: These tables are for explanation only. Use the updated tables in the Presentation Library for operational purposes.
Colour table 2.1: DAY
Colour X Y L Tokens black .28 .31 0.0 sndg2, ships, pstrk, chblk, uinfd, outlw grey “
.28
.28 .31 .31
0.6 1.6
bkaj1 bkaj2
grey “ “
.28
.28
.28
.31
.31
.31
10 25 40
depsc, cstln, chgrd, uinff, uibdr sndg1, depcn, chgrf, sytrk, resgr, res01, res02, res03 nodta
white .28 .31 80 depdw, chwht, uibck blue “ “ “
.18
.21
.23
.26
.15
.22
.25
.29
22 45 55 65
resbl, uinfb depvs, uiafd depms depmd
magenta “
.30
.28 .17 .24
20 48
isdng, trfcd, chmgd, uinfm trfcf, chmgf
green “ blue-green
.31
.31
.26
.56
.56
.42
60 20 30
radhi, chgrn, litgn, uinfg radlo arpat
yellow-green
.26 .36 35 Depit
yellow “
.41
.41 49 49
70 35
chylw, lityw adinf
brown “ “
.45
.39
.35
.42
.43
.39
15 30 50
landf, outll chbrn landa, outll, uiaff
orange .50 .40 32 cursr, ninfo, chcor, aplrt, sclbr, uinfo red “
.58
.48 .35 .30
18 25
Plrte dnghl, chred, litrd, uinfr

52
S-52, Edition 6.0 March 2010
Colour table 2.2: DUSK
Colour X Y L Tokens white .28 .31 36 ships, pstrk, sndg2, chwht, uinfd grey “ “ “
.28
.28
.28
.28
.31
.31
.31
.31
20 10 7.0
0.72
depsc, cstln, chgrd, chblk, uibdr.uinff, resgr depcn, chgrf, sndg1, sytrk, res01, res02, res03 nodta bkaj2
black .28 .31 00 depdw, uibck, outlw, bkaj1 blue “ “ “
.18
.21
.23
.25
.15
.22
.25
.29
10 5.0 3.0 1.0
resbl, uinfb depvs, uiafd depms depmd
magenta “
.28
.30 .24 .17
18 7.0
trfcd, chmgd, isdng, uinfm trfcf, chmgf
green “ blue-green
.31
.31
.26
.56
.56
.42
20 7.0 17
radhi, chgrn, litgn, uinfg radlo arpat
yellow-green
.26 .36 6.0 Depit
yellow “
.41
.41 49 49
24 12
chylw, lityw adinf
brown “ “
.45
.39
.35
.42
.43
.39
12 8.0 5.0
landf, uiaff chbrn. landa, outll
orange .50 .40 10 cursr, ninfo, chcor, aplrt, sclbr, uinfo red “
.58
.48 .35 .30
8.0 10
Plrte dnghl, chred, litrd, uinfr

53
S-52, Edition 6.0 March 2010
Colour table 2.3: NIGHT
Colour X Y L Tokens white .28 .31 5.0 sndg2, chwht, ships, pstrk, uinfd grey “ “ “
.28
.28
.28
.28
.31
.31
.31
.31
2.5 1.25
1.2 0.1
chgrd, chblk,cstln, depsc, uibdr, uinff chgrf, sndg1, depcn, resgr, sytrk, res01, res02, res03 nodta bkaj2
black .28 .31 00 depdw, uibck, outlw, bkadj1 blue “ “ “
.18
.21
.23
.25
.15
.22
.25
.29
1.25 0.8 0.4 0.2
resbl, uinfb depvs, uiafd depms depmd
magenta .30 .17 2.0 isdng, trfcd, trfcf, chmgd, chmgf, uinfm green “ blue-green
.31
.31
.26
.56
.56
.42
2.5 0.8
1.75
radhi, chgrn, litgn, uinfg radlo arpat
yellow-green
.26 .36 1.2 Depit
yellow “
.41
.41 49 49
3.0 1.5
chylw, lityw adinf
brown “ “ “
.45
.45
.39
.35
.42 42 .43 .39
3.2 1.6 1.3 0.8
Uiaff Landf Chbrn landa, outll
orange .50 .40 1.25 cursr, sclbr, ninfo, aplrt, chcor, uinfo red “
.48
.58 .30 .35
1.25 0.9
dnghl, chred, litrd, uinfr. Plrte
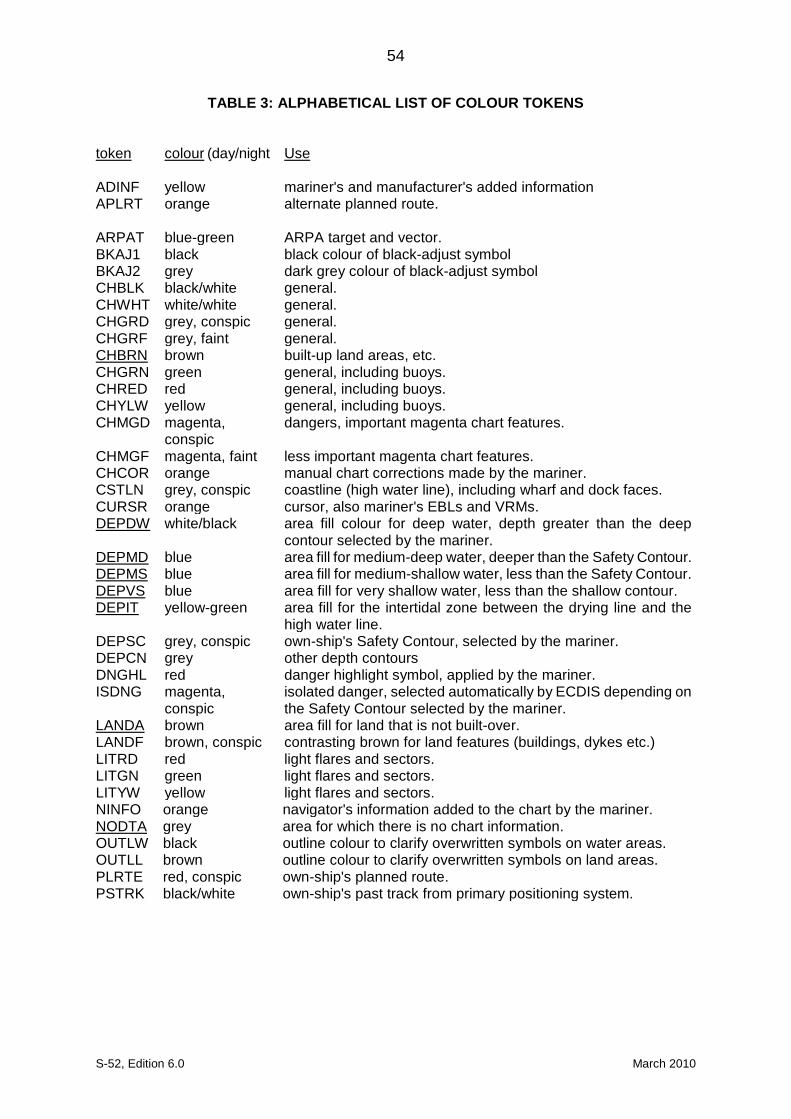
54
S-52, Edition 6.0 March 2010
TABLE 3: ALPHABETICAL LIST OF COLOUR TOKENS
token colour (day/night
ADINF
Use
yellow mariner's and manufacturer's added information APLRT orange alternate planned route. ARPAT blue-green ARPA target and vector. BKAJ1 black black colour of black-adjust symbol BKAJ2 grey dark grey colour of black-adjust symbol CHBLK black/white general. CHWHT white/white general. CHGRD grey, conspic general. CHGRF grey, faint general.
brown CHBRN built-up land areas, etc. CHGRN green general, including buoys. CHRED red general, including buoys. CHYLW yellow general, including buoys. CHMGD magenta,
conspic dangers, important magenta chart features.
CHMGF magenta, faint less important magenta chart features. CHCOR orange manual chart corrections made by the mariner. CSTLN grey, conspic coastline (high water line), including wharf and dock faces. CURSR orange cursor, also mariner's EBLs and VRMs.
white/black DEPDW area fill colour for deep water, depth greater than the deep contour selected by the mariner.
blue DEPMD area fill for medium-deep water, deeper than the Safety Contour. blue DEPMS area fill for medium-shallow water, less than the Safety Contour. blue DEPVS area fill for very shallow water, less than the shallow contour. yellow-green DEPIT area fill for the intertidal zone between the drying line and the
high water line. DEPSC grey, conspic own-ship's Safety Contour, selected by the mariner. DEPCN grey other depth contours DNGHL red danger highlight symbol, applied by the mariner. ISDNG magenta,
conspic isolated danger, selected automatically by ECDIS depending on the Safety Contour selected by the mariner.
brown LANDA area fill for land that is not built-over. LANDF brown, conspic contrasting brown for land features (buildings, dykes etc.) LITRD red light flares and sectors. LITGN green light flares and sectors. LITYW yellow light flares and sectors. NINFO orange navigator's information added to the chart by the mariner.
grey NODTA area for which there is no chart information. OUTLW black outline colour to clarify overwritten symbols on water areas. OUTLL brown outline colour to clarify overwritten symbols on land areas. PLRTE red, conspic own-ship's planned route. PSTRK black/white own-ship's past track from primary positioning system.
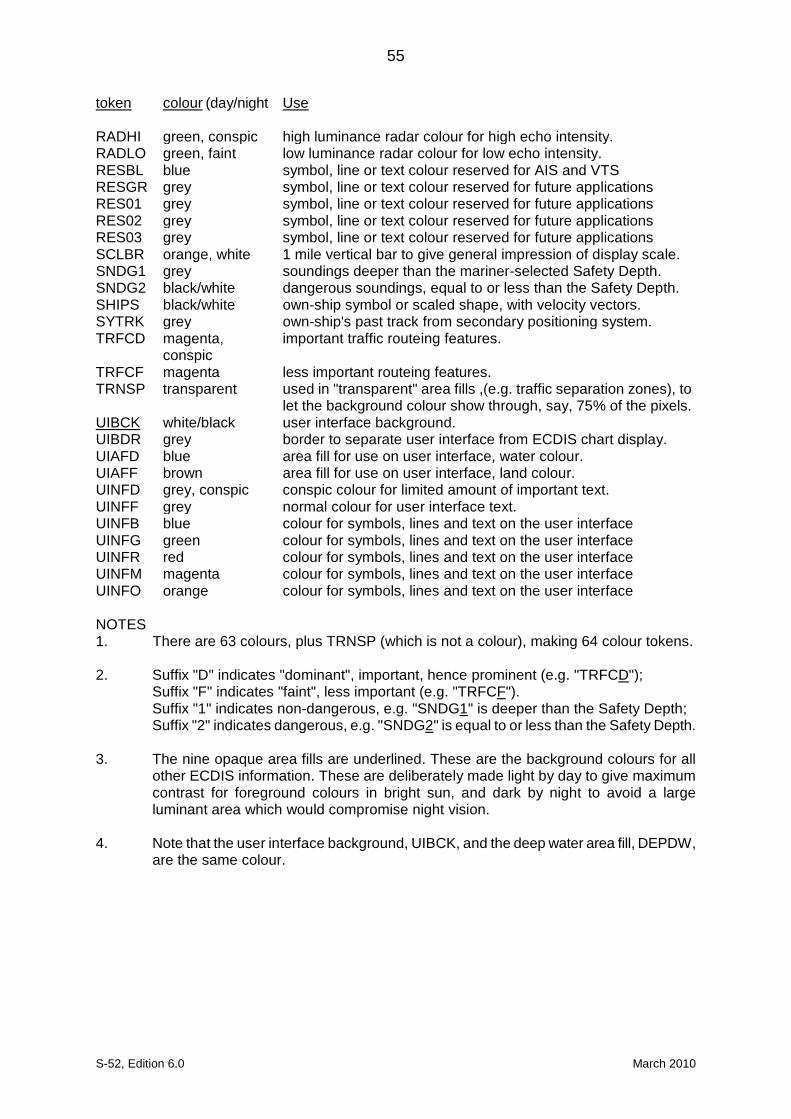
55
S-52, Edition 6.0 March 2010
token colour (day/night
RADHI
Use
green, conspic high luminance radar colour for high echo intensity. RADLO green, faint low luminance radar colour for low echo intensity. RESBL blue symbol, line or text colour reserved for AIS and VTS RESGR grey symbol, line or text colour reserved for future applications RES01 grey symbol, line or text colour reserved for future applications RES02 grey symbol, line or text colour reserved for future applications RES03 grey symbol, line or text colour reserved for future applications SCLBR orange, white 1 mile vertical bar to give general impression of display scale. SNDG1 grey soundings deeper than the mariner-selected Safety Depth. SNDG2 black/white dangerous soundings, equal to or less than the Safety Depth. SHIPS black/white own-ship symbol or scaled shape, with velocity vectors. SYTRK grey own-ship's past track from secondary positioning system. TRFCD magenta,
conspic important traffic routeing features.
TRFCF magenta less important routeing features. TRNSP transparent used in "transparent" area fills ,(e.g. traffic separation zones), to
let the background colour show through, say, 75% of the pixels. white/black UIBCK user interface background.
UIBDR grey border to separate user interface from ECDIS chart display. UIAFD blue area fill for use on user interface, water colour. UIAFF brown area fill for use on user interface, land colour. UINFD grey, conspic conspic colour for limited amount of important text. UINFF grey normal colour for user interface text. UINFB blue colour for symbols, lines and text on the user interface UINFG green colour for symbols, lines and text on the user interface UINFR red colour for symbols, lines and text on the user interface UINFM magenta colour for symbols, lines and text on the user interface UINFO orange colour for symbols, lines and text on the user interface NOTES 1. There are 63 colours, plus TRNSP (which is not a colour), making 64 colour tokens. 2. Suffix "D" indicates "dominant", important, hence prominent (e.g. "TRFCD");
Suffix "F" indicates "faint", less important (e.g. "TRFCF"). Suffix "1" indicates non-dangerous, e.g. "SNDG1" is deeper than the Safety Depth; Suffix "2" indicates dangerous, e.g. "SNDG2" is equal to or less than the Safety Depth.
3. The nine opaque area fills are underlined. These are the background colours for all
other ECDIS information. These are deliberately made light by day to give maximum contrast for foreground colours in bright sun, and dark by night to avoid a large luminant area which would compromise night vision.
4. Note that the user interface background, UIBCK, and the deep water area fill, DEPDW,
are the same colour.
56
S-52, Edition 6.0 March 2010
TABLE 4: ‘CAUTIONARY’ AND ‘INFORMATION’ AREAS The cautionary area / information area distinction is reflected in the IMO PS Appendix 4 “Areas for which special conditions exist”. It is the basis for symbolising those areas which do not have a specific symbol with either a “(!)” for a cautionary area or a “[i]” for an information area: Cautionary Areas
:
Routeing areas - Standard Display:
Traffic separation zone (TSEZNE) Traffic routeing scheme crossing or roundabout (TSSCRS, TSSRON) Traffic routeing scheme precautionary area (PRCARE) Two-way traffic route (TWRTPT) Traffic separation scheme lane (TSSLPT) Deepwater route (DWRTPT) Recommended traffic lane (RCTLPT) Inshore traffic zone (ISTZNE)
Other cautionary areas - Standard Display:
fairway (FAIRWY)
area to be avoided (RESTRN 14) entry prohibited/restricted (RESTRN 7, 8) anchoring prohibited/restricted (RESTRN 1,2) fishing/trawling prohibited/restricted (RESTRN 3, 4, 5, 6)
caution area (CTNARE)
waiting area (RESARE CATREA 19) swinging area (RESARE CATREA 25) ferry area (FERYRT)
navigation aid safety zone (RESARE CATREA 12) offshore production area (OFSPRD) offshore safety zone (RESARE CATREA 1)
minefield (RESARE CATREA 14) submarine transit lane (SUBTLN) military practise area (MIPARE ) military area (RESARE CATREA 9) degaussing area (RESARE CATREA 8) seaplane landing area (SPLARE)
57
S-52, Edition 6.0 March 2010
Information areas
- Standard Display:
anchorage area (ACHARE) anchor berth (ACHBRT)
dumping ground (DMPGRD)
fishing ground (FSHGRD) pipeline area (PIPARE) cable area (CBLARE)
cargo transhipment area (CTSARE) incineration area (ICNARE)
specially protected areas - sanctuaries etc (RESARE CATREA 4, 5, 6, 7,10, 18, 20, 22, 23, 27, 28)
no wake area (RESARE CATREA 24)
For further details, see conditional symbology procedures RESAREnn and RESTRNnn in the Presentation Library, section 12.
58
S-52, Edition 6.0 March 2010
ANNEX A IHO ECDIS PRESENTATION LIBRARY The Presentation Library is published separately. See Figure 1 for details.
In summary the Presentation Library implements the display specifications in S-52 by decoding and symbolising the SENC. It contains: 1. the ECDIS symbol library, including the IEC navigation symbols, 2. the ECDIS colour tables for day, dusk and night viewing, 3. look-up tables with symbology instructions linking SENC objects to the
appropriate colour and symbol and giving their IMO category, draw priority, priority over radar, and suggested viewing group,
4. conditional symbology procedures for: - cases where symbolising depends on circumstances such as the mariner's
choice of safety contour, - cases where symbolising is too complex to be defined in a direct look-up
table, 5. symbolising instructions for special cases which are not handled by 3. or 4.
above, such as north arrow and scalebar, manual chart corrections, etc., 6. description of the symbology instructions, 7. mariners' navigational objects, specified in the same format as chart objects
for convenience in processing by the ECDIS, 8. supplementary features such as the ECDIS Chart 1, colour differentiation test
diagram, colour calibration software. The IHO Presentation Library is part of the S-52 package. A digital version is also available for edition 3.4; updating this digital version will depend on a volunteer provider.
__________
59
S-52, Edition 6.0 March 2010
Page intentionally left blank
60
S-52, Edition 6.0 March 2010
ANNEX B PROCEDURE FOR INITIAL CALIBRATION OF COLOUR DISPLAYS
(Note that the specifications in this Annex are generally applicable to all types of monitors. Some sentences which apply only to CRTs are in italics.)
_________
B.1 Introduction
Calibration is required to transform the CIE co-ordinates of these specifications into RGB values that apply to the particular monitor used by the ECDIS manufacturer. Note that the primary aim is to reproduce the colour distinctions needed to distinguish between different features on the display. Accurate absolute colour matching between different monitor's is not required.
Calibration defines the monitor performance in terms of the relationship between input signal and the colour and luminance output on the screen. This is performed for each of the red, green, and blue (R, G, B) channels. The signal that drives the CRT monitor is specified in terms of three DAC (Digital to Analog Converter) values - one each for R, G, and B. These are usually from 0 to 255, and colour
is specified in CIE co-ordinates of x-y, and luminance (L) in candelas per square metre. The DAC values are programmed within the image generator to generate specific colours required by the system.
Calibration consists of two parts - measurement of the monitor colour characteristics and data processing to generate the transform between CIE colour co-ordinates and RGB inputs to the monitor.
A comprehensive calibration of the monitor is required upon initial use.
In case the monitor colours deteriorate after extended use at sea, two further capabilities are necessary:
1. A means of detecting when the colour calibration has deteriorated to the extent
that the colour distinction on the display is lost. This is described in Annex C. 2. A method of restoring the original colour distinctions. This is not yet developed.
B.2 Initial Calibration
This process will provide the conversion between CIE x, y, L co-ordinates and RGB signals to be applied to the monitor.
B.2.1
Equipment required
Make sure your ECDIS hardware has an image generator capable of giving "blacker than black", i.e. complete control of colour, and that the software can control that function.
The monitor may be calibrated independently of the image generator. In this case, the generator is expected to output a signal that is linear and repeatable from unit to unit. If the accuracy of the image generator output is unknown, then it should be calibrated as an integrated unit with the monitor.
61
S-52, Edition 6.0 March 2010
The equipment required for the process is listed below: - Monitor to be calibrated. It is important to note that the monitor to be calibrated
must be capable of a white screen (D-6500) of at least 85 cd/m², or the calibration process will fail.
- Image generator to be used with the monitor.
- Photometer. The photometer must have a luminance accuracy of better than +/-
5% and a sensitivity of 1.0 x 10⁻⁴ candelas per square metre. The photometer is one that must be intended for use in measurement of the selected monitor, and should have colourimeter capability. The required performance can be achieved by a Graseby model 370 "Optometer" with a model 221 radiometric head used in conjunction with a Minolta CS100 Colorimeter for measuring phosphor co-ordinates and calibrating the Graseby radiometric head for each phosphor.
The Minolta CS 100 must be calibrated to "Illuminant A".
- Software to generate the required colours for use during the calibration. This will
be a program that allows the user to adjust the colour DAC values from 0 to 255 in each of Red, Green and Blue.
- Software to calculate the transformation between RGB and CIE x, y, L values.
(This software is part of the Presentation Library.) B.2.2
Calibration set-up
Important - The calibration procedure is very sensitive to stray light, and inaccurate results will occur if special care is not taken. All measurements should be taken in the dark, and all stray light and sources of reflections must be removed from the measurement area. The measurements are best taken with light absorbers in place around the monitor and measurement apparatus. This can be created by making a matte black cardboard tunnel around the monitor and colourimeter. Care must be taken by the operator that his clothing does not reflect light back into the measurement area. The instrument that is measuring the screen of the monitor must point at the same location on the screen for all measurements, otherwise errors will result.
B.2.3
Monitor set-up for calibration
The monitor must be set up properly before calibration. The following are required for accurate calibration:
B.2.3.1 Burn-in
To age the monitor sufficiently, a burn-in of 48 hours is required with a 50% luminance white picture covering the entire screen.
B.2.3.2 Colour temperature tracking
The monitor should not show any change in colour on white signals, when they go from dark gray to bright white. This can be best checked out by displaying a gray scale of about 8 steps from dark gray to white. If the colour of the gray changes or shows a drift to pink, blue, or green, as the level changes, then the monitor is improperly adjusted and should not be calibrated. This step is a qualitative
62
S-52, Edition 6.0 March 2010
assessment, and requires some judgement from the tester. B.2.3.3 Setting the Controls The controls are used to adjust the black level of the monitor. This is the point where
the monitor screen is seen as black, and this setting will create the blackest black that can be displayed. After the control is set, it must be locked in place. Any further adjustment of the black level setting after calibration invalidates the process.
In use, the black level controls may either be locked or accessible to the user. If they
are accessible, they must have a detent type of setting where it is properly set up so that the user can find that position again after the control has been moved. This will ensure that the proper colour settings can be maintained.
The process for correctly setting the controls is as follows: with the monitor in a dark
room, and with the monitor turned on and warmed up to the manufacturer's specification, drive the monitor with a black signal (0, 0, 0). Measure the Luminance of this area. It should be less than 0.52 candelas per square metre (cd/m²). Lock the appropriate controls for the calibration process.
The controls should be adjusted to achieve maximum required output level at full
white signal. Using the photometer and a peak white signal, (DAC values of 255, 255, 255) adjust the controls for a luminance of at least 80 cd/m² (note that depending on the characteristics of monitor you may need 85 cd/m² or even higher values to get all colours inside the reproducible range). Lock appropriate controls for the duration of the calibration. (Note that the controls may be available for the mariner's adjustment during use of the ECDIS system.)
At this point, the monitor is set up and ready for calibration. B.3 Data Collection The data collection consists of two parts: measuring the CIE chromaticity co-
ordinates of the principal colour producing elements and measuring the gamma function of the principal colour producing elements.
B.3.1
Principal colour producing element Chromaticities
The principal colour producing element chromaticities can be measured directly by the photometer (e.g. Minolta CS 100) as follows:
.1 Put a square of pure red on the screen (DAC values of (255,0,0). This square
should be as large as possible, covering at least ten times the sampling area of the photometer, and preferably covering at least 80% of the screen.
.2 With the photometer normal to the screen and pointing at the centre, with light
shielding in place and the room darkened, measure the red chromaticity directly according to the colourimeter manufacturer's instructions.
.3 Repeat steps 1 and 2 for green and blue, using DAC values of (0,255,0) and
(0,0,255) respectively. Principal colour producing element chromaticities may be available from the monitor
vendor. These data may be used instead of measuring the chromaticities directly, as long as the data takes into account the effect of the monitor faceplate.
63
S-52, Edition 6.0 March 2010
B.3.2
Measurement of the Gamma of the principal colour producing elements
B.3.2.1 The principal colour producing elements have typically a non linear transfer characteristic describing the relationship between the R, G, B input values and the light output on the face of the monitor. This is called the Gamma Function or Gamma of the monitor. This transfer characteristic is used to select the proper mixing of colours to create the correct combined colour on the screen.
B.3.2.2 The Gamma is measured for each principal colour producing element separately. A
test square in the centre of the screen of size at least 5 cm by 5 cm (but not exceeding 25% of the area of the screen) should be used for this calibration. The screen outside the test area should remain black. Use a sensitive radiometer for this measurement (e.g. Graseby 370). Set up the radiometer head contacting the centre of the screen. Ensure that the instrument is always pointed at the same part of the screen for the entire series of measurements (red, green and blue). Put shields in place to block any stray light and darken the room to black.
B.3.2.3 Start with the red colour. Drive the monitor with DAC values starting at (0, 0, 0) and
increasing to (255, 0, 0). Increase in increments of 8 for the low values (below 100) and in increments of 16 for the higher values. (There is no harm in using a smaller increment if desired.) Record the light output in candelas per square metre (if available) against each DAC value. Otherwise, (for example in the case of the Graseby with radiometric head) record the output reading in amperes. Then, when the maximum DAC value is achieved, use a calibrated photometer/colorimeter (e.g. Minolta CS 100) to take a luminance reading. This luminance reading is then used to develop a conversion factor to convert from the radiometer's ampere reading to candelas per square metre.
B.3.2.4 Repeat the measurement sequence for each of the other two colours. Repeat the
photometer calibration for each of the other colours as well. B.3.2.5 To prepare the radiometer output data for processing, convert it from nano amperes
to candelas per square metre using the calibration constants derived above for each phosphor colour.
B.4 Calculations to achieve Correct Colours
The colours for ECDIS are specified in CIE x, y, L co-ordinates, and the system that outputs the colours to the monitor uses RGB values. A calculation is performed to compute the correct RGB values to yield the correct colour (in CIE x, y, L) on the screen.
At the end of the measurement sequence, there are two sets of data collected - a set of RGB co-ordinates for the principal colour elements of the monitor {(xr yr), (xg yg), (xb yb)} and a set of gamma function data in the form of (DAC Value, L out) for each of red, green and blue. The data should consist of about 23 sets of numbers for each colour.
The calculation routine uses this data to calculate the correct RGB values that correspond to the desired x, y, L co-ordinate description.
The calculation details are handled by a computer program that is part of the Presentation Library. This procedure described here details the user input and output procedure for using the program. In addition, the mathematical basis for the
64
S-52, Edition 6.0 March 2010
calculations is explained in section B.6.
B.4.1
Calibration computations using the CIE2RGB software in the Presentation Library
A utility exists in the Presentation Library called CIE2RGB which will take a series of CIE colour co-ordinates and luminance values and convert them to RGB DAC values for use in ECDIS, according to the specific calibration characteristics of the monitor used. Instructions for using this utility are appended to this Annex in section B.7.
B.5 Calibration Verification This section discusses the instrumental verification of the calibration of the colours in the earlier PL edition 3.2 bright sun (DAY_BRIGHT) colour table. The procedure applies equally to the edition 3.3 "DAY" table. Basically, it is carried out by measuring blocks of known colour and comparing their co-ordinates to the standard colours. All of the distinct colours of the bright sun colour table should be verified instrumentally, however certain colour pairs are exempt from the comparison as explained in B 5.5. The procedure for verifying the remaining colour tables visually is described in B 5.6.
Note: The procedure of calibrating/verifying all three colour tables of an LCD instrumentally by the current method used for CRTs on the Day table alone, together with remote control of the calibration settings, should also be used for LCDs.
There are no inexpensive instruments available that will directly measure and read out x, y, and L co-ordinates over the entire range of specified colours. (It is the low luminance colours that are a problem.) With a mathematical routine, colour co-ordinate data can be derived from the Graseby 370 radiometer that is used for the basic monitor calibration. This has the advantage of being accurate over a very wide range of luminances.
B.5.1
Theory of measurement
Mathematical relationships exist between red, green, and blue luminance components of a colour as seen on a monitor and its x, y, and L co-ordinates. (This relationship is developed in B.6.2). This requires that the chromaticity of the principal colour producing elements is known, and that the luminance of the red, green, and blue components of each measured colour are known. Using this information, and the mathematical relationship, it is possible to derive the colour co-ordinates of any on-screen colour.
The actual measurements are made by measuring individually the red, green and blue colour luminance components of each colour to be measured. These are then computed to give the colour co-ordinates. Note that each colour sample must be displayed three times - once each with only its red, green, and blue components.
B.5.2
Equipment required
This testing requires that the proper signals be generated and that the colour co-ordinates be measured. The following equipment is required:
65
S-52, Edition 6.0 March 2010
- Monitor to be verified, connected to image generation system. - Software in image system to create all the colours of each colour table. This
must allow the red green and blue components to be displayed separately for each colour. These colours should be displayed in a rectangle of about 5 cm square, in the centre of the screen.
- Luminance meter such as the Graseby 370 to measure the luminance of the red, green, and blue components of the test colours.
- Colorimeter, such as Minolta CS 100 to measure the colour co-ordinates of the phosphor on the test CRT. This should be calibrated to "Illuminant A".
- Software utility to perform the calculations to verify the calibration integrity. - Calibration factors for each phosphor to convert Graseby readings from amperes
to candelas per metre squared (cd/m²). (See section B.3.2).
B.5.3
Set-up for measurement
Important - These measurements are very sensitive to stray light entering the experimental area, and inaccurate results will occur if special care is not taken. All measurements should be taken with the measurement area properly shielded against stray light. The measurements are best taken with light absorbers in place around the monitor and measurement apparatus. A black felt drape over the measurement area works well. Care must be taken by the operator that his clothing does not reflect light back into the measurement area.
B.5.3.1 Monitor set-up
The monitor must be adjusted to its calibration conditions. (See section B.2.3). This means the controls are set to its calibration position i.e. black (CHBLK) on the screen is 0.52 cd/m² or below and a white square (CHWHT) on the screen has a luminance of 80 cd/m² (note that if the tolerance of luminance is 20%, then the acceptable range of CHWHT is from 64 to 96 cd/m²). This ensures that the monitor is set up as closely as possible to its factory settings, and the colours will be as close to calibrated values as possible.
B.5.3.2 Principal colour producing element chromaticity measurement
The Chromaticity (colour co-ordinates) of the principal colour producing elements is measured using the procedure outlined in B.3.1.
B.5.3.3 Luminance/radiance meter set-up
The luminance or radiance meter should be secured so that it measures the same part of the screen for all measurements. A suction cup with hanging bracket works well. The measurement area of the luminance meter should be well within the square of the test colour.
B.5.4
Measurement procedure
This procedure is well suited for automation. Under software control, the test patterns can be generated, and the output of the luminance meter recorder, and colour x, y, and L data calculated:
66
S-52, Edition 6.0 March 2010
1. Set up the software so that it generates the test patterns and colours. The test pattern should be a square of size approximately 5 cm per side. The software should cycle through the colours in the particular colour table being verified. The Red, Green, and Blue colour components for each test colour should be sent to the monitor separately.
2. Measure separately the luminance of each of red, green, and blue for each
colour of each table to be tested. In the crudest sense, this is accomplished by disconnecting the two colour channels that are not being currently measured. Under software control, this can be more elegantly controlled, where the computer that is creating the colour test square will send only the individual colour components to the monitor screen one at a time.
3. The luminance of each colour is calculated by using the calibration factor for
each colour that is derived under section B.3.2 above.
4. Calculate the x, y, and L for each colour measured using the procedure outlined in section B.6.2.
B.5.5
Measurement verification
The measurements must be within required limits of each colour, as specified in section 5.2.3 of this document, "Colour Conversion Tolerance".
The following colour pairs of the BRIGHT_SUN colour table have a ΔE* of <20.
In order to allow for measurement errors, which might put them outside the tolerance limits, they are exempt from the colour separation tolerance test which requires a ΔE* of >10.
Token
Colour x, y, L
Token
Colour x, y, L
ΔE*
DEPMD
(.27 .30 65) pale blue
CHWHT
DEPDW
UIBCK
(.28 .31 80)
white
11
CHBRN
(.42 .45 30)
Brown
ADINF
(.41, .47. 35)
yellow
14
DEPMS
(.24 .26, 55) medium blue
DEPVS
UIAFD
(.22 .24 45)
medium blue
17
DEPMD
(.27 .30 65) pale blue
CHGRF NODTA Ed 3.3 colours have
greater ΔE
(.28 .31 45) faint grey
18
67
S-52, Edition 6.0 March 2010
Token
Colour x, y, L
Token
Colour x, y, L
ΔE*
CHGRF
NODTA
(.28 .31 45) faint grey
CHGRD
SNDG1
DEPCN
SYTRK
RESGY
UIBDR
UINFF
(.28 .31 25)
grey
18
Table of Colour-pairs that are exempt from the Colour Separation Tolerance Test
Note that these colours have been checked out as discriminable as used on ECDIS by the IHO ECDIS Presentation Library, but they would not always be discriminable if used in other combinations than those used in ECDIS.
A utility exists in the Presentation Library called CHECKXYL which will provide a check of the total calibration by comparing measurements of actual colours and verifying that they are within specification. The instructions for using this routine are in section B.7.1
The data gathered from the measurement is loaded into this routine, and the results are output. The output of this routine should be compared with the bounds specified.
B.5.6
Visual verification of the remaining colour tables
For LCD displays the instrumental test should be applied to all three colour tables (see first paragraph of B.5).
For CRTs the dusk and night tables should be tested as follows:
.1 The person conducting the test should have passed the full, 36-plate, Ishihara
colour blindness test taken under a Standard Lamp or in natural sunlight. The tester should adapt to night viewing for 10 minutes before checking the night display.
.2 The controls should be set to their calibrated settings.
.3 While the display is off, adjust the light level reflected from white paper
positioned on the display screen to the following values:
68
S-52, Edition 6.0 March 2010
table day-black background 200 cd/m² +/- 50%
light level
dusk 10 cd/m² +/- 50% night darkness (ECDIS display predominant light)
Preferably use natural daylight for the daytime and dusk tables.
.4 Under each of the above conditions display the appropriate Colour Differentiation
Test Diagram** described in the Presentation Library, Part I, section 19.4 for the above tables. Select each table in turn and ensure that:
- each foreground stripe is clearly distinguished from its background;
- the foreground stripes representing yellow, orange, magenta, green, blue and
grey may be clearly identified.
** Note that the Colour Differentiation Test Diagram supplied as pseudo S-57 files on the CD carrying the Presentation Library must be used for this test, because only that source will reproduce the colours stored in the ECDIS for use in drawing the chart display. Any other source for the Colour Test Diagram which does not use the same colours that are used in drawing the display will not provide a valid test.
B.6 Mathematical Model used in Calibration
Typically colour on a monitor screen is the specific mixture between red, green and blue light. The specific colour is a function of the luminances of the red, green, and blue principal colour producing elements and the colour of each of the principal colour producing elements. The mathematical relationships are developed elsewhere, so the relationships will be given here and assumed correct. The required luminances for the guns to achieve a desired colour are given in matrix notation as follows:
=
−
ZYX
ALLL
b
g
r1
where: Lr , Lb , and Lg are the luminance outputs of the colour producing elements at the screen and A-1 is the inverse of the matrix A for the colour co-ordinates of the colour producing elements, given by:
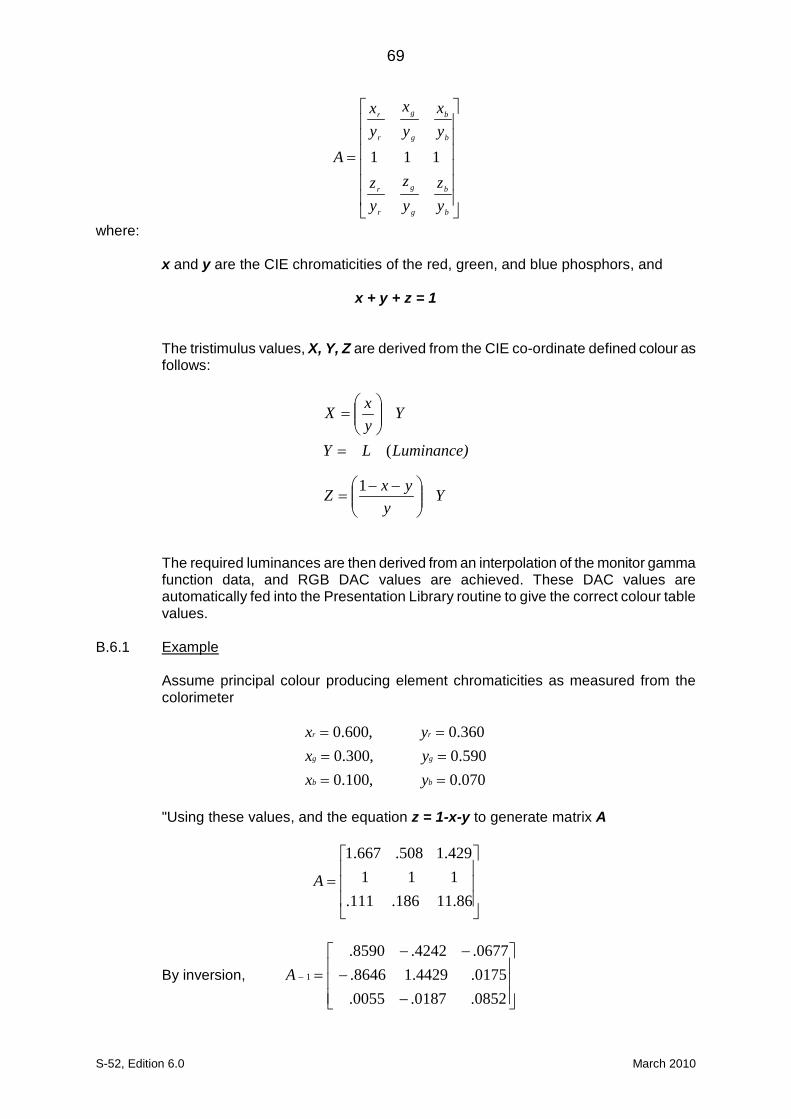
69
S-52, Edition 6.0 March 2010
=
b
b
g
g
r
r
b
b
g
g
r
r
yz
yz
yz
yx
yx
yx
A 111
where:
x and y are the CIE chromaticities of the red, green, and blue phosphors, and
x + y + z = 1
The tristimulus values, X, Y, Z are derived from the CIE co-ordinate defined colour as follows:
Yy
yxZ
Luminance)LY
YyxX
−−=
=
=
1
(
The required luminances are then derived from an interpolation of the monitor gamma function data, and RGB DAC values are achieved. These DAC values are automatically fed into the Presentation Library routine to give the correct colour table values.
B.6.1 Example
Assume principal colour producing element chromaticities as measured from the colorimeter
070.0,100.0590.0,300.0360.0,600.0
======
bb
gg
rr
yxyxyx
"Using these values, and the equation z = 1-x-y to generate matrix A
=86.11186.111.
111429.1508.667.1
A
By inversion,
−−
−−=−
0852.0187.0055.0175.4429.18646.0677.4242.8590.
1A
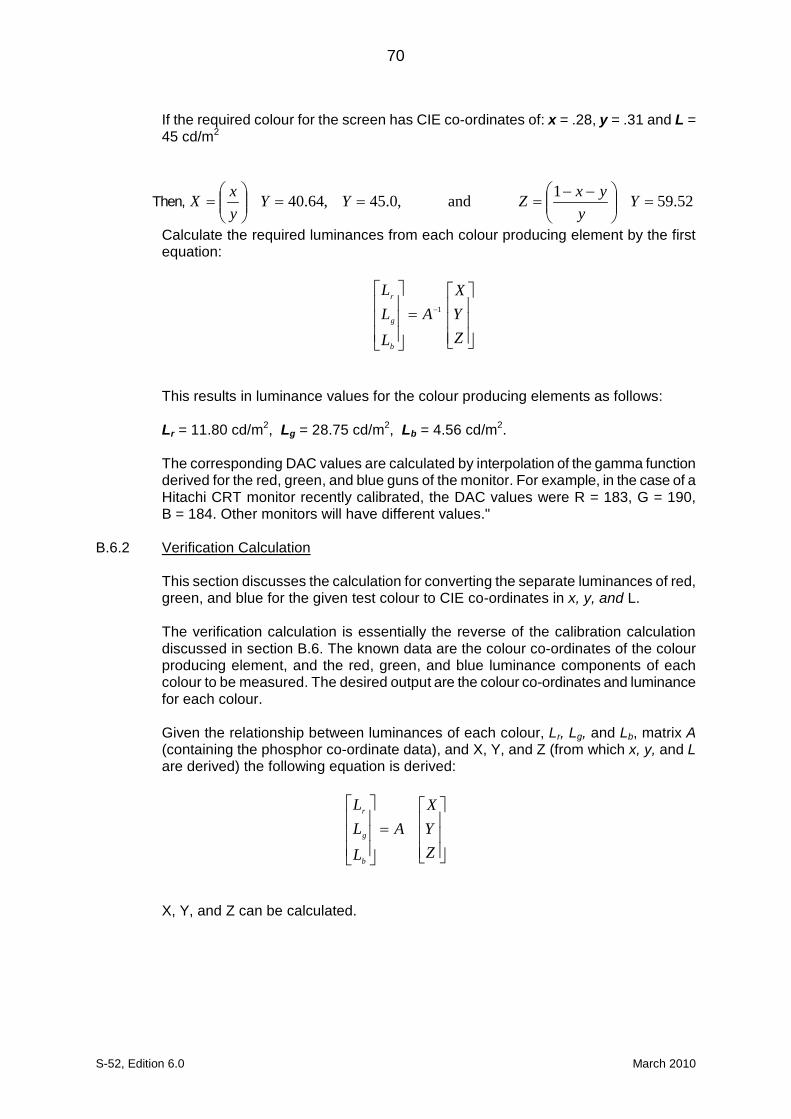
70
S-52, Edition 6.0 March 2010
If the required colour for the screen has CIE co-ordinates of: x = .28, y = .31 and L = 45 cd/m2
Then, 52.591and,0.45,64.40 =
−−===
= Y
yyxZYY
yxX
Calculate the required luminances from each colour producing element by the first equation:
=
−
ZYX
ALLL
b
g
r1
This results in luminance values for the colour producing elements as follows:
Lr = 11.80 cd/m2, Lg = 28.75 cd/m2, Lb = 4.56 cd/m2.
The corresponding DAC values are calculated by interpolation of the gamma function derived for the red, green, and blue guns of the monitor. For example, in the case of a Hitachi CRT monitor recently calibrated, the DAC values were R = 183, G = 190, B = 184. Other monitors will have different values."
B.6.2
Verification Calculation
This section discusses the calculation for converting the separate luminances of red, green, and blue for the given test colour to CIE co-ordinates in x, y, and L.
The verification calculation is essentially the reverse of the calibration calculation discussed in section B.6. The known data are the colour co-ordinates of the colour producing element, and the red, green, and blue luminance components of each colour to be measured. The desired output are the colour co-ordinates and luminance for each colour.
Given the relationship between luminances of each colour, Lr, Lg, and Lb, matrix A (containing the phosphor co-ordinate data), and X, Y, and Z (from which x, y, and L are derived) the following equation is derived:
=
ZYX
ALLL
b
g
r
X, Y, and Z can be calculated.
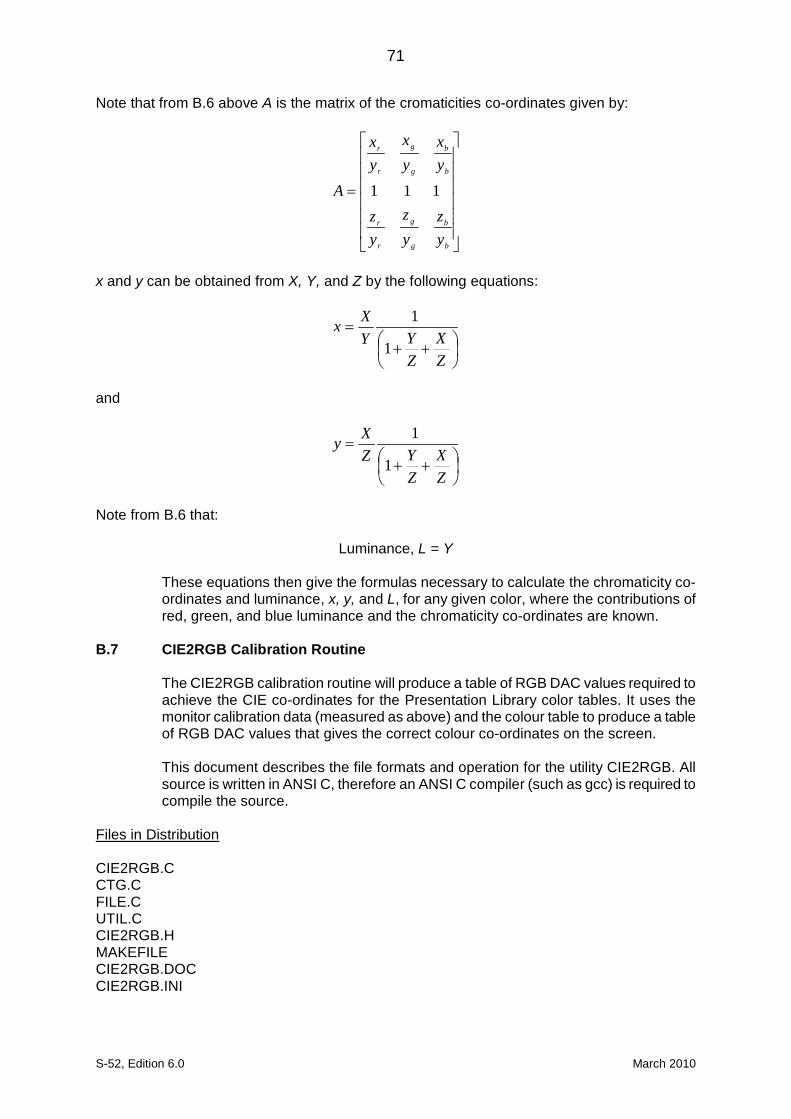
71
S-52, Edition 6.0 March 2010
Note that from B.6 above A is the matrix of the cromaticities co-ordinates given by:
=
b
b
g
g
r
r
b
b
g
g
r
r
yz
yz
yz
yx
yx
yx
A 111
x and y can be obtained from X, Y, and Z by the following equations:
++
=
ZX
ZYY
Xx1
1
and
++
=
ZX
ZYZ
Xy1
1
Note from B.6 that:
Luminance, L = Y
These equations then give the formulas necessary to calculate the chromaticity co-ordinates and luminance, x, y, and L, for any given color, where the contributions of red, green, and blue luminance and the chromaticity co-ordinates are known.
B.7 CIE2RGB Calibration Routine The CIE2RGB calibration routine will produce a table of RGB DAC values required to
achieve the CIE co-ordinates for the Presentation Library color tables. It uses the monitor calibration data (measured as above) and the colour table to produce a table of RGB DAC values that gives the correct colour co-ordinates on the screen.
This document describes the file formats and operation for the utility CIE2RGB. All
source is written in ANSI C, therefore an ANSI C compiler (such as gcc) is required to compile the source.
Files in Distribution
CIE2RGB.C CTG.C FILE.C UTIL.C CIE2RGB.H MAKEFILE CIE2RGB.DOC CIE2RGB.INI
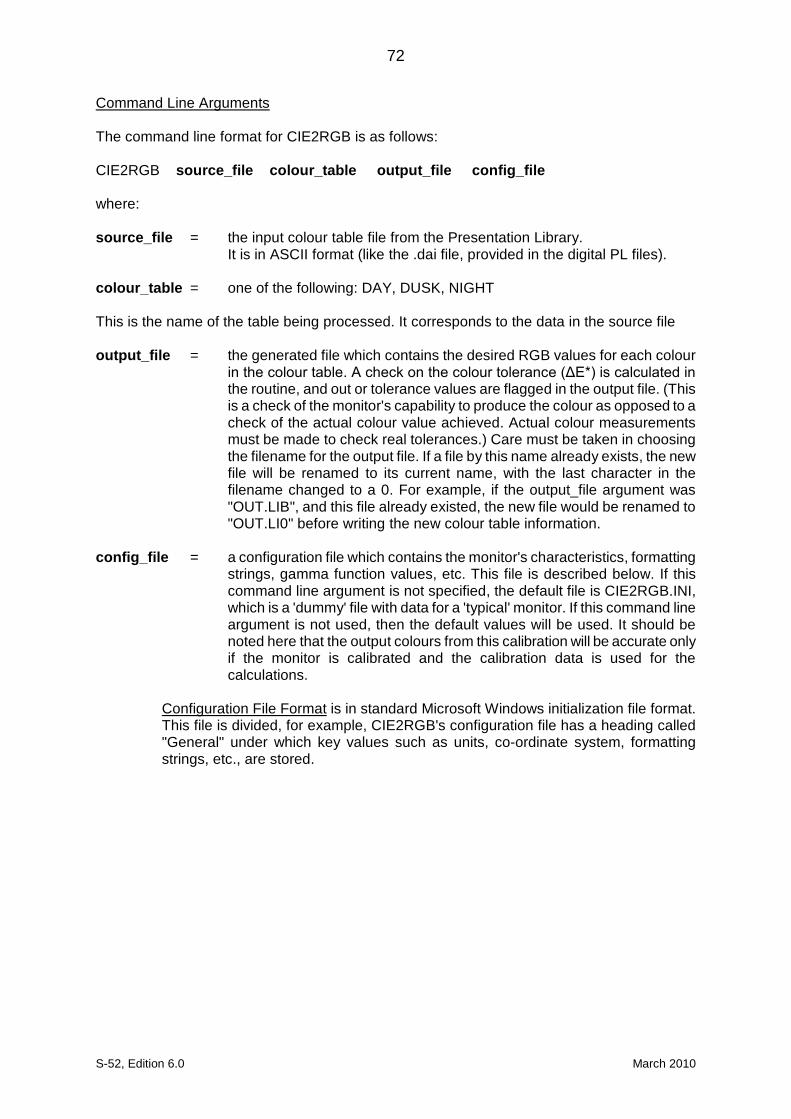
72
S-52, Edition 6.0 March 2010
Command Line Arguments
The command line format for CIE2RGB is as follows: CIE2RGB source_file colour_table output_file config_file where: source_file = the input colour table file from the Presentation Library. It is in ASCII format (like the .dai file, provided in the digital PL files). colour_table = one of the following: DAY, DUSK, NIGHT This is the name of the table being processed. It corresponds to the data in the source file output_file = the generated file which contains the desired RGB values for each colour
in the colour table. A check on the colour tolerance (ΔE*) is calculated in the routine, and out or tolerance values are flagged in the output file. (This is a check of the monitor's capability to produce the colour as opposed to a check of the actual colour value achieved. Actual colour measurements must be made to check real tolerances.) Care must be taken in choosing the filename for the output file. If a file by this name already exists, the new file will be renamed to its current name, with the last character in the filename changed to a 0. For example, if the output_file argument was "OUT.LIB", and this file already existed, the new file would be renamed to "OUT.LI0" before writing the new colour table information.
config_file = a configuration file which contains the monitor's characteristics, formatting
strings, gamma function values, etc. This file is described below. If this command line argument is not specified, the default file is CIE2RGB.INI, which is a 'dummy' file with data for a 'typical' monitor. If this command line argument is not used, then the default values will be used. It should be noted here that the output colours from this calibration will be accurate only if the monitor is calibrated and the calibration data is used for the calculations.
Configuration File Format
is in standard Microsoft Windows initialization file format. This file is divided, for example, CIE2RGB's configuration file has a heading called "General" under which key values such as units, co-ordinate system, formatting strings, etc., are stored.
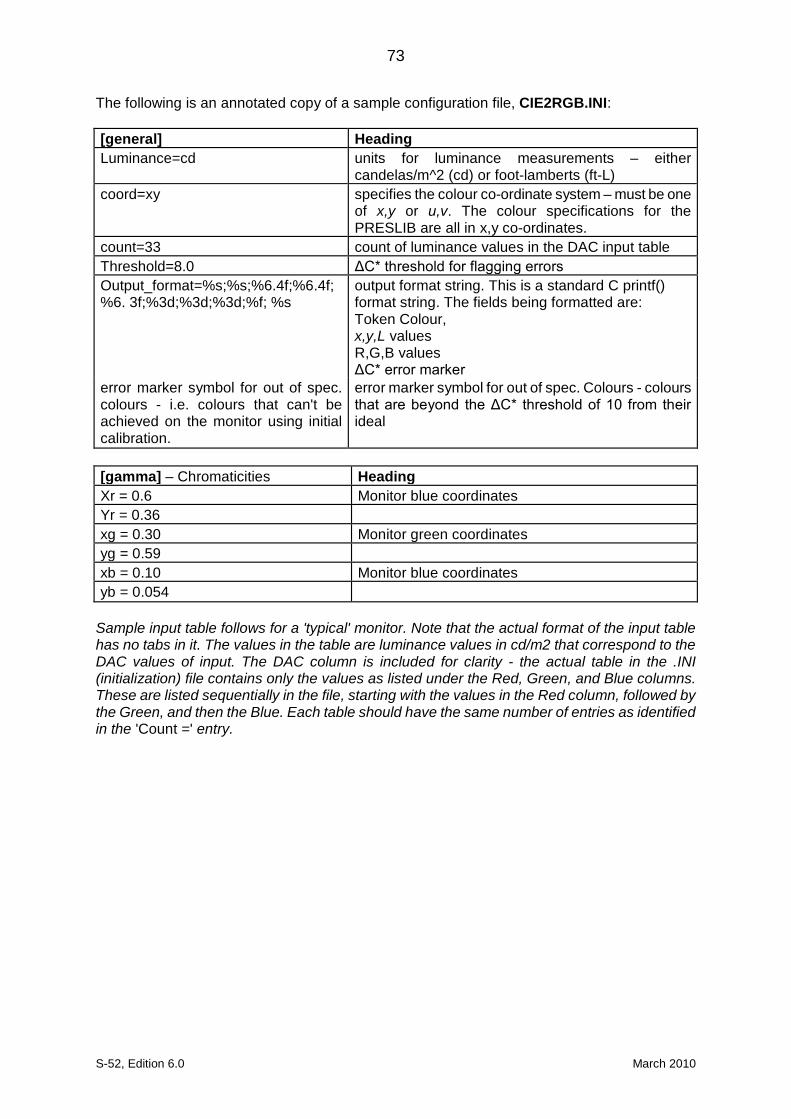
73
S-52, Edition 6.0 March 2010
The following is an annotated copy of a sample configuration file, CIE2RGB.INI: [general]
Heading
Luminance=cd units for luminance measurements – either candelas/m^2 (cd) or foot-lamberts (ft-L)
coord=xy specifies the colour co-ordinate system – must be one of x,y or u,v. The colour specifications for the PRESLIB are all in x,y co-ordinates.
count=33 count of luminance values in the DAC input table
Threshold=8.0 ΔC* threshold for flagging errors
Output_format=%s;%s;%6.4f;%6.4f;%6. 3f;%3d;%3d;%3d;%f; %s
output format string. This is a standard C printf() format string. The fields being formatted are: Token Colour, x,y,L values R,G,B values ΔC* error marker
error marker symbol for out of spec. colours - i.e. colours that can't be achieved on the monitor using initial calibration.
error marker symbol for out of spec. Colours - colours that are beyond the ΔC* threshold of 10 from their ideal
[gamma] – Chromaticities
Heading
Xr = 0.6 Monitor blue coordinates
Yr = 0.36
xg = 0.30 Monitor green coordinates
yg = 0.59
xb = 0.10 Monitor blue coordinates
yb = 0.054
Sample input table follows for a 'typical' monitor. Note that the actual format of the input table has no tabs in it. The values in the table are luminance values in cd/m2 that correspond to the DAC values of input. The DAC column is included for clarity - the actual table in the .INI (initialization) file contains only the values as listed under the Red, Green, and Blue columns. These are listed sequentially in the file, starting with the values in the Red column, followed by the Green, and then the Blue. Each table should have the same number of entries as identified in the 'Count =' entry.
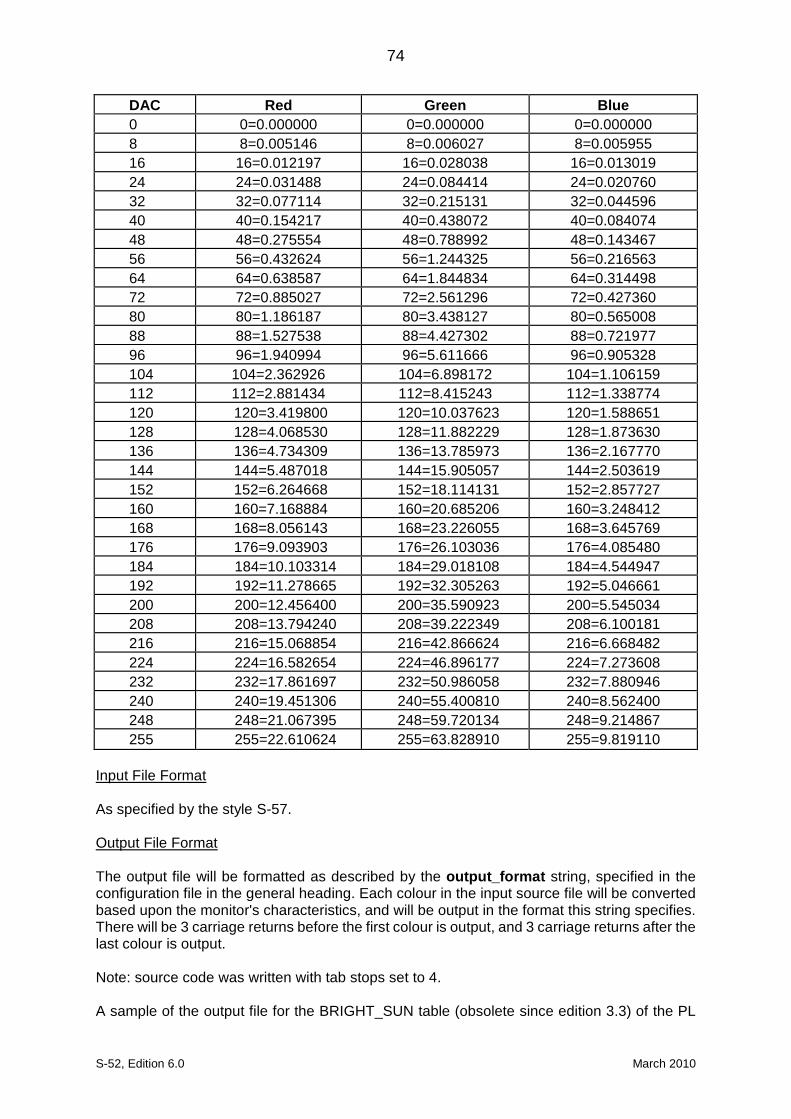
74
S-52, Edition 6.0 March 2010
DAC
Red
Green
Blue
0
0=0.000000
0=0.000000
0=0.000000 8
8=0.005146
8=0.006027
8=0.005955
16
16=0.012197
16=0.028038
16=0.013019 24
24=0.031488
24=0.084414
24=0.020760
32
32=0.077114
32=0.215131
32=0.044596 40
40=0.154217
40=0.438072
40=0.084074
48
48=0.275554
48=0.788992
48=0.143467 56
56=0.432624
56=1.244325
56=0.216563
64
64=0.638587
64=1.844834
64=0.314498 72
72=0.885027
72=2.561296
72=0.427360
80
80=1.186187
80=3.438127
80=0.565008 88
88=1.527538
88=4.427302
88=0.721977
96
96=1.940994
96=5.611666
96=0.905328 104
104=2.362926
104=6.898172
104=1.106159
112
112=2.881434
112=8.415243
112=1.338774 120 120=3.419800 120=10.037623
120=1.588651
128
128=4.068530
128=11.882229
128=1.873630 136
136=4.734309
136=13.785973
136=2.167770
144
144=5.487018
144=15.905057
144=2.503619 152
152=6.264668
152=18.114131
152=2.857727
160
160=7.168884
160=20.685206
160=3.248412 168
168=8.056143
168=23.226055
168=3.645769
176
176=9.093903
176=26.103036
176=4.085480 184
184=10.103314
184=29.018108
184=4.544947
192
192=11.278665
192=32.305263
192=5.046661 200
200=12.456400
200=35.590923
200=5.545034
208
208=13.794240
208=39.222349
208=6.100181 216
216=15.068854
216=42.866624
216=6.668482
224
224=16.582654
224=46.896177
224=7.273608 232
232=17.861697
232=50.986058
232=7.880946
240
240=19.451306
240=55.400810
240=8.562400 248
248=21.067395
248=59.720134
248=9.214867
255
255=22.610624
255=63.828910
255=9.819110
Input File Format
As specified by the style S-57.
Output File Format
The output file will be formatted as described by the output_format string, specified in the configuration file in the general heading. Each colour in the input source file will be converted based upon the monitor's characteristics, and will be output in the format this string specifies. There will be 3 carriage returns before the first colour is output, and 3 carriage returns after the last colour is output. Note: source code was written with tab stops set to 4. A sample of the output file for the BRIGHT_SUN table (obsolete since edition 3.3) of the PL
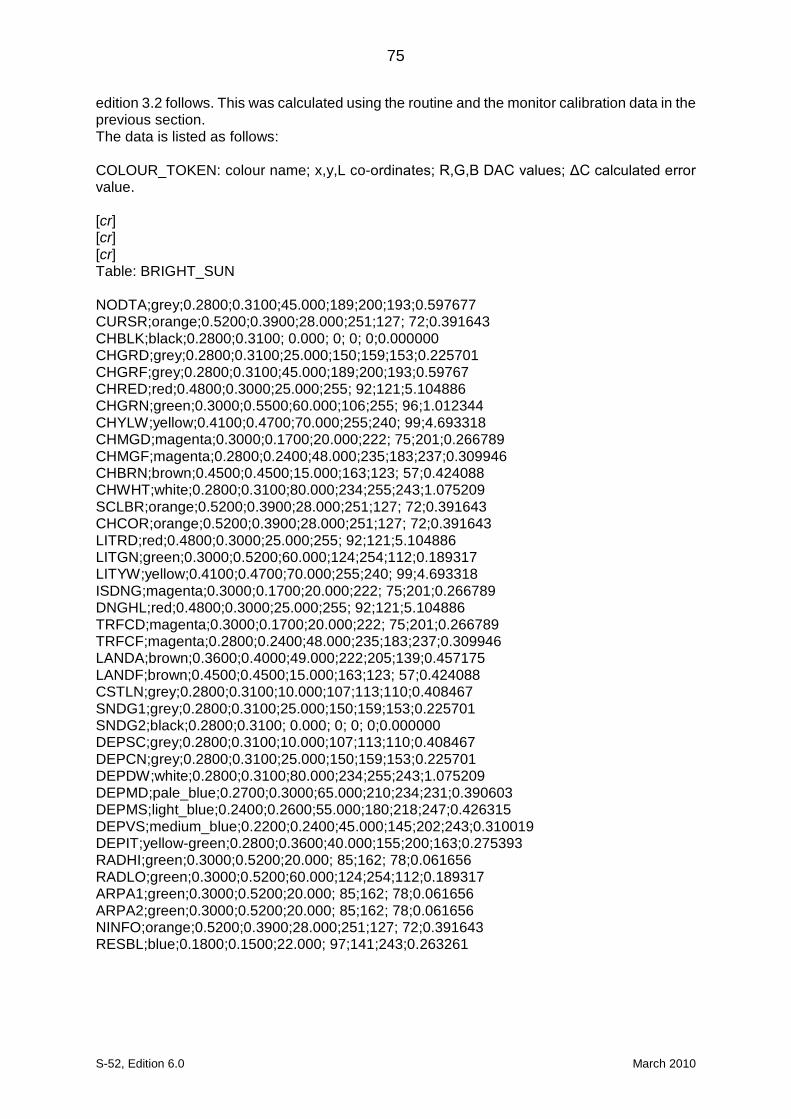
75
S-52, Edition 6.0 March 2010
edition 3.2 follows. This was calculated using the routine and the monitor calibration data in the previous section. The data is listed as follows: COLOUR_TOKEN: colour name; x,y,L co-ordinates; R,G,B DAC values; ΔC calculated error value. [cr] [cr] [cr] Table: BRIGHT_SUN NODTA;grey;0.2800;0.3100;45.000;189;200;193;0.597677 CURSR;orange;0.5200;0.3900;28.000;251;127; 72;0.391643 CHBLK;black;0.2800;0.3100; 0.000; 0; 0; 0;0.000000 CHGRD;grey;0.2800;0.3100;25.000;150;159;153;0.225701 CHGRF;grey;0.2800;0.3100;45.000;189;200;193;0.59767 CHRED;red;0.4800;0.3000;25.000;255; 92;121;5.104886 CHGRN;green;0.3000;0.5500;60.000;106;255; 96;1.012344 CHYLW;yellow;0.4100;0.4700;70.000;255;240; 99;4.693318 CHMGD;magenta;0.3000;0.1700;20.000;222; 75;201;0.266789 CHMGF;magenta;0.2800;0.2400;48.000;235;183;237;0.309946 CHBRN;brown;0.4500;0.4500;15.000;163;123; 57;0.424088 CHWHT;white;0.2800;0.3100;80.000;234;255;243;1.075209 SCLBR;orange;0.5200;0.3900;28.000;251;127; 72;0.391643 CHCOR;orange;0.5200;0.3900;28.000;251;127; 72;0.391643 LITRD;red;0.4800;0.3000;25.000;255; 92;121;5.104886 LITGN;green;0.3000;0.5200;60.000;124;254;112;0.189317 LITYW;yellow;0.4100;0.4700;70.000;255;240; 99;4.693318 ISDNG;magenta;0.3000;0.1700;20.000;222; 75;201;0.266789 DNGHL;red;0.4800;0.3000;25.000;255; 92;121;5.104886 TRFCD;magenta;0.3000;0.1700;20.000;222; 75;201;0.266789 TRFCF;magenta;0.2800;0.2400;48.000;235;183;237;0.309946 LANDA;brown;0.3600;0.4000;49.000;222;205;139;0.457175 LANDF;brown;0.4500;0.4500;15.000;163;123; 57;0.424088 CSTLN;grey;0.2800;0.3100;10.000;107;113;110;0.408467 SNDG1;grey;0.2800;0.3100;25.000;150;159;153;0.225701 SNDG2;black;0.2800;0.3100; 0.000; 0; 0; 0;0.000000 DEPSC;grey;0.2800;0.3100;10.000;107;113;110;0.408467 DEPCN;grey;0.2800;0.3100;25.000;150;159;153;0.225701 DEPDW;white;0.2800;0.3100;80.000;234;255;243;1.075209 DEPMD;pale_blue;0.2700;0.3000;65.000;210;234;231;0.390603 DEPMS;light_blue;0.2400;0.2600;55.000;180;218;247;0.426315 DEPVS;medium_blue;0.2200;0.2400;45.000;145;202;243;0.310019 DEPIT;yellow-green;0.2800;0.3600;40.000;155;200;163;0.275393 RADHI;green;0.3000;0.5200;20.000; 85;162; 78;0.061656 RADLO;green;0.3000;0.5200;60.000;124;254;112;0.189317 ARPA1;green;0.3000;0.5200;20.000; 85;162; 78;0.061656 ARPA2;green;0.3000;0.5200;20.000; 85;162; 78;0.061656 NINFO;orange;0.5200;0.3900;28.000;251;127; 72;0.391643 RESBL;blue;0.1800;0.1500;22.000; 97;141;243;0.263261

76
S-52, Edition 6.0 March 2010
RESYW;yellow;0.4100;0.4700;70.000;255;240; 99;4.693318 RESGR;grey;0.2300;0.2600; 6.500; 76; 98;110;0.623020 SHIPS;black;0.2800;0.3100; 0.000; 0; 0; 0;0.000000 PLRTE;red;0.5800;0.3500;18.000;241; 71; 60;0.124164 APLRT;orange;0.4900;0.4100;35.000;255;152; 79;0.172613 UINFD;black;0.2800;0.3100; 0.000; 0; 0; 0;0.000000 UINFF;grey;0.2800;0.3100;25.000;150;159;153;0.225701 UIBCK;white;0.2800;0.3100;80.000;234;255;243;1.075209 UIAFD;medium_blue;0.2200;0.2400;45.000;145;202;243;0.310019 UINFR;red;0.4800;0.3000;25.000;255; 92;121;5.104886 UINFG;green;0.3000;0.5200;60.000;124;254;112;0.189317 UINFO;orange;0.5200;0.3900;28.000;251;127; 72;0.391643 UINFB;blue;0.1800;0.1500;22.000; 97;141;243;0.263261 UINFM;magenta;0.3000;0.1700;20.000;222; 75;201;0.266789 UIBDR;grey;0.2800;0.3100;25.000;150;159;153;0.225701 UIAFF;brown;0.3600;0.4000;49.000;222;205;139;0.457175 OUTLW;black;0.2800;0.3100; 0.000; 0; 0; 0;0.000000 OUTLL;brown;0.3600;0.4000;49.000;222;205;139;0.457175 B.7.1
CHECKXYL calibration verification utility
This section describes the file formats and operation for the utility CHECKXYL. All source is written in ANSI C, therefore an ANSI C compiler (such as gcc) is required to compile the source.
This utility will allow a system calibration to be verified, by making measurements of actual colour co-ordinates and luminances on the screen, and using them as inputs to the utility to compare the actual co-ordinates to the specified co-ordinates. This is done in the CIE ΔE units.
Files in Distribution
CHECKXYL.C COMPARE.C UTIL.C CHECKXYL.H MF (a makefile that can be used by invoking: make -f mf) CHECKXYL.DOC CHECKXYL.INI
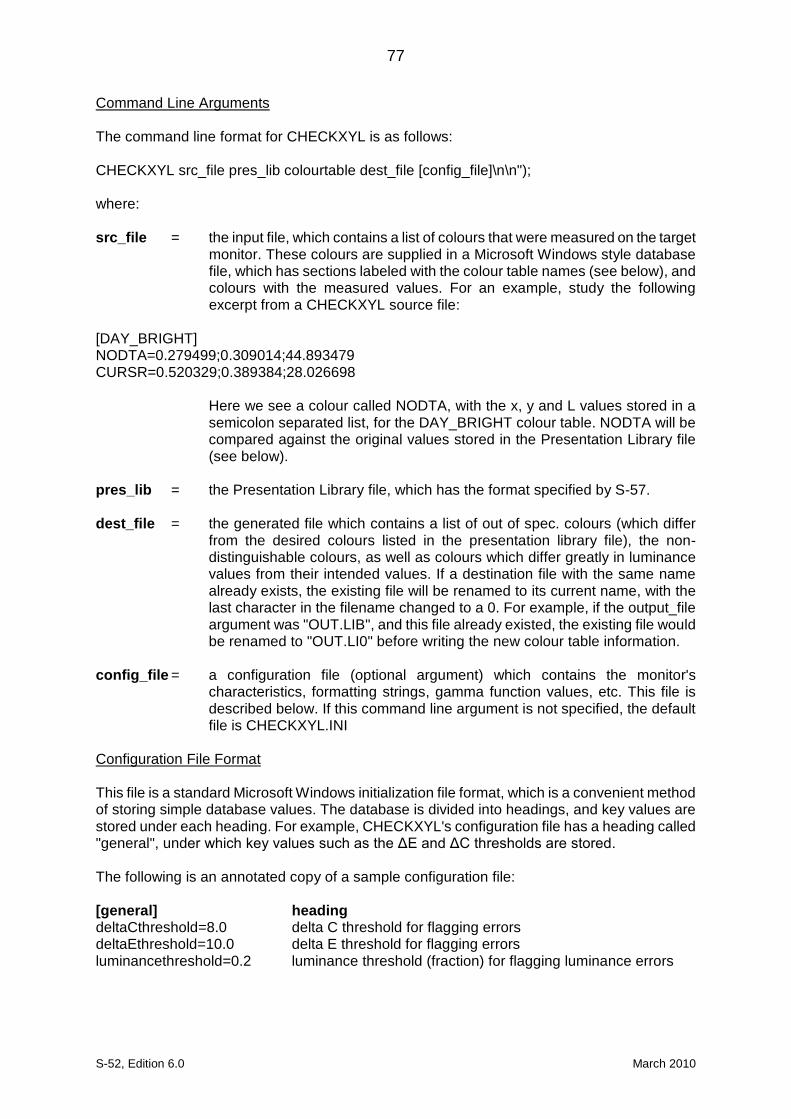
77
S-52, Edition 6.0 March 2010
Command Line Arguments
The command line format for CHECKXYL is as follows: CHECKXYL src_file pres_lib colourtable dest_file [config_file]\n\n"); where: src_file = the input file, which contains a list of colours that were measured on the target
monitor. These colours are supplied in a Microsoft Windows style database file, which has sections labeled with the colour table names (see below), and colours with the measured values. For an example, study the following excerpt from a CHECKXYL source file:
[DAY_BRIGHT] NODTA=0.279499;0.309014;44.893479 CURSR=0.520329;0.389384;28.026698
Here we see a colour called NODTA, with the x, y and L values stored in a semicolon separated list, for the DAY_BRIGHT colour table. NODTA will be compared against the original values stored in the Presentation Library file (see below).
pres_lib = the Presentation Library file, which has the format specified by S-57. dest_file = the generated file which contains a list of out of spec. colours (which differ
from the desired colours listed in the presentation library file), the non-distinguishable colours, as well as colours which differ greatly in luminance values from their intended values. If a destination file with the same name already exists, the existing file will be renamed to its current name, with the last character in the filename changed to a 0. For example, if the output_file argument was "OUT.LIB", and this file already existed, the existing file would be renamed to "OUT.LI0" before writing the new colour table information.
config_file = a configuration file (optional argument) which contains the monitor's
characteristics, formatting strings, gamma function values, etc. This file is described below. If this command line argument is not specified, the default file is CHECKXYL.INI
Configuration File Format
This file is a standard Microsoft Windows initialization file format, which is a convenient method of storing simple database values. The database is divided into headings, and key values are stored under each heading. For example, CHECKXYL's configuration file has a heading called "general", under which key values such as the ΔE and ΔC thresholds are stored. The following is an annotated copy of a sample configuration file: [general] heading deltaCthreshold=8.0 delta C threshold for flagging errors deltaEthreshold=10.0 delta E threshold for flagging errors luminancethreshold=0.2 luminance threshold (fraction) for flagging luminance errors
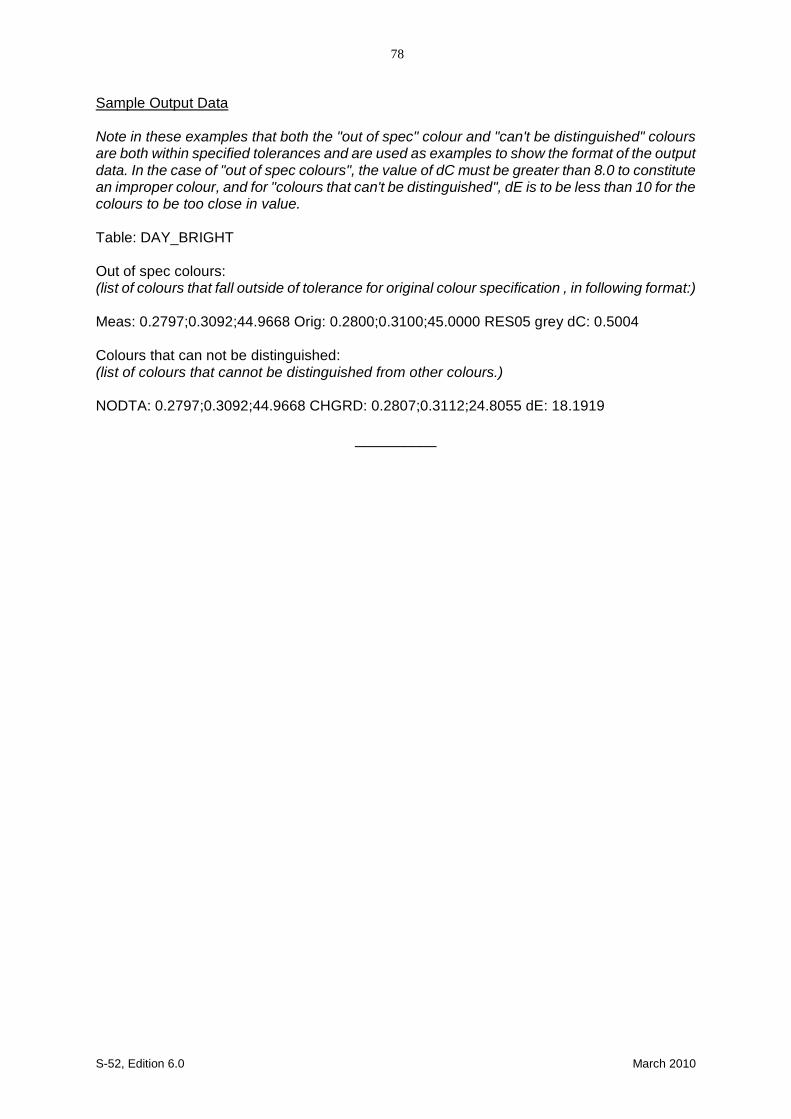
S-52, Edition 6.0 March 2010
78
Sample Output Data
Note in these examples that both the "out of spec" colour and "can't be distinguished" colours are both within specified tolerances and are used as examples to show the format of the output data. In the case of "out of spec colours", the value of dC must be greater than 8.0 to constitute an improper colour, and for "colours that can't be distinguished", dE is to be less than 10 for the colours to be too close in value. Table: DAY_BRIGHT Out of spec colours: (list of colours that fall outside of tolerance for original colour specification , in following format:) Meas: 0.2797;0.3092;44.9668 Orig: 0.2800;0.3100;45.0000 RES05 grey dC: 0.5004 Colours that can not be distinguished: (list of colours that cannot be distinguished from other colours.) NODTA: 0.2797;0.3092;44.9668 CHGRD: 0.2807;0.3112;24.8055 dE: 18.1919
__________
S-52, Edition 6.0 March 2010
79
Page intentionally left blank
S-52, Edition 6.0 March 2010
80
ANNEX C PROCEDURE FOR MAINTAINING THE CALIBRATION OF DISPLAYS C.1 Introduction
The application of ECDIS to practical marine use necessitates the development of a greater understanding of monitor limitations as they relate to an accurate colour display and a marine environment.
The factors that effect colour accuracy and the life of the monitor are discussed and an approach for onboard monitor testing and calibration is described in this Annex.
C.2 System Requirements
Monitor calibration is necessary for accurate colour reproduction. Several factors are important to review about the monitor system:
1. When the monitor is initially installed in the system, it should be calibrated and
the system matched to the IHO colour tables.
2. In use, the monitor should not let the colours shift beyond a certain perceptible relative limit. Each colour must be perceived as it was intended, and in a relative sense, one colour must not be mistaken for another.
3. When a colour shift occurs that is beyond limits, it should be possible to identify
that the shift is beyond limits without the need for special instruments and completely dark environments.
4. Monitor's will develop calibration errors with time, requiring a periodic
recalibration of the system. C.2.1
Display calibration-drift processes
Monitors may lose calibration through a number of mechanisms:
- Wearout:
For example over time, the electron gun structure of the CRT type of monitor wears, reducing the efficiency of the gun. This causes a relative diminishing of the output of the colour that is wearing fastest, and causes a colour shift toward the other colours. The wearing is 'coulombic', so depends on the total number of electrons that are emitted by the gun over time. In a practical computer graphic CRT, this effect will start to become noticeable (if you are looking for it) after 10,000 to 20,000 hours of operation. Usually it is roughly equal in each gun (because the dominant colour displayed is generally grey/white) and results in very little colour shift. In a situation where one colour dominates over time, colour shifts may appear.
- Drift: Drift occurs as components age. Drift will result in a change in the white point of the monitor. For a CRT type of monitor this change in white point will usually result in a shift in the colour of grey over the luminance range. For CRT's that are used in computer graphics situations, this drift is usually not a serious concern. In shipboard applications, drift will be a greater concern because of the constant vibration causing internal set-up controls to change, as well as ECDIS
S-52, Edition 6.0 March 2010
81
being a more colour-critical application. It is expected that recalibration due to drift will be required after several thousands of operational hours.
- Component Failures:
Component failure in the monitor or image generator component can cause problems ranging from drift to complete failure. Failures can result in a display shifting its colours or in a complete failure of one of the colours or even the complete picture. It is possible that the shift will be proportionally different at different drive levels. High quality monitors are designed with mean time before failure (MTBF) of 50,000 hours or more which results in a long life of the imaging system. The shipboard environment will degrade this due to the vibration and salt air.
In practice these mechanisms will cause a drift in the white point. This means that the specific colour of white will drift to cause the picture to appear a little more pinkish, bluish, or greenish. Usually, this can be 'touched up', without requiring a completely new calibration.
C.3 Verification of the display performance at sea C.3.1
Calibration tests to be used for verification of display's performance onboard ship
Colour calibration has traditionally been a complex and difficult task. Significant advances have been made in this area to achieve accurate results using instrumentation. This has been achieved by using modern photometric instruments to measure luminance, and ensuring that the monitor to be calibrated is well shielded from stray light entering the measurement area.
Because instrument-based testing is still not practical as an ongoing test on shipboard, an alternate approach has been chosen. Specifically a "Greyscale Test" and an onboard "Colour Differentiation Test Diagram" have been chosen as subjective measures of the monitor's performance.
C.3.1.1
Greyscale test
Greyscale is a well understood test pattern in the Video Monitor world, and it has a natural application here.
The Greyscale test is a visual test that is used to determine the colour tracking of the monitor. It is general, it is non quantitative and requires judgement on the part of the operator to use. On the other hand, it is quite sensitive, and familiar to video technicians.
This test is simple to use. It consists of putting a greyscale of at least 8 steps from black to white on the screen. The greyscale should be made of rectangles that are at least 2.5 cm by 10 cm. These can be oriented in either a horizontal or vertical direction. The greyscale is critically observed by the viewer from a distance of about 50 cm to 100 cm and any colour shifts in any of the rectangles of grey are noted.
The greyscale should appear to be a neutral shade of white in all rectangles. Each should appear to be the same 'colour' as the others, even though varying in intensity from black to white. Colour shading in any of the rectangles indicates a problem in the adjustment of the display.
S-52, Edition 6.0 March 2010
82
Interpretation of results:
The observer will see either a greyscale that is pure and free from colouring, or one which shows varying degrees of shading. If no colouring is seen, then the display is performing properly. If slight shading is seen, then the display is usable. If there is a lot of shading, then the display may be providing false colour information.
This test meets the criteria of simplicity and universality, but fails to be either quantitative or accurate. It should be used as an indication of performance of the display, but not an absolute measure. It should be noted that the identification and the degree of problem will vary according to the operator, so should not be considered as a quantitative test.
C.3.1.2
Colour Differentiation Test Diagram
At the mariner's level, a test is required that reassures him that the display is functioning adequately or alternatively that servicing is required. This is provided in the Presentation Library, Part I, sections 15.4, 19.3 and 19.4. It provides test diagrams that allows the mariner to confirm that his display clearly differentiates the important colours, as well as acting as a test chart for setting the controls for night use.
Note that the Colour Test Diagram must be implemented using the software specifically intended to generate this diagram, which comes with the Colours & Symbol CD, in order to ensure that the colours actually used to generate the chart display are shown on the diagram. Any other form of the Colour Test Diagram (.tif file etc.) will not display the correct colours.
C.4 Re-calibration of the Monitor
Recalibration of the monitor should be performed by a knowledgeable monitor technician, who has experience of light measurement.
Two levels of calibration can be performed: White Point Touch-up and Complete.
Before undertaking either calibration procedure, it is necessary to set and lock the controls for the duration of the calibration:
Setting the Controls:
The Brightness control is used to adjust the black level of the monitor. This is the point where the monitor screen is seen as black, and this setting will create the blackest black that can be displayed. After the control is set, it must be locked in place. Any adjustment of the brightness setting after calibration invalidates the process, unless it is returned to its calibrated position, (e.g. a detent position).
With the monitor in a dark environment (accomplished either at night or with the monitor area darkened with a hood), and with the monitor turned on and warmed up to the manufacturer's specification, drive the monitor with a black signal (0, 0, 0). Observe the border around the CRT where the tube is normally black, and visually compare its intensity to the black square in the centre of the screen. First adjust the brightness control to its maximum, then adjust it down until there is no distinction between the black square and the background. Adjust the control up until the active area just shows. (If a luminance meter is available, measure the Luminance of this area. It should be less than 0.52 candelas per square metre). Lock the control for the
S-52, Edition 6.0 March 2010
83
remainder of the calibration process. Setting the Contrast Control:
The contrast control should be adjusted to achieve maximum required output level at full white signal. Using a luminance meter and a peak white signal, (DAC values of 255, 255, 255) adjust the contrast control for the maximum luminance required by the system. Lock this control for the remainder of the calibration process.
C.4.1
White point touch-up
On the first order, the colour shifting will be primarily caused by white point shifts. Calibration can be maintained by 'touching up' the white point on a periodic basis. This can be done by a CRT technician who adjusts controls inside the CRT, or can be performed by adjusting the colour DAC values through an adjustment and calculational process. (The DAC adjustment would have to be designed into the software system by the ECDIS manufacturer).
- White Point Calibration in the CRT: (Performed by adjusting the CRT
electronics) The white point of a CRT is set up by comparing the white colour on the screen to a standard lamp. The standard lamps for this purpose are fairly rugged, and compact. The process is reasonably accurate. The process is as follows:
1. Put a black signal onto the screen. Adjust the black level of each gun
(using the R,G,B cut-off controls) to just extinguish the raster in each colour.
2. Put a white signal on the screen, and adjust the individual gain controls of
the R,G, and B guns to achieve a white that matches the standard lamp.
- White Point Calibration in the Frame Buffer: Use an interface to the computer (keyboard or trackball) that allows the technician to adjust the white point by adjusting the maximum output of the DAC's to yield a white that compares with the standard. The computer will then adjust the DAC values in the middle of the range appropriately to maintain colour fidelity.
1. Put a white signal in the screen.
2. Adjust the input signal levels (DAC values) of red, green, and blue to give
the correct white level.
3. Instruct the computer to compute the DAC value corrections in the range. C.4.2
Automatic Calibration monitors
Several manufacturers make monitors's that have built-in calibration capability. (e.g. Barco). These monitor's will perform a white point calibration by adjusting internal controls through the use of their own light sensor and calibration system. This recalibration process is in general suitable for the white point touch-up requirements of this Annex.
S-52, Edition 6.0 March 2010
84
C.4.3
Complete calibration
Calibration and adjustment beyond the white point adjustments are the domain of a more detailed and complex procedure, and are not practical to undertake on the Bridge. Under normal conditions, when a display fails the white balance test or cannot be corrected by a white balance adjustment, it should be returned to the factory for re-calibration and/or repair. (See Annex B: Procedure for Initial Calibration of Colour Displays.)
This Annex was researched and written by:
Matthew Cowan 18 McAllister Lane
Bloomingdale, Ontario under a contract funded by The Canadian Coast Guard.
The Grayscale Test was suggested by:
Dave Hannah, Kelvin Hughes Limited, Ilford, Essex, U.K.
This annex was amended as generic for any type of monitor by: Hannu Peiponen, Furuno Oy, Espoo, Finland.
__________