Embed Size (px)
Citation preview

International Investment Australia2016

Statistics Section Office of Economic Analysis
Investment and Economic Division
October 2017
INTERNATIONAL INVESTMENT AUSTRALIA 2016
i
ISSN 2203-6571 (Print) ISSN 2204-3195 (Online)
ISBN 978-1-74322-408-3(Book) ISBN 978-1-74322-407-6 (PDF format)
With the exception of the Commonwealth Coat of Arms and where otherwise noted, this report is licenced under a Creative Commons Attribution 3.0 Australia licence http://creativecommons.org/licenses/by/3.0/au/.
You are free to reuse, modify, remix and distribute this material. The entire publication may be included as an appendix in your work for reference if you wish. Under the terms of the licence, you are required to attribute DFAT material in the manner specified (but not in any way that suggests DFAT endorses you or your use of the work).
DFAT material used ‘as supplied’
Provided you have not modified/remixed the material in this publication in any way, it may be reused provided the following attribution is given:
Source: DFAT publication ‘International Investment Australia 2016’.
Derivative material
If you have modified/remixed the material in this publication, or derived new material from it in any way, the following attribution must be used:
Based on the DFAT publication ‘International Investment Australia 2016’.
Use of the Coat of Arms
The terms under which the Coat of Arms can be used are detailed on the It’s an Honour website http://www.itsanhonour.gov.au/coat-arms/index.cfm.
The Department of Foreign Affairs and Trade (DFAT) has taken great care to ensure the information contained in this publication is as correct and accurate as possible.
However, DFAT does not guarantee, and accepts no legal liability whatsoever arising from or connected to, the accuracy, reliability, currency or completeness of any material contained in the publication.
DFAT recommends that users exercise their own skill and care with respect to their use of the material contained in the publication and that users carefully evaluate the accuracy, currency, completeness and relevance of the material for their purposes.
Unless otherwise specified, all amounts are in Australian dollars.
ii
UP-TO-DATE TRADE STATISTICS SERVICES TAILORED TO YOUR NEEDS FROM AUSTRALIA’S PREMIER SOURCE
In so many industries, knowledge is the key to success. Moreover, it is the quality of that information that is paramount.
Now you can access Australian trade statistics gathered and held by Australia’s leading expert in the field, the Department of Foreign Affairs and Trade (DFAT). Better still, this information can be customised and prepared to suit your specific needs.
The Statistics Section (STA) provides statistics used in research, including measures such as detailed classifications of exports and imports. STA’s data holdings include a substantial amount of economic and social information about Australia and the rest of the world.
Trade data is available in any of the following combinations:
Trade time series
DFAT has created a range of time series products to complement its statistical trade publications. These products include:
i) Trade statistical pivot tables:
• Australia's exports and imports by all countries, all State and Territories and selected country groups by the Standard International Trade Classification (SITC) at the 3-digit level; and
• Australia's exports and imports by all countries, all State and Territories and selected country groups by DFAT's Trade Import and Export Classification (TRIEC) at the 1-, 2-, 3- and 4-digit levels.
These pivot tables are published on a calendar and financial year basis. ii) Australia’s direction of goods and services trade:
Time series spreadsheets covering Australia’s trade in goods and services (exports, imports & two-way trade). Data on goods, services and goods and services is published for Australia’s trading partners, as well by regions and selected country groups.
The spreadsheets are published on a calendar year basis (back to 1987) and a financial year basis (back to 1986-87).
iii) Historical trade and economic data:
As part of a forthcoming product, Australia’s Trade Through Time (ATTT), two spreadsheets are now available on the DFAT website. The first spreadsheet, Australia’s trade and economic indicators, contains time series data for a range of trade and economic indicators back to 1901 (and for total merchandise trade back to 1826). The second time series spreadsheet, Australia’s direction of trade, contains time series data for around 60 of Australia’s major merchandise trading partners back to 1901 (and in some cases to 1885).
A WORLD OF TRADE DATA AT YOUR
FINGERTIPS

iii
Market information service STA provides accurate and timely, high-level statistical support for research and analysis. The consultancy service also draws on international sources to compile the most comprehensive coverage available, so you can have a world of trade information individually prepared to your requirements and delivered quickly, accurately and at a very competitive price. ● Reports can be “tailor-made” according to requirements – by country and by commodity – monthly, quarterly and for calendar or financial years. ● STA prepares general profiles of economic and social indicators for Australia’s trading partners – country economic factsheets (190 countries currently available).
For more information about our services email [email protected] or visit the website http://dfat.gov.au/trade/resources/trade-statistics/Pages/trade-statistics.aspx; or visit http://dfat.gov.au/trade/resources/Pages/trade-and-economic-fact-sheets-for-countries-and-regions.aspx for the fact sheets.
Interactive website Explore Australia’s Trade at a Glance interactive website which complements the annual Trade at a Glance publication, allowing users to investigate Australia’s trade profile. It brings together information from a range of DFAT publications in the one location for the first time. It includes data on Australia’s top trading partners, Australia’s trade by state and territory, Australia’s trade with APEC, the G20 and ASEAN.
Trade statistical publications Each year STA produces a range of publications containing detailed information on all aspects of Australia’s trade in goods and services and investment with the rest of the world. These are available as accessible PDFs at http://dfat.gov.au/trade/resources/Pages/trade-statistical-publications.aspx.
Releases in the series include:
Composition of Trade Australia – biannual on a calendar and financial year basis;
Trade in Services Australia – biannual on a calendar and financial year basis;
Australia’s trade by State and Territory – annual on a financial year basis;
International Investment Australia – annual on a calendar year basis.

Page 1
CONTENTS
INTRODUCTION 2
CAUTION NOTE 5
Impact on Australian FDI data reported on asset/liability vs a directional basis................................................ 5
KEY POINTS, 2016 7
Total investment .................................................................................................................................................... 7 Direct investment .................................................................................................................................................. 7 Global direct investment ....................................................................................................................................... 8
BOX A – QUANTUM OF NEW FOREIGN DIRECT INVESTMENT IN AUSTRALIA, 2016 9
OVERVIEW OF AUSTRALIA’S INTERNATIONAL INVESTMENT POSITION, 2016 11
AUSTRALIAN INTERNATIONAL INVESTMENT STOCKS AT THE END OF 2016 14
DID YOU KNOW ….. 17
AUSTRALIAN DIRECT INTERNATIONAL INVESTMENT STOCKS AT THE END OF 2016 18
AUSTRALIAN BUSINESSES WITH FOREIGN OWNERSHIP, 2016 20
INTERNATIONAL DIRECT INVESTMENT – GLOBAL OVERVIEW, 2016 21
FOREIGN INVESTMENT REVIEW BOARD, 2015-16 23
BOX B – MERGERS AND ACQUISITIONS VERSUS GREENFIELD INVESTMENTS 25
INTERNATIONAL TRADE AND INVESTMENT OPENNESS INDICATORS – COMPARISON CHARTS 26

Page 2
ECONOMIC ACTIVITY OF AUSTRALIAN MAJORITY OWNED BUSINESSES LOCATED IN CANADA, THE EUROPEAN UNION, NEW ZEALAND AND THE UNITED STATES 31
Introduction ......................................................................................................................................................... 31 Australian majority owned businesses in Canada .............................................................................................. 32 Australian majority owned businesses in the European Union ......................................................................... 32 Australian majority owned businesses in New Zealand ..................................................................................... 33 Australian majority owned businesses in the United States ............................................................................. 34 Conclusion ............................................................................................................................................................ 36 More information ................................................................................................................................................ 37
SECTION 1: AUSTRALIA’S INTERNATIONAL INVESTMENT POSITION – DEFINITIONS AND CONCEPTS 39
Australia’s international investment position .................................................................................................... 40 What is direct investment? ................................................................................................................................. 43 What other forms of foreign investment are there? ......................................................................................... 44 How are Australia’s foreign investment statistics compiled?............................................................................ 45 Third party countries and investment centres ................................................................................................... 46
SECTION 2: AUSTRALIA’S INTERNATIONAL INVESTMENT POSITION – SUMMARY TABLES 47
Table 1: Australia’s investment flows, stocks and income ............................................................................... 48 Table 2: Australia’s international investment position ..................................................................................... 50 Table 3: Gross injections and withdrawals of net inflows of foreign direct investment in Australia
by selected countries ........................................................................................................................... 51 Table 4: Gross injections and withdrawals of net outflows of Australian direct investment abroad
by selected countries ........................................................................................................................... 53 Table 5: Top 10 sources – Foreign investment in Australia – total stocks ....................................................... 55 Table 6: Top 10 destinations – Australian investment abroad – total stocks .................................................. 55 Table 7: Top 10 sources – Foreign investment in Australia – direct stocks ..................................................... 56 Table 8: Top 10 destinations – Australian investment abroad – direct stocks ................................................ 56 Table 9: Australia’s international investment with the world as a ratio to GDP ............................................. 57 Table 10: Australia’s investment flows – domestic versus foreign .................................................................. 57 Table 11: Foreign ownership of Australian equity ............................................................................................ 57 Table 12: Foreign ownership of Australian businesses by industry by employment size, 2016 .................... 58
SECTION 3: INTERNATIONAL INVESTMENT COMPARISONS 59
Table 13: Australia’s rank in world foreign direct investment (US$ million) ................................................... 61 Table 14: Top 20 world economies – direct inwards investment – net inflows (US$ billion) ......................... 62 Table 15: Top 20 world economies – direct inwards investment – stocks (US$ billion) ................................. 63 Table 16: Top 20 world economies – direct outwards investment – net outflows (US$ billion) ................... 64 Table 17: Top 20 world economies – direct outwards investment – stocks (US$ billion) .............................. 65 Table 18: Top 20 world economies – direct inwards investment – stocks (per cent of GDP) ........................ 66 Table 19: Top 20 world economies – direct outwards investment – stocks (per cent of GDP) ..................... 67
SECTION 4: AUSTRALIA’S INTERNATIONAL INVESTMENT – DETAILED TABLES 69
Table 20.1: Australia’s two-way investment relationship – stocks – by selected countries and regions ...... 71 Table 20.2: Foreign investment in Australia – net inflows – by selected countries and regions ................... 72 Table 20.3: Foreign investment in Australia – stocks – by selected countries and regions............................ 73 Table 20.4: Australian investment abroad – net outflows – by selected countries and regions ................... 74
Page 3
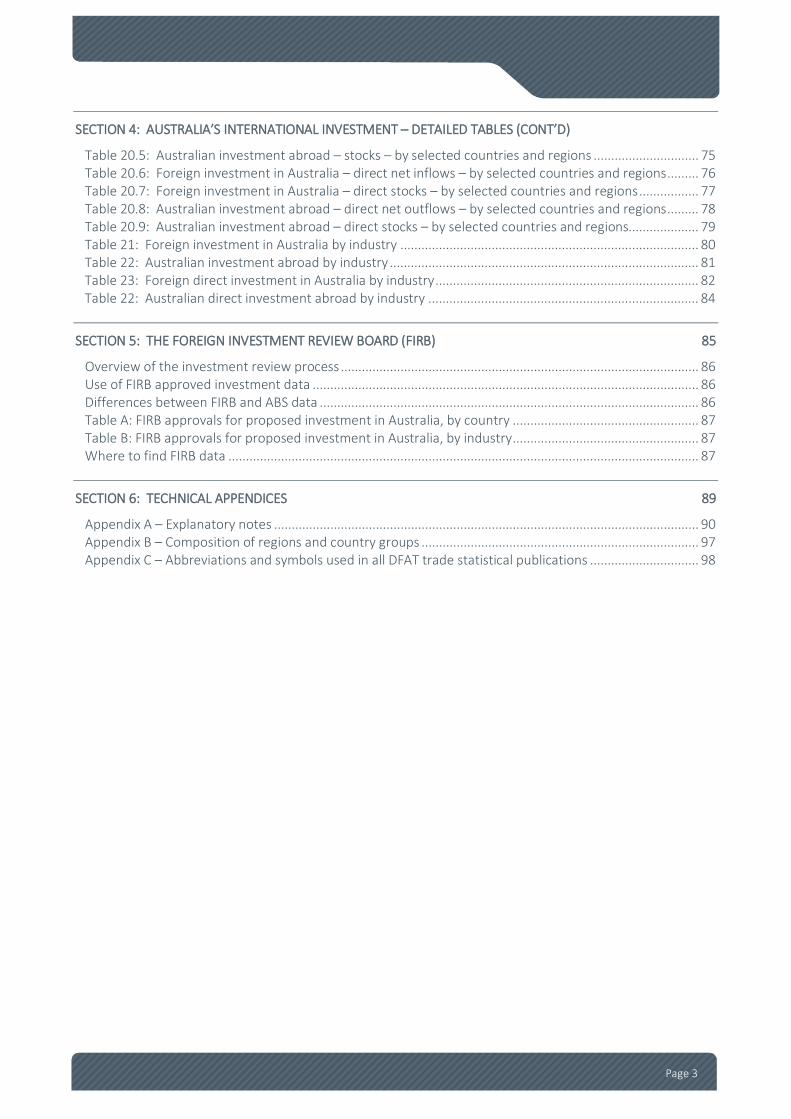
SECTION 4: AUSTRALIA’S INTERNATIONAL INVESTMENT – DETAILED TABLES (CONT’D)
Table 20.5: Australian investment abroad – stocks – by selected countries and regions .............................. 75 Table 20.6: Foreign investment in Australia – direct net inflows – by selected countries and regions ......... 76 Table 20.7: Foreign investment in Australia – direct stocks – by selected countries and regions ................. 77 Table 20.8: Australian investment abroad – direct net outflows – by selected countries and regions ......... 78 Table 20.9: Australian investment abroad – direct stocks – by selected countries and regions.................... 79 Table 21: Foreign investment in Australia by industry ..................................................................................... 80 Table 22: Australian investment abroad by industry ........................................................................................ 81 Table 23: Foreign direct investment in Australia by industry ........................................................................... 82 Table 22: Australian direct investment abroad by industry ............................................................................. 84
SECTION 5: THE FOREIGN INVESTMENT REVIEW BOARD (FIRB) 85
Overview of the investment review process ...................................................................................................... 86 Use of FIRB approved investment data .............................................................................................................. 86 Differences between FIRB and ABS data ............................................................................................................ 86 Table A: FIRB approvals for proposed investment in Australia, by country ..................................................... 87 Table B: FIRB approvals for proposed investment in Australia, by industry ..................................................... 87 Where to find FIRB data ...................................................................................................................................... 87
SECTION 6: TECHNICAL APPENDICES 89
Appendix A – Explanatory notes ......................................................................................................................... 90 Appendix B – Composition of regions and country groups ............................................................................... 97 Appendix C – Abbreviations and symbols used in all DFAT trade statistical publications ............................... 98

Page 4
INTRODUCTION
Welcome to the statistical publication International Investment Australia 2016. This publication provides a detailed snapshot of the latest trends in Australia’s international investment position.
The Australian Bureau of Statistics (ABS) publishes official statistics on Australia’s international investment, compiled using international standards set out by the International Monetary Fund and the United Nations. The ABS publishes international investment statistics on a quarterly basis in the publication Balance of Payments and International Investment Position, Australia (catalogue 5302.0) and in more detail on a calendar year basis in the publication International Investment Position, Australia: Supplementary Statistics (catalogue 5352.0). Some additional detailed data is available upon request, although the amount of information (either published or unpublished) is limited.
Other data sources such as the Foreign Investment Review Board also publish international investment related data that can be used to provide some additional information on Australia’s investment relationship with the world. Users need to keep in mind that such statistics are generally not directly compatible with the ABS international investment statistics because they are not compiled within the framework established by international standards for balance of payments statistics.
Sections 1 & 5 – Information boxes on international investment statistics Section 1 includes a number of information boxes that provide easy to read information on the definitions and the concepts used to compile and interpret ABS international investment statistics.
Section 5 provides an information box covering the definitions and concepts used by the Foreign Investment Review Board (FIRB) in collecting Australia’s international investment approvals statistics. Section 5 also contains a summary of the foreign investment approvals statistics collected by the FIRB.
It is highly recommended that if you are a new user of international investment statistics that you first read these information boxes as they will help you use these different statistics appropriately.
Sections 2 & 4 – ABS statistics on international investment Sections 2 and 4 provide the detailed official statistics on Australia’s international investment. Most tables include the latest periods, usually three to five years as well as period snapshots of the data ten years ago. Also included are data on selected investment ratios and foreign ownership statistics.
Section 3 – International investment comparisons Section 3 presents foreign direct investment statistics for the world as published by the United Nations Conference on Trade and Development (UNCTAD). This section compares Australia’s foreign direct investment trends with other countries.

Page 5
CAUTION NOTE
Impact on Australian FDI data reported on asset/liability vs a directional basis The Australian Bureau of Statistics (ABS) compiles foreign direct investment (FDI) statistics on two bases. The first is an asset/liability basis (the primary presentation for balance of payment statistics as set out by the International Monetary Fund) which is used to compile Australia’s balance of payments and international investment position. Under this basis all transactions are classified as either a foreign asset or liability according to accounting standards.
However, the reporting of FDI statistics has an alternative approach called the directional principle basis. The directional principle nets off transactions between related enterprises to look through internal financial arrangements – i.e. certain transactions between related enterprises are recorded as a negative asset or liability (or reverse investment). Direct transactions are then classified as either Australian investment abroad (AIA) or foreign investment in Australia (FIA). This basis is used by the ABS for the compilation of its annual international investment statistics.
For example, in the diagram below, an overseas parent company (Company A) has an equity investment of $100 million in its 100 per cent owned Australian subsidiary (Company B). The Australian subsidiary has also lent its parent company $40 million. Both transactions would be classed as direct investment as the parent company (A) owns at least 10 per cent or more of the equity in the subsidiary company (B).
Under the asset/liability approach this direct investment would be treated in Australia’s international investment statistics as a direct foreign liability of $100 million and a direct foreign asset of $40 million.
Overseas
Australia$100m
$40m (equity)(loan)
Company A(Parent)
Company B(Subsidiary)

Page 6
However, under the directional principle the loan of $40 million would be treated as reverse direct investment (i.e. a negative liability) not as an asset. FIA would be valued at $60 million ($100 million minus $40 million), while no transaction would be recorded for AIA. The net investment position (liabilities minus assets or FIA minus AIA) is unaffected under both measures at $60 million.
Both compilation methods are statistically correct. Which measure is more appropriate depends on how the user wants to view Australia’s international investment relationship. The assets/liabilities measure is appropriate when the statistics are used in the context of Balance of Payments. The Balance of Payments is an accounting measure that records entries as assets or liabilities. The quarterly flows of assets and liabilities are presented in the Financial Account of the Balance of Payments.
To view the international investment relationship on a basis where internal company investment relationships are maintained on one side of the ledger, the directional approach is appropriate. Australia’s bilateral international investment statistics are available only on a directional investment basis.
Note that it is not possible to compile a complete set of international investment statistics using just one basis only for Australia (due to suppression of some of the component series by the ABS because of confidentiality). Therefore, in this publication for simplicity purposes, all tables are labelled FIA or AIA with footnotes to indicate which are on an asset/liability basis. Normally the two measures are very similar for Australia as there is minimal reverse direct investment.
For 2016, the table below shows the differences between the two measures.
Direct investment in 2016 – A$ billion
Asset/liability approach Net flows Stocks
Liabilities 56.5 851.7
Assets -0.3 610.5
Net position 56.7 241.2
Directional principle Net flows Stocks
Liabilities 64.8 796.1
Assets 8.1 554.9
Net position 56.7 241.2

Page 7
KEY POINTS, 2016
Total investment • Net inflows of foreign investment in Australia (FIA) recorded a net withdrawal of $26.0 billion in 2016.
The value of the stock of FIA was $3.2 trillion in 2016, an increase of 5.0 per cent from 2015.
• The largest sources for the stock of FIA in 2016 were the United States (valued at $860.9 billion), followed by the United Kingdom (valued at $515.5 billion), Belgium (valued at $270.1 billion), Japan (valued at $213.5 billion) and Hong Kong (SAR of China) (valued at $100.9 billion).
• Investment from China was valued at $87.2 billion (ranked 7th), while investment from India was valued at $13.5 billion (ranked 21st).
• Net outflows of Australian investment abroad (AIA) recorded a net withdrawal of $70.9 billion in 2016. The value of the stock of AIA was $2.2 trillion in 2016, an increase of 4.4 per cent from 2015.
• The largest destinations for the stock of AIA in 2016 were the United States (valued at $617.4 billion), followed by the United Kingdom (valued at $350.5 billion), Japan (valued at $108.3 billion) and New Zealand (valued at $106.9 billion).
• Foreign net flows (net inflows minus net outflows) accounted for 10.6 per cent of Australia’s total investment requirements during 2016.
Direct investment • Net inflows of direct FIA were valued at $64.8 billion in 2016. The quantum of new direct investment
(gross inflows of new direct investment) was valued at $112.4 billion. The largest sources for new direct investment flows were the European Union ($30.4 billion), the United States ($27.9 billion) and Japan ($17.2 billion) and. See Box A – Quantum of new foreign direct investment in Australia, 2016.
• In 2016, the stock of direct FIA was valued at $796.1 billion, an increase of $62.5 billion or 8.5 per cent from 2015.
Foreign direct investment in Australia by partner - Stocks
Based on ABS catalogue 5352.0.
United States24.5%
United Kingdom
8.5%
Other EU12.2%Japan
11.4%
China5.3%
Canada3.6%
Bermuda2.9%
ASEAN5.5%
Other26.1%

Page 8
• The largest sources for the stock of direct FIA in 2016 were the United States (valued at $195.0 billion), followed by Japan (valued at $90.9 billion) and the United Kingdom (valued at $67.9 billion).
• The Mining industry accounted for the largest share of the stock of direct FIA valued at $310.6 billion (or 39.0 per cent), followed by the Manufacturing industry valued at $91.3 billion (or 11.5 per cent) and the Real estate industry valued at $84.1 billion (or 10.6 per cent).
• Net outflows of direct AIA were valued at $8.1 billion in 2016. The stock of direct AIA was valued at $554.9 billion, an increase of $20.7 billion or 3.9 per cent from 2015.
• In 2016, the largest destinations for the stock of direct AIA were the United States (valued at $118.9 billion), followed by the United Kingdom (valued at $73.2 billion) and New Zealand (valued at $66.6 billion).
• The Financial & insurance services industry accounted for the largest share of the stock of direct AIA valued at $170.6 billion (or 30.7 per cent), followed by the Manufacturing industry valued at $96.6 billion (or 17.4 per cent) and the Mining industry valued at $92.1 billion (or 16.6 per cent).
Foreign direct investment in Australia by industry - Stocks
Based on ABS catalogue 5352.0.
Global direct investment • The global stock of inwards world foreign direct investment was valued at US$26.7 trillion in 2016, up
6.1 per cent over 2015 levels. Net inflows of global direct investment were valued at US$1.7 trillion in 2016 with Australia accounting for 2.8 per cent of these net inflows.
• Australia ranked1 as the 14th largest destination country for world direct investment in 2016 and the 17th largest source country for world direct investment.
1 Country rankings include countries acting as financial intermediaries.
Mining39.0%
Real estate activities
10.6%
Financial & insurance activities
8.4%
Other service
industries19.4%
Other11.1%
Manufacturing11.5%

Page 9
BOX A – QUANTUM OF NEW FOREIGN DIRECT INVESTMENT IN AUSTRALIA, 2016
The quantum of new foreign direct investment into Australia in 2016 was valued at $112.4 billion2. This was down $19.1 billion (or 14.5 per cent) on the $131.6 billion invested into Australia in 2015. Over the past five years there has been $638.1 billion in new direct investment flows injected into Australia.
Quantum of new foreign direct investment in Australia by selected countries (a) (A$ million)
% change $ change
2015 to 2015 to
2012 2013 2014 2015 2016 2016 2016
Canada 3,180 2,185 6,390 3,383 1,402 -58.6 -1,981 China (b) 3,549 6,164 11,846 6,437 5,140 -20.1 -1,297 France (b) 1,212 np 563 np 1,904 .. .. Germany (b) 1,756 2,826 2,772 3,133 2,589 -17.3 -543
Hong Kong (SAR of China) (b) 1,227 1,765 5,315 4,075 1,928 -52.7 -2,146 India np np np np np .. .. Japan 20,402 12,080 11,134 18,204 17,153 -5.8 -1,052 Malaysia (b) np np np 1,231 311 .. ..
Netherlands 3,003 2,602 10,445 9,741 5,166 .. .. New Zealand (b) np 817 np 879 2,929 233.3 2,050 Republic of Korea (b) 264 623 452 np 204 .. .. Singapore (b) 14,511 13,297 31,746 22,350 5,314 -76.2 -17,035 Switzerland 3,522 3,055 992 7,828 1,523 -80.5 -6,305 Thailand (b) np 780 np 126 224 .. .. United Kingdom 9,070 12,374 13,131 1,957 13,378 583.7 11,421 United States 33,590 39,203 23,232 37,920 27,903 -26.4 -10,017
ASEAN 17,704 16,047 33,222 23,711 5,715 -75.9 -17,996 European Union 18,588 21,252 29,946 19,089 30,370 59.1 11,281
Total 114,240 122,171 157,733 131,550 112,439 -14.5 -19,110
(a) Injections of foreign direct investment plus reinvested earnings. (b) Excludes reinvested earnings which were not published by the ABS for those cells that are shaded orange.
Based on unpublished ABS data.
The quantum of new direct investment in 2016 was made up of $96.4 billion in gross inflows (or injections) of foreign direct investment into Australia from companies (or individuals) located overseas and $16.1 billion in reinvested earnings from existing direct investment in Australia.
2 Note that the quantum of new direct investment is the sum of the gross inflows (injections) of foreign direct investment into Australia over the year plus any reinvested earnings for the same period. Reinvested earnings in Australia are treated as new direct investment as the foreign investor in Australia has made a decision to increase the amount of its foreign investment in Australia rather than repatriate the profits to its parent company abroad. Note that some of the new gross inflows of foreign direct investment may be replacing existing foreign investment in Australia, for example if a foreign investor takes over a company in Australia that is already foreign owned.
Page 10
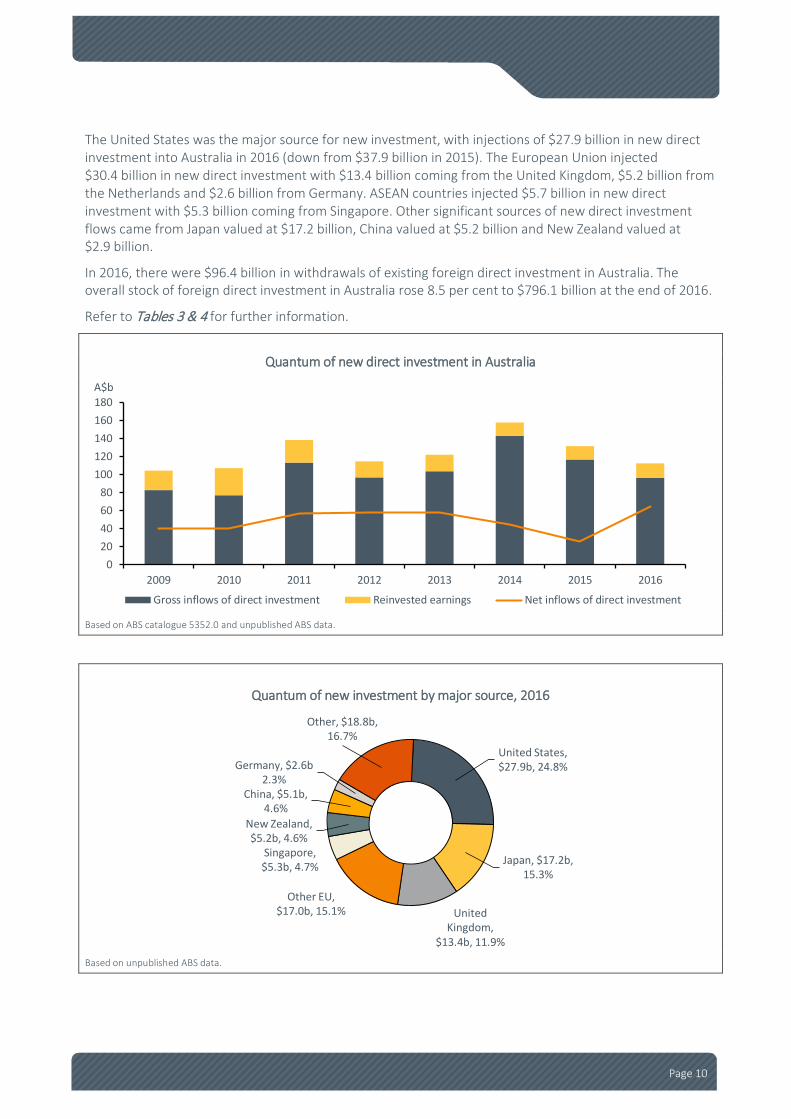
The United States was the major source for new investment, with injections of $27.9 billion in new direct investment into Australia in 2016 (down from $37.9 billion in 2015). The European Union injected $30.4 billion in new direct investment with $13.4 billion coming from the United Kingdom, $5.2 billion from the Netherlands and $2.6 billion from Germany. ASEAN countries injected $5.7 billion in new direct investment with $5.3 billion coming from Singapore. Other significant sources of new direct investment flows came from Japan valued at $17.2 billion, China valued at $5.2 billion and New Zealand valued at $2.9 billion.
In 2016, there were $96.4 billion in withdrawals of existing foreign direct investment in Australia. The overall stock of foreign direct investment in Australia rose 8.5 per cent to $796.1 billion at the end of 2016.
Refer to Tables 3 & 4 for further information.
Quantum of new direct investment in Australia
Based on ABS catalogue 5352.0 and unpublished ABS data.
Quantum of new investment by major source, 2016
Based on unpublished ABS data.
020406080
100120140160180
2009 2010 2011 2012 2013 2014 2015 2016
A$b
Gross inflows of direct investment Reinvested earnings Net inflows of direct investment
United States, $27.9b, 24.8%
Japan, $17.2b, 15.3%
United Kingdom,
$13.4b, 11.9%
Other EU, $17.0b, 15.1%
Singapore, $5.3b, 4.7%
New Zealand, $5.2b, 4.6%
China, $5.1b, 4.6%
Germany, $2.6b 2.3%
Other, $18.8b, 16.7%
Page 11
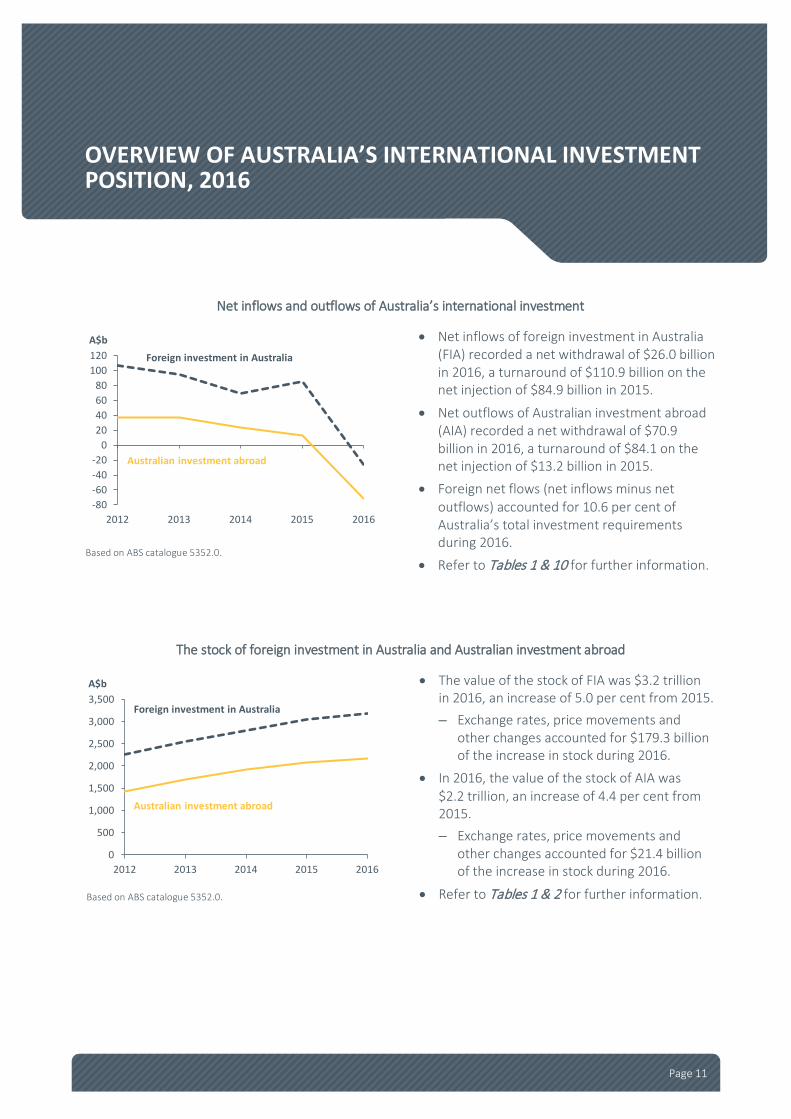
OVERVIEW OF AUSTRALIA’S INTERNATIONAL INVESTMENT POSITION, 2016
Net inflows and outflows of Australia’s international investment
Based on ABS catalogue 5352.0.
• Net inflows of foreign investment in Australia (FIA) recorded a net withdrawal of $26.0 billion in 2016, a turnaround of $110.9 billion on the net injection of $84.9 billion in 2015.
• Net outflows of Australian investment abroad (AIA) recorded a net withdrawal of $70.9 billion in 2016, a turnaround of $84.1 on the net injection of $13.2 billion in 2015.
• Foreign net flows (net inflows minus net outflows) accounted for 10.6 per cent of Australia’s total investment requirements during 2016.
• Refer to Tables 1 & 10 for further information.
The stock of foreign investment in Australia and Australian investment abroad
Based on ABS catalogue 5352.0.
• The value of the stock of FIA was $3.2 trillion in 2016, an increase of 5.0 per cent from 2015. – Exchange rates, price movements and
other changes accounted for $179.3 billion of the increase in stock during 2016.
• In 2016, the value of the stock of AIA was $2.2 trillion, an increase of 4.4 per cent from 2015. – Exchange rates, price movements and
other changes accounted for $21.4 billion of the increase in stock during 2016.
• Refer to Tables 1 & 2 for further information.
-80-60-40-20
020406080
100120
2012 2013 2014 2015 2016
A$bForeign investment in Australia
Australian investment abroad
0
500
1,000
1,500
2,000
2,500
3,000
3,500
2012 2013 2014 2015 2016
A$b
Foreign investment in Australia
Australian investment abroad

Page 12
Australia’s net international investment position
Based on ABS catalogue 5352.0.
• Australia’s net international investment position (IIP) was $1.0 trillion in 2016, an increase of 6.3 per cent on 2015. – Australia’s net foreign debt liabilities were
$1.0 trillion, up 0.1 per cent on 2015. – Australia’s net foreign equity assets were
$1.4 billion, down 97.6 per cent on 2015.
• Australia’s net IIP accounted for 60.4 per cent of Gross Domestic Product (GDP) in 2016.
• Refer to Tables 1 & 9 for further information.
Income flows on Australia’s international investment
Based on ABS catalogue 5352.0.
• Total income payable on FIA was $83.3 billion in 2016, up 0.7 per cent on 2015.
• Total income earned on AIA was $58.9 billion in 2016, up 24.6 per cent on 2015 and above the pre-Global Financial Crisis levels of $49.5 billion recorded in 2008.
• Refer to Table 1 for further information.
Direct investment net flows
Based on ABS catalogue 5352.0.
• Net inflows of direct FIA were valued at $64.8 billion in 2016, an increase of $38.9 billion or 150.0 per cent from 2015. – Gross inflows (injections) including
reinvested earnings of direct FIA were valued at $112.4 billion in 2016, while gross outflows (withdrawals) of direct FIA were valued at $47.6 billion – refer to Box A for more details.
• Net outflows of direct AIA were valued at $8.1 billion in 2016, a turnaround of $30.3 billion on the net withdrawal of $22.2 billion in 2015.
• Refer to Tables 1, 3 & 4 for further information.
-200
0
200
400
600
800
1,000
1,200
2012 2013 2014 2015 2016
A$b
Net internationalinvestment position
Net foreign debt
Net foreign equity
0
20
40
60
80
100
2012 2013 2014 2015 2016
A$b
Total investment income paid
Total investment income earned
-30-20-10
010203040506070
2012 2013 2014 2015 2016
A$b
Direct foreign investmentin Australia
Australian direct investmentabroad
Page 13
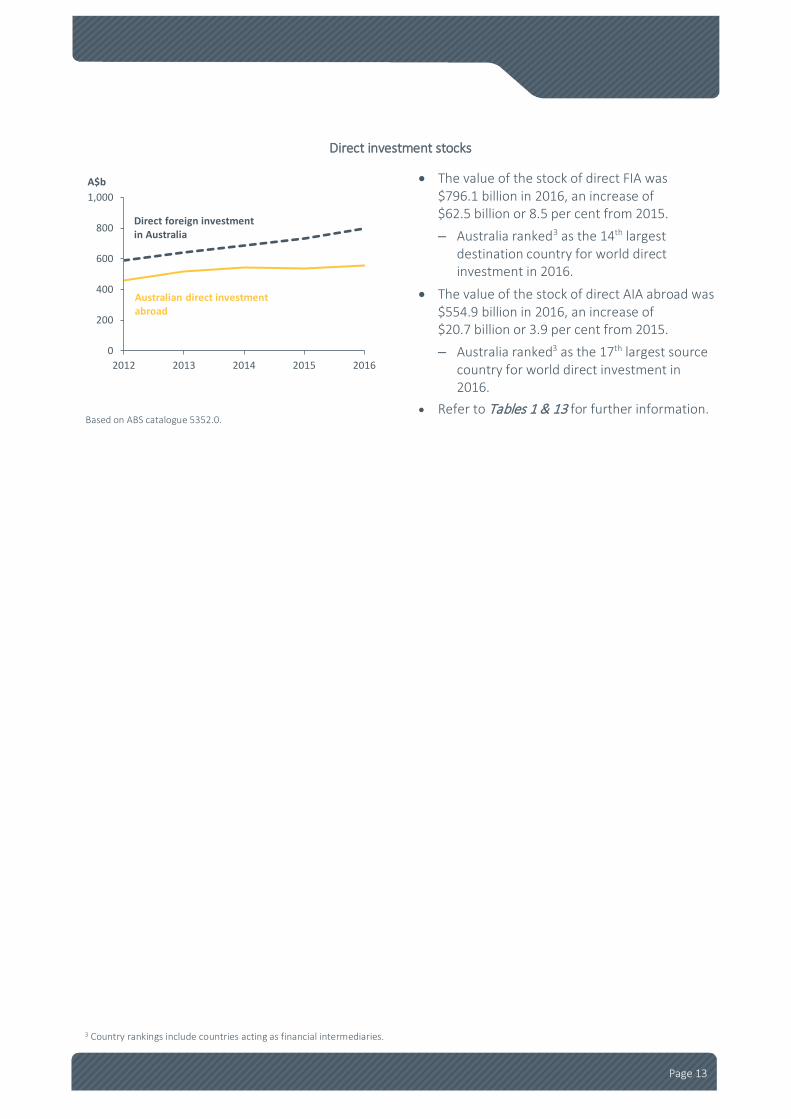
Direct investment stocks
Based on ABS catalogue 5352.0.
• The value of the stock of direct FIA was $796.1 billion in 2016, an increase of $62.5 billion or 8.5 per cent from 2015. – Australia ranked3 as the 14th largest
destination country for world direct investment in 2016.
• The value of the stock of direct AIA abroad was $554.9 billion in 2016, an increase of $20.7 billion or 3.9 per cent from 2015. – Australia ranked3 as the 17th largest source
country for world direct investment in 2016.
• Refer to Tables 1 & 13 for further information.
3 Country rankings include countries acting as financial intermediaries.
0
200
400
600
800
1,000
2012 2013 2014 2015 2016
A$b
Direct foreign investmentin Australia
Australian direct investmentabroad
Page 14
AUSTRALIAN INTERNATIONAL INVESTMENT STOCKS AT THE END OF 2016
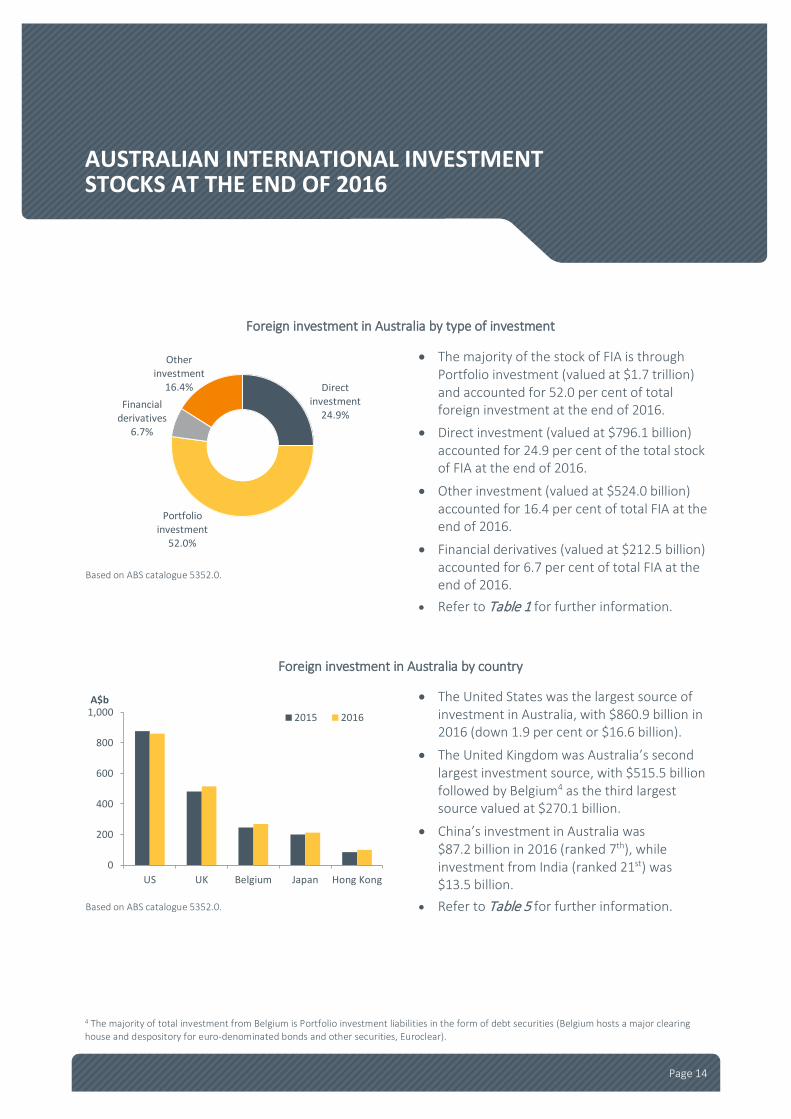
Foreign investment in Australia by type of investment
Based on ABS catalogue 5352.0.
• The majority of the stock of FIA is through Portfolio investment (valued at $1.7 trillion) and accounted for 52.0 per cent of total foreign investment at the end of 2016.
• Direct investment (valued at $796.1 billion) accounted for 24.9 per cent of the total stock of FIA at the end of 2016.
• Other investment (valued at $524.0 billion) accounted for 16.4 per cent of total FIA at the end of 2016.
• Financial derivatives (valued at $212.5 billion) accounted for 6.7 per cent of total FIA at the end of 2016.
• Refer to Table 1 for further information.
Foreign investment in Australia by country
Based on ABS catalogue 5352.0.
• The United States was the largest source of investment in Australia, with $860.9 billion in 2016 (down 1.9 per cent or $16.6 billion).
• The United Kingdom was Australia’s second largest investment source, with $515.5 billion followed by Belgium4 as the third largest source valued at $270.1 billion.
• China’s investment in Australia was $87.2 billion in 2016 (ranked 7th), while investment from India (ranked 21st) was $13.5 billion.
• Refer to Table 5 for further information.
4 The majority of total investment from Belgium is Portfolio investment liabilities in the form of debt securities (Belgium hosts a major clearing house and despository for euro-denominated bonds and other securities, Euroclear).
Direct investment
24.9%
Portfolio investment
52.0%
Financial derivatives
6.7%
Other investment
16.4%
0
200
400
600
800
1,000
US UK Belgium Japan Hong Kong
A$b
2015 2016
Page 15
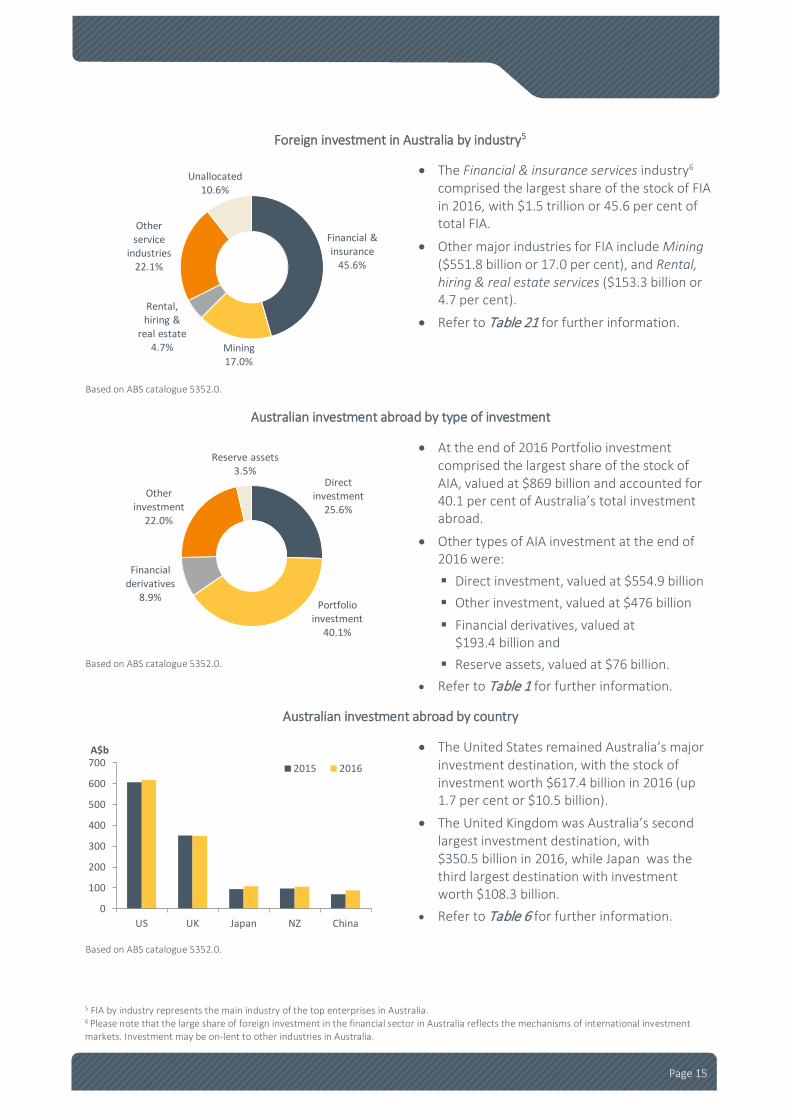
Foreign investment in Australia by industry5
Based on ABS catalogue 5352.0.
• The Financial & insurance services industry6 comprised the largest share of the stock of FIA in 2016, with $1.5 trillion or 45.6 per cent of total FIA.
• Other major industries for FIA include Mining ($551.8 billion or 17.0 per cent), and Rental, hiring & real estate services ($153.3 billion or 4.7 per cent).
• Refer to Table 21 for further information.
Australian investment abroad by type of investment
Based on ABS catalogue 5352.0.
• At the end of 2016 Portfolio investment comprised the largest share of the stock of AIA, valued at $869 billion and accounted for 40.1 per cent of Australia’s total investment abroad.
• Other types of AIA investment at the end of 2016 were: Direct investment, valued at $554.9 billion Other investment, valued at $476 billion Financial derivatives, valued at
$193.4 billion and Reserve assets, valued at $76 billion.
• Refer to Table 1 for further information.
Australian investment abroad by country
Based on ABS catalogue 5352.0.
• The United States remained Australia’s major investment destination, with the stock of investment worth $617.4 billion in 2016 (up 1.7 per cent or $10.5 billion).
• The United Kingdom was Australia’s second largest investment destination, with $350.5 billion in 2016, while Japan was the third largest destination with investment worth $108.3 billion.
• Refer to Table 6 for further information.
5 FIA by industry represents the main industry of the top enterprises in Australia. 6 Please note that the large share of foreign investment in the financial sector in Australia reflects the mechanisms of international investment markets. Investment may be on-lent to other industries in Australia.
Financial & insurance
45.6%
Mining17.0%
Rental, hiring &
real estate4.7%
Other service
industries22.1%
Unallocated10.6%
Direct investment
25.6%
Portfolio investment
40.1%
Financial derivatives
8.9%
Other investment
22.0%
Reserve assets3.5%
0
100
200
300
400
500
600
700
US UK Japan NZ China
A$b
2015 2016

Page 16
Australian investment abroad by industry7
Based on ABS catalogue 5352.0.
• The Financial & insurance services industry comprised the largest share of Australia’s stock of investment abroad in 2016, with $1.6 trillion or 69.9 per cent of Australia’s total investment abroad.
• Other major industries for AIA include Mining ($143.7 billion or 6.5 per cent), and Manufacturing ($107.1 billion or 4.8 per cent).
• Refer to Table 22 for further information.
7 AIA by industry represents the main industry of the company operations in Australia, not the industry of the affiliate abroad.
Financial & insurance
69.9%
Mining6.5%
Other service
industries8.9%
Manufacturing4.8%
Unallocated10.0%

Page 17
DID YOU KNOW .....
When looking at foreign equity investment in Australia most people look at foreign direct investment data. Foreign Direct Investment (FDI) in Australia is when an individual or entity from outside Australia establishes a new business or acquires 10 per cent or more of an Australian enterprise, and so has some control over its operations. Strictly speaking, it is the equity capital and reinvested earnings component of FDI which gives the equity component of FDI in Australia (around three-quarters of FDI), with ‘other capital’ which includes, for example, loans from the parent company of foreign subsidiaries in Australia, making up the remaining quarter. Common examples of FDI equity include the establishment of Australian branches and subsidiaries of multinational companies or joint ventures between Australian and foreign companies. In 2016, equity capital and reinvested earnings amounted to $583 billion (with total FDI amounting to $796 billion).
However non-controlling equity, which does not offer the foreign investor any influence over the operation of the enterprises, is also an important source of foreign equity funding in Australia. This type of equity typically involves the purchase of shares (less than 10 per cent) in Australian companies. This is classified as portfolio investment liabilities, equity securities. In 2016 equity securities amounted to $526 billion – only slightly less than the amount as FDI equity. Total portfolio investment was $1.7 trillion.
So it’s important to remember that equity investment by foreign investors in Australia appears in portfolio investment data, as well as foreign direct investment (FDI) data.
Page 18
AUSTRALIAN DIRECT INTERNATIONAL INVESTMENT STOCKS AT THE END OF 2016
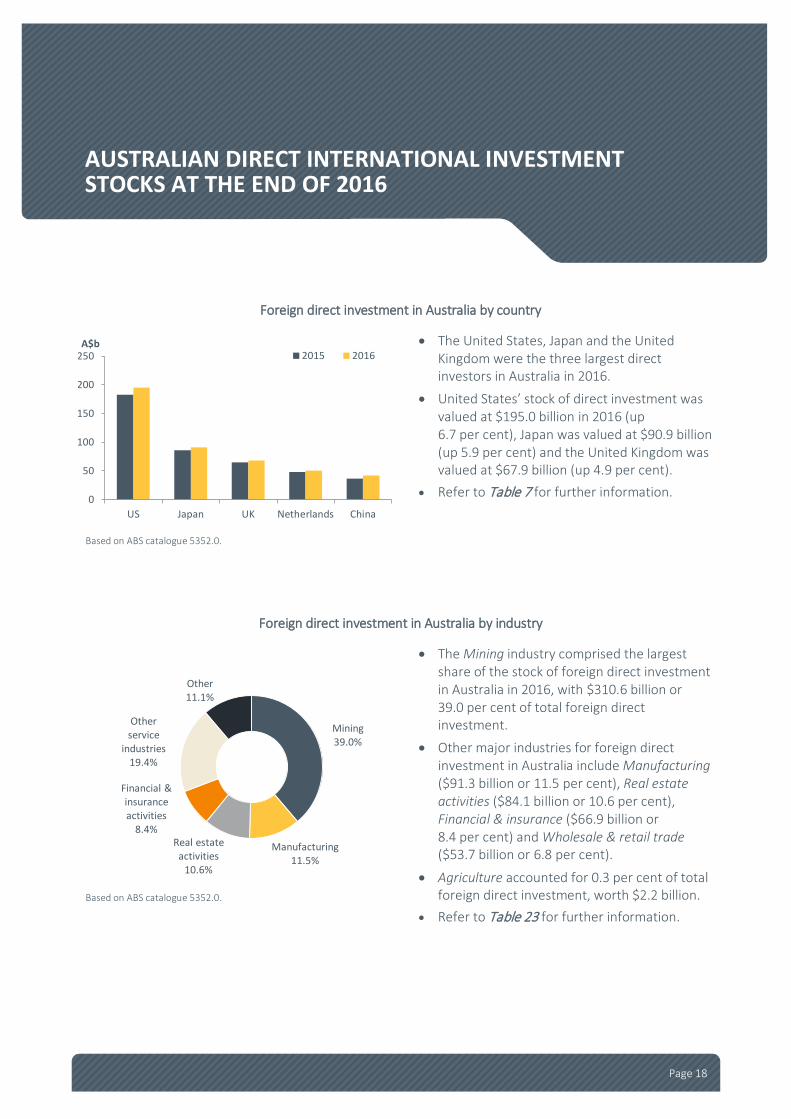
Foreign direct investment in Australia by country
Based on ABS catalogue 5352.0.
• The United States, Japan and the United Kingdom were the three largest direct investors in Australia in 2016.
• United States’ stock of direct investment was valued at $195.0 billion in 2016 (up 6.7 per cent), Japan was valued at $90.9 billion (up 5.9 per cent) and the United Kingdom was valued at $67.9 billion (up 4.9 per cent).
• Refer to Table 7 for further information.
Foreign direct investment in Australia by industry
Based on ABS catalogue 5352.0.
• The Mining industry comprised the largest share of the stock of foreign direct investment in Australia in 2016, with $310.6 billion or 39.0 per cent of total foreign direct investment.
• Other major industries for foreign direct investment in Australia include Manufacturing ($91.3 billion or 11.5 per cent), Real estate activities ($84.1 billion or 10.6 per cent), Financial & insurance ($66.9 billion or 8.4 per cent) and Wholesale & retail trade ($53.7 billion or 6.8 per cent).
• Agriculture accounted for 0.3 per cent of total foreign direct investment, worth $2.2 billion.
• Refer to Table 23 for further information.
0
50
100
150
200
250
US Japan UK Netherlands China
A$b2015 2016
Mining39.0%
Real estate activities
10.6%
Financial & insurance activities
8.4%
Other service
industries19.4%
Other11.1%
Manufacturing11.5%
Page 19
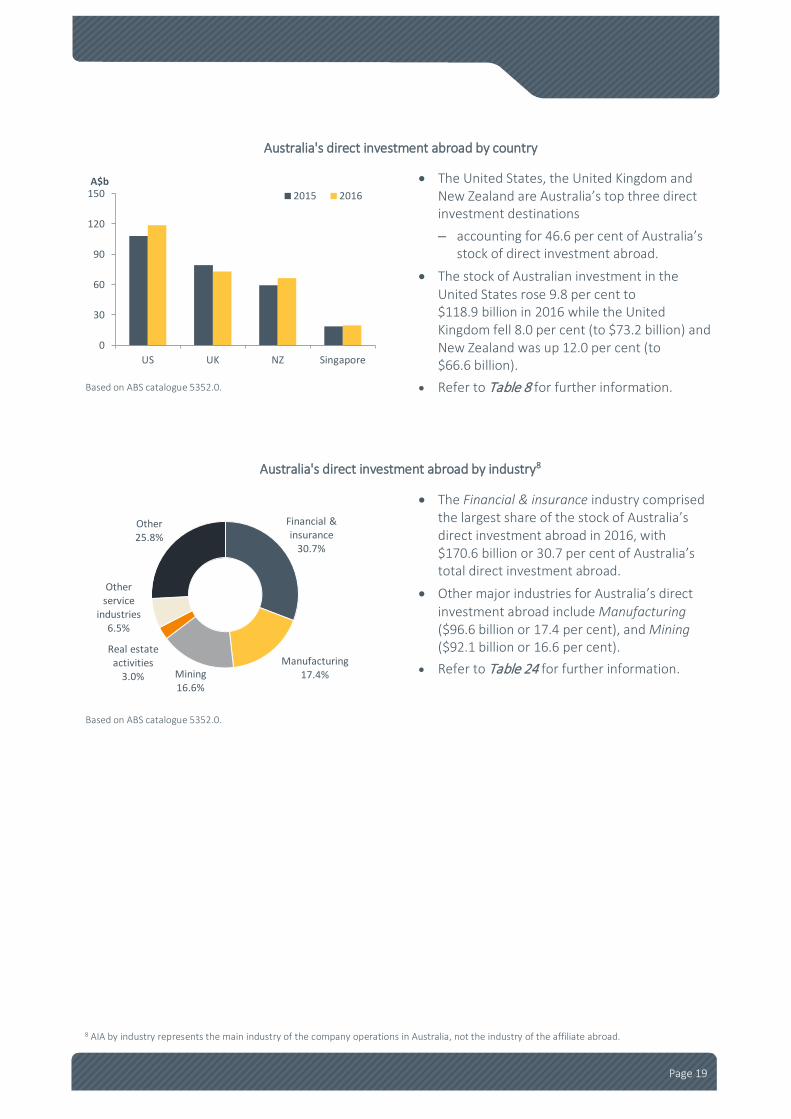
Australia's direct investment abroad by country
Based on ABS catalogue 5352.0.
• The United States, the United Kingdom and New Zealand are Australia’s top three direct investment destinations – accounting for 46.6 per cent of Australia’s
stock of direct investment abroad.
• The stock of Australian investment in the United States rose 9.8 per cent to $118.9 billion in 2016 while the United Kingdom fell 8.0 per cent (to $73.2 billion) and New Zealand was up 12.0 per cent (to $66.6 billion).
• Refer to Table 8 for further information.
Australia's direct investment abroad by industry8
Based on ABS catalogue 5352.0.
• The Financial & insurance industry comprised the largest share of the stock of Australia’s direct investment abroad in 2016, with $170.6 billion or 30.7 per cent of Australia’s total direct investment abroad.
• Other major industries for Australia’s direct investment abroad include Manufacturing ($96.6 billion or 17.4 per cent), and Mining ($92.1 billion or 16.6 per cent).
• Refer to Table 24 for further information.
8 AIA by industry represents the main industry of the company operations in Australia, not the industry of the affiliate abroad.
0
30
60
90
120
150
US UK NZ Singapore
A$b2015 2016
Financial & insurance
30.7%
Mining16.6%
Real estate activities
3.0%
Other service
industries6.5%
Other25.8%
Manufacturing17.4%
Page 20
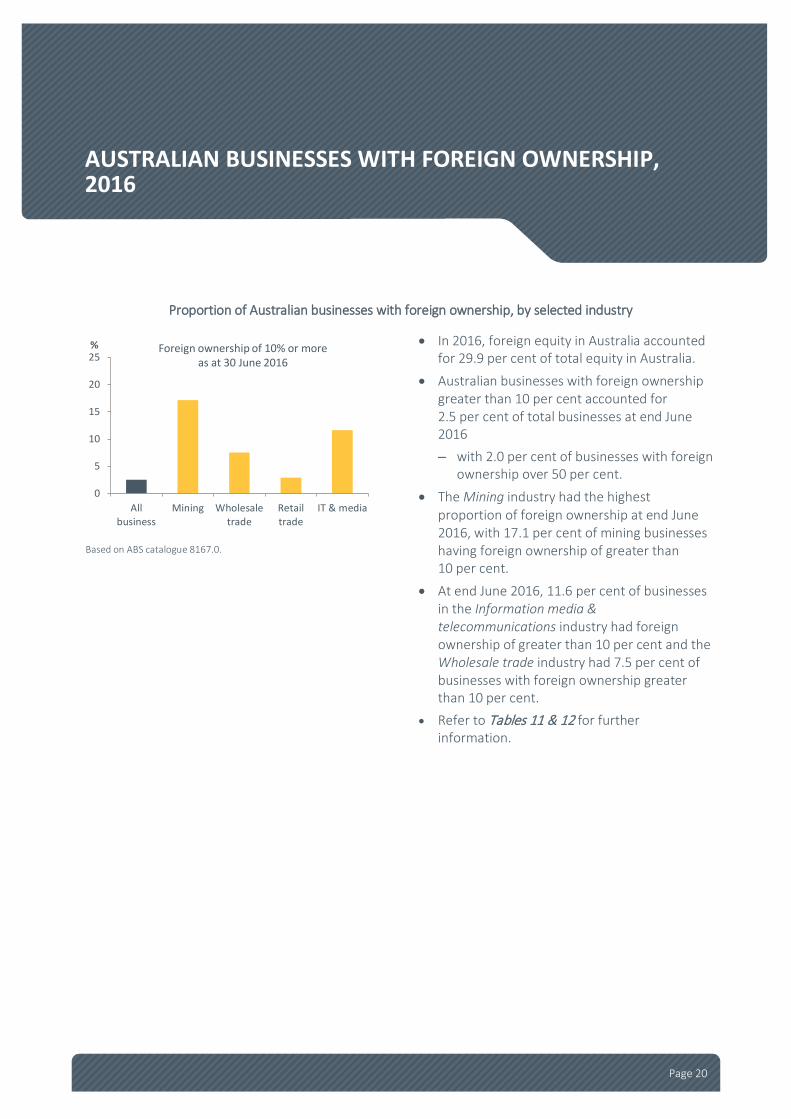
AUSTRALIAN BUSINESSES WITH FOREIGN OWNERSHIP, 2016
Proportion of Australian businesses with foreign ownership, by selected industry
Based on ABS catalogue 8167.0.
• In 2016, foreign equity in Australia accounted for 29.9 per cent of total equity in Australia.
• Australian businesses with foreign ownership greater than 10 per cent accounted for 2.5 per cent of total businesses at end June 2016 – with 2.0 per cent of businesses with foreign
ownership over 50 per cent.
• The Mining industry had the highest proportion of foreign ownership at end June 2016, with 17.1 per cent of mining businesses having foreign ownership of greater than 10 per cent.
• At end June 2016, 11.6 per cent of businesses in the Information media & telecommunications industry had foreign ownership of greater than 10 per cent and the Wholesale trade industry had 7.5 per cent of businesses with foreign ownership greater than 10 per cent.
• Refer to Tables 11 & 12 for further information.
0
5
10
15
20
25
Allbusiness
Mining Wholesaletrade
Retailtrade
IT & media
% Foreign ownership of 10% or moreas at 30 June 2016
Page 21
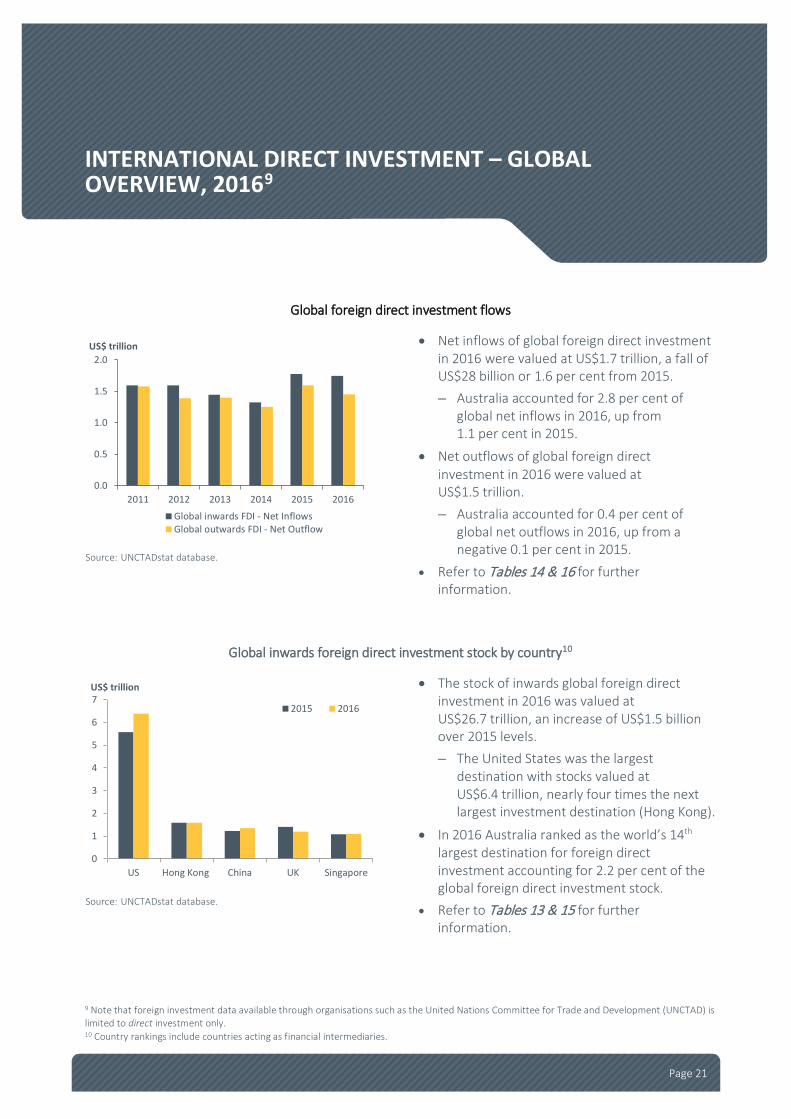
INTERNATIONAL DIRECT INVESTMENT – GLOBAL OVERVIEW, 20169
Global foreign direct investment flows
Source: UNCTADstat database.
• Net inflows of global foreign direct investment in 2016 were valued at US$1.7 trillion, a fall of US$28 billion or 1.6 per cent from 2015. – Australia accounted for 2.8 per cent of
global net inflows in 2016, up from 1.1 per cent in 2015.
• Net outflows of global foreign direct investment in 2016 were valued at US$1.5 trillion. – Australia accounted for 0.4 per cent of
global net outflows in 2016, up from a negative 0.1 per cent in 2015.
• Refer to Tables 14 & 16 for further information.
Global inwards foreign direct investment stock by country10
Source: UNCTADstat database.
• The stock of inwards global foreign direct investment in 2016 was valued at US$26.7 trillion, an increase of US$1.5 billion over 2015 levels. – The United States was the largest
destination with stocks valued at US$6.4 trillion, nearly four times the next largest investment destination (Hong Kong).
• In 2016 Australia ranked as the world’s 14th largest destination for foreign direct investment accounting for 2.2 per cent of the global foreign direct investment stock.
• Refer to Tables 13 & 15 for further information.
9 Note that foreign investment data available through organisations such as the United Nations Committee for Trade and Development (UNCTAD) is limited to direct investment only. 10 Country rankings include countries acting as financial intermediaries.
0.0
0.5
1.0
1.5
2.0
2011 2012 2013 2014 2015 2016
Global inwards FDI - Net InflowsGlobal outwards FDI - Net Outflow
US$ trillion
0
1
2
3
4
5
6
7
US Hong Kong China UK Singapore
US$ trillion
2015 2016

Page 22
Global outwards foreign direct investment stock by country11
Source: UNCTADstat database.
• The stock of outwards global foreign direct investment in 2016 was valued at US$26.2 trillion, an increase of US$1.2 billion over 2015 levels. – The United States was the largest investor
with stocks valued at US$6.4 trillion, quadruple the next largest investment source (Hong Kong).
• Australia ranked as the world’s 17th largest source of global foreign direct investment in 2016.
• Refer to Tables 13 & 17 for further information.
11 Country rankings include countries acting as financial intermediaries.
0
1
2
3
4
5
6
7
US Hong Kong UK Japan Germany
US$ trillion
2015 2016

Page 23
FOREIGN INVESTMENT REVIEW BOARD, 2015-16
FIRB approval statistics
Source: FIRB annual reports.
• Foreign investment Review Board (FIRB) data and ABS international investment data capture different aspects of foreign investment in Australia.
• FIRB data only captures proposed new investments (gross inflows) which fall above specified thresholds – FIRB data does not show actual flows or
stocks of FIA. • FIRB approved $247.9 billion of proposed
investment in 2015-16, up from $191.9 billion in 2014-15.
• Refer to Section 5 for further information.
FIRB approvals for proposed investment in Australia by country
Source: FIRB annual report.
• China had approved investment of $47.3 billion in 2015-16.
• The United States, Australia’s largest source of foreign investment in Australia, had $31.0 billion of approved investment in 2015-16. The Netherlands had approved investment of $16.5 billion, and Canada $15.7 billion.
• Refer to Section 5 for further information.
0
50
100
150
200
250
2011-12 2012-13 2013-14 2014-15 2015-16
A$b
0
10
20
30
40
50
China US Netherlands Canada
A$b 2015-16
Page 24
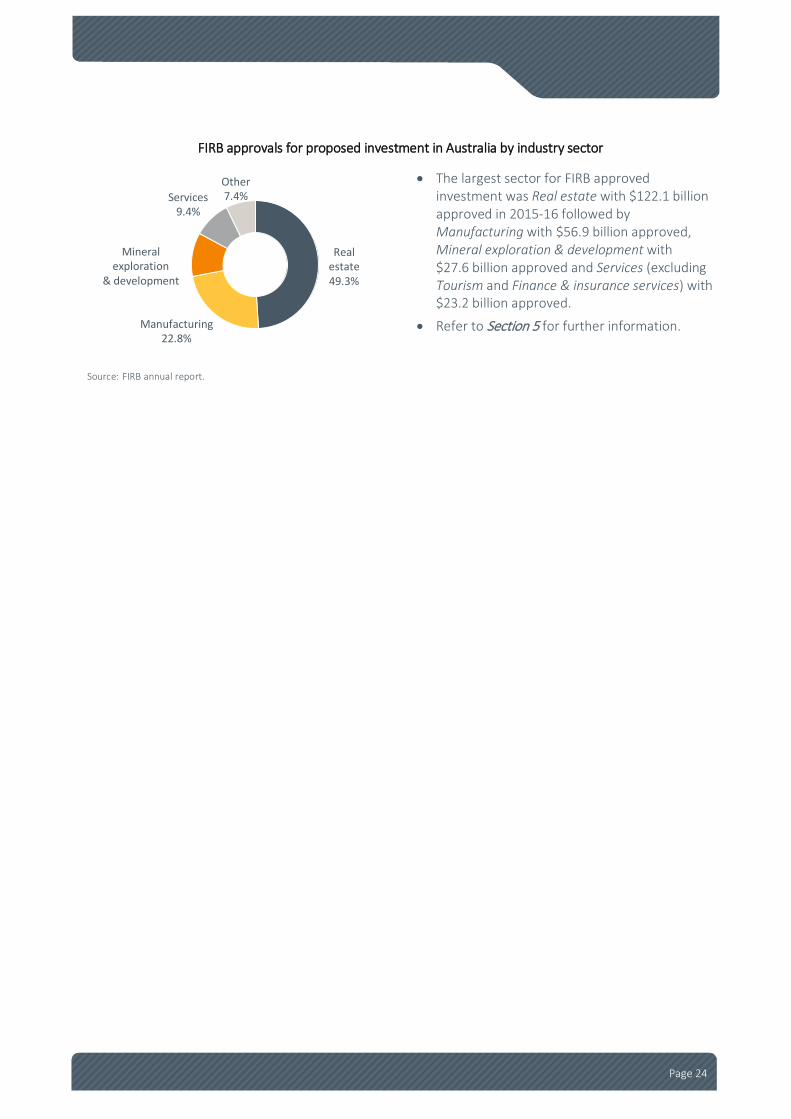
FIRB approvals for proposed investment in Australia by industry sector
Source: FIRB annual report.
• The largest sector for FIRB approved investment was Real estate with $122.1 billion approved in 2015-16 followed by Manufacturing with $56.9 billion approved, Mineral exploration & development with $27.6 billion approved and Services (excluding Tourism and Finance & insurance services) with $23.2 billion approved.
• Refer to Section 5 for further information.
Real estate49.3%
Services9.4%
Other7.4%
Manufacturing22.8%
Mineral exploration
& development
Page 25
BOX B – MERGERS AND ACQUISITIONS VERSUS GREENFIELD INVESTMENTS
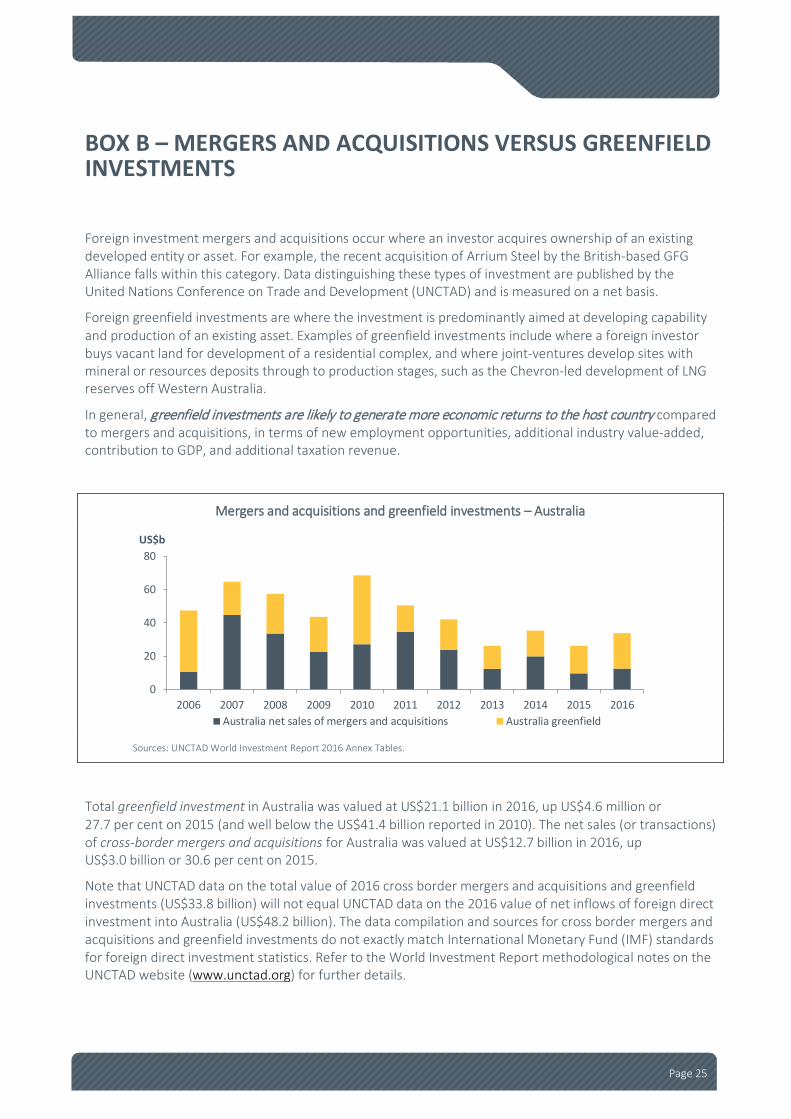
Foreign investment mergers and acquisitions occur where an investor acquires ownership of an existing developed entity or asset. For example, the recent acquisition of Arrium Steel by the British-based GFG Alliance falls within this category. Data distinguishing these types of investment are published by the United Nations Conference on Trade and Development (UNCTAD) and is measured on a net basis.
Foreign greenfield investments are where the investment is predominantly aimed at developing capability and production of an existing asset. Examples of greenfield investments include where a foreign investor buys vacant land for development of a residential complex, and where joint-ventures develop sites with mineral or resources deposits through to production stages, such as the Chevron-led development of LNG reserves off Western Australia.
In general, greenfield investments are likely to generate more economic returns to the host country compared to mergers and acquisitions, in terms of new employment opportunities, additional industry value-added, contribution to GDP, and additional taxation revenue.
Mergers and acquisitions and greenfield investments – Australia
Sources: UNCTAD World Investment Report 2016 Annex Tables.
Total greenfield investment in Australia was valued at US$21.1 billion in 2016, up US$4.6 million or 27.7 per cent on 2015 (and well below the US$41.4 billion reported in 2010). The net sales (or transactions) of cross-border mergers and acquisitions for Australia was valued at US$12.7 billion in 2016, up US$3.0 billion or 30.6 per cent on 2015.
Note that UNCTAD data on the total value of 2016 cross border mergers and acquisitions and greenfield investments (US$33.8 billion) will not equal UNCTAD data on the 2016 value of net inflows of foreign direct investment into Australia (US$48.2 billion). The data compilation and sources for cross border mergers and acquisitions and greenfield investments do not exactly match International Monetary Fund (IMF) standards for foreign direct investment statistics. Refer to the World Investment Report methodological notes on the UNCTAD website (www.unctad.org) for further details.
0
20
40
60
80
2006 2007 2008 2009 2010 2011 2012 2013 2014 2015 2016
US$b
Australia net sales of mergers and acquisitions Australia greenfield

Page 26
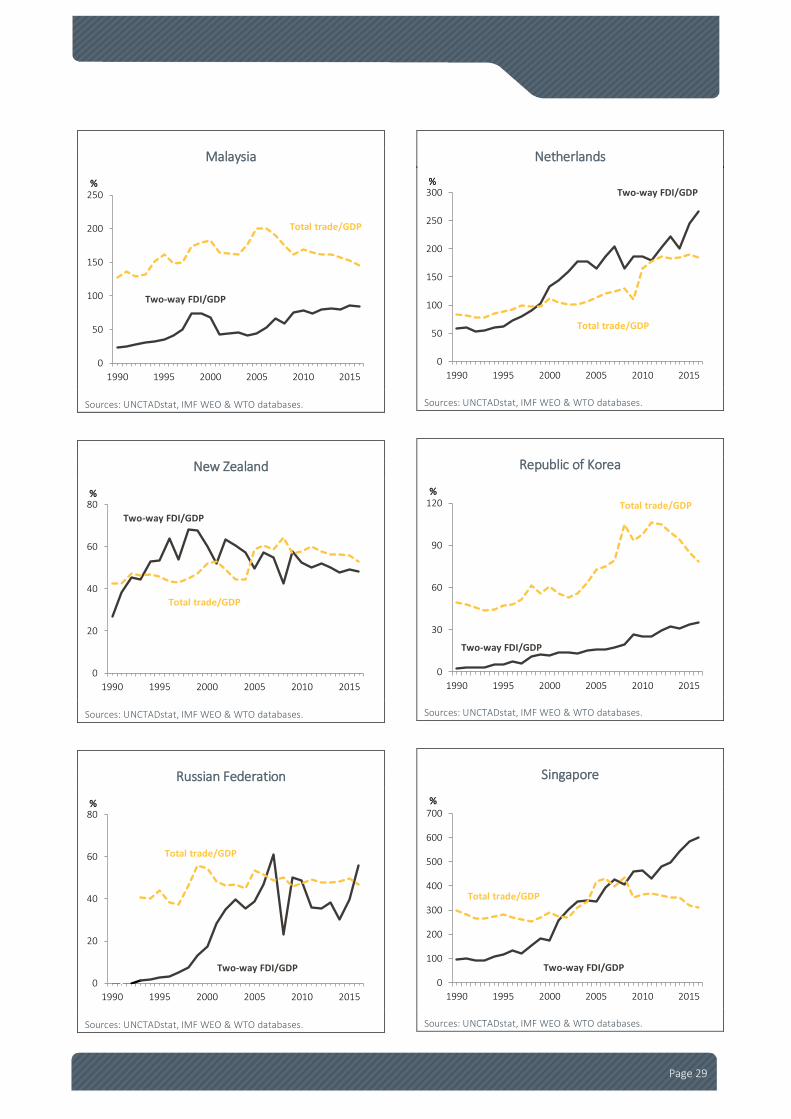
INTERNATIONAL TRADE AND INVESTMENT OPENNESS INDICATORS – COMPARISON CHARTS
The degree to which countries or economies conduct international trade and investment is a good indicator of the ‘international openness’ of the country or economy.
The following charts map two-way foreign direct investment as a proportion of Gross Domestic Product (GDP) and two-way foreign goods & services trade as a proportion of GDP.
Please note that some charts have incomplete datasets and axis scales are not consistent across the charts.
World
Sources: UNCTADstat, IMF WEO & WTO databases.
ASEAN
Sources: UNCTADstat, IMF WEO & WTO databases.
APEC
Sources: UNCTADstat, IMF WEO & WTO databases.
European Union
Sources: UNCTADstat, IMF WEO & WTO databases.
0
10
20
30
40
50
60
70
80
1990 1995 2000 2005 2010 2015
%
Two-way FDI/GDP
Total trade/GDP
0
20
40
60
80
100
120
140
160
180
1990 1995 2000 2005 2010 2015
%
Two-way FDI/GDP
Total trade/GDP
0
10
20
30
40
50
60
70
1990 1995 2000 2005 2010 2015
%Two-way FDI/GDP
Total trade/GDP
0
20
40
60
80
100
120
1990 1995 2000 2005 2010 2015
%
Two-way FDI/GDP
Total trade/GDP

Page 27
G20
Sources: UNCTADstat, IMF WEO & WTO databases.
Brazil
Sources: UNCTADstat, IMF WEO & WTO databases.
China
Sources: UNCTADstat, IMF WEO & WTO databases.
Australia
Sources: UNCTADstat, IMF WEO & WTO databases.
Canada
Sources: UNCTADstat, IMF WEO & WTO databases.
France
Sources: UNCTADstat, IMF WEO & WTO databases.
0
10
20
30
40
50
60
70
1990 1995 2000 2005 2010 2015
%
Two-way FDI/GDP
Total trade/GDP
0
5
10
15
20
25
30
35
40
45
50
1990 1995 2000 2005 2010 2015
%
Two-way FDI/GDP
Total trade/GDP
0
20
40
60
80
1990 1995 2000 2005 2010 2015
%
Two-way FDI/GDP
Total trade/GDP
0
20
40
60
80
100
1990 1995 2000 2005 2010 2015
%
Two-way FDI/GDP
Total trade/GDP
0
20
40
60
80
100
120
140
160
1990 1995 2000 2005 2010 2015
%Two-way FDI/GDP
Total trade/GDP
0
30
60
90
120
1990 1995 2000 2005 2010 2015
%
Total trade/GDP
Two-way FDI/GDP

Page 28
Germany
Sources: UNCTADstat, IMF WEO & WTO databases.
India
Sources: UNCTADstat, IMF WEO & WTO databases.
Italy
Sources: UNCTADstat, IMF WEO & WTO databases.
Hong Kong (SAR of China)
Sources: UNCTADstat, IMF WEO & WTO databases.
Indonesia
Sources: UNCTADstat, IMF WEO & WTO databases.
Japan
Sources: UNCTADstat, IMF WEO & WTO databases.
0
20
40
60
80
100
1990 1995 2000 2005 2010 2015
%
Two-way FDI/GDP
Total trade/GDP
0
10
20
30
40
50
60
1990 1995 2000 2005 2010 2015
%
Two-way FDI/GDPTotal trade/GDP
0
20
40
60
80
1990 1995 2000 2005 2010 2015
%
Total trade/GDP
Two-way FDI/GDP
0
200
400
600
800
1,000
1,200
1990 1995 2000 2005 2010 2015
%
Total trade/GDP
Two-way FDI/GDP
0
20
40
60
80
1990 1995 2000 2005 2010 2015
%
Total trade/GDP
Two-way FDI/GDP
0
10
20
30
40
50
1990 1995 2000 2005 2010 2015
%
Total trade/GDP
Two-way FDI/GDP
Page 29
Malaysia
Sources: UNCTADstat, IMF WEO & WTO databases.
New Zealand
Sources: UNCTADstat, IMF WEO & WTO databases.
Russian Federation
Sources: UNCTADstat, IMF WEO & WTO databases.
Netherlands
Sources: UNCTADstat, IMF WEO & WTO databases.
Republic of Korea
Sources: UNCTADstat, IMF WEO & WTO databases.
Singapore
Sources: UNCTADstat, IMF WEO & WTO databases.
0
50
100
150
200
250
1990 1995 2000 2005 2010 2015
%
Total trade/GDP
Two-way FDI/GDP
0
20
40
60
80
1990 1995 2000 2005 2010 2015
%
Total trade/GDP
Two-way FDI/GDP
0
20
40
60
80
1990 1995 2000 2005 2010 2015
%
Total trade/GDP
Two-way FDI/GDP
0
50
100
150
200
250
300
1990 1995 2000 2005 2010 2015
%
Total trade/GDP
Two-way FDI/GDP
0
30
60
90
120
1990 1995 2000 2005 2010 2015
%Total trade/GDP
Two-way FDI/GDP
0
100
200
300
400
500
600
700
1990 1995 2000 2005 2010 2015
%
Total trade/GDP
Two-way FDI/GDP

Page 30
Switzerland
Sources: UNCTADstat, IMF WEO & WTO databases.
United Kingdom
Sources: UNCTADstat, IMF WEO & WTO databases.
Taiwan
Sources: UNCTADstat, IMF WEO & WTO databases.
United States
Sources: UNCTADstat, IMF WEO & WTO databases.
0
50
100
150
200
250
300
350
1990 1995 2000 2005 2010 2015
%
Total trade/GDP
Two-way FDI/GDP
0
30
60
90
120
150
1990 1995 2000 2005 2010 2015
%
Total trade/GDP
Two-way FDI/GDP
0
30
60
90
120
150
1990 1995 2000 2005 2010 2015
%
Two-way FDI/GDP
Total trade/GDP
0
20
40
60
80
1990 1995 2000 2005 2010 2015
%Two-way FDI/GDP
Total trade/GDP

Page 31
ECONOMIC ACTIVITY OF AUSTRALIAN MAJORITY OWNED BUSINESSES LOCATED IN CANADA, THE EUROPEAN UNION, NEW ZEALAND AND THE UNITED STATES
Australian majority owned businesses in Canada, the EU, New Zealand and the United States are an important vehicle for Australian companies to provide goods and services to the world, with sales valued at around $150 billion in aggregate, almost triple the value of direct exports from Australia to these economies.
The growth in the provision of goods and services to Canada, the EU and the United States economies between 2002-03 and 2014 has been mainly due to the growth in sales by these Australian foreign affiliates rather than growth in exports. While sales by Australian foreign affiliates to New Zealand declined over the period they still accounted for around two-thirds of the total provision of Australian goods and services to New Zealand.
Introduction Australia has a significant direct investment presence abroad, with the stock of investment valued at $554.9 billion at the end of 2016. However, there are no current Australian statistics on the characteristics of these businesses. A previous study by the Australian Bureau of Statistics (ABS) for 2002-03 found that 641 Australian enterprises had 4,012 foreign businesses located overseas (with greater than 50 per cent Australian ownership). These businesses had sales of goods and services valued at $142.3 billion and employed 321,924 persons12. The report also showed that almost half (48 per cent) of Australia’s goods and services provided to the world were supplied via their affiliates abroad.
Austrade published a paper on Overseas investment of Australian companies using the IBIS World Top 2000 Company database13. This analysis found that over one third (727 Australian companies) of Australia’s top 2000 companies held direct investment abroad (with at least 10 per cent or more ownership) in a total of 8,172 foreign companies in 2016. The top 5 locations of foreign affiliates of Australian companies, in terms of numbers of affiliates were New Zealand, the United States, the United Kingdom, Singapore and Malaysia.
However, the IBIS World database does not contain information on the economic performance of these affiliates abroad such as sales, assets, industry value added and employment. Partner country data (or mirror statistics) can be used to compile some more up to date economic indicators on Australian owned businesses abroad. This information is collected through Foreign Affiliates Trade Statistics (FATS). FATS covers both foreign owned business in the host economy (or inwards FATS) and the host countries business located abroad (or outwards FATS). However, coverage is an issue with only a small number of countries collecting comprehensive FATS. In addition, the data tends to be a few years old as it takes time to collect and compile the data.
12 ABS catalogue number 5495.0 – Australian Outward Foreign affiliates trade, 2002-03. A more recent study for the financial & insurance services sector only was funded by DFAT for 2009-10 (Australian outward finance and insurance foreign affiliate trade 2009-10 (ABS catalogue no. 5485.0). 13 Austrade Overseas investment of Australian companies, Trade and investment note, September 2017.

Page 32
Inwards FATS complied by Canada, the European Union and the United States for 2014 and New Zealand for 2012 does have information on Australian majority owned companies14. Together these countries accounted for over half (53.7 per cent) of the stock of Australian direct investment abroad in Australia in 2016, valued at $298.0 billion15.
Australian majority owned businesses in Canada The stock of Australian direct investment in Canada was valued at $7.6 billion in 2016 (1.4 per cent share of Australian direct investment abroad).
Australian majority owned affiliates in Canada had sales of goods and services valued at $9.2 billion compared to Australian exports to Canada valued at $2.1 billion in 2014 – refer to Table A. Total assets of these Australian affiliates was valued at $30.1 billion at the end of 2014. Australian majority owned business in Canada employed 20,436 persons in 2014.
Table A: Summary indicators of Australian majority owned affiliates in Canada (a)
Indicator Unit
Australian investment in Canada A$m Share of total direct investment % No. of affiliates No. No. of enterprises No. Total assets A$m Employment 000's Compensation of employees A$m Industry value added A$m Sales / Turnover A$m
(a) The data is based on the country of Ultimate Beneficial Ownership (UBO). na - not available np – not published. Source: ABS and Statistics Canada.
Australian majority owned businesses in the European Union Table B: Summary indicators of Australian majority owned affiliates in the European Union (a)
Indicator Unit 2012 2013 2014
Australian investment in EU A$m 90,827 96,447 108,352 Share of total direct investment % 19.8 18.7 19.9 No. of affiliates No. na na na No. of enterprises No. 1,090 1,138 1,177 Total assets A$m na na na Employment 000's 80.0 79.8 83.0 Compensation of employees A$m na na na Industry value added A$m 13,015 12,319 15,182 Sales / Turnover A$m 37,037 40,220 46,759
(a) All industries except public administration, defence and compulsory social security. na - not available. Source: ABS and Eurostat.
14 FATS data is not collected by most countries at the level in which Australia can be identified, consequently in this article inwards FATS data is identified where it is reported. The amount of information available varies across countries, with the United States having the most detailed FATS collection. 15 Direct investment covers affiliates with 10 per cent or more ownership by the country. Majority owned FATS covers affiliates with 50 per cent or more ownership.
Page 33
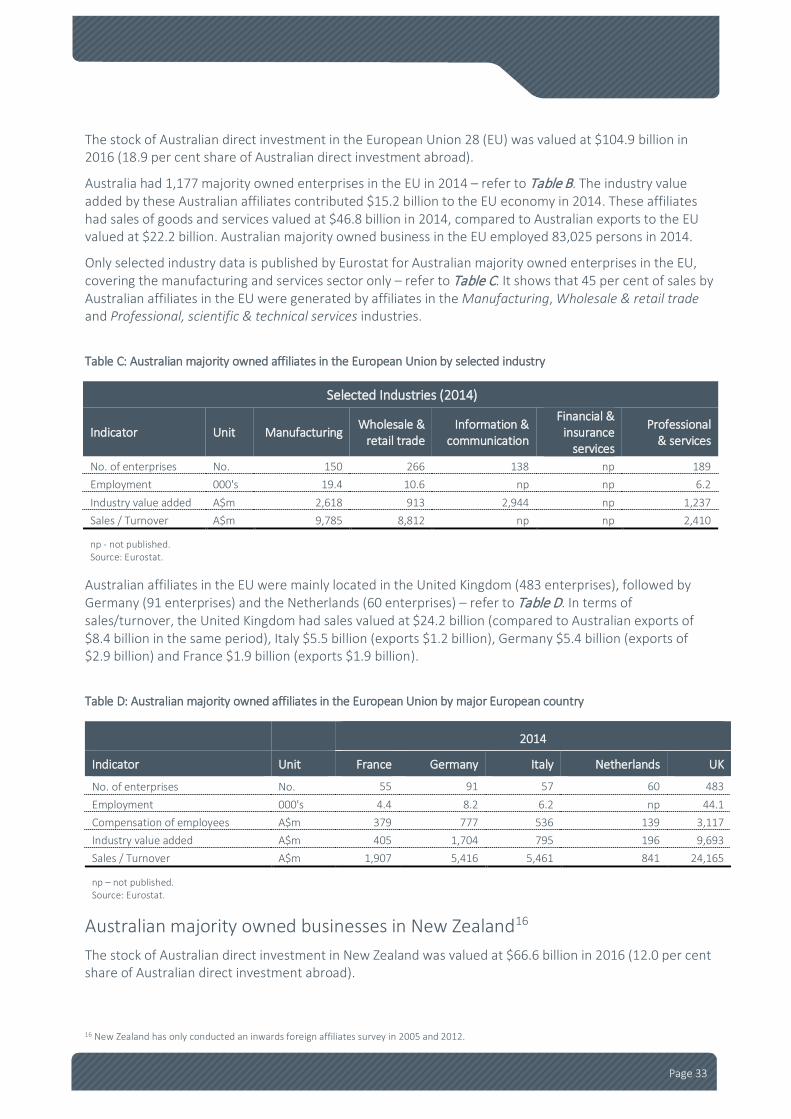
The stock of Australian direct investment in the European Union 28 (EU) was valued at $104.9 billion in 2016 (18.9 per cent share of Australian direct investment abroad).
Australia had 1,177 majority owned enterprises in the EU in 2014 – refer to Table B. The industry value added by these Australian affiliates contributed $15.2 billion to the EU economy in 2014. These affiliates had sales of goods and services valued at $46.8 billion in 2014, compared to Australian exports to the EU valued at $22.2 billion. Australian majority owned business in the EU employed 83,025 persons in 2014.
Only selected industry data is published by Eurostat for Australian majority owned enterprises in the EU, covering the manufacturing and services sector only – refer to Table C. It shows that 45 per cent of sales by Australian affiliates in the EU were generated by affiliates in the Manufacturing, Wholesale & retail trade and Professional, scientific & technical services industries.
Table C: Australian majority owned affiliates in the European Union by selected industry
Selected Industries (2014)
Indicator Unit Manufacturing Wholesale & retail trade
Information & communication
Financial & insurance
services
Professional & services
No. of enterprises No. 150 266 138 np 189 Employment 000's 19.4 10.6 np np 6.2 Industry value added A$m 2,618 913 2,944 np 1,237 Sales / Turnover A$m 9,785 8,812 np np 2,410
np - not published. Source: Eurostat.
Australian affiliates in the EU were mainly located in the United Kingdom (483 enterprises), followed by Germany (91 enterprises) and the Netherlands (60 enterprises) – refer to Table D. In terms of sales/turnover, the United Kingdom had sales valued at $24.2 billion (compared to Australian exports of $8.4 billion in the same period), Italy $5.5 billion (exports $1.2 billion), Germany $5.4 billion (exports of $2.9 billion) and France $1.9 billion (exports $1.9 billion).
Table D: Australian majority owned affiliates in the European Union by major European country
2014
Indicator Unit France Germany Italy Netherlands UK
No. of enterprises No. 55 91 57 60 483 Employment 000's 4.4 8.2 6.2 np 44.1 Compensation of employees A$m 379 777 536 139 3,117 Industry value added A$m 405 1,704 795 196 9,693 Sales / Turnover A$m 1,907 5,416 5,461 841 24,165
np – not published. Source: Eurostat.
Australian majority owned businesses in New Zealand16 The stock of Australian direct investment in New Zealand was valued at $66.6 billion in 2016 (12.0 per cent share of Australian direct investment abroad).
16 New Zealand has only conducted an inwards foreign affiliates survey in 2005 and 2012.

Page 34
In 2012, Australian had 2,545 affiliated enterprises in New Zealand with total assets valued at $475.0 billion – refer to Table E. The industry value added by these affiliates contributed $13.3 billion to the New Zealand economy in 2012 and employed 137,900 persons. The affiliates had sales of goods and services in New Zealand valued at $27.1 billion compared to Australian exports to New Zealand valued at $10.9 billion in 2012.
Australian foreign affiliates in New Zealand accounted for 38 per cent of the total number of foreign affiliates in New Zealand (6,667), around 45 per cent of total sales and total value added but nearly 80 per cent of total assets.
Table E: Summary indicators of Australian majority owned businesses in New Zealand
Indicator Unit 2012 2013 2014
Australian direct investment in New Zealand A$m 44,141 44,691 60,204 Share of total direct investment % 9.6 9.3 11.1 No. of affiliates No. na na na No. of enterprises No. 2,545 na na Total assets A$m 475,011 na na Employment 000's 137.9 na na Compensation of employees A$m na na na Industry value added A$m 13,250 na na Sales / Turnover A$m 27,143 na na
na - not available. Source: ABS and Statistics NZ.
Australian majority owned businesses in the United States The stock of Australian direct investment in the United States was valued at $118.9 billion in 2016 (21.4 per cent share of Australian direct investment abroad).
Australia had 114 majority owned affiliates17 in the United States in 2014 covering 1,184 enterprises18 – refer to Table F. These affiliates had total assets in the United States of $347.7 billion. The industry value added by these affiliates contributed $20.7 billion to the United States economy in 2014.
Table F: Summary indicators of Australian majority owned businesses in the United States (a)
Indicator Unit 2012 2013 2014
Australian direct investment in the US A$m 105,344 124,540 132,678 Share of total direct investment % 23.0 24.2 24.4 No. of affiliates (b) No. 114 116 114 No. of enterprises No. 1,220 1,169 1,184 Total assets A$m 261,341 305,580 347,693 Employment 000's 91.3 94.9 94.8 Compensation of employees A$m 8,066 8,475 9,322 Industry value added A$m 15,090 16,389 20,745 Sales / Turnover A$m 54,742 60,062 67,223
(a) The data is based on the country of Ultimate Beneficial Ownership (UBO). (b) The number of affiliates with assets, sales, or net income (+/-) greater than US$25 million. Source: ABS & US Bureau of Economic Analysis.
17 Majority owned includes all affiliates of which the United States owns 50 per cent or more equity in the affiliates. 18 The number of affiliates with assets, sales, or net income (+/-) greater than US$25 million.
Page 35
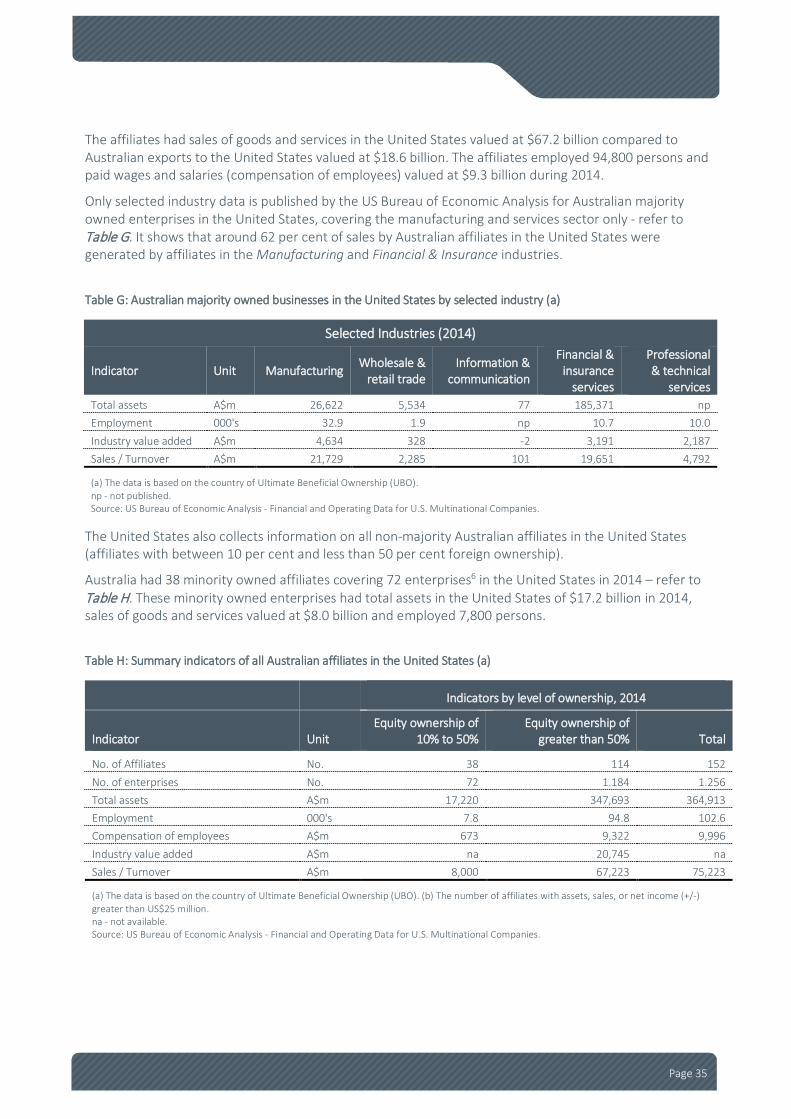
The affiliates had sales of goods and services in the United States valued at $67.2 billion compared to Australian exports to the United States valued at $18.6 billion. The affiliates employed 94,800 persons and paid wages and salaries (compensation of employees) valued at $9.3 billion during 2014.
Only selected industry data is published by the US Bureau of Economic Analysis for Australian majority owned enterprises in the United States, covering the manufacturing and services sector only - refer to Table G. It shows that around 62 per cent of sales by Australian affiliates in the United States were generated by affiliates in the Manufacturing and Financial & Insurance industries.
Table G: Australian majority owned businesses in the United States by selected industry (a)
Selected Industries (2014)
Indicator Unit Manufacturing Wholesale & retail trade
Information & communication
Financial & insurance
services
Professional & technical
services Total assets A$m 26,622 5,534 77 185,371 np Employment 000's 32.9 1.9 np 10.7 10.0 Industry value added A$m 4,634 328 -2 3,191 2,187 Sales / Turnover A$m 21,729 2,285 101 19,651 4,792
(a) The data is based on the country of Ultimate Beneficial Ownership (UBO). np - not published. Source: US Bureau of Economic Analysis - Financial and Operating Data for U.S. Multinational Companies.
The United States also collects information on all non-majority Australian affiliates in the United States (affiliates with between 10 per cent and less than 50 per cent foreign ownership).
Australia had 38 minority owned affiliates covering 72 enterprises6 in the United States in 2014 – refer to Table H. These minority owned enterprises had total assets in the United States of $17.2 billion in 2014, sales of goods and services valued at $8.0 billion and employed 7,800 persons.
Table H: Summary indicators of all Australian affiliates in the United States (a)
Indicators by level of ownership, 2014
Indicator Unit Equity ownership of
10% to 50% Equity ownership of
greater than 50% Total
No. of Affiliates No. 38 114 152 No. of enterprises No. 72 1.184 1.256 Total assets A$m 17,220 347,693 364,913 Employment 000's 7.8 94.8 102.6 Compensation of employees A$m 673 9,322 9,996 Industry value added A$m na 20,745 na Sales / Turnover A$m 8,000 67,223 75,223
(a) The data is based on the country of Ultimate Beneficial Ownership (UBO). (b) The number of affiliates with assets, sales, or net income (+/-) greater than US$25 million. na - not available. Source: US Bureau of Economic Analysis - Financial and Operating Data for U.S. Multinational Companies.
Page 36
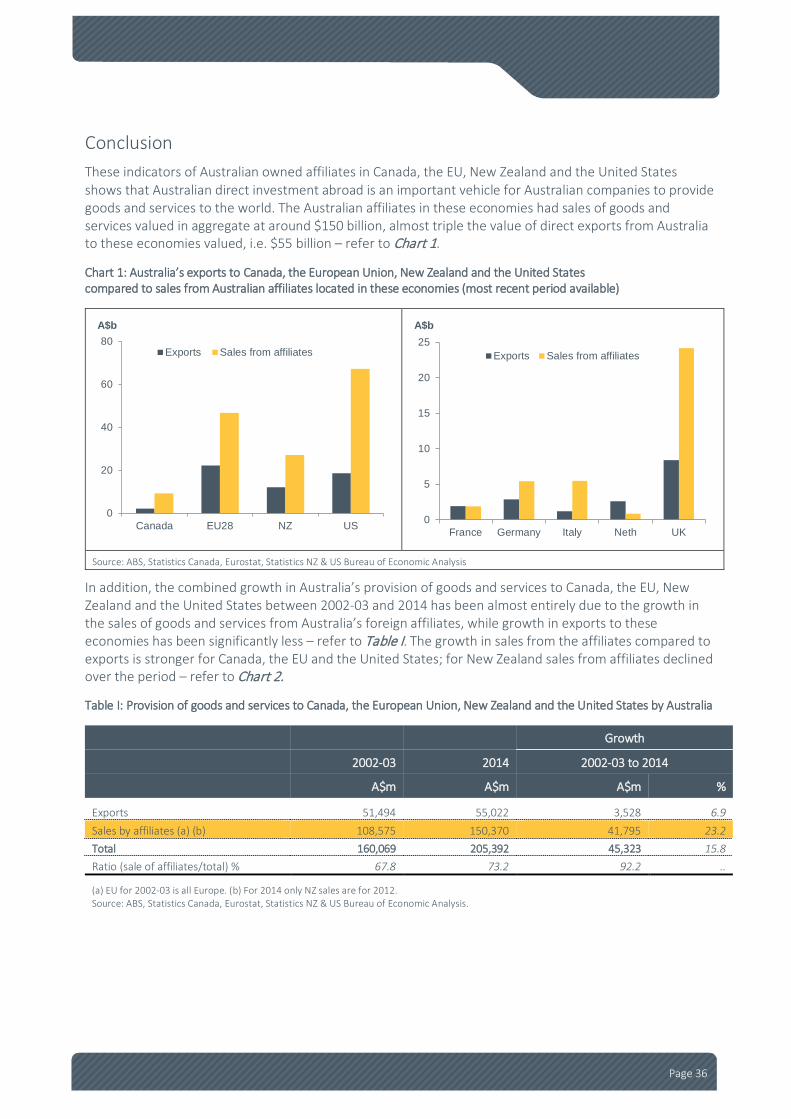
Conclusion These indicators of Australian owned affiliates in Canada, the EU, New Zealand and the United States shows that Australian direct investment abroad is an important vehicle for Australian companies to provide goods and services to the world. The Australian affiliates in these economies had sales of goods and services valued in aggregate at around $150 billion, almost triple the value of direct exports from Australia to these economies valued, i.e. $55 billion – refer to Chart 1.
Chart 1: Australia’s exports to Canada, the European Union, New Zealand and the United States compared to sales from Australian affiliates located in these economies (most recent period available)
Source: ABS, Statistics Canada, Eurostat, Statistics NZ & US Bureau of Economic Analysis
In addition, the combined growth in Australia’s provision of goods and services to Canada, the EU, New Zealand and the United States between 2002-03 and 2014 has been almost entirely due to the growth in the sales of goods and services from Australia’s foreign affiliates, while growth in exports to these economies has been significantly less – refer to Table I. The growth in sales from the affiliates compared to exports is stronger for Canada, the EU and the United States; for New Zealand sales from affiliates declined over the period – refer to Chart 2.
Table I: Provision of goods and services to Canada, the European Union, New Zealand and the United States by Australia
Growth 2002-03 2014 2002-03 to 2014
A$m A$m A$m %
Exports 51,494 55,022 3,528 6.9 Sales by affiliates (a) (b) 108,575 150,370 41,795 23.2 Total 160,069 205,392 45,323 15.8 Ratio (sale of affiliates/total) % 67.8 73.2 92.2 ..
(a) EU for 2002-03 is all Europe. (b) For 2014 only NZ sales are for 2012. Source: ABS, Statistics Canada, Eurostat, Statistics NZ & US Bureau of Economic Analysis.
0
20
40
60
80
Canada EU28 NZ US
A$b
Exports Sales from affiliates
0
5
10
15
20
25
France Germany Italy Neth UK
A$b
Exports Sales from affiliates

Page 37
Chart 2: Australia’s exports and sales by affiliates to Canada, European Union, New Zealand and the United States 2002-03 compared to most recent period available
Canada
European Union
New Zealand
United States
Source: ABS, Statistics Canada, Eurostat, Statistics NZ & US Bureau of Economic Analysis
More information For more information on these statistics please refer to the following websites:
• ABS Australian outward foreign affiliates trade 2002-03 (ABS catalogue 5495.0) – www.abs.gov.au
• ABS Australian outward finance and insurance foreign affiliate trade 2009-10 (ABS catalogue 5485.0) – www.abs.gov.au
• Austrade Overseas investment of Australian companies, Trade and investment note, April 2015 - http://www.austrade.gov.au/News/Economics-at-Austrade/overseas-investment-of-australian-companies.
0
2
4
6
8
10
2002-03 2014
A$b
Exports Sale by affiliates
0
10
20
30
40
50
2002-03 2014
A$b
Exports Sale by affiliates
0
10
20
30
40
2002-03 2012
A$b
Exports Sale by affiliates
0
20
40
60
80
2002-03 2014
A$b
Exports Sale by affiliates
Page 38
• DFAT analytical articles on the result from the above ABS publications Australia's Outward Finance and Insurance Foreign Affiliates Trade in Services, 2009-10 and Australia's outwards foreign affiliates services trade: 2002-03 – http://dfat.gov.au/about-us/publications/Pages/recent-trade-statistical-articles-and-information-papers.aspx
• Eurostat (http://ec.europa.eu/eurostat) – Foreign controlled EU affiliates – outwards FATS
• Statistics Canada - Activities of foreign majority-owned affiliates in Canada - The Daily — Activities of foreign majority-owned affiliates in Canada, 2014
• Statistics New Zealand – New Zealand’s inward foreign affiliate statistics – www.stats.govt.nz/browse_for_stats/economic_indicators/balance_of_payments/nz-inward-fats.aspx
• United States’ Bureau of Economic Analysis (www.bea.gov) – data on the activities of U.S. majority owned affiliates.
Author: Frank Bingham Office of Economic Analysis Investment and Economic Division [email protected]
Page 39
Section 1
Australia’s international investment
Definitions and concepts
Page 40
AUSTRALIA’S INTERNATIONAL INVESTMENT POSITION19
Australia’s International investment position (IIP) is a set of statistics closely related to the Balance of Payments. IIP is a balance sheet of the stock of Australian investment abroad (or foreign assets) and foreign investment in Australia (or foreign liabilities).
The IIP may be viewed more broadly as a reconciliation statement showing the levels of Australia’s international assets and liabilities at the start and end of the period, and the components of changes within the period (investment injection or withdrawal flows and other changes such as price changes, exchange rate movements and other adjustments).
International investment position (stock or level)
The IIP records the stock (also called level, or position) of foreign investment in Australia (FIA) or Australian investment abroad (AIA) at a particular date (referred to as the closing position at the end of the reporting period).
Capital transactions (or flows)
Capital transactions are measured on a net basis in international investment statistics. Net capital inflows are the sum of all new injections of foreign capital (both equity and debt) into Australia minus the withdrawals of existing foreign capital already in Australia over the period. Net capital outflows are the sum of all new injections of Australian capital overseas minus the withdrawals of existing Australian capital overseas over the period.
Other changes in the position (stock or level)
Changes in the position may also occur due to Price changes (such as movements in the stock market), Exchange rate changes (appreciation or depreciation of the Australian dollar) and other adjustments (such as the write-off of bad debts).
Investment income
Investment income refers to the income accruing (or owing) on the stock of financial assets and liabilities during a particular period. Examples of investment income include: dividend payments from shares; interest on loans; and reinvested earnings (profits that are reinvested into the company in the host economy rather than paid back to the investor).
Income earned (Investment income credits in Australia’s balance of payments statistics) refers to income accruing to Australian residents from the stock of Australian investment abroad.
Income payable (Investment income debits) refers to income accruing to non-residents from foreign investment in Australia.
19 Please note the wording and concepts used in these boxes has been simplified from the wording and concepts used by the ABS in its international investment statistics (which are based on the International Monetary Fund’s Balance of Payments and International Investment Manual version 6 (BPM6). This is to assist users with understanding the complex nature of these concepts. See the Explanatory notes for more information.
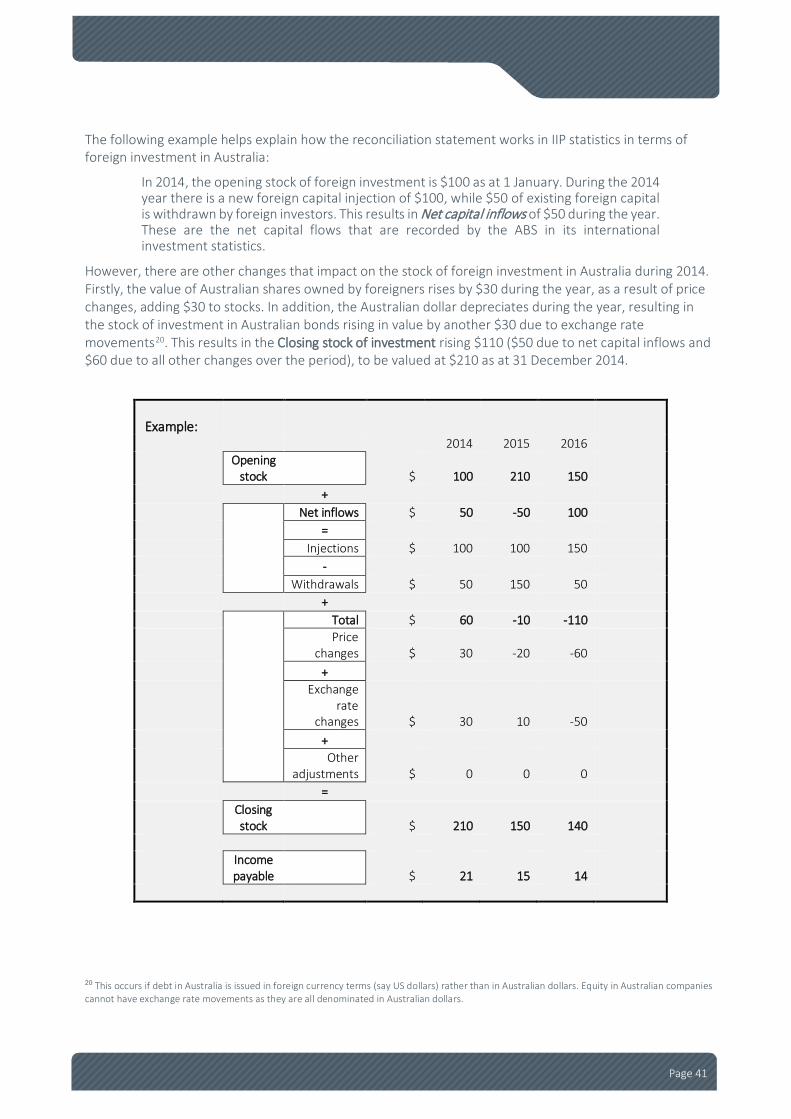
Page 41
The following example helps explain how the reconciliation statement works in IIP statistics in terms of foreign investment in Australia:
In 2014, the opening stock of foreign investment is $100 as at 1 January. During the 2014 year there is a new foreign capital injection of $100, while $50 of existing foreign capital is withdrawn by foreign investors. This results in Net capital inflows of $50 during the year. These are the net capital flows that are recorded by the ABS in its international investment statistics.
However, there are other changes that impact on the stock of foreign investment in Australia during 2014. Firstly, the value of Australian shares owned by foreigners rises by $30 during the year, as a result of price changes, adding $30 to stocks. In addition, the Australian dollar depreciates during the year, resulting in the stock of investment in Australian bonds rising in value by another $30 due to exchange rate movements20. This results in the Closing stock of investment rising $110 ($50 due to net capital inflows and $60 due to all other changes over the period), to be valued at $210 as at 31 December 2014.
Example: 2014 2015 2016
Opening
stock $ 100 210 150 + Net inflows $ 50 -50 100 = Injections $ 100 100 150 - Withdrawals $ 50 150 50 + Total $ 60 -10 -110
Price
changes $ 30 -20 -60 +
Exchange rate
changes $ 30 10 -50 +
Other
adjustments $ 0 0 0 =
Closing stock $ 210 150 140
Income payable $ 21 15 14
20 This occurs if debt in Australia is issued in foreign currency terms (say US dollars) rather than in Australian dollars. Equity in Australian companies cannot have exchange rate movements as they are all denominated in Australian dollars.
Page 42
In 2015 you can observe that net capital inflows is a negative number as new injections of capital are outweighed by withdrawals of existing investment.
In 2016 you can observe that it is possible for net inflows to be positive but the value of the stock to fall over the year. This occurs as the falls in price movements and exchange rate changes are equal to negative $110 which outweighs the $100 rise in net inflows during the year.
You can also observe from this example that you should never sum net inflows (or net outflows) over a period of time to represent stock of investment. The sum of the net inflows over the 3 years is $100, while the stock of investment is $140. Summing net inflows does not take into account any investment before the period being summed (in this case $100), or movements in the stock due to other changes during the period (in this case negative $60)21.
21 Some statistical organisations do sum net flows to represent stocks of investment. This is mainly due to the fact that information on other changes is not readily available. This is referred to as investment stock on a historical cost basis, rather than investment on a market value basis as published by the ABS.

Page 43
WHAT IS DIRECT INVESTMENT?
In simple terms, direct investment is where an investor acquires or holds 10 per cent or more ownership in a business or other asset. By holding 10 per cent or more of the shares or equity in the business, the direct investor is deemed to exercise a significant degree of influence in its management.
In Australia’s international investment statistics, data on foreign direct investment (FDI) in Australia records where individuals or businesses outside Australia hold 10% or more ownership in an Australian business or other asset.
Similarly, data on Australia’s foreign direct investment abroad records where Australian individuals or businesses hold 10% or more ownership in a foreign business or asset.
Direct investment can take different forms:
• branches (i.e. fully owned by the direct investor);
• subsidiaries (at least 50 per cent owned by the direct investor); and
• associates (between 10 per cent and 50 per cent owned by the direct investor).
Direct investment normally signifies the investor is not just interested in maximising short-term profits but is interested in the long-term profitability of the entire enterprise group (e.g. multinational companies). This type of investment can be politically and economically sensitive in the host country so many countries have a review process (such as the Foreign Investment Review Board in Australia) to safeguard national interests.
Direct investment comprises around one-third of Australia’s total investment abroad, and around one-quarter of all foreign investment in Australia.
Example of direct investment in Australia
At the beginning of September 2017 the GFG Alliance formally completed its purchase of Whyalla’s South Australian steel works. Operating as Liberty Onesteel, the company produces a range of steel products including wire, steel rods, reinforcing and rails.

Page 44
WHAT OTHER FORMS OF FOREIGN INVESTMENT ARE THERE?
Total foreign investment comprises direct investment, as well as indirect investment such as portfolio investment, financial derivatives, reserve assets and other investment.
Portfolio investment consists of equity (shares) and debt securities (bonds, bills, money market instruments) not above the 10 per cent ownership threshold for direct investment:
• portfolio investment indicates investment in a business or asset where the investor has no appreciable say in the operation of the business or asset; – for example, superannuation funds and financial institutions are major portfolio investors,
spreading their investments across a portfolio of assets in international markets to maximise returns and balance investment risks on behalf of their members and investors (i.e. ‘not having all their eggs in one basket’).
Financial derivatives are financial instruments that are linked to a specific financial instrument, indicator or commodity, and through which specific financial risks can be traded in financial markets in their own right. Financial derivatives enable parties to trade specific financial risks (such as interest rate risk, currency, equity and commodity price risk, credit risk, etc.) to other entities who are more willing, or better suited, to take or manage these risks.
Reserve assets (only recorded for Australian investment abroad) are the financial assets effectively controlled by the Reserve Bank of Australia.
Other investment is the residual category and captures all other types of investment (excluding reserve assets) such as currency and deposits, loans, trade credit and accounts payable and receivable.
Indirect investment comprises around two-thirds of Australia’s total investment abroad, and around three-quarters of all foreign investment in Australia.
See the Explanatory notes for more information.
Example of Australia’s portfolio investment abroad
Australian Super, a well-known Australian superannuation fund, purchases stocks across a range of companies listed on the New York Stock Exchange. The top five international equity holdings are Tencent Holdings, Amazon.com, Alphatbet (Google), Oracle Corp and Alibaba Group Holding.
Page 45
HOW ARE AUSTRALIA’S FOREIGN INVESTMENT STATISTICS COMPILED?
The Australian Bureau of Statistics (ABS) compiles data on international investment in Australia and Australia’s investment abroad.
The statistics are compiled according to the International Monetary Fund (IMF) Balance of Payments and International Investment Position Manual, sixth edition (BPM6), which provides the international standard to ensure all countries compile the data in a consistent manner to enhance accuracy and international comparisons.
The ABS’ Survey of International Investment is a quarterly ABS survey which collects information about investment activity into and out of Australia and levels of investment. This survey data is supplemented by modelled data for specific aspects of international investment data.
The time of recording of transactions in international investment statistics is, in principle, the time of change of ownership.
The valuation of the investment in Australian international investment statistics is based on the market value of the asset or liability at the current point in time. Market valuation can be considerably different to a historical valuation basis (as used by the United States).
For example, a share when issued on the Australian stock market is worth $1 in year one. Five years later the market value of that share is $30 on the Australian stock market. On a market valuation basis the share would be valued at $1 in year one rising to $30 in year five. On a historical cost basis the share would be valued at just $1 in both year one as well as year five.
The Foreign Investment Review Board also collects statistics on the number and value of approved investments into Australia (see Section 5 for more detail).

Page 46
THIRD PARTY COUNTRIES AND INVESTMENT CENTRES
Care should be exercised in interpreting world investment data as the investment data reflects the country of the immediate investor, rather than the country of the ultimate owner or investor. Many international investments are made through financial intermediaries, holding companies or investment managers which are often incorporated in third-party countries.
There are a number of countries which have become hubs as financial intermediaries and investment centres for global clientele. Examples include the British Virgin Islands and the Cayman Islands in the Caribbean, Hong Kong and Singapore in Asia, and Belgium, Switzerland and Luxembourg in Europe. In some cases these centres are the result of preferential tax arrangements.
The following diagram shows two cases of Australian international investment and how they are treated in ABS investment statistics. Case one looks at investment that is sourced directly from the country of origin (in this case Japan) and case two looks at Japan’s investment in Australia but via a third party country (in this case Hong Kong)
In the first case the ABS would record foreign investment in Australia from Japan to the value of $100 million, while Japanese investment statistics would record Japanese investment abroad to Australia valued at $100 million.
In the second case of the investment going through a third party country (in this case Hong Kong), the ABS would record foreign investment in Australia from Hong Kong to the value of $100 million while Japanese investment statistics would record Japanese investment abroad to Hong Kong valued at $100 million. Hong Kong investment statistics would record both foreign investment from Japan valued at $100 million and Hong Kong investment abroad to Australia valued at $100 million.
$100 million
AustraliaJapan
Hong Kong,SAR of China

Page 47
Section 2
Australia's international investmentSummary tables

Page 48
% change $ change
2015 to 2015 to2012 2013 2014 2015 2016 2016 2016
Foreign investment in AustraliaDirect investment 57,516 58,321 44,738 25,926 64,825 150.0 38,899
Equity 32,173 26,802 37,375 25,889 51,003 97.0 25,114Other 25,342 31,519 7,364 37 13,822 .. 13,785
Portfolio investment 57,381 84,279 78,566 98,637 6,621 -93.3 -92,016Equity 13,545 15,852 11,433 18,131 24,056 32.7 5,925Debt 43,836 68,427 67,133 80,507 -17,436 .. -97,943
Financial derivatives -44,420 -66,054 -59,585 -102,101 -125,271 22.7 -23,170Other investment 36,791 18,134 6,214 62,466 27,844 -55.4 -34,622
Total investment 107,268 94,680 69,932 84,929 -25,981 .. -110,910
Australian investment abroadDirect investment 7,621 1,493 341 -22,226 8,086 .. 30,312
Equity 3,459 6,216 2,792 16,426 5,095 -69.0 -11,331Other 4,162 -4,723 -2,451 -38,652 2,990 .. 41,642
Portfolio investment 44,947 27,003 53,482 35,962 37,760 5.0 1,798Equity 17,551 14,881 24,358 880 22,421 .. 21,541Debt 27,396 12,122 29,123 35,082 15,339 -56.3 -19,743
Reserve assets 2,271 5,815 4,246 -3,224 10,328 .. 13,552Financial derivatives -36,528 -47,493 -56,844 -97,159 -113,156 16.5 -15,997Other investment 18,379 50,914 22,792 99,816 -13,927 .. -113,743
Total investment 36,691 37,732 24,016 13,169 -70,910 .. -84,079
Foreign investment in AustraliaDirect investment 591,188 641,668 685,072 733,532 796,072 8.5 62,540
Equity 447,673 457,799 490,501 531,859 583,054 9.6 51,195Other 143,515 183,869 194,572 201,673 213,018 5.6 11,345
Portfolio investment 1,270,534 1,420,413 1,528,058 1,630,890 1,659,820 1.8 28,930Equity 382,687 436,744 456,446 459,506 525,784 14.4 66,278Debt 887,848 983,668 1,071,612 1,171,384 1,134,036 -3.2 -37,348
Financial derivatives 95,629 117,759 195,819 187,558 212,511 13.3 24,953Other investment 308,049 363,699 396,517 487,152 524,019 7.6 36,867
Total investment 2,265,401 2,543,539 2,805,466 3,039,132 3,192,422 5.0 153,290
Australian investment abroadDirect investment 458,004 515,470 544,231 534,173 554,874 3.9 20,701
Equity 425,619 484,904 515,543 537,711 556,031 3.4 18,320Other 32,385 30,566 28,689 -3,538 -1,157 -67.3 2,381
Portfolio investment 559,504 666,297 761,190 818,232 869,818 6.3 51,586Equity 338,104 430,330 492,384 514,492 553,654 7.6 39,162Debt 221,400 235,966 268,806 303,739 316,163 4.1 12,424
Reserve assets 47,306 59,485 65,705 67,440 76,079 12.8 8,639Financial derivatives 101,964 118,298 182,308 170,036 193,414 13.7 23,378Other investment 268,077 335,416 372,530 488,574 476,625 -2.4 -11,949
Total investment 1,434,854 1,694,965 1,925,964 2,078,455 2,170,810 4.4 92,355
TABLE 1: AUSTRALIA'S INVESTMENT FLOWS, STOCKS AND INCOME(A$ million)
Investment flows
Stock at the end of the period

Page 49
% change $ change
2015 to 2015 to2012 2013 2014 2015 2016 2016 2016
Net international investment position 830,547 848,574 879,502 960,677 1,021,612 6.3 60,935
Net foreign equity 66,205 -21,173 -61,528 -61,443 -1,444 -97.6 59,999
Net foreign debt 764,341 869,745 941,029 1,022,120 1,023,055 0.1 935
Foreign investment in Australia - income payableDirect investment 34,470 35,233 32,912 31,906 34,601 8.4 2,695
Dividends and reinvested earnings 29,279 30,432 27,426 26,485 29,425 11.1 2,940Interest 5,191 4,800 5,487 5,422 5,176 -4.5 -246
Portfolio investment 39,347 40,736 42,280 44,373 41,511 -6.4 -2,862Dividends and reinvested earnings 14,320 17,104 17,688 20,313 18,678 -8.0 -1,635Interest 25,027 23,633 24,592 24,059 22,833 -5.1 -1,226
Other investment 5,265 5,458 5,788 6,454 7,184 11.3 730Total investment income 79,083 81,427 80,980 82,734 83,296 0.7 562
Australian investment abroad - income earnedDirect investment 20,066 20,465 21,251 17,815 27,484 54.3 9,669
Dividends and reinvested earnings 18,848 19,417 20,382 17,527 27,331 55.9 9,804Interest 1,218 1,048 868 287 153 -46.7 -134
Portfolio investment 19,183 20,197 22,678 24,912 25,971 4.3 1,059Dividends and reinvested earnings 10,927 12,337 14,561 16,928 18,448 9.0 1,520Interest 8,256 7,859 8,117 7,984 7,523 -5.8 -461
Reserve assets 254 159 144 157 180 14.6 23Other investment 3,352 3,777 4,062 4,383 5,280 20.5 897
Total investment income 42,855 44,598 48,134 47,268 58,915 24.6 11,647Based on ABS catalogue 5352.0.
Investment income flows
TABLE 1: AUSTRALIA'S INVESTMENT FLOWS, STOCKS AND INCOME (cont'd)(A$ million)
Stock at the end of the period (cont'd)
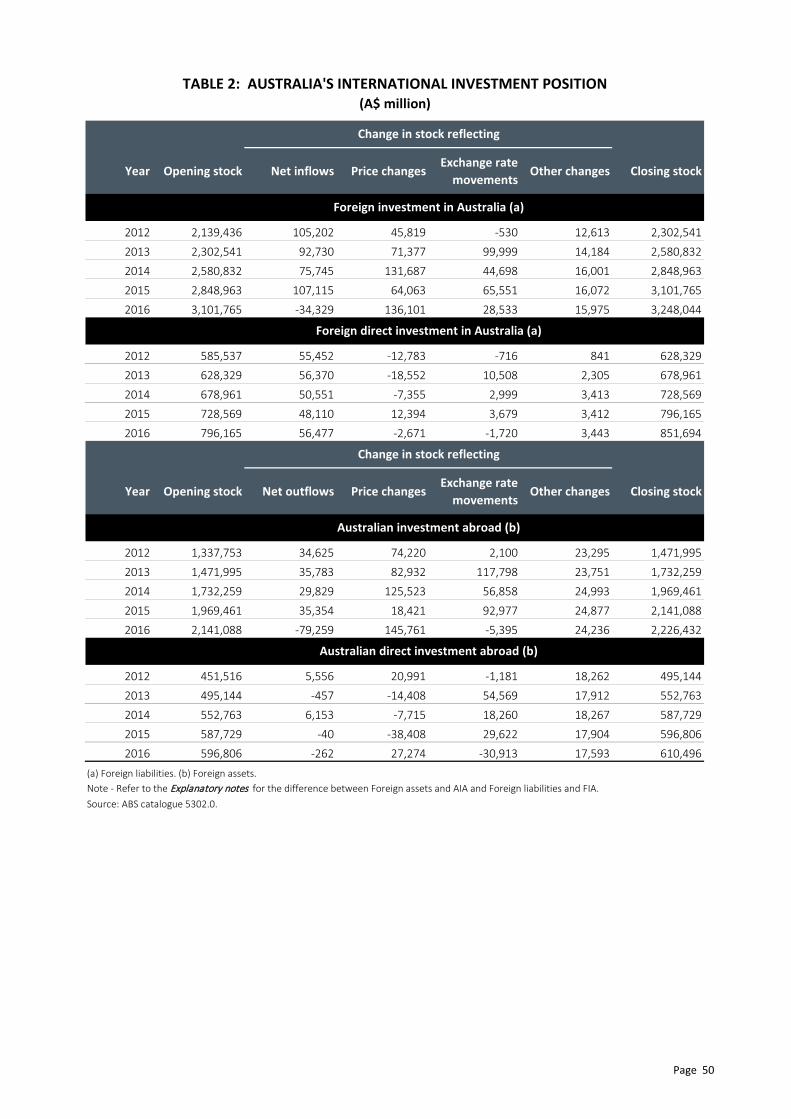
Page 50
Year Opening stock Net inflows Price changesExchange rate
movementsOther changes Closing stock
2012 2,139,436 105,202 45,819 -530 12,613 2,302,541
2013 2,302,541 92,730 71,377 99,999 14,184 2,580,832
2014 2,580,832 75,745 131,687 44,698 16,001 2,848,963
2015 2,848,963 107,115 64,063 65,551 16,072 3,101,765
2016 3,101,765 -34,329 136,101 28,533 15,975 3,248,044
2012 585,537 55,452 -12,783 -716 841 628,329
2013 628,329 56,370 -18,552 10,508 2,305 678,961
2014 678,961 50,551 -7,355 2,999 3,413 728,569
2015 728,569 48,110 12,394 3,679 3,412 796,165
2016 796,165 56,477 -2,671 -1,720 3,443 851,694
Year Opening stock Net outflows Price changesExchange rate
movementsOther changes Closing stock
2012 1,337,753 34,625 74,220 2,100 23,295 1,471,995
2013 1,471,995 35,783 82,932 117,798 23,751 1,732,259
2014 1,732,259 29,829 125,523 56,858 24,993 1,969,461
2015 1,969,461 35,354 18,421 92,977 24,877 2,141,088
2016 2,141,088 -79,259 145,761 -5,395 24,236 2,226,432
2012 451,516 5,556 20,991 -1,181 18,262 495,144
2013 495,144 -457 -14,408 54,569 17,912 552,763
2014 552,763 6,153 -7,715 18,260 18,267 587,729
2015 587,729 -40 -38,408 29,622 17,904 596,806
2016 596,806 -262 27,274 -30,913 17,593 610,496
(a) Foreign liabilities. (b) Foreign assets.Note - Refer to the Explanatory notes for the difference between Foreign assets and AIA and Foreign liabilities and FIA.Source: ABS catalogue 5302.0.
Australian investment abroad (b)
Australian direct investment abroad (b)
TABLE 2: AUSTRALIA'S INTERNATIONAL INVESTMENT POSITION(A$ million)
Change in stock reflecting
Foreign investment in Australia (a)
Foreign direct investment in Australia (a)
Change in stock reflecting

Page 51
% change $ change
2015 to 2015 to2012 2013 2014 2015 2016 2016 2016
Canada 3,363 1,873 6,124 3,255 1,983 -39.1 -1,272China 3,037 5,260 11,846 6,540 5,140 -21.4 -1,400France 1,086 np 563 np 1,658 .. ..Germany 1,756 2,172 2,098 1,983 1,945 -1.9 -38Hong Kong (SAR of China) 1,417 1,765 5,419 4,075 1,296 -68.2 -2,778India 52 40 np np np .. ..Japan 16,735 8,476 7,626 15,310 13,260 -13.4 -2,050Malaysia np np np 1,231 311 -74.7 -920Netherlands 2,800 2,377 10,086 9,747 5,132 -47.3 -4,614New Zealand np 1,073 np 879 2,929 233.3 2,050Republic of Korea 274 623 361 np 204 .. ..Singapore 13,882 13,297 32,112 22,266 4,360 -80.4 -17,907Switzerland 1,638 1,589 258 8,084 1,208 -85.1 -6,876Thailand np 780 np 126 224 78.7 99United Kingdom 9,082 11,110 11,239 692 12,780 .. 12,087United States 26,890 34,288 19,068 35,450 25,866 -27.0 -9,584
ASEAN 16,382 15,478 33,525 23,625 4,898 -79.3 -18,727European Union 16,670 18,104 26,648 16,032 28,216 76.0 12,184Total 96,765 103,717 142,915 116,771 96,379 -17.5 -20,392
Canada -183 312 266 128 -581 .. -709China 512 904 np -103 np .. ..France 126 np np np 246 .. ..Germany np 654 673 1,150 644 -43.9 -505Hong Kong (SAR of China) -189 np -104 np 632 .. ..India np np np -30 np .. ..Japan 3,667 3,605 3,507 2,894 3,893 34.5 998Malaysia np np np np np .. ..Netherlands 203 224 360 -6 34 .. 40New Zealand np -256 np np np .. ..Republic of Korea -10 np 91 np np .. ..Singapore 629 np -366 84 955 .. 871Switzerland 1,884 1,466 734 -256 315 .. 570Thailand np np np np np .. ..United Kingdom -12 1,264 1,893 1,264 598 -52.7 -666United States 6,700 4,915 4,163 2,470 2,037 -17.5 -433
ASEAN 1,321 569 -302 85 817 857.7 732European Union 1,918 3,148 3,298 3,057 2,154 -29.5 -903Total 17,787 18,457 14,818 14,778 16,060 8.7 1,282
TABLE 3: GROSS INJECTIONS AND WITHDRAWALS OF NET INFLOWS OF FOREIGN DIRECT INVESTMENT IN AUSTRALIA BY SELECTED COUNTRIES
(A$ million)
Injections of foreign direct investment in Australia (a)
Reinvested earnings (b)

Page 52
% change $ change
2015 to 2015 to2012 2013 2014 2015 2016 2016 2016
Canada 793 5,411 1,004 3,197 -1,171 .. -4,368China 106 10 np 3,059 np .. ..France 863 1,702 np 882 1,846 109.2 964Germany np 2,754 1,749 2,252 1,854 -17.7 -398Hong Kong (SAR of China) 1,435 np 2,508 np 1,757 .. ..India np np -8 np 123 .. ..Japan 8,673 5,114 5,379 4,457 6,910 55.0 2,453Malaysia 206 115 np np np .. ..Netherlands 858 1,600 1,276 6,538 2,280 -65.1 -4,258New Zealand 738 629 1,077 np np .. ..Republic of Korea 54 np -43 170 np .. ..Singapore 12,422 np 27,455 21,844 2,526 -88.4 -19,318Switzerland 2,929 2,127 10,248 6,858 1,202 -82.5 -5,656Thailand np np 475 np 834 .. ..United Kingdom -1,224 2,037 14,090 17,383 3,410 -80.4 -13,973United States 19,873 13,756 12,568 20,933 16,545 -21.0 -4,388
ASEAN 12,742 12,224 28,611 25,219 3,486 -86.2 -21,733European Union 4,739 9,842 26,516 27,421 14,048 -48.8 -13,373Total 57,037 63,854 112,995 105,624 47,614 -54.9 -58,010
Canada 2,387 -3,226 5,387 186 2,574 .. 2,387China 3,442 6,154 9,855 3,378 3,858 14.2 480France 349 -1,165 492 92 58 -37.0 -34Germany 161 72 1,022 880 735 -16.5 -145Hong Kong (SAR of China) -207 1,096 2,807 2,790 171 -93.9 -2,619India 70 -35 24 -110 -25 -77.5 85Japan 11,729 6,966 5,755 13,747 10,243 -25.5 -3,504Malaysia 2,082 1,705 579 986 33 -96.7 -953Netherlands 2,144 1,001 9,170 3,203 2,887 -9.9 -316New Zealand -570 188 -291 508 1,904 274.6 1,396Republic of Korea 209 552 495 10 357 .. 347Singapore 2,089 1,577 4,292 506 2,789 450.8 2,282Switzerland 592 928 -9,256 970 321 -66.9 -649Thailand 849 564 np np np .. ..United Kingdom 10,295 10,337 -958 -15,426 9,968 .. 25,394United States 13,716 25,447 10,664 16,987 11,358 -33.1 -5,629
ASEAN 4,962 3,822 4,611 -1,509 2,229 .. 3,738European Union 13,849 11,410 3,430 -8,332 16,323 .. 24,654Total 57,516 58,321 44,738 25,926 64,825 150.0 38,899(a) A negative injection can occur for foreign direct investment in Australia when the foreign parent company borrows funds from the direct investmenterprise in Australia (i.e. its affiliate in Australia). (b) A negative reinvested earnings can occur when the direct investment enterprise in Australiamakes a loss, or its dividends are larger than its net earnings. (c) A negative withdrawal of foreign direct investment in Australia can occur when the foreign company repays funds it has borrowed from its affiliate in Australia.For more information refer to the Explanatory notes in this publication.
Based on ABS catalogue 5352.0 and unpublished ABS data.
Net inflows of foreign direct investment in Australia
TABLE 3: GROSS INJECTIONS AND WITHDRAWALS OF NET INFLOWS OF FOREIGN DIRECT INVESTMENT IN AUSTRALIA BY SELECTED COUNTRIES (cont'd)
(A$ million)
Withdrawals of foreign direct investment in Australia (c)

Page 53
% change $ change
2015 to 2015 to2012 2013 2014 2015 2016 2016 2016
Brazil np np np np 353 .. ..Canada 1,512 2,639 13,853 np np .. ..China 777 622 791 1,307 np .. ..France np np 537 -9 331 .. 340Germany np 128 np -67 253 .. 320Hong Kong (SAR of China) 1,222 np 117 1,355 492 -63.7 -864India 529 19 np 47 35 -25.1 -12Japan np 276 np 178 np .. ..Malaysia 501 353 720 np 279 .. ..Netherlands 1,153 np np np np .. ..New Zealand 813 3,115 4,054 2,762 2,270 -17.8 -492Papua New Guinea 1,153 np 223 np np .. ..Republic of Korea np np np np -5 .. ..Singapore 5,867 np 7,880 13,038 7,383 -43.4 -5,655Switzerland np np np np np .. ..Thailand 15 33 np np 23 .. ..United Kingdom 6,243 -1,851 3,033 -4,272 np .. ..United States 4,852 3,434 32,245 11,977 8,622 -28.0 -3,355
ASEAN 7,118 7,359 9,644 14,808 7,992 -46.0 -6,816European Union 8,339 -714 5,587 -3,578 4,027 .. ..Total 41,162 35,597 93,391 49,086 32,719 -33.3 -16,367
Brazil -213 -163 317 152 np .. ..Canada np np 990 np np .. ..China 49 np 143 305 np .. ..France -30 np 67 np np .. ..Germany np np np np np .. ..Hong Kong (SAR of China) np np 319 349 203 -41.8 -146India np np np 78 56 -27.4 -21Japan np np np np 101 .. ..Malaysia np 300 347 np 432 .. ..Netherlands np 91 np np np .. ..New Zealand 2,711 2,709 2,275 1,726 1,556 -9.8 -170Papua New Guinea np np np 48 np .. ..Republic of Korea np np np np np .. ..Singapore 1,564 1,609 np 360 529 46.9 169Switzerland np np np np np .. ..Thailand 15 51 27 39 11 -72.8 -29United Kingdom 565 567 882 403 np .. ..United States 785 625 2,108 -118 -371 213.7 -253
ASEAN 2,562 2,683 2,086 1,127 1,139 1.0 11European Union 2,094 797 1,397 1,573 10,596 573.7 9,023Total 11,341 10,538 10,610 5,330 15,055 182.5 9,726
TABLE 4: GROSS INJECTIONS AND WITHDRAWALS OF NET OUTFLOWS OFAUSTRALIAN DIRECT INVESTMENT ABROAD BY SELECTED COUNTRIES
(A$ million)
Injections of Australian direct investment abroad
Reinvested earnings

Page 54
% change $ change
2015 to 2015 to2012 2013 2014 2015 2016 2016 2016
Brazil np 694 np np np .. ..Canada np np np 1,438 454 -68.5 -985China 100 np 270 1,003 1,300 29.6 297France 104 67 np np np .. ..Germany -37 np 1,004 np np .. ..Hong Kong (SAR of China) np 1,615 -218 1,935 1,350 -30.2 -584India np np 27 17 22 30.1 5Japan 169 np 91 np 53 .. ..Malaysia np 83 444 515 300 -41.7 -214Netherlands np 726 300 np np .. ..New Zealand 3,847 2,515 6,244 4,791 2,603 -45.7 -2,188Papua New Guinea np 268 np np 2,087 .. ..Republic of Korea np np np np np .. ..Singapore 5,946 np np 10,975 7,644 -30.4 -3,331Switzerland np np np np np .. ..Thailand 64 79 np 217 26 -88.1 -191United Kingdom -1,313 6,580 -1,399 3,209 1,030 -67.9 -2,180United States 11,643 -151 34,401 16,228 2,323 -85.7 -13,905
ASEAN 6,662 7,449 9,588 12,519 8,145 -34.9 -4,374European Union -781 8,434 231 5,107 1,995 -60.9 -3,112Total 44,882 44,642 103,660 76,641 39,689 -48.2 -36,952
Brazil -234 np np 603 194 -67.8 -409Canada 1,654 3,466 np -851 -332 -61.0 520China 726 683 664 609 -388 .. -997France np -96 np 125 550 339.6 425Germany 242 174 -809 np 682 .. ..Hong Kong (SAR of China) 1,403 -1,876 654 -230 -655 185.2 -426India 200 33 55 108 70 -35.5 -38Japan -89 161 19 44 np .. ..Malaysia 753 570 622 321 411 28.1 90Netherlands 1,693 np 900 np np .. ..New Zealand -323 3,309 84 -303 1,224 .. 1,526Papua New Guinea 1,550 692 163 -24 -445 .. -421Republic of Korea 2 np np 27 np .. ..Singapore 1,485 1,571 1,371 2,423 268 -88.9 -2,155Switzerland np np np np np .. ..Thailand -34 5 -72 np 8 .. ..United Kingdom 8,121 -7,865 5,314 -7,077 9,941 .. 17,018United States -6,006 4,209 -47 -4,369 5,928 .. 10,297
ASEAN 3,018 2,593 2,142 3,416 986 -71.1 -2,430European Union 11,214 -8,351 6,754 -7,113 12,627 .. 19,740Total 7,621 1,493 341 -22,226 8,086 .. 30,311(a) A negative injection can occur for Australian direct investment abroad when the Australian foreign affiliate lends funds to its parent company inAustralia. (b) A negative reinvested earnings can occur when the direct investment enterprise abroad makes a loss, or its dividends are larger thanits net earnings. (c) A negative withdrawal of Australian direct investment abroad can occur when the Australian parent company repays funds ithas borrowed from the Australian foreign affiliate.For more information refer to the Explanatory notes in this publication.Based on ABS catalogue 5352.0 and unpublished ABS data.
Net outflows of Australian direct investment abroad
TABLE 4: GROSS INJECTIONS AND WITHDRAWALS OF NET OUTFLOWS OFAUSTRALIAN DIRECT INVESTMENT ABROAD BY SELECTED COUNTRIES (cont'd)
(A$ million)
Withdrawals of Australian direct investment abroad

Page 55
Rank in % share 2006 to 2015 to2016 2006 2014 2015 2016 2016 2016 2016
1 United States 383.1 782.6 877.5 860.9 27.0 124.8 -1.92 United Kingdom 359.6 477.7 482.6 515.5 16.1 43.3 6.83 Belgium (a) 24.2 225.8 247.1 270.1 8.5 .. 9.34 Japan 51.7 181.2 200.8 213.5 6.7 313.1 6.35 Hong Kong (SAR of China) 38.9 74.1 85.9 100.9 3.2 159.6 17.56 Singapore 27.4 87.4 98.8 98.9 3.1 260.5 0.27 China 3.5 66.4 75.9 87.2 2.7 .. 15.08 Netherlands 31.0 58.2 66.3 74.7 2.3 140.6 12.69 Luxembourg 5.7 59.0 59.9 74.0 2.3 .. 23.7
10 Switzerland 28.7 50.5 54.2 59.1 1.9 105.6 9.121 India 0.6 11.0 11.6 13.5 0.4 .. 16.4
Total 1,555.3 2,805.5 3,039.1 3,192.4 105.3 5.0
of which: APEC 572.7 1,324.5 1,475.9 1,515.7 47.5 164.7 2.7ASEAN 46.7 118.4 126.8 126.9 4.0 172.0 0.1EU (b) 495.8 948.1 988.9 1,072.2 33.6 116.3 8.4G20 (c) 953.8 2,055.7 2,224.9 2,326.5 72.9 143.9 4.6OECD 1,000.5 2,051.7 2,220.0 2,318.5 72.6 131.7 4.4
(a) The majority of total investment from Belgium is portfolio investment liabilities in the form of debt securities (Belgium hosts a major clearing house and despository for euro-denominated bonds and other securities, Euroclear). (b) EU25 in 2006, EU28 from 2013. (c) Excludes data for Argentina and the Russian Federation in 2006; Brazil 2006, 2014 to 2016 and Mexico 2014 to 2015.Based on ABS catalogue 5352.0.
Rank in % share 2006 to 2015 to2016 2006 2014 2015 2016 2016 2016 2016
1 United States 352.8 574.9 606.9 617.4 28.4 75.0 1.72 United Kingdom 130.4 329.7 351.6 350.5 16.1 168.8 -0.33 Japan 41.6 70.1 94.1 108.3 5.0 160.2 15.14 New Zealand 69.4 99.1 97.8 106.9 4.9 54.0 9.35 China 3.0 57.7 70.5 87.9 4.0 .. 24.66 Germany 25.7 65.5 67.3 65.8 3.0 156.6 -2.27 Singapore 15.1 49.5 64.1 61.5 2.8 307.4 -3.98 France 23.0 42.3 46.4 55.1 2.5 139.0 18.79 Cayman Islands 4.2 39.2 49.2 53.2 2.5 .. 8.1
10 Hong Kong (SAR of China) 16.5 46.3 48.5 52.9 2.4 .. 9.219 India 2.4 9.8 10.7 10.3 0.5 324.4 -3.0
Total 966.0 1,926.0 2,078.5 2,170.8 124.7 4.4
of which: APEC 548.6 1,023.2 1,104.8 1,163.5 53.6 112.1 5.3ASEAN 24.3 83.2 97.8 97.5 4.5 301.4 -0.3EU (a) 257.1 558.9 591.5 611.0 28.1 137.6 3.3G20 (b) 697.2 1,362.0 1,460.2 1,527.9 70.4 119.2 4.6OECD 743.5 1,378.3 1,459.2 1,508.4 69.5 102.9 3.4
(a) EU25 in 2006, EU28 from 2013. (b) Excludes data for Argentina in 2006 and 2016.Based on ABS catalogue 5352.0.
TOTAL STOCKS
TABLE 5: TOP 10 SOURCES - FOREIGN INVESTMENT IN AUSTRALIATOTAL STOCKS
(A$ billion)
% change
TABLE 6: TOP 10 DESTINATIONS - AUSTRALIAN INVESTMENT ABROAD
(A$ billion)
% change
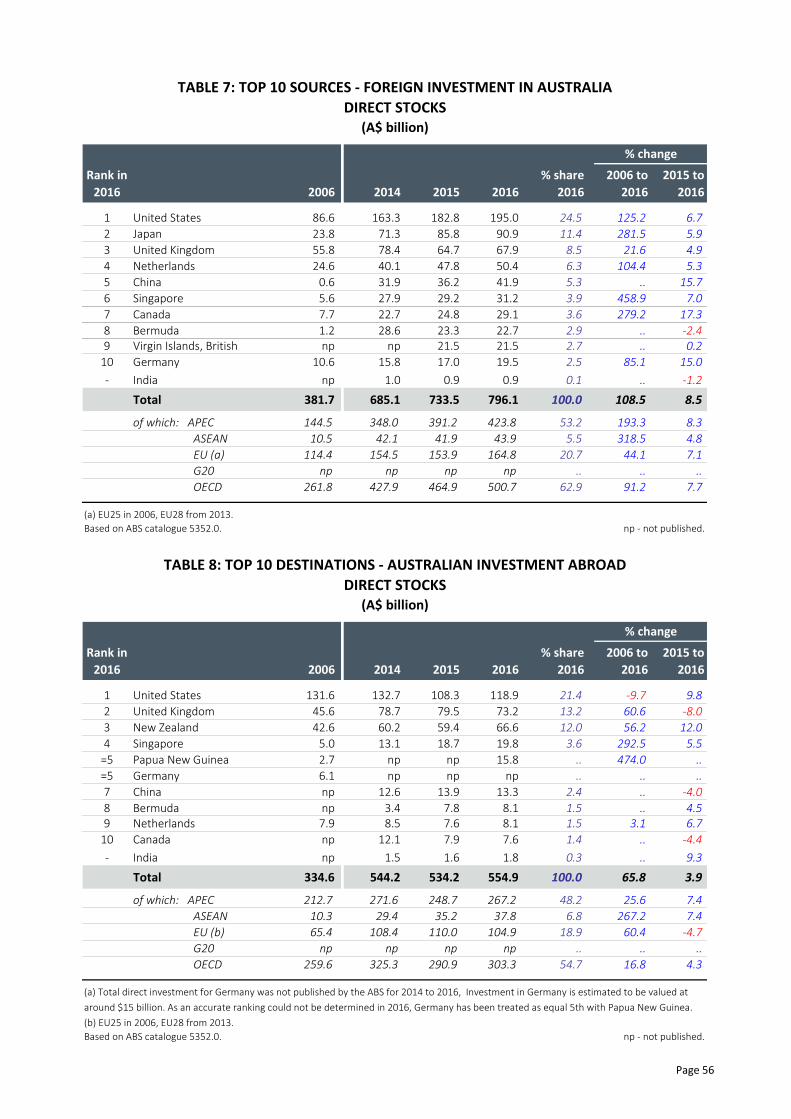
Page 56
Rank in % share 2006 to 2015 to2016 2006 2014 2015 2016 2016 2016 2016
1 United States 86.6 163.3 182.8 195.0 24.5 125.2 6.72 Japan 23.8 71.3 85.8 90.9 11.4 281.5 5.93 United Kingdom 55.8 78.4 64.7 67.9 8.5 21.6 4.94 Netherlands 24.6 40.1 47.8 50.4 6.3 104.4 5.35 China 0.6 31.9 36.2 41.9 5.3 .. 15.76 Singapore 5.6 27.9 29.2 31.2 3.9 458.9 7.07 Canada 7.7 22.7 24.8 29.1 3.6 279.2 17.38 Bermuda 1.2 28.6 23.3 22.7 2.9 .. -2.49 Virgin Islands, British np np 21.5 21.5 2.7 .. 0.2
10 Germany 10.6 15.8 17.0 19.5 2.5 85.1 15.0- India np 1.0 0.9 0.9 0.1 .. -1.2
Total 381.7 685.1 733.5 796.1 100.0 108.5 8.5
of which: APEC 144.5 348.0 391.2 423.8 53.2 193.3 8.3ASEAN 10.5 42.1 41.9 43.9 5.5 318.5 4.8EU (a) 114.4 154.5 153.9 164.8 20.7 44.1 7.1G20 np np np np .. .. ..OECD 261.8 427.9 464.9 500.7 62.9 91.2 7.7
(a) EU25 in 2006, EU28 from 2013.Based on ABS catalogue 5352.0. np - not published.
Rank in % share 2006 to 2015 to2016 2006 2014 2015 2016 2016 2016 2016
1 United States 131.6 132.7 108.3 118.9 21.4 -9.7 9.82 United Kingdom 45.6 78.7 79.5 73.2 13.2 60.6 -8.03 New Zealand 42.6 60.2 59.4 66.6 12.0 56.2 12.04 Singapore 5.0 13.1 18.7 19.8 3.6 292.5 5.5
=5 Papua New Guinea 2.7 np np 15.8 .. 474.0 ..=5 Germany 6.1 np np np .. .. ..7 China np 12.6 13.9 13.3 2.4 .. -4.08 Bermuda np 3.4 7.8 8.1 1.5 .. 4.59 Netherlands 7.9 8.5 7.6 8.1 1.5 3.1 6.7
10 Canada np 12.1 7.9 7.6 1.4 .. -4.4- India np 1.5 1.6 1.8 0.3 .. 9.3
Total 334.6 544.2 534.2 554.9 100.0 65.8 3.9
of which: APEC 212.7 271.6 248.7 267.2 48.2 25.6 7.4ASEAN 10.3 29.4 35.2 37.8 6.8 267.2 7.4EU (b) 65.4 108.4 110.0 104.9 18.9 60.4 -4.7G20 np np np np .. .. ..OECD 259.6 325.3 290.9 303.3 54.7 16.8 4.3
(a) Total direct investment for Germany was not published by the ABS for 2014 to 2016, Investment in Germany is estimated to be valued at around $15 billion. As an accurate ranking could not be determined in 2016, Germany has been treated as equal 5th with Papua New Guinea. (b) EU25 in 2006, EU28 from 2013.Based on ABS catalogue 5352.0. np - not published.
TABLE 8: TOP 10 DESTINATIONS - AUSTRALIAN INVESTMENT ABROADDIRECT STOCKS
(A$ billion)
% change
TABLE 7: TOP 10 SOURCES - FOREIGN INVESTMENT IN AUSTRALIADIRECT STOCKS
(A$ billion)
% change
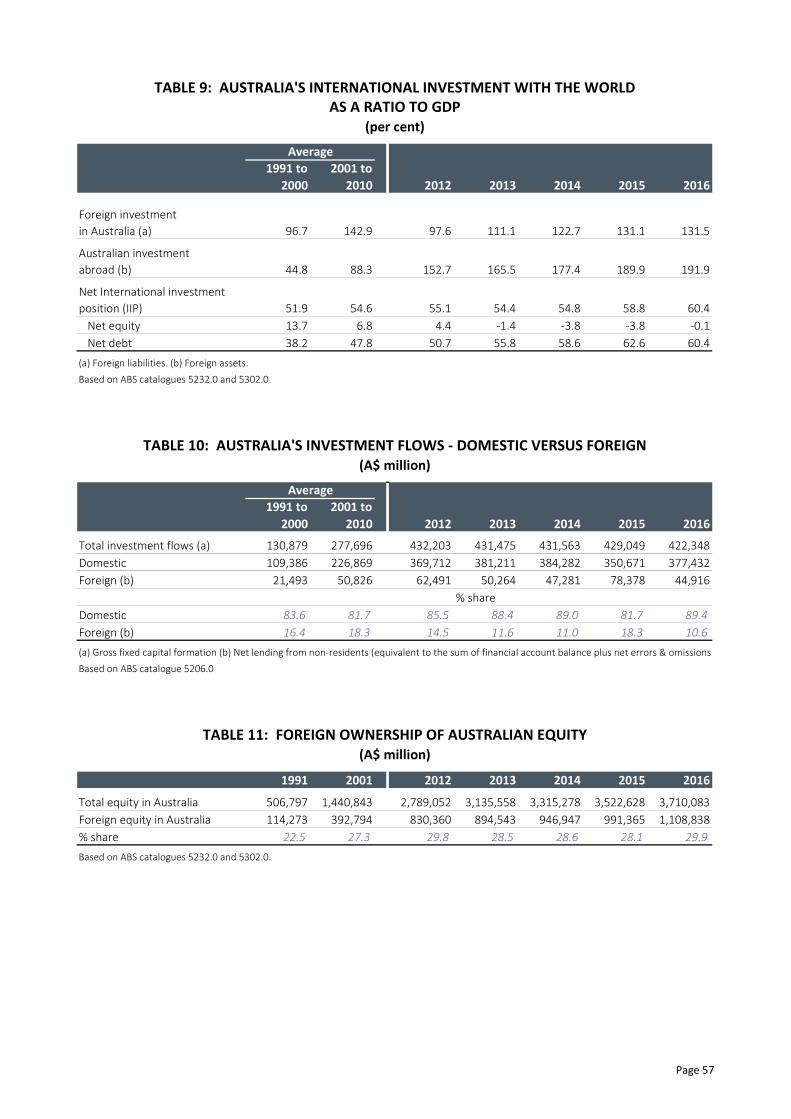
Page 57
1991 to 2001 to2000 2010 2012 2013 2014 2015 2016
Foreign investmentin Australia (a) 96.7 142.9 97.6 111.1 122.7 131.1 131.5
Australian investmentabroad (b) 44.8 88.3 152.7 165.5 177.4 189.9 191.9
Net International investmentposition (IIP) 51.9 54.6 55.1 54.4 54.8 58.8 60.4 Net equity 13.7 6.8 4.4 -1.4 -3.8 -3.8 -0.1 Net debt 38.2 47.8 50.7 55.8 58.6 62.6 60.4
(a) Foreign liabilities. (b) Foreign assets.Based on ABS catalogues 5232.0 and 5302.0.
1991 to 2001 to2000 2010 2012 2013 2014 2015 2016
Total investment flows (a) 130,879 277,696 432,203 431,475 431,563 429,049 422,348Domestic 109,386 226,869 369,712 381,211 384,282 350,671 377,432Foreign (b) 21,493 50,826 62,491 50,264 47,281 78,378 44,916
% shareDomestic 83.6 81.7 85.5 88.4 89.0 81.7 89.4Foreign (b) 16.4 18.3 14.5 11.6 11.0 18.3 10.6
(a) Gross fixed capital formation (b) Net lending from non-residents (equivalent to the sum of financial account balance plus net errors & omissions)Based on ABS catalogue 5206.0
1991 2001 2012 2013 2014 2015 2016
Total equity in Australia 506,797 1,440,843 2,789,052 3,135,558 3,315,278 3,522,628 3,710,083Foreign equity in Australia 114,273 392,794 830,360 894,543 946,947 991,365 1,108,838% share 22.5 27.3 29.8 28.5 28.6 28.1 29.9
Based on ABS catalogues 5232.0 and 5302.0.
Average
TABLE 11: FOREIGN OWNERSHIP OF AUSTRALIAN EQUITY(A$ million)
TABLE 9: AUSTRALIA'S INTERNATIONAL INVESTMENT WITH THE WORLDAS A RATIO TO GDP
(per cent)
Average
TABLE 10: AUSTRALIA'S INVESTMENT FLOWS - DOMESTIC VERSUS FOREIGN(A$ million)

Page 58
Wholly Australian
owned
Foreign ownership
greater than 0% and less than
10%
Foreign ownership
between 10% and 50%
Foreign ownership
greater than 50%
Industry (b)Agriculture, forestry & fishing np np np 0.0Mining 72.6 10.3 5.5 11.6Manufacturing 96.0 0.0 1.2 2.8Electricity, gas, water & waste services 94.4 np np 2.9Construction 98.3 np np 1.4Wholesale trade 92.4 0.2 0.2 7.3Retail trade 97.0 0.0 0.0 2.9Accommodation & food services 94.1 np np 1.7Transport, postal & warehousing 97.6 np np 1.5Information media & telecommunications 88.3 0.1 0.8 10.8Financial & insurance services 96.9 0.1 0.7 2.4Rental, hiring & real estate services 95.0 np np 4.3Professional, scientific & technical services 97.7 0.3 0.5 1.5Administrative & support services 97.3 np np 1.9Health care & social assistance 99.8 0.0 np npArts & recreation services 98.8 np np npOther services 99.2 np np 0.0
Total 97.2 0.3 0.5 2.0
Employment size0–4 persons 97.7 0.3 0.7 1.35–19 persons 97.3 0.4 0.1 2.220–199 persons 93.7 0.2 0.8 5.3200 or more persons 68.7 3.1 2.6 25.6
(a) As at 30 June 2016. (b) Based on ABS ANZSIC 2006.np - not publishedBased on ABS catalogue 8167.0 - Selected Characteristics of Australian Business, 2015-16.
TABLE 12: FOREIGN OWNERSHIP OF AUSTRALIAN BUSINESSES BY INDUSTRYBY EMPLOYMENT SIZE, 2016 (a)
(A$ million)
Per cent of total business

Page 59
Section 3
International investmentcomparisons

Page 60

Page 61
Country 1996 2006 2016 Rank
World 4,135,046 14,090,422 26,728,256United States 1,229,118 1 3,293,053 1 6,391,293 1Hong Kong (SAR of China) 237,992 4 703,563 5 1,590,808 2China 128,069 7 292,559 13 1,354,404 3United Kingdom 228,643 5 1,035,206 2 1,196,520 4Singapore 89,494 11 313,184 10 1,096,320 5Canada 132,978 6 706,901 4 956,065 6Ireland 46,804 16 156,491 19 839,563 7Netherlands 127,384 8 552,748 6 801,136 8Switzerland 53,918 14 268,929 15 793,124 9Germany 316,601 2 799,247 3 771,010 10France 314,647 3 493,763 7 697,579 11British Virgin Islands 1,886 71 82,405 31 633,706 12Brazil 54,846 13 213,021 18 625,876 13Australia 122,702 9 302,079 12 576,037 14Spain 110,224 10 461,528 9 556,604 15Belgium 0 186 481,356 8 474,885 16Mexico 46,912 15 282,215 14 473,520 17Russian Federation 8,145 46 263,903 16 379,035 18Cayman Islands 3,977 56 70,654 36 353,568 19Italy 74,640 12 312,464 11 346,431 20India 8,166 45 70,870 35 318,502 21Sweden 34,835 18 229,992 17 289,659 22Luxembourg 0 187 84,845 29 245,450 23Chile 29,252 22 84,535 30 238,557 24Indonesia 26,871 23 54,534 40 234,961 25
World 4,553,183 15,007,850 26,159,708United States 1,608,340 1 4,470,343 1 6,383,751 1Hong Kong (SAR of China) 99,710 10 680,301 7 1,527,880 2United Kingdom 330,433 4 1,462,874 2 1,443,936 3Japan 258,612 5 449,567 10 1,400,694 4Germany 566,595 2 986,324 3 1,365,375 5China 19,882 20 75,026 26 1,280,975 6France 442,581 3 823,515 4 1,259,385 7Netherlands 194,208 6 803,915 5 1,255,954 8Canada 132,329 8 781,952 6 1,219,992 9Switzerland 141,591 7 569,349 9 1,130,909 10British Virgin Islands 15,034 24 188,140 17 866,764 11Ireland 17,555 22 120,728 20 832,742 12Singapore 39,675 16 270,521 14 682,404 13Spain 41,507 15 436,068 11 516,059 14Italy 117,341 9 313,206 12 460,393 15Belgium 0 130 618,532 8 453,202 16Australia 73,384 11 264,748 15 401,506 17Sweden 72,133 12 276,605 13 382,248 18Russian Federation 4,390 32 232,881 16 335,791 19Taiwan 46,455 13 122,727 19 320,933 20Republic of Korea 17,620 21 49,187 30 306,145 21Luxembourg 0 131 68,578 27 230,037 22Cayman Islands 2,235 41 51,243 29 204,992 23Austria 13,027 25 105,072 23 200,212 24Norway 25,440 18 129,912 18 187,734 25(a) Country rankings include countries acting as financial intermediaries.Source: UNCTADstat database.
Inward stock
Outward stock
TABLE 13: WORLD FOREIGN DIRECT INVESTMENTTOP INFLOW SOURCES AND OUTFLOW DESTINATIONS (a)
(US$ million)
Rank Rank
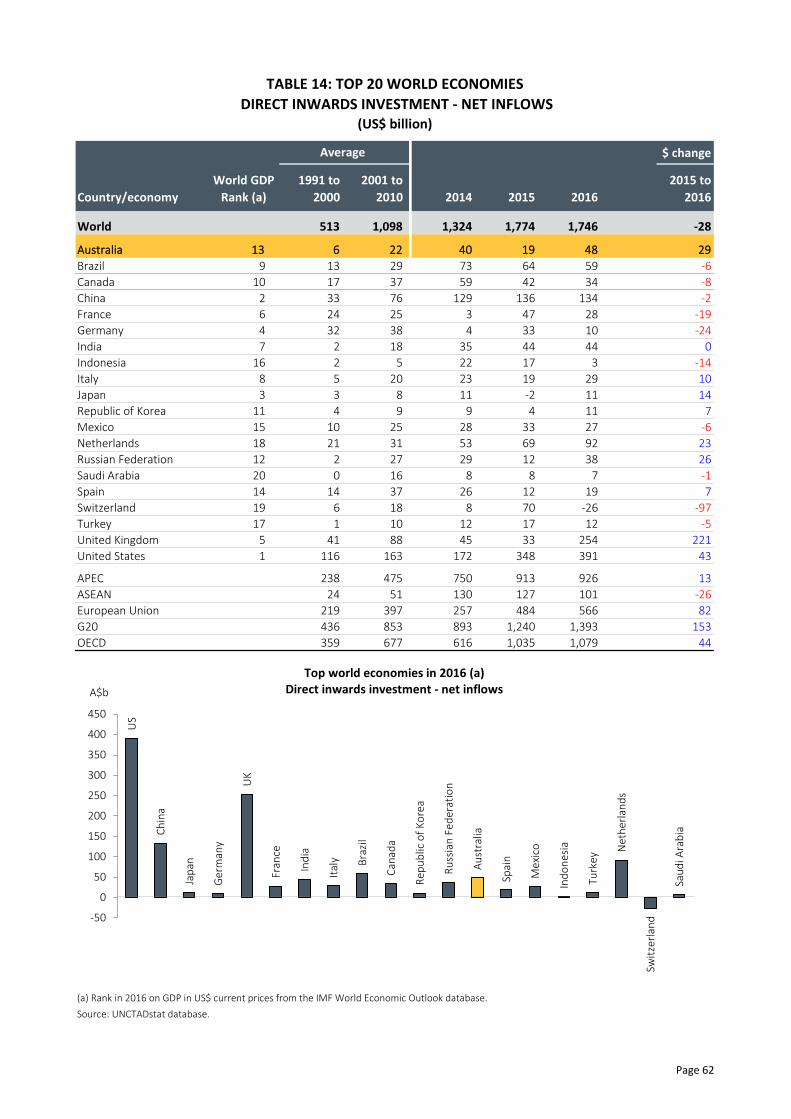
Page 62
TABLE 14: TOP 20 WORLD ECONOMIES DIRECT INWARDS INVESTMENT - NET INFLOWS
(US$ billion)
$ change
World GDP 1991 to 2001 to 2015 toCountry/economy Rank (a) 2000 2010 2014 2015 2016 2016
World 513 1,098 1,324 1,774 1,746 -28
Australia 13 6 22 40 19 48 29Brazil 9 13 29 73 64 59 -6Canada 10 17 37 59 42 34 -8China 2 33 76 129 136 134 -2France 6 24 25 3 47 28 -19Germany 4 32 38 4 33 10 -24India 7 2 18 35 44 44 0Indonesia 16 2 5 22 17 3 -14Italy 8 5 20 23 19 29 10Japan 3 3 8 11 -2 11 14Republic of Korea 11 4 9 9 4 11 7Mexico 15 10 25 28 33 27 -6Netherlands 18 21 31 53 69 92 23Russian Federation 12 2 27 29 12 38 26Saudi Arabia 20 0 16 8 8 7 -1Spain 14 14 37 26 12 19 7Switzerland 19 6 18 8 70 -26 -97Turkey 17 1 10 12 17 12 -5United Kingdom 5 41 88 45 33 254 221United States 1 116 163 172 348 391 43
APEC 238 475 750 913 926 13ASEAN 24 51 130 127 101 -26European Union 219 397 257 484 566 82G20 436 853 893 1,240 1,393 153OECD 359 677 616 1,035 1,079 44
(a) Rank in 2016 on GDP in US$ current prices from the IMF World Economic Outlook database. Source: UNCTADstat database.
Average
US
Chin
a
Japa
n
Ger
man
y
UK
Fran
ce
Indi
a
Italy Br
azil
Cana
da
Repu
blic
of K
orea
Russ
ian
Fede
ratio
n
Aust
ralia
Spai
n
Mex
ico
Indo
nesi
a
Turk
ey
Net
herla
nds
Switz
erla
nd
Saud
i Ara
bia
-50
0
50
100
150
200
250
300
350
400
450
A$b
Top world economies in 2016 (a)Direct inwards investment - net inflows
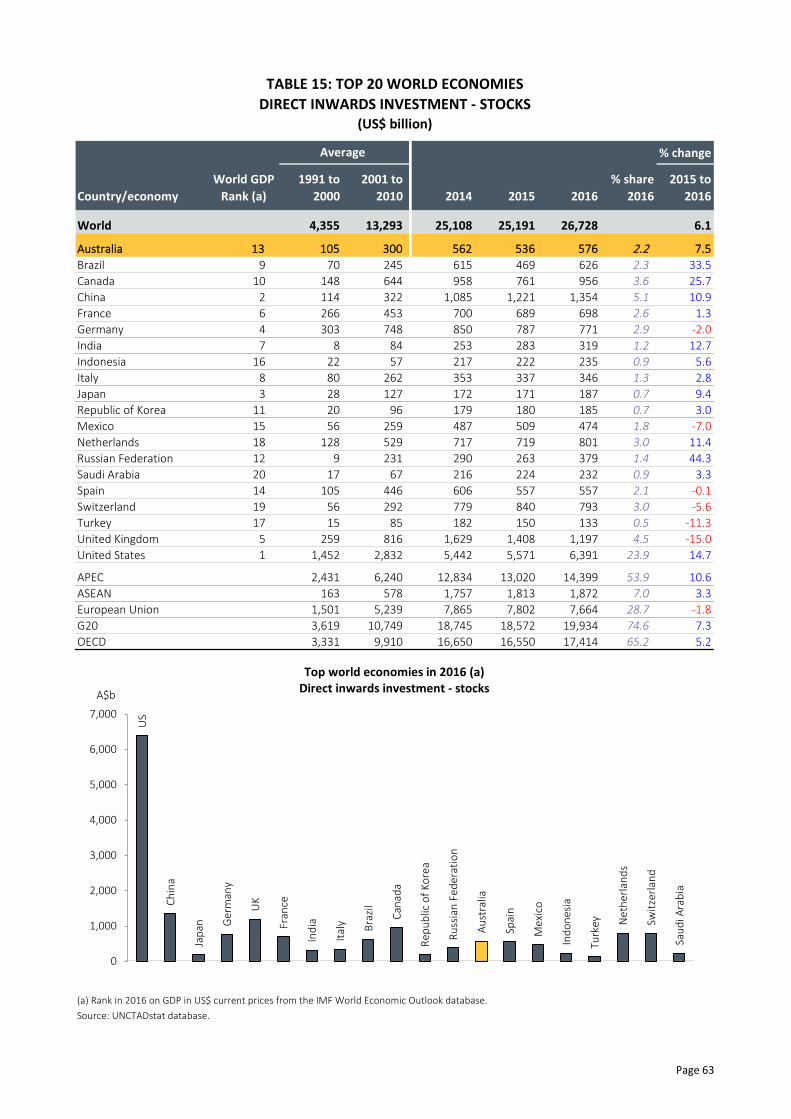
Page 63
TABLE 15: TOP 20 WORLD ECONOMIESDIRECT INWARDS INVESTMENT - STOCKS
(US$ billion)
% change
World GDP 1991 to 2001 to % share 2015 toCountry/economy Rank (a) 2000 2010 2014 2015 2016 2016 2016
World 4,355 13,293 25,108 25,191 26,728 6.1
Australia 13 105 300 562 536 576 2.2 7.5Brazil 9 70 245 615 469 626 2.3 33.5Canada 10 148 644 958 761 956 3.6 25.7China 2 114 322 1,085 1,221 1,354 5.1 10.9France 6 266 453 700 689 698 2.6 1.3Germany 4 303 748 850 787 771 2.9 -2.0India 7 8 84 253 283 319 1.2 12.7Indonesia 16 22 57 217 222 235 0.9 5.6Italy 8 80 262 353 337 346 1.3 2.8Japan 3 28 127 172 171 187 0.7 9.4Republic of Korea 11 20 96 179 180 185 0.7 3.0Mexico 15 56 259 487 509 474 1.8 -7.0Netherlands 18 128 529 717 719 801 3.0 11.4Russian Federation 12 9 231 290 263 379 1.4 44.3Saudi Arabia 20 17 67 216 224 232 0.9 3.3Spain 14 105 446 606 557 557 2.1 -0.1Switzerland 19 56 292 779 840 793 3.0 -5.6Turkey 17 15 85 182 150 133 0.5 -11.3United Kingdom 5 259 816 1,629 1,408 1,197 4.5 -15.0United States 1 1,452 2,832 5,442 5,571 6,391 23.9 14.7
APEC 2,431 6,240 12,834 13,020 14,399 53.9 10.6ASEAN 163 578 1,757 1,813 1,872 7.0 3.3European Union 1,501 5,239 7,865 7,802 7,664 28.7 -1.8G20 3,619 10,749 18,745 18,572 19,934 74.6 7.3OECD 3,331 9,910 16,650 16,550 17,414 65.2 5.2
(a) Rank in 2016 on GDP in US$ current prices from the IMF World Economic Outlook database. Source: UNCTADstat database.
AverageU
S
Chin
a
Japa
n Ger
man
y
UK
Fran
ce
Indi
a
Italy Br
azil
Cana
da
Repu
blic
of K
orea
Russ
ian
Fede
ratio
n
Aust
ralia
Spai
n
Mex
ico
Indo
nesi
a
Turk
ey Net
herla
nds
Switz
erla
nd
Saud
i Ara
bia
0
1,000
2,000
3,000
4,000
5,000
6,000
7,000
A$b
Top world economies in 2016 (a)Direct inwards investment - stocks

Page 64
TABLE 16: TOP 20 WORLD ECONOMIES DIRECT OUTWARDS INVESTMENT - NET OUTFLOWS
(US$ billion)
$ change
World GDP 1991 to 2001 to 2015 toCountry/economy Rank (a) 2000 2010 2014 2015 2016 2016
World 506 1,122 1,253 1,594 1,452 -142
Australia 13 3 10 0 -2 6 8Brazil 9 1 8 2 3 -12 -16Canada 10 17 42 60 67 66 -1China 2 2 26 123 128 183 56France 6 52 63 50 44 57 13Germany 4 46 71 100 93 35 -59India 7 0 9 12 8 5 -2Indonesia 16 1 2 7 6 -12 -18Italy 8 8 34 26 20 23 3Japan 3 23 56 129 129 145 17Republic of Korea 11 3 13 28 24 27 4Mexico 15 0 6 7 11 -1 -12Netherlands 18 30 58 64 138 174 36Russian Federation 12 1 25 64 27 27 0Saudi Arabia 20 0 1 5 5 8 3Spain 14 16 56 36 44 42 -3Switzerland 19 17 40 -1 104 31 -73Turkey 17 0 1 7 5 3 -2United Kingdom 5 79 106 -148 -82 -13 70United States 1 98 219 292 303 299 -4
APEC 184 481 944 841 876 35ASEAN 9 30 89 56 35 -20European Union 293 526 204 536 470 -66G20 447 946 952 1,256 1,220 -36OECD 433 918 758 1,212 1,079 -133
(a) Rank in 2016 on GDP in US$ current prices from the IMF World Economic Outlook database. Source: UNCTADstat database.
Average
US
Chin
a
Japa
n
Ger
man
y
UK
Fran
ce
Indi
a
Italy
Braz
il
Cana
da
Repu
blic
of K
orea
Russ
ian
Fede
ratio
n
Aust
ralia
Spai
n
Mex
ico
Indo
nesi
a
Turk
ey
Net
herla
nds
Switz
erla
nd
Saud
i Ara
bia
-50
0
50
100
150
200
250
300
350
A$b
Top world economies in 2016 (a)Direct outwards investment - net outflows

Page 65
TABLE 17: TOP 20 WORLD ECONOMIESDIRECT OUTWARDS INVESTMENT - STOCKS
(US$ billion)
% change
World GDP 1991 to 2001 to % share 2015 toCountry/economy Rank (a) 2000 2010 2014 2015 2016 2016 2016
World 4,595 13,725 24,686 24,925 26,160 5.0
Australia 13 66 252 446 390 402 1.5 2.9Brazil 9 45 93 176 160 172 0.7 8.0Canada 10 160 687 1,090 1,074 1,220 4.7 13.6China 2 18 115 883 1,098 1,281 4.9 16.7France 6 379 770 1,294 1,255 1,259 4.8 0.4Germany 4 480 962 1,384 1,376 1,365 5.2 -0.8India 7 1 34 132 139 144 0.6 3.7Indonesia 16 5 1 25 29 59 0.2 100.6Italy 8 120 317 491 467 460 1.8 -1.5Japan 3 258 494 1,152 1,227 1,401 5.4 14.2Republic of Korea 11 13 62 261 286 306 1.2 7.1Mexico 15 5 69 147 146 149 0.6 1.5Netherlands 18 185 713 1,045 1,117 1,256 4.8 12.4Russian Federation 12 6 186 330 283 336 1.3 18.8Saudi Arabia 20 3 14 45 63 80 0.3 27.4Spain 14 51 400 527 491 516 2.0 5.1Switzerland 19 141 557 1,085 1,130 1,131 4.3 0.1Turkey 17 2 12 40 35 38 0.1 9.1United Kingdom 5 409 1,403 1,682 1,558 1,444 5.5 -7.3United States 1 1,647 3,605 6,225 6,006 6,384 24.4 6.3
APEC 2,427 6,554 13,322 13,408 14,471 55.3 7.9ASEAN 49 304 923 941 1,013 3.9 7.6European Union 1,892 6,125 9,018 9,076 9,111 34.8 0.4G20 4,156 11,817 20,151 20,204 21,294 81.4 5.4OECD 4,124 11,948 19,584 19,502 20,317 77.7 4.2
(a) Rank in 2016 on GDP in US$ current prices from the IMF World Economic Outlook database. Source: UNCTADstat database.
AverageU
S
Chin
a
Japa
n
Ger
man
y
UK
Fran
ce
Indi
a Italy
Braz
il
Cana
da
Repu
blic
of K
orea
Russ
ian
Fede
ratio
n
Aust
ralia
Spai
n
Mex
ico
Indo
nesi
a
Turk
ey
Net
herla
nds
Switz
erla
nd
Saud
i Ara
bia
0
1,000
2,000
3,000
4,000
5,000
6,000
7,000
A$b
Top world economies in 2016 (a)Direct outwards investment - stocks

Page 66
TABLE 18: TOP 20 WORLD ECONOMIESDIRECT INWARDS INVESTMENT - STOCKS
(per cent of GDP)
World GDP 1991 to 2001 toCountry/economy Rank (a) 2000 2010 2013 2014 2015 2016
Australia 13 28.2 38.5 37.8 38.8 43.7 45.8Brazil 9 11.2 21.3 26.1 25.0 26.0 34.8Canada 10 23.0 52.7 53.3 53.4 49.0 62.5China 2 13.1 11.5 9.9 10.3 10.9 12.1France 6 18.0 19.7 27.1 24.6 28.5 28.3Germany 4 13.9 25.4 25.8 21.9 23.4 22.2India 7 1.9 7.5 12.2 12.4 13.5 14.1Indonesia 16 11.8 11.9 25.2 24.4 25.8 25.2Italy 8 6.6 13.7 17.1 16.4 18.5 18.7Japan 3 0.6 2.6 3.3 3.5 3.9 3.8Republic of Korea 11 4.2 11.1 13.9 12.7 13.0 13.1Mexico 15 11.3 28.8 38.1 37.5 44.2 45.3Netherlands 18 31.3 75.3 89.9 81.4 95.8 103.9Russian Federation 12 .. 22.3 21.1 14.1 19.2 29.6Saudi Arabia 20 11.2 16.6 27.8 28.5 34.4 36.2Spain 14 17.6 37.1 47.0 44.0 46.7 45.2Switzerland 19 19.4 62.6 114.0 110.9 125.2 120.2Turkey 17 6.4 15.0 15.9 19.5 17.4 15.5United Kingdom 5 18.1 33.9 55.6 54.2 49.2 45.5United States 1 17.0 21.6 29.6 31.3 30.9 34.4
APEC 14.0 22.3 27.8 28.7 29.5 31.9ASEAN 26.8 47.6 64.1 69.6 74.3 73.4European Union 16.6 35.1 45.4 42.3 47.8 46.7G20 13.3 24.0 28.4 27.8 29.1 30.7OECD 13.4 25.9 34.0 33.8 35.7 36.7
(a) Rank in 2016 on GDP in US$ current prices from the IMF World Economic Outlook database. Source: ABS data and UNCTADstat database.
Average
Uni
ted
Stat
es
Chin
a
Japa
n
Ger
man
y Uni
ted
King
dom
Fran
ce
Indi
a
Italy
Braz
il
Cana
da
Repu
blic
of K
orea
Russ
ian
Fede
ratio
n
Aust
ralia
Spai
n
Mex
ico
Indo
nesi
a
Turk
ey
Net
herla
nds
Switz
erla
nd
Saud
i Ara
bia
0
20
40
60
80
100
120
140
% of GDP
Top world economies in 2016 (a)Direct inwards investment - stocks
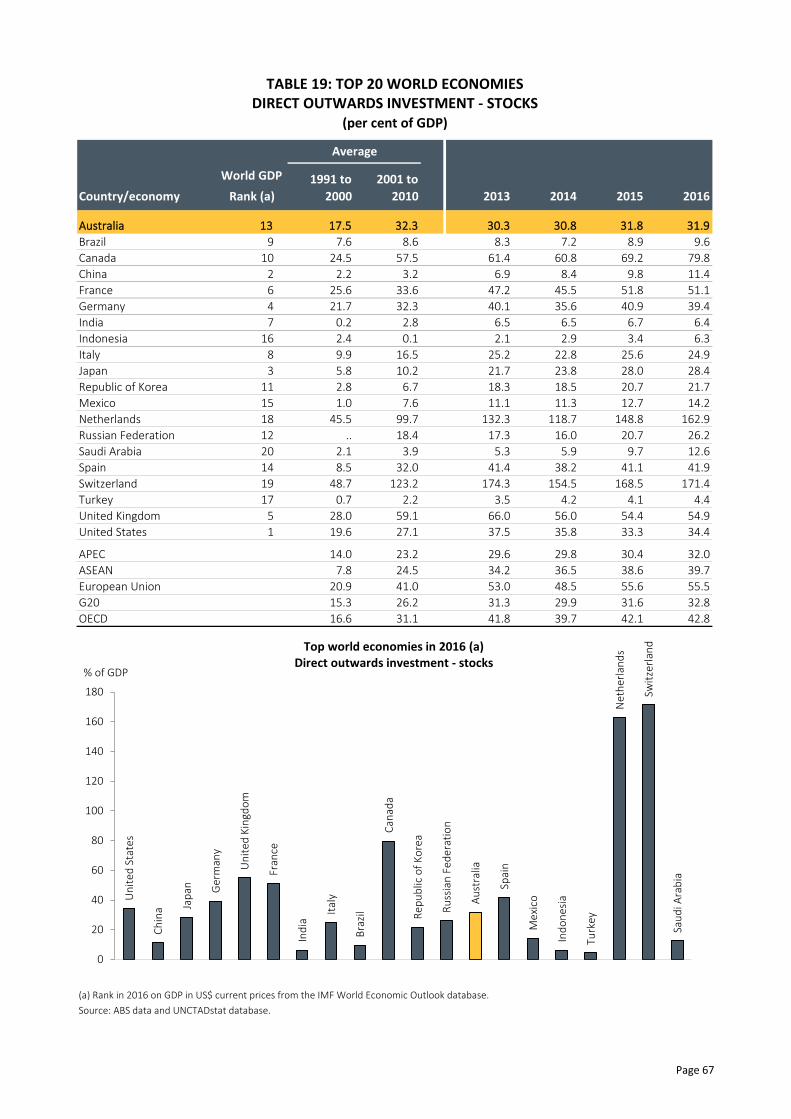
Page 67
TABLE 19: TOP 20 WORLD ECONOMIESDIRECT OUTWARDS INVESTMENT - STOCKS
(per cent of GDP)
World GDP 1991 to 2001 toCountry/economy Rank (a) 2000 2010 2013 2014 2015 2016
Australia 13 17.5 32.3 30.3 30.8 31.8 31.9Brazil 9 7.6 8.6 8.3 7.2 8.9 9.6Canada 10 24.5 57.5 61.4 60.8 69.2 79.8China 2 2.2 3.2 6.9 8.4 9.8 11.4France 6 25.6 33.6 47.2 45.5 51.8 51.1Germany 4 21.7 32.3 40.1 35.6 40.9 39.4India 7 0.2 2.8 6.5 6.5 6.7 6.4Indonesia 16 2.4 0.1 2.1 2.9 3.4 6.3Italy 8 9.9 16.5 25.2 22.8 25.6 24.9Japan 3 5.8 10.2 21.7 23.8 28.0 28.4Republic of Korea 11 2.8 6.7 18.3 18.5 20.7 21.7Mexico 15 1.0 7.6 11.1 11.3 12.7 14.2Netherlands 18 45.5 99.7 132.3 118.7 148.8 162.9Russian Federation 12 .. 18.4 17.3 16.0 20.7 26.2Saudi Arabia 20 2.1 3.9 5.3 5.9 9.7 12.6Spain 14 8.5 32.0 41.4 38.2 41.1 41.9Switzerland 19 48.7 123.2 174.3 154.5 168.5 171.4Turkey 17 0.7 2.2 3.5 4.2 4.1 4.4United Kingdom 5 28.0 59.1 66.0 56.0 54.4 54.9United States 1 19.6 27.1 37.5 35.8 33.3 34.4
APEC 14.0 23.2 29.6 29.8 30.4 32.0ASEAN 7.8 24.5 34.2 36.5 38.6 39.7European Union 20.9 41.0 53.0 48.5 55.6 55.5G20 15.3 26.2 31.3 29.9 31.6 32.8OECD 16.6 31.1 41.8 39.7 42.1 42.8
(a) Rank in 2016 on GDP in US$ current prices from the IMF World Economic Outlook database. Source: ABS data and UNCTADstat database.
Average
Uni
ted
Stat
es
Chin
a Japa
n Ger
man
y
Uni
ted
King
dom
Fran
ce
Indi
a
Italy
Braz
il
Cana
da
Repu
blic
of K
orea
Russ
ian
Fede
ratio
n
Aust
ralia
Spai
n
Mex
ico
Indo
nesi
a
Turk
ey
Net
herla
nds
Switz
erla
nd
Saud
i Ara
bia
0
20
40
60
80
100
120
140
160
180
% of GDP
Top world economies in 2016 (a)Direct outwards investment - stocks

Page 68

Page 69
Section 4
Australia's international investmentDetailed tables

Page 70

Page 71
% share 2006 to 2015 to2006 2014 2015 2016 2016 2016 2016
Selected countriesBelgium 25,798 228,389 250,550 273,357 5.1 959.6 9.1Bermuda 12,216 40,367 39,700 43,722 0.8 257.9 10.1Brazil np np np np .. .. ..Canada 39,345 78,348 80,636 85,018 1.6 116.1 5.4Cayman Islands 4,857 53,259 64,203 65,608 1.2 .. 2.2China 6,551 124,106 146,407 175,107 3.3 .. 19.6France 46,232 63,741 68,727 83,393 1.6 80.4 21.3Germany 50,323 106,045 108,301 104,610 2.0 107.9 -3.4Hong Kong (SAR of China) 55,365 120,380 134,398 153,864 2.9 177.9 14.5India 3,047 20,816 22,285 23,874 0.4 683.5 7.1Indonesia 3,598 9,420 9,841 10,396 0.2 188.9 5.6Ireland 5,527 25,439 30,438 39,036 0.7 606.3 28.2Italy 4,001 7,677 7,374 6,303 0.1 57.5 -14.5Japan 93,312 251,345 294,917 321,809 6.0 244.9 9.1Luxembourg 7,591 76,248 77,584 91,681 1.7 .. 18.2Malaysia 6,423 30,862 29,112 29,156 0.5 353.9 0.2Mexico 1,026 np np 6,014 0.1 486.2 ..Netherlands 63,160 96,357 106,060 116,837 2.2 85.0 10.2New Zealand 105,131 135,774 137,505 153,114 2.9 45.6 11.4Papua New Guinea 3,782 18,923 17,921 19,041 0.4 403.5 6.2Philippines 3,887 10,188 10,452 10,573 0.2 172.0 1.2Republic of Korea 11,857 37,221 38,610 40,988 0.8 245.7 6.2Russian Federation np 1,799 1,407 2,026 0.0 .. 44.0Saudi Arabia 122 2,153 1,994 5,113 0.1 .. 156.4Singapore 42,538 136,939 162,805 160,431 3.0 277.1 -1.5South Africa 1,603 10,119 9,980 12,060 0.2 652.3 20.8Spain np 6,617 7,402 6,094 0.1 .. -17.7Sweden 4,879 13,881 14,552 17,584 0.3 260.4 20.8Switzerland 38,747 77,190 74,095 79,568 1.5 105.4 7.4Taiwan 6,511 13,216 13,189 18,551 0.3 184.9 40.7Thailand 1,378 9,559 7,482 7,563 0.1 448.8 1.1United Arab Emirates np 21,096 13,745 13,632 0.3 .. -0.8United Kingdom 490,059 807,465 834,196 866,045 16.1 76.7 3.8United States 735,818 1,357,485 1,484,447 1,478,353 27.6 100.9 -0.4Vietnam np 1,778 1,924 2,605 0.0 .. 35.4Virgin Islands, British np 21,358 24,548 28,681 0.5 .. 16.8
Country Groups Asia (a) 247,602 768,632 874,431 958,621 17.9 287.2 9.6APEC 1,121,277 2,347,716 2,580,721 2,679,177 50.0 138.9 3.8ASEAN 70,959 201,548 224,625 224,428 4.2 216.3 -0.1European Union (b) 752,871 1,506,973 1,580,446 1,683,218 31.4 123.6 6.5G20 (c) 1,650,970 3,417,684 3,685,114 3,854,401 71.9 133.5 4.6OECD 1,744,016 3,429,985 3,679,253 3,826,849 71.4 119.4 4.0Total all countries 2,521,331 4,731,430 5,117,587 5,363,232 112.7 4.8(a) Major Asian economies only - includes: China; Hong Kong (SAR of China); India; Japan; Republic of Korea; Taiwan and all ASEAN members.(b) EU25 in 2006, EU28 from 2014. (c) Excludes FIA data for Brazil all years; Argentina and the Russian Federation in 2006 and Mexico in 2014 and2015; excludes AIA data for Argentina in 2006 and 2016.Based on ABS catalogue 5352.0. np - not published.
TABLE 20.1: AUSTRALIA'S TWO-WAY INVESTMENT RELATIONSHIP - STOCKS BY SELECTED COUNTRIES AND REGIONS
(A$ million)
% change

Page 72
$ change
2015 to2006 2014 2015 2016 2016
Selected countriesBelgium 3,007 15,654 27,600 29,863 2,263Bermuda 1,170 np -5,928 2,793 8,721Brazil np np 581 85 -496Canada -778 2,853 -2,186 335 2,521Cayman Islands 229 2,584 1,005 -4,521 -5,526China 1,281 13,923 8,377 7,499 -878France 4,442 -3,948 -4,885 477 5,362Germany 4,888 -363 -5,485 -3,061 2,424Hong Kong (SAR of China) 6,824 7,046 7,302 8,990 1,688India 232 215 966 2,056 1,090Indonesia -49 196 81 -155 -236Ireland -672 -2,441 4,031 3,551 -480Italy -136 117 9 -1,351 -1,360Japan 4,894 12,395 15,237 13,827 -1,410Luxembourg 211 -2,419 2,106 13,090 10,984Malaysia 581 1,499 -550 -523 27Mexico 18 np -18 125 143Netherlands 1,106 10,208 2,790 6,562 3,772New Zealand 5,608 781 -1,700 1,143 2,843Papua New Guinea 106 -292 -75 1,368 1,443Philippines np -270 -123 815 938Republic of Korea 416 2,753 958 -107 -1,065Russian Federation np np 131 -29 -160Saudi Arabia -23 -4,444 -93 np ..Singapore 5,792 9,849 7,608 -1,599 -9,207South Africa 294 1,229 439 1,157 718Spain 399 np -108 -79 29Sweden 347 560 351 567 216Switzerland 10,278 -6,147 1,283 1,565 282Taiwan 926 -230 914 4,785 3,871Thailand 89 -118 -2,872 -1,110 1,762United Arab Emirates np -18,738 -9,044 -1,170 7,874United Kingdom 25,854 -81,435 -84,535 -47,977 36,558United States 10,995 32,924 68,071 -66,381 -134,452Vietnam np 123 -114 253 367Virgin Islands, British 1,883 307 3,702 1,050 -2,652
Country Groups Asia (a) 23,217 47,925 38,089 34,755 -3,334APEC 36,357 79,937 101,089 -31,246 -132,335ASEAN 8,644 11,823 4,335 -2,295 -6,630European Union (b) 40,345 -70,673 -57,773 -2,946 54,827G20 (c) 57,604 -8,597 34,808 -44,576 -79,384OECD 70,997 -18,151 26,594 -51,321 -77,915Total all countries 173,188 69,932 84,929 -25,981 -110,910(a) Major Asian economies only - includes: China; Hong Kong (SAR of China); India; Japan; Republic of Korea; Taiwan and all ASEAN members(b) EU25 in 2006, EU28 from 2014. (c) Excludes data for Brazil and the Russian Federation in 2006; Brazil, Mexico and the Russian Federation in 2014 and Saudi Arabia in 2016.Based on ABS catalogue 5352.0. np - not published.
TABLE 20.2: FOREIGN INVESTMENT IN AUSTRALIA - NET INFLOWSBY SELECTED COUNTRIES AND REGIONS
(A$ million)
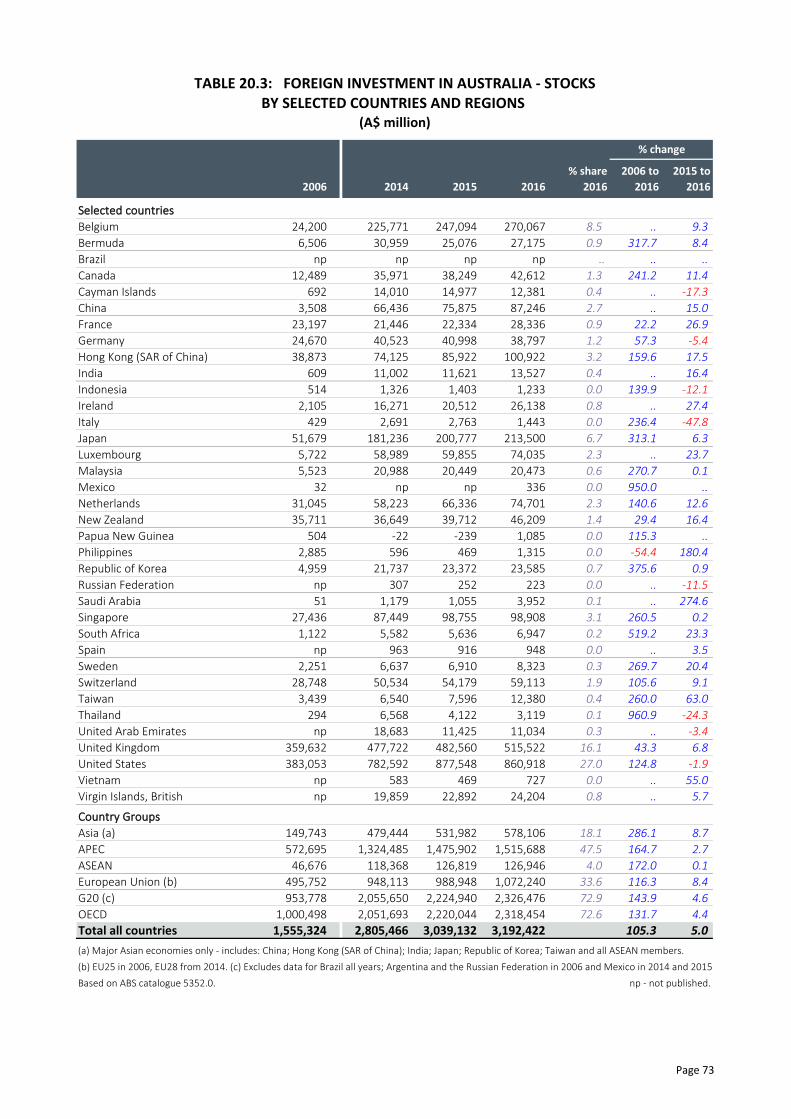
Page 73
% share 2006 to 2015 to2006 2014 2015 2016 2016 2016 2016
Selected countriesBelgium 24,200 225,771 247,094 270,067 8.5 .. 9.3Bermuda 6,506 30,959 25,076 27,175 0.9 317.7 8.4Brazil np np np np .. .. ..Canada 12,489 35,971 38,249 42,612 1.3 241.2 11.4Cayman Islands 692 14,010 14,977 12,381 0.4 .. -17.3China 3,508 66,436 75,875 87,246 2.7 .. 15.0France 23,197 21,446 22,334 28,336 0.9 22.2 26.9Germany 24,670 40,523 40,998 38,797 1.2 57.3 -5.4Hong Kong (SAR of China) 38,873 74,125 85,922 100,922 3.2 159.6 17.5India 609 11,002 11,621 13,527 0.4 .. 16.4Indonesia 514 1,326 1,403 1,233 0.0 139.9 -12.1Ireland 2,105 16,271 20,512 26,138 0.8 .. 27.4Italy 429 2,691 2,763 1,443 0.0 236.4 -47.8Japan 51,679 181,236 200,777 213,500 6.7 313.1 6.3Luxembourg 5,722 58,989 59,855 74,035 2.3 .. 23.7Malaysia 5,523 20,988 20,449 20,473 0.6 270.7 0.1Mexico 32 np np 336 0.0 950.0 ..Netherlands 31,045 58,223 66,336 74,701 2.3 140.6 12.6New Zealand 35,711 36,649 39,712 46,209 1.4 29.4 16.4Papua New Guinea 504 -22 -239 1,085 0.0 115.3 ..Philippines 2,885 596 469 1,315 0.0 -54.4 180.4Republic of Korea 4,959 21,737 23,372 23,585 0.7 375.6 0.9Russian Federation np 307 252 223 0.0 .. -11.5Saudi Arabia 51 1,179 1,055 3,952 0.1 .. 274.6Singapore 27,436 87,449 98,755 98,908 3.1 260.5 0.2South Africa 1,122 5,582 5,636 6,947 0.2 519.2 23.3Spain np 963 916 948 0.0 .. 3.5Sweden 2,251 6,637 6,910 8,323 0.3 269.7 20.4Switzerland 28,748 50,534 54,179 59,113 1.9 105.6 9.1Taiwan 3,439 6,540 7,596 12,380 0.4 260.0 63.0Thailand 294 6,568 4,122 3,119 0.1 960.9 -24.3United Arab Emirates np 18,683 11,425 11,034 0.3 .. -3.4United Kingdom 359,632 477,722 482,560 515,522 16.1 43.3 6.8United States 383,053 782,592 877,548 860,918 27.0 124.8 -1.9Vietnam np 583 469 727 0.0 .. 55.0Virgin Islands, British np 19,859 22,892 24,204 0.8 .. 5.7
Country Groups Asia (a) 149,743 479,444 531,982 578,106 18.1 286.1 8.7APEC 572,695 1,324,485 1,475,902 1,515,688 47.5 164.7 2.7ASEAN 46,676 118,368 126,819 126,946 4.0 172.0 0.1European Union (b) 495,752 948,113 988,948 1,072,240 33.6 116.3 8.4G20 (c) 953,778 2,055,650 2,224,940 2,326,476 72.9 143.9 4.6OECD 1,000,498 2,051,693 2,220,044 2,318,454 72.6 131.7 4.4Total all countries 1,555,324 2,805,466 3,039,132 3,192,422 105.3 5.0(a) Major Asian economies only - includes: China; Hong Kong (SAR of China); India; Japan; Republic of Korea; Taiwan and all ASEAN members.(b) EU25 in 2006, EU28 from 2014. (c) Excludes data for Brazil all years; Argentina and the Russian Federation in 2006 and Mexico in 2014 and 2015Based on ABS catalogue 5352.0. np - not published.
% change
(A$ million)
TABLE 20.3: FOREIGN INVESTMENT IN AUSTRALIA - STOCKSBY SELECTED COUNTRIES AND REGIONS

Page 74
$ change
2015 to2006 2014 2015 2016 2016
Selected countriesBelgium -131 -57 275 -244 -519Bermuda 1,042 -4,786 841 582 -259Brazil 260 1,660 -277 13 290Canada 10,566 1,673 2,283 -3,162 -5,445Cayman Islands 393 5,107 6,163 4,619 -1,544China 618 18,732 10,909 15,726 4,817France 5,375 -574 -1,040 2,971 4,011Germany 4,835 -3,659 -3,773 -2,383 1,390Hong Kong (SAR of China) 3,654 7,264 -3,275 -590 2,685India 1,254 1,118 1,043 -374 -1,417Indonesia 6 264 112 12 -100Ireland 509 2,537 -455 2,305 2,760Italy -1 -222 -648 589 1,237Japan 11,479 15,680 18,042 8,308 -9,734Luxembourg -327 553 325 406 81Malaysia 113 79 19 243 224Mexico -47 715 -101 758 859Netherlands 3,669 1,821 493 1,578 1,085New Zealand 6,796 -3,585 -6,272 -1,817 4,455Papua New Guinea 791 122 -377 -119 258Philippines -78 673 558 -776 -1,334Republic of Korea 1,822 2,506 -1,556 822 2,378Russian Federation -46 -90 -463 234 697Saudi Arabia 14 -29 28 279 251Singapore 4,075 5,682 6,472 -6,779 -13,251South Africa -82 -368 163 158 -5Spain 589 676 669 -1,211 -1,880Sweden 348 1,092 58 1,446 1,388Switzerland 4,784 3,083 -10,260 -2,277 7,983Taiwan 650 423 -1,194 -145 1,049Thailand 191 -221 381 516 135United Arab Emirates 71 874 -314 -190 124United Kingdom 22,013 -48,504 -63,495 -60,209 3,286United States 27,877 13,145 1,733 -25,136 -26,869Vietnam 88 2 21 246 225Virgin Islands, British 9 -119 254 1,099 845
Country Groups Asia (a) 24,431 52,069 31,374 17,865 -13,509APEC 70,124 57,451 27,418 -11,977 -39,395ASEAN 4,954 6,346 7,405 -5,882 -13,287European Union (b) 35,315 -47,421 -69,807 -46,388 23,419G20 (c) 89,397 7,371 -38,081 -48,145 -10,064OECD 100,292 -11,767 -62,570 -77,158 -14,588Total all countries 115,221 24,016 13,169 -70,910 -84,079(a) Major Asian economies only - includes: China; Hong Kong (SAR of China); India; Japan; Republic of Korea; Taiwan and all ASEAN members(b) EU25 in 2006, EU28 from 2014. (c) Excludes data for Argentina in 2014.Based on ABS catalogue 5352.0. np - not published.
(A$ million)
TABLE 20.4: AUSTRALIAN INVESTMENT ABROAD - NET OUTFLOWSBY SELECTED COUNTRIES AND REGIONS

Page 75
% share 2006 to 2015 to2006 2014 2015 2016 2016 2016 2016
Selected countriesBelgium 1,598 2,618 3,456 3,290 0.2 105.9 -4.8Bermuda 5,710 9,408 14,624 16,547 0.8 189.8 13.1Brazil 1,209 11,033 7,762 9,214 0.4 662.1 18.7Canada 26,856 42,377 42,387 42,406 2.0 57.9 0.0Cayman Islands 4,165 39,249 49,226 53,227 2.5 .. 8.1China 3,043 57,670 70,532 87,861 4.0 .. 24.6France 23,035 42,295 46,393 55,057 2.5 139.0 18.7Germany 25,653 65,522 67,303 65,813 3.0 156.6 -2.2Hong Kong (SAR of China) 16,492 46,255 48,476 52,942 2.4 221.0 9.2India 2,438 9,814 10,664 10,347 0.5 324.4 -3.0Indonesia 3,084 8,094 8,438 9,163 0.4 197.1 8.6Ireland 3,422 9,168 9,926 12,898 0.6 276.9 29.9Italy 3,572 4,986 4,611 4,860 0.2 36.1 5.4Japan 41,633 70,109 94,140 108,309 5.0 160.2 15.1Luxembourg 1,869 17,259 17,729 17,646 0.8 844.1 -0.5Malaysia 900 9,874 8,663 8,683 0.4 864.8 0.2Mexico 994 5,328 5,061 5,678 0.3 471.2 12.2Netherlands 32,115 38,134 39,724 42,136 1.9 31.2 6.1New Zealand 69,420 99,125 97,793 106,905 4.9 54.0 9.3Papua New Guinea 3,278 18,945 18,160 17,956 0.8 447.8 -1.1Philippines 1,002 9,592 9,983 9,258 0.4 824.0 -7.3Republic of Korea 6,898 15,484 15,238 17,403 0.8 152.3 14.2Russian Federation 521 1,492 1,155 1,803 0.1 246.1 56.1Saudi Arabia 71 974 939 1,161 0.1 .. 23.6Singapore 15,102 49,490 64,050 61,523 2.8 307.4 -3.9South Africa 481 4,537 4,344 5,113 0.2 963.0 17.7Spain 4,068 5,654 6,486 5,146 0.2 26.5 -20.7Sweden 2,628 7,244 7,642 9,261 0.4 252.4 21.2Switzerland 9,999 26,656 19,916 20,455 0.9 104.6 2.7Taiwan 3,072 6,676 5,593 6,171 0.3 100.9 10.3Thailand 1,084 2,991 3,360 4,444 0.2 310.0 32.3United Arab Emirates 174 2,413 2,320 2,598 0.1 .. 12.0United Kingdom 130,427 329,743 351,636 350,523 16.1 168.8 -0.3United States 352,765 574,893 606,899 617,435 28.4 75.0 1.7Vietnam 401 1,195 1,455 1,878 0.1 368.3 29.1Virgin Islands, British 960 1,499 1,656 4,477 0.2 366.4 170.4
Country Groups Asia (a) 97,859 289,188 342,449 380,515 17.5 288.8 11.1APEC 548,582 1,023,231 1,104,819 1,163,489 53.6 112.1 5.3ASEAN 24,283 83,180 97,806 97,482 4.5 301.4 -0.3European Union (b) 257,119 558,860 591,498 610,978 28.1 137.6 3.3G20 (c) 697,192 1,362,034 1,460,174 1,527,925 70.4 119.2 4.6OECD 743,518 1,378,292 1,459,209 1,508,395 69.5 102.9 3.4Total all countries 966,007 1,925,964 2,078,455 2,170,810 124.7 4.4(a) Major Asian economies only - includes: China; Hong Kong (SAR of China); India; Japan; Republic of Korea; Taiwan and all ASEAN members.(b) EU25 in 2006, EU28 from 2014. (c) Excludes data for Argentina in 2006 and 2016.Based on ABS catalogue 5352.0. np - not published.
TABLE 20.5: AUSTRALIAN INVESTMENT ABROAD - STOCKSBY SELECTED COUNTRIES AND REGIONS
(A$ million)
% change
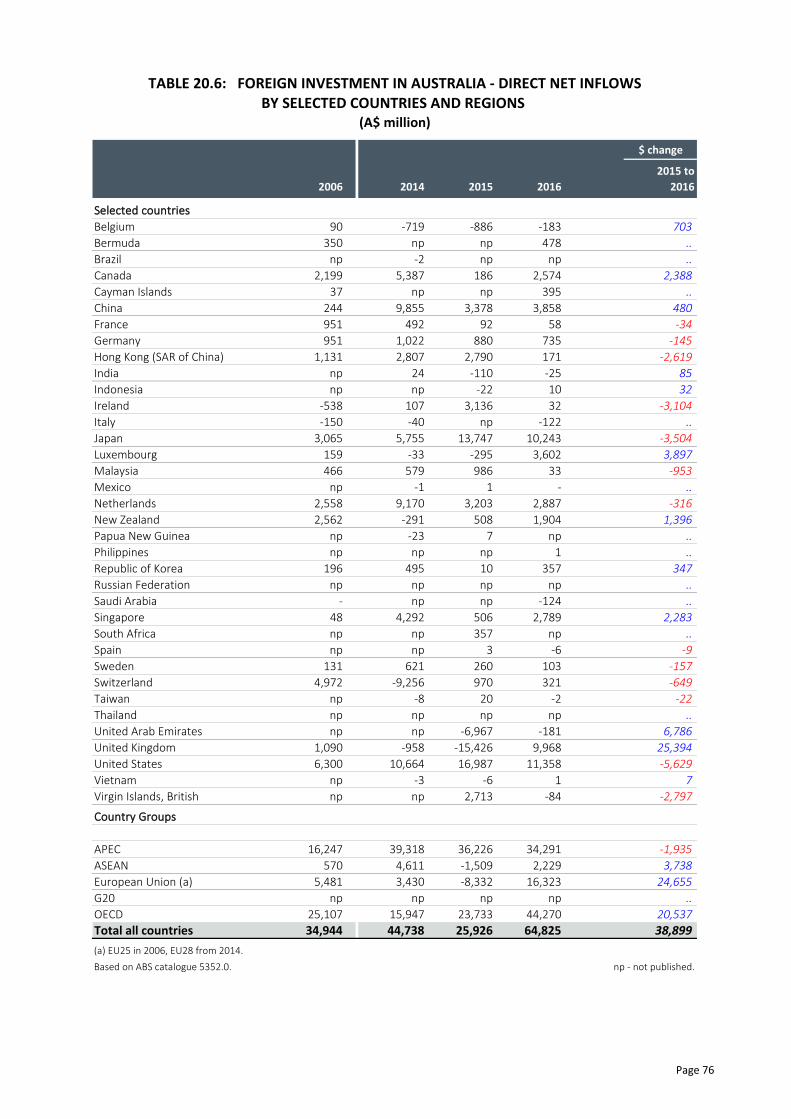
Page 76
$ change
2015 to2006 2014 2015 2016 2016
Selected countriesBelgium 90 -719 -886 -183 703Bermuda 350 np np 478 ..Brazil np -2 np np ..Canada 2,199 5,387 186 2,574 2,388Cayman Islands 37 np np 395 ..China 244 9,855 3,378 3,858 480France 951 492 92 58 -34Germany 951 1,022 880 735 -145Hong Kong (SAR of China) 1,131 2,807 2,790 171 -2,619India np 24 -110 -25 85Indonesia np np -22 10 32Ireland -538 107 3,136 32 -3,104Italy -150 -40 np -122 ..Japan 3,065 5,755 13,747 10,243 -3,504Luxembourg 159 -33 -295 3,602 3,897Malaysia 466 579 986 33 -953Mexico np -1 1 - ..Netherlands 2,558 9,170 3,203 2,887 -316New Zealand 2,562 -291 508 1,904 1,396Papua New Guinea np -23 7 np ..Philippines np np np 1 ..Republic of Korea 196 495 10 357 347Russian Federation np np np np ..Saudi Arabia - np np -124 ..Singapore 48 4,292 506 2,789 2,283South Africa np np 357 np ..Spain np np 3 -6 -9Sweden 131 621 260 103 -157Switzerland 4,972 -9,256 970 321 -649Taiwan np -8 20 -2 -22Thailand np np np np ..United Arab Emirates np np -6,967 -181 6,786United Kingdom 1,090 -958 -15,426 9,968 25,394United States 6,300 10,664 16,987 11,358 -5,629Vietnam np -3 -6 1 7Virgin Islands, British np np 2,713 -84 -2,797
Country Groups
APEC 16,247 39,318 36,226 34,291 -1,935ASEAN 570 4,611 -1,509 2,229 3,738European Union (a) 5,481 3,430 -8,332 16,323 24,655G20 np np np np ..OECD 25,107 15,947 23,733 44,270 20,537Total all countries 34,944 44,738 25,926 64,825 38,899(a) EU25 in 2006, EU28 from 2014.Based on ABS catalogue 5352.0. np - not published.
TABLE 20.6: FOREIGN INVESTMENT IN AUSTRALIA - DIRECT NET INFLOWSBY SELECTED COUNTRIES AND REGIONS
(A$ million)
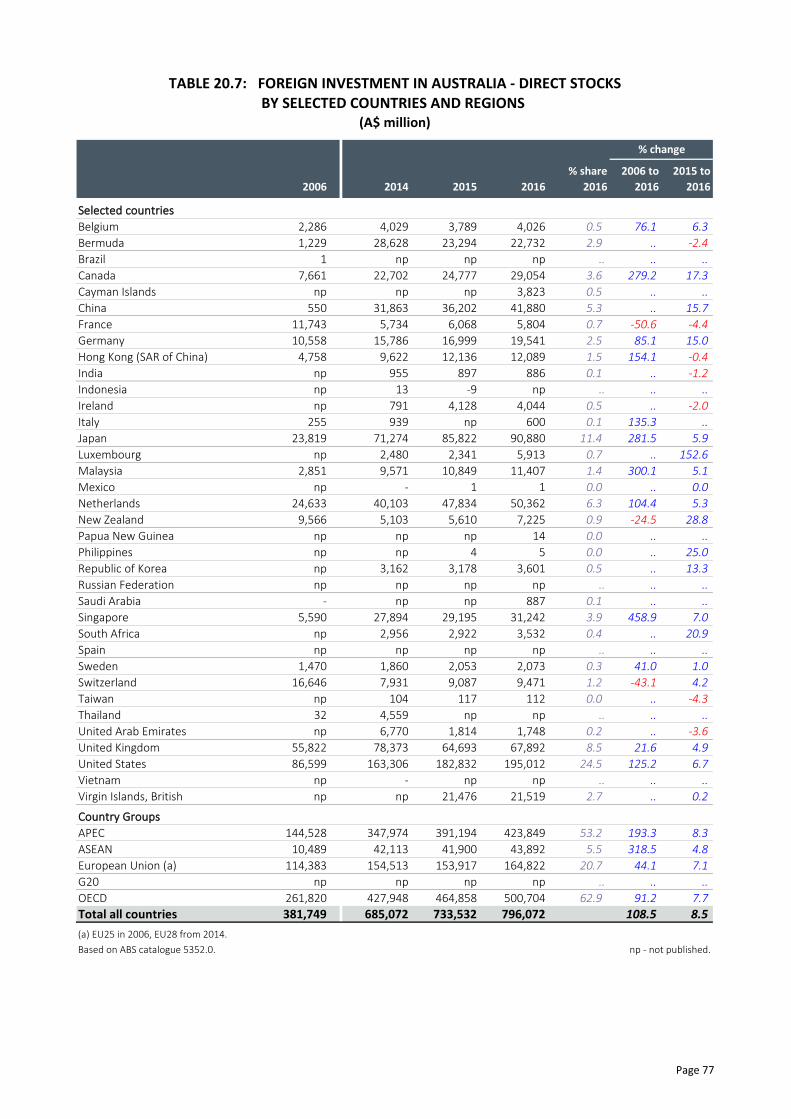
Page 77
% share 2006 to 2015 to2006 2014 2015 2016 2016 2016 2016
Selected countriesBelgium 2,286 4,029 3,789 4,026 0.5 76.1 6.3Bermuda 1,229 28,628 23,294 22,732 2.9 .. -2.4Brazil 1 np np np .. .. ..Canada 7,661 22,702 24,777 29,054 3.6 279.2 17.3Cayman Islands np np np 3,823 0.5 .. ..China 550 31,863 36,202 41,880 5.3 .. 15.7France 11,743 5,734 6,068 5,804 0.7 -50.6 -4.4Germany 10,558 15,786 16,999 19,541 2.5 85.1 15.0Hong Kong (SAR of China) 4,758 9,622 12,136 12,089 1.5 154.1 -0.4India np 955 897 886 0.1 .. -1.2Indonesia np 13 -9 np .. .. ..Ireland np 791 4,128 4,044 0.5 .. -2.0Italy 255 939 np 600 0.1 135.3 ..Japan 23,819 71,274 85,822 90,880 11.4 281.5 5.9Luxembourg np 2,480 2,341 5,913 0.7 .. 152.6Malaysia 2,851 9,571 10,849 11,407 1.4 300.1 5.1Mexico np - 1 1 0.0 .. 0.0Netherlands 24,633 40,103 47,834 50,362 6.3 104.4 5.3New Zealand 9,566 5,103 5,610 7,225 0.9 -24.5 28.8Papua New Guinea np np np 14 0.0 .. ..Philippines np np 4 5 0.0 .. 25.0Republic of Korea np 3,162 3,178 3,601 0.5 .. 13.3Russian Federation np np np np .. .. ..Saudi Arabia - np np 887 0.1 .. ..Singapore 5,590 27,894 29,195 31,242 3.9 458.9 7.0South Africa np 2,956 2,922 3,532 0.4 .. 20.9Spain np np np np .. .. ..Sweden 1,470 1,860 2,053 2,073 0.3 41.0 1.0Switzerland 16,646 7,931 9,087 9,471 1.2 -43.1 4.2Taiwan np 104 117 112 0.0 .. -4.3Thailand 32 4,559 np np .. .. ..United Arab Emirates np 6,770 1,814 1,748 0.2 .. -3.6United Kingdom 55,822 78,373 64,693 67,892 8.5 21.6 4.9United States 86,599 163,306 182,832 195,012 24.5 125.2 6.7Vietnam np - np np .. .. ..Virgin Islands, British np np 21,476 21,519 2.7 .. 0.2
Country Groups APEC 144,528 347,974 391,194 423,849 53.2 193.3 8.3ASEAN 10,489 42,113 41,900 43,892 5.5 318.5 4.8European Union (a) 114,383 154,513 153,917 164,822 20.7 44.1 7.1G20 np np np np .. .. ..OECD 261,820 427,948 464,858 500,704 62.9 91.2 7.7Total all countries 381,749 685,072 733,532 796,072 108.5 8.5(a) EU25 in 2006, EU28 from 2014.Based on ABS catalogue 5352.0. np - not published.
% change
(A$ million)
TABLE 20.7: FOREIGN INVESTMENT IN AUSTRALIA - DIRECT STOCKSBY SELECTED COUNTRIES AND REGIONS
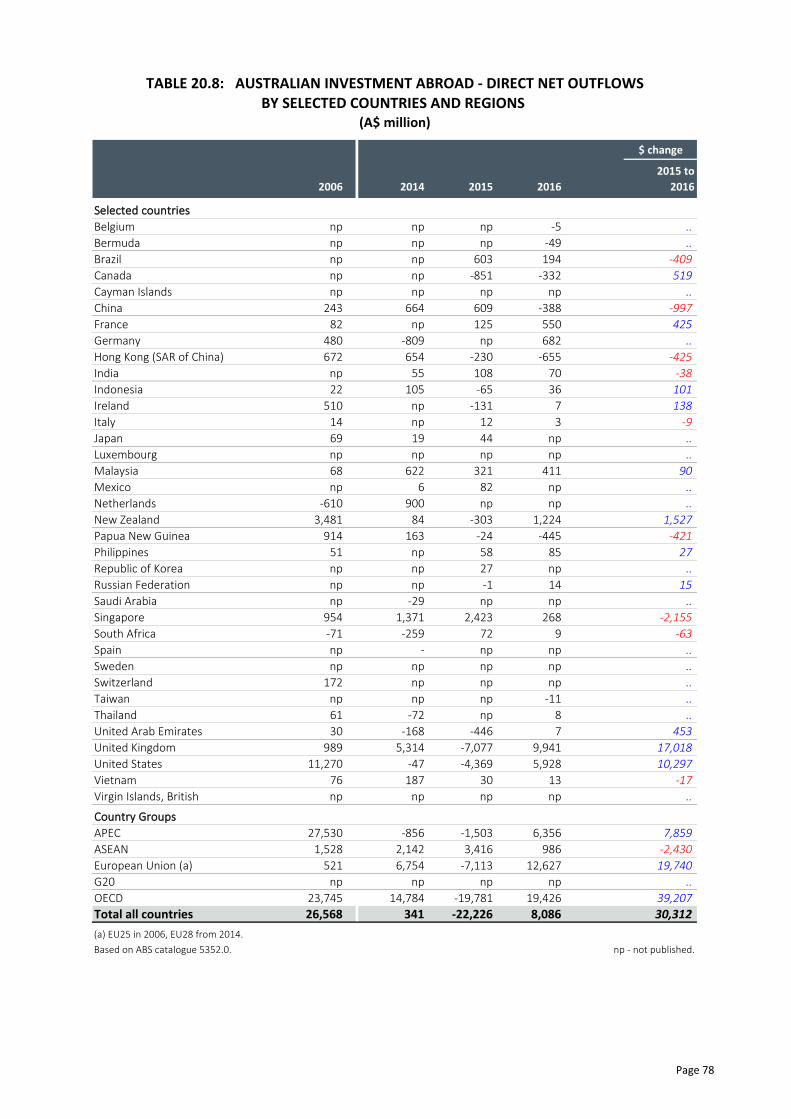
Page 78
$ change
2015 to2006 2014 2015 2016 2016
Selected countriesBelgium np np np -5 ..Bermuda np np np -49 ..Brazil np np 603 194 -409Canada np np -851 -332 519Cayman Islands np np np np ..China 243 664 609 -388 -997France 82 np 125 550 425Germany 480 -809 np 682 ..Hong Kong (SAR of China) 672 654 -230 -655 -425India np 55 108 70 -38Indonesia 22 105 -65 36 101Ireland 510 np -131 7 138Italy 14 np 12 3 -9Japan 69 19 44 np ..Luxembourg np np np np ..Malaysia 68 622 321 411 90Mexico np 6 82 np ..Netherlands -610 900 np np ..New Zealand 3,481 84 -303 1,224 1,527Papua New Guinea 914 163 -24 -445 -421Philippines 51 np 58 85 27Republic of Korea np np 27 np ..Russian Federation np np -1 14 15Saudi Arabia np -29 np np ..Singapore 954 1,371 2,423 268 -2,155South Africa -71 -259 72 9 -63Spain np - np np ..Sweden np np np np ..Switzerland 172 np np np ..Taiwan np np np -11 ..Thailand 61 -72 np 8 ..United Arab Emirates 30 -168 -446 7 453United Kingdom 989 5,314 -7,077 9,941 17,018United States 11,270 -47 -4,369 5,928 10,297Vietnam 76 187 30 13 -17Virgin Islands, British np np np np ..
Country Groups APEC 27,530 -856 -1,503 6,356 7,859ASEAN 1,528 2,142 3,416 986 -2,430European Union (a) 521 6,754 -7,113 12,627 19,740G20 np np np np ..OECD 23,745 14,784 -19,781 19,426 39,207Total all countries 26,568 341 -22,226 8,086 30,312(a) EU25 in 2006, EU28 from 2014.Based on ABS catalogue 5352.0. np - not published.
(A$ million)
TABLE 20.8: AUSTRALIAN INVESTMENT ABROAD - DIRECT NET OUTFLOWSBY SELECTED COUNTRIES AND REGIONS
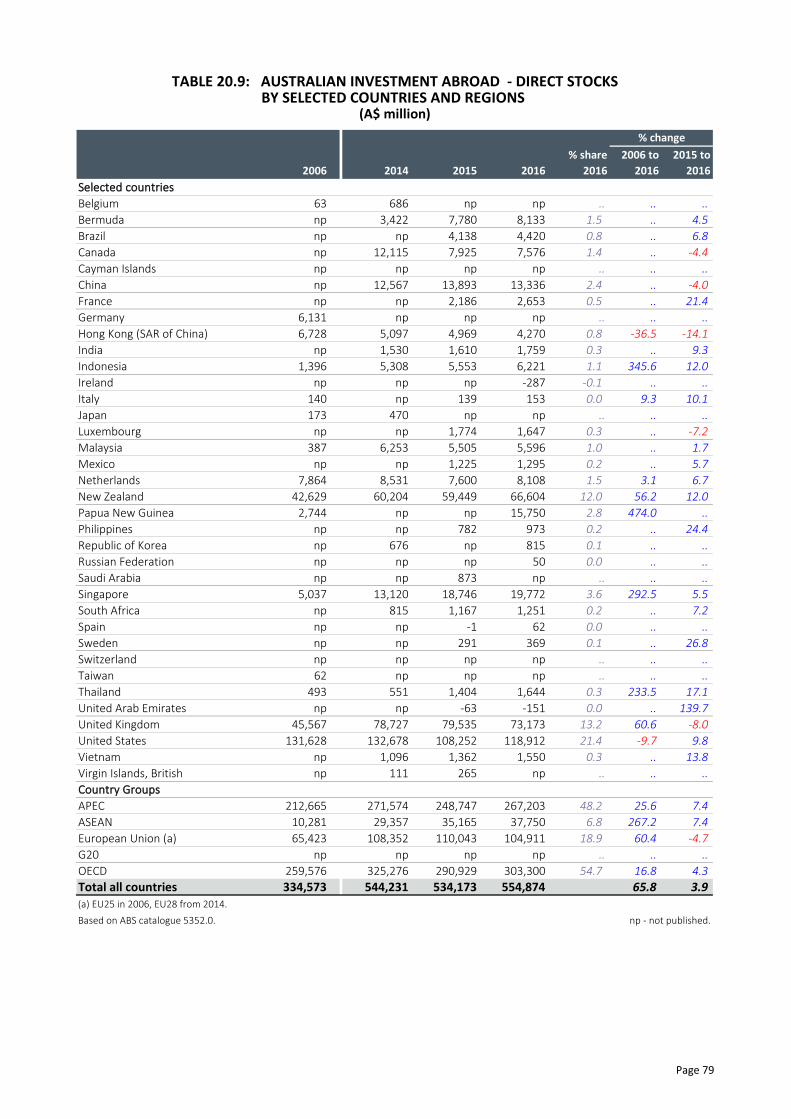
Page 79
% share 2006 to 2015 to2006 2014 2015 2016 2016 2016 2016
Selected countriesBelgium 63 686 np np .. .. ..Bermuda np 3,422 7,780 8,133 1.5 .. 4.5Brazil np np 4,138 4,420 0.8 .. 6.8Canada np 12,115 7,925 7,576 1.4 .. -4.4Cayman Islands np np np np .. .. ..China np 12,567 13,893 13,336 2.4 .. -4.0France np np 2,186 2,653 0.5 .. 21.4Germany 6,131 np np np .. .. ..Hong Kong (SAR of China) 6,728 5,097 4,969 4,270 0.8 -36.5 -14.1India np 1,530 1,610 1,759 0.3 .. 9.3Indonesia 1,396 5,308 5,553 6,221 1.1 345.6 12.0Ireland np np np -287 -0.1 .. ..Italy 140 np 139 153 0.0 9.3 10.1Japan 173 470 np np .. .. ..Luxembourg np np 1,774 1,647 0.3 .. -7.2Malaysia 387 6,253 5,505 5,596 1.0 .. 1.7Mexico np np 1,225 1,295 0.2 .. 5.7Netherlands 7,864 8,531 7,600 8,108 1.5 3.1 6.7New Zealand 42,629 60,204 59,449 66,604 12.0 56.2 12.0Papua New Guinea 2,744 np np 15,750 2.8 474.0 ..Philippines np np 782 973 0.2 .. 24.4Republic of Korea np 676 np 815 0.1 .. ..Russian Federation np np np 50 0.0 .. ..Saudi Arabia np np 873 np .. .. ..Singapore 5,037 13,120 18,746 19,772 3.6 292.5 5.5South Africa np 815 1,167 1,251 0.2 .. 7.2Spain np np -1 62 0.0 .. ..Sweden np np 291 369 0.1 .. 26.8Switzerland np np np np .. .. ..Taiwan 62 np np np .. .. ..Thailand 493 551 1,404 1,644 0.3 233.5 17.1United Arab Emirates np np -63 -151 0.0 .. 139.7United Kingdom 45,567 78,727 79,535 73,173 13.2 60.6 -8.0United States 131,628 132,678 108,252 118,912 21.4 -9.7 9.8Vietnam np 1,096 1,362 1,550 0.3 .. 13.8Virgin Islands, British np 111 265 np .. .. ..Country Groups APEC 212,665 271,574 248,747 267,203 48.2 25.6 7.4ASEAN 10,281 29,357 35,165 37,750 6.8 267.2 7.4European Union (a) 65,423 108,352 110,043 104,911 18.9 60.4 -4.7G20 np np np np .. .. ..OECD 259,576 325,276 290,929 303,300 54.7 16.8 4.3Total all countries 334,573 544,231 534,173 554,874 65.8 3.9(a) EU25 in 2006, EU28 from 2014.Based on ABS catalogue 5352.0. np - not published.
TABLE 20.9: AUSTRALIAN INVESTMENT ABROAD - DIRECT STOCKSBY SELECTED COUNTRIES AND REGIONS
(A$ million)% change

Page 80
Net inflows (a) $ change
2015 to2012 2013 2014 2015 2016 2016
Industry (b)Mining 51,862 68,967 32,934 54,525 24,762 -29,763Manufacturing 4,182 -450 2,595 2,777 2,708 -69Electricity, gas, water & waste 1,911 3,779 3,118 7,159 3,187 -3,972Wholesale trade 4,414 2,505 2,541 -4,528 914 5,442Retail trade 1,509 -556 1,904 1,422 -40 -1,462Transport, postal & warehousing 2,644 4,742 7,594 6,812 4,096 -2,716Financial & insurance services 11,422 -12,357 -16,977 -502 -99,155 -98,653Rental, hiring & real estate 2,029 1,793 5,538 20,968 28,552 7,584Other industries 24,325 25,581 32,994 23,962 10,116 -13,846Unallocated 908 -1,275 3,504 -5,485 -9,467 -3,982
Total 105,202 92,730 75,745 107,115 -34,329 -141,444
Stock of foreign investment in Australia (a) % change
2015 to2012 2013 2014 2015 2016 2016
Industry (b)Mining 394,770 446,463 466,993 508,738 551,799 8.5Manufacturing 114,029 111,948 111,770 116,770 118,941 1.9Electricity, gas, water & waste 20,738 25,665 29,834 38,248 42,098 10.1Wholesale trade 53,757 56,255 57,982 49,439 50,178 1.5Retail trade 12,100 13,220 15,692 18,591 17,265 -7.1Transport, postal & warehousing 35,262 43,121 53,816 64,796 68,191 5.2Financial & insurance services 1,056,177 1,194,508 1,327,348 1,446,691 1,479,627 2.3Rental, hiring & real estate 72,127 75,096 91,007 118,309 153,338 29.6Other industries 290,315 312,105 357,135 375,487 386,406 2.9Unallocated 253,266 302,451 337,387 364,695 380,202 4.3
Total 2,302,541 2,580,832 2,848,963 3,101,765 3,248,044 4.7
(a) Foreign liabilities. (b) Based on ANZSIC 2006 (refer to Explanatory notes ). Note the industry represents the main activity of the top enterprisein Australia.Based on ABS catalogue 5302.0.
TABLE 21: FOREIGN INVESTMENT IN AUSTRALIA BY INDUSTRY(A$ million)
Stock of foreign investment in Australia, 2016
Mining17.0%
Manufacturing3.7%
Electricity gas & water1.3%
Wholesale & retail trade2.1%
Transport & postal2.1%
Rental & real estate4.7%
Other industries11.9%
Financial & insurance
45.6%
Unallocated11.7%
Other42.7%

Page 81
Net outflows (a) $ change
2015 to2012 2013 2014 2015 2016 2016
Industry (b)Mining 7,253 15,136 -8,348 -5,561 7,891 13,452Manufacturing -2,821 1,574 3,014 7,883 4,021 -3,862Electricity, gas, water & waste -341 1,098 44 -1,472 162 1,634Wholesale trade -523 1,357 -816 2,481 183 -2,298Retail trade -7 445 121 562 1,115 553Transport, postal & warehousing -964 -181 577 559 -178 -737Financial & insurance services 42,413 31,276 40,520 33,060 -85,173 -118,233Rental, hiring & real estate -240 17 1,546 3,643 -390 -4,033Other industries -3,014 -10,086 -1,968 4,145 -1,281 -5,426Unallocated -7,130 -4,850 -4,861 -9,947 -5,607 4,340
Total 34,625 35,783 29,829 35,354 -79,259 -114,613
Stock of Australian investment abroad (a) % change
2015 to2012 2013 2014 2015 2016 2016
Industry (b)Mining 170,404 182,838 157,480 130,267 143,689 10.3Manufacturing 66,107 78,338 91,940 108,449 107,063 -1.3Electricity, gas, water & waste 7,437 8,907 8,907 6,834 6,740 -1.4Wholesale trade 5,113 7,583 6,733 7,603 8,327 9.5Retail trade 4,046 5,249 5,727 6,171 6,420 4.0Transport, postal & warehousing 3,744 2,910 3,802 5,161 5,198 0.7Financial & insurance services 939,432 1,137,300 1,346,122 1,497,576 1,555,612 3.9Rental, hiring & real estate 8,166 9,743 13,835 17,354 17,743 2.2Other industries 105,919 116,965 133,032 147,137 152,678 3.8Unallocated 161,627 182,427 201,884 214,536 222,963 3.9
Total 1,471,995 1,732,259 1,969,461 2,141,088 2,226,432 4.0
(a) Foreign assets. (b) Based on ANZSIC 2006 (refer to Explanatory notes ). Note the industry represents the main activity of the top enterprisein Australia.Based on ABS catalogue 5302.0.
Stock of Australian investment abroad, 2016
TABLE 22: AUSTRALIAN INVESTMENT ABROAD BY INDUSTRY(A$ million)
Financial & insurance
69.9%
Unallocated10.0%
Other20.1%
Mining6.5%
Manufacturing4.8%
Electricity gas & water0.3%
Wholesale & retail trade0.7%
Transport & postal0.2%
Rental & real estate0.8%
Other industries6.9%

Page 82
Direct net inflows $ change
2015 to2014 2015 2016 2016
Industry (a)
Agriculture, forestry & fishing np 468 119 -349Mining 35,389 11,550 29,747 18,197Manufacturing 1,616 2,153 4,086 1,933Electricity, gas & water 695 2,975 338 -2,637Construction 3,144 -1,080 368 1,448Wholesale & retail trade 4,298 -2,861 2,443 5,304Accommodation & food service activities 1,575 -1,104 235 1,339Transport & storage 979 7,210 876 -6,334Information & communication -2,132 493 -1,142 -1,635Financial & insurance activities -13,737 5,279 6,407 1,128Real estate activities 11,821 np np ..Professional, scientific & technical activities -191 453 1,125 672Administrative & support service activities -635 -333 np ..Public administration np np np ..Education 0 np 45 ..Human health & social work activities 464 -1,098 1,905 3,003Arts, entertainment & recreation 2 np np ..Other service activities np np np ..Unallocated & confidential items 1,450 1,821 18,273 16,452
Total 44,738 25,926 64,825 38,899
Stock of foreign direct investment in Australia % change
2015 to2014 2015 2016 2016
Industry (a)
Agriculture, forestry & fishing 1,544 2,122 2,229 5.0Mining 277,274 292,996 310,611 6.0Manufacturing 85,019 88,088 91,291 3.6Electricity, gas & water 12,814 15,926 17,249 8.3Construction 18,942 17,510 19,795 13.0Wholesale & retail trade 58,686 52,854 53,738 1.7Accommodation & food service activities 8,138 7,170 7,205 0.5Transport & storage 13,576 20,458 21,259 3.9Information & communication 24,665 24,950 22,685 -9.1Financial & insurance activities 50,675 63,700 66,938 5.1Real estate activities 46,816 58,106 84,147 44.8Professional, scientific & technical activities 3,786 4,523 5,391 19.2Administrative & support service activities 1,832 1,555 3,734 140.1Public administration np np np ..Education 0 np np ..Human health & social work activities 3,641 1,778 3,485 96.0Arts, entertainment & recreation 232 np np ..Other service activities np np np ..Unallocated & confidential items 77,432 81,796 86,315 5.5
Total 685,072 733,532 796,072 8.5
(a) Based on ANZSIC 2006 (refer to Explanatory notes ). Note the industry represents the main activity of the top enterprise
in Australia. np - not published.Based on ABS catalogue 5352.0.
TABLE 23: FOREIGN DIRECT INVESTMENT IN AUSTRALIA BY INDUSTRY(A$ million)

Page 83
Stock of foreign direct investment in Australia, 2016
Stock of selected other foreign direct investment in Australia, 2016
Stock of direct Australian investment abroad, 2016
Stock of selected other direct Australian investment abroad, 2016
Mining39.0%
Manufacturing11.5%Financial & insurance
8.4%
Wholesale & retail trade6.8%
Real estate activities10.6%
Information & communication
2.8%
Other20.9%
0
5,000
10,000
15,000
20,000
25,000
Electricity, gas &water
Construction Accommodation Transport & storage Professional activities Human healthactivities
A$m
Financial & insurance30.7%
Mining16.6%
Manufacturing17.4%
Real estate activities3.0%
Construction1.6%
Unallocated & confidential items25.8%
Other4.9%
0
2,000
4,000
6,000
8,000
Electricity, gas & water Wholesale & retail trade Transport & storage Information &communication
Human health activities
A$m
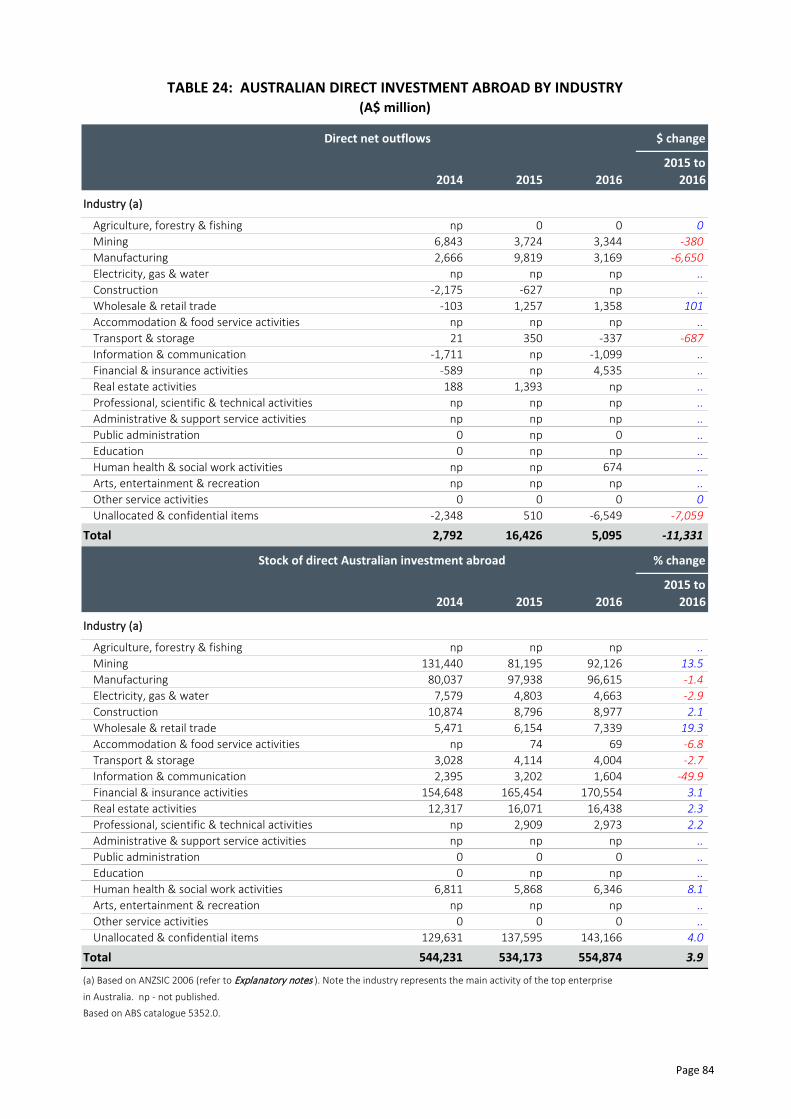
Page 84
Direct net outflows $ change
2015 to2014 2015 2016 2016
Industry (a)
Agriculture, forestry & fishing np 0 0 0Mining 6,843 3,724 3,344 -380Manufacturing 2,666 9,819 3,169 -6,650Electricity, gas & water np np np ..Construction -2,175 -627 np ..Wholesale & retail trade -103 1,257 1,358 101Accommodation & food service activities np np np ..Transport & storage 21 350 -337 -687Information & communication -1,711 np -1,099 ..Financial & insurance activities -589 np 4,535 ..Real estate activities 188 1,393 np ..Professional, scientific & technical activities np np np ..Administrative & support service activities np np np ..Public administration 0 np 0 ..Education 0 np np ..Human health & social work activities np np 674 ..Arts, entertainment & recreation np np np ..Other service activities 0 0 0 0Unallocated & confidential items -2,348 510 -6,549 -7,059
Total 2,792 16,426 5,095 -11,331
Stock of direct Australian investment abroad % change
2015 to2014 2015 2016 2016
Industry (a)
Agriculture, forestry & fishing np np np ..Mining 131,440 81,195 92,126 13.5Manufacturing 80,037 97,938 96,615 -1.4Electricity, gas & water 7,579 4,803 4,663 -2.9Construction 10,874 8,796 8,977 2.1Wholesale & retail trade 5,471 6,154 7,339 19.3Accommodation & food service activities np 74 69 -6.8Transport & storage 3,028 4,114 4,004 -2.7Information & communication 2,395 3,202 1,604 -49.9Financial & insurance activities 154,648 165,454 170,554 3.1Real estate activities 12,317 16,071 16,438 2.3Professional, scientific & technical activities np 2,909 2,973 2.2Administrative & support service activities np np np ..Public administration 0 0 0 ..Education 0 np np ..Human health & social work activities 6,811 5,868 6,346 8.1Arts, entertainment & recreation np np np ..Other service activities 0 0 0 ..Unallocated & confidential items 129,631 137,595 143,166 4.0
Total 544,231 534,173 554,874 3.9
(a) Based on ANZSIC 2006 (refer to Explanatory notes ). Note the industry represents the main activity of the top enterprise
in Australia. np - not published.Based on ABS catalogue 5352.0.
TABLE 24: AUSTRALIAN DIRECT INVESTMENT ABROAD BY INDUSTRY(A$ million)

Page 85
Section 5
The Foreign Investment
Review Board (FIRB)

Page 86
THE FOREIGN INVESTMENT REVIEW BOARD
The Foreign Investment Review Board (FIRB) is a non-statutory body established in 1976 to advise the Treasurer and the government on Australia’s Foreign Investment Policy and its administration. The Board examines significant foreign investment applications that are subject to Australia’s Foreign Investment Policy and/or the Foreign Acquisitions and Takeovers Act 1975 and makes recommendations to the Treasurer on potential national interest concerns. The Board’s functions are advisory only. Responsibility for making decisions on the Policy and proposals rests with the Treasurer.
Overview of the investment review process In brief, proposed investments in Australia by foreign entities where the investments fall within the scope of Australia’s Foreign Investment Policy and/or the Foreign Acquisitions and Takeovers Act 1975, are initially examined by the Board secretariat, with the Board’s direct and early involvement in significant applications.
While the overwhelming majority of proposals proceed without objection, the Treasurer has powers under the Act to prohibit proposals that are contrary to the national interest, or to subject them to conditions considered necessary to address national interest concerns. Information relating to proposed investments is included in the FIRB Annual Report for the year in which the investment is considered. The FIRB does not provide data on actual investment flows or stocks.
Use of FIRB approved investment data Users should be extremely careful in interpreting and comparing FIRB data with alternate international investment data such as from the ABS or across different periods:
• FIRB data records proposed investments by foreign persons falling within certain national interest threshold parameters at the time of the assessment, whereas ABS international investment data records certain actual investments in the period in which change of ownership occurs;
• As such, FIRB data represents a different view of foreign investment in Australia to that represented by ABS international investment data.
The FIRB urges particular caution in the use of its data including when making comparisons with earlier years. Users of the data should note the methodological and data caveats that apply. For FIRB data and the associated caveats, see particularly Chapter 3 of the latest FIRB annual report.
Differences between FIRB and ABS data • FIRB data and ABS international investment data capture different aspects of foreign investment in
Australia.
• FIRB data only captures proposed new investments (gross inflows) which fall above specified thresholds or national interest considerations in Australia’s Foreign Investment Policy.
• FIRB data does not show actual flows or stocks of investment.

Page 87
• ABS data captures actual net investment flows (both inflows [injections] and outflows [withdrawals]) in the period in which change of ownership occurs.
• ABS data also records stocks of foreign investment as at the end of the reference period.
• FIRB data generally reflects the country of the ultimate investor, whereas ABS data reflects the country of the immediate investor (see Box G on Third Party Investment).
TABLE A: FIRB APPROVALS FOR PROPOSED INVESTMENT IN AUSTRALIA, COUNTRY (A$ billion) By selected country of investor 2015-16
Canada 15.69 China 47.30 Japan 5.29 Kuwait 5.11 Netherlands 16.53 Singapore 6.37 United Arab Emirates 6.65 United States 31.00 Other 113.92
Total 247.86
Based on Foreign Investment Review Board Annual Reports, 2015-16.
TABLE B: FIRB APPROVALS FOR PROPOSED INVESTMENT IN AUSTRALIA, INDUSTRY (A$ billion) By industry sector 2015-16
Agriculture, forestry & fishing 4.62 Finance & insurance 13.50 Manufacturing, electricity & gas 56.59 Mineral exploration & development 27.58 Real estate 122.11 Services 23.19 Tourism 0.27 Total 247.86
Based on Foreign Investment Review Board Annual Reports, 2015-16.
Where to find FIRB data
More information on FIRB and associated data is available on the FIRB website at http://firb.gov.au/.

Page 88

Page 89
Technical appendices
Page 90
APPENDIX A – EXPLANATORY NOTES
Introduction The International Investment Australia publication provides summary data on Australia's international investment relationships with the world.
This publication is divided into five sections.
Section 1 – Australia’s international investment – definitions and concepts - contains information boxes which are designed to give the user background information on Australian Bureau of Statistics (ABS) international investment statistical concepts in an easy to understand format. These information boxes however do not cover all concepts and should be read in conjunction with these explanatory notes.
Section 2 – Australia’s international investment – summary tables – presents information on Foreign Investment in Australia (FIA), and Australian Investment Abroad (AIA), in terms of flows, stocks and related income, rankings tables, as well as selected indicators on the openness of the Australian economy to international investment, including foreign ownership and ratios.
Section 3 – International investment comparisons – presents information on where Australia ranks in the world economy in terms of direct investment flows and stocks.
Section 4 – Australia’s international investment – detailed tables – presents information on AIA and FIA for total and direct investment by selected countries, regions and industry.
Section 5 – The Foreign Investment Review Board (FIRB) – presents summary information on approvals for proposed investment in Australia by selected country and by industry. An information box is presented explaining the FIRB, the overview of the approval process as well as differences between FIRB and ABS investment data.
Section 6 – Technical appendices
In Section 1, 2, 4 and 5, all values are presented in Australian dollar terms. In Section 3, all values are presented in US dollars unless otherwise specified.
The terminology used in this publication has been simplified were possible, to make it easier for novice users of international investment data to understand the concepts being covered. In addition the balance of payments signage applied to ABS investment statistics has been removed.
Data sources The international investment statistics used to compile this publication have been obtained from the following sources:
• ABS – Balance of Payments and International Investment Position, December quarter 2016 (ABS catalogue number 5302.0)
• ABS – International Investment Position, Australia: Supplementary Statistics, 2016 (ABS catalogue number 5352.0)

Page 91
• ABS – Australian National Accounts, December quarter 2016 (ABS catalogue number 5206.0)
• ABS – Selected Characteristics of Australian Businesses, 2014-15 (ABS catalogue number 8167.0)
• ABS – Australian National Accounts: Financial Accounts, December 2016 (ABS catalogue number 5232.0)
• FIRB – Annual Report, 2015-16
• UNCTAD – World Investment Report, 2017 and Foreign Direct Investment Statistics database
• WTO – World Trade Organization statistics database
• IMF WEO – International Monetary Fund World Economic Outlook, April 2017 database.
Revisions to data ABS editing procedures frequently lead to revisions of previously published international investment data. Figures in this publication contain all amendments made by the ABS up to May 2017.
Confidential data
International investment data
To avoid divulging commercially-sensitive details of individual firms, the ABS restricts the release of certain statistics. In international investment statistics the ABS uses a ‘suppression’ methodology. Under this methodology, if a data cell is deemed to be confidential, the ABS would close that cell and flag it as ‘not published (np). As it is possible to calculate this cell by subtracting all other cells in the row from a total (or sub-total) series the ABS is also forced to suppress a non-confidential cell (called sequential confidentiality). As a result the number of cells suppressed can grow exponentially. Therefore a significant proportion of international investment data (especially at the partner country level) is not published by the ABS.
This can make it difficult for users of ABS international investment to analyse trends in ABS international investment data, especially for compiling ranking tables. Therefore the rankings for FIA and AIA (both total and direct) in Tables 5 to 8 have been compiled by DFAT after carefully analysing not just the current year’s data but also the underlying series for confidentialised countries and previous years’ data. If a ranking has not been supplied it indicates that it is not possible to accurately determine the ranking for the country from the data published by the ABS.
ABS international investment statistics
Overview
ABS international investment statistics are compiled in accordance with the International Monetary Fund (IMF) Balance of Payments and International Investment Position Manual, sixth edition, 2008 (BPM6). Australia’s international investment position statistics measure the level (or stock) of foreign liabilities in Australia and Australian foreign assets abroad at the end of a period. The difference between stock of foreign liabilities and foreign assets is referred to as Australia’s net international investment position.
Type of investment
The type of investment classification used in the international investment position consists of five broad categories:

Page 92
Direct investment is investment, undertaken by an entity resident in one economy, in an enterprise resident in another economy, with the objectives of obtaining or sustaining a lasting interest in the enterprise and exercising a significant degree of influence in its management. A 10% equity investment threshold is applied as evidence of such a direct interest. The entity undertaking the investment is referred to as the direct investor and the enterprise in which the investment takes place is referred to as the direct investment enterprise.
A direct investment enterprise in an economy is an incorporated or unincorporated enterprise in which a foreign direct investor owns 10% or more of the ordinary shares or voting power (for an incorporated enterprise) or the equivalent (for an unincorporated enterprise). Direct investment enterprises comprise branches (i.e. where fully owned by the direct investor but not incorporated in the economy where the branch is located), subsidiaries (where at least 50% owned by the direct investor) and associates (where owned between 10% and 50% by the direct investor).
A direct investor may be an individual; an incorporated or unincorporated private or public enterprise; an associated group of individuals or enterprises; a government or a government agency; an estate or trust; or an international organisation which has an investment of 10% or more in a direct investment enterprise in an economy other than the one in which the direct investor resides.
An enterprise that has significant long-term operations in more than one economy is divided into separate entities in each economy. These entities are always in a direct investment relationship: the head office constitutes the direct investor, and its branches constitute the direct investment enterprises.
Portfolio investment consists of equity (shares) and debt securities (bonds, bills, money market instruments) not classified to either direct investment, or reserve assets. Debt securities are further subdivided into two categories: bonds and notes; and money market instruments. Portfolio investment indicates investment in an enterprise where the investor has no appreciable say in the operation of the enterprise.
Financial derivatives, such as futures, swaps, forward rate agreements and forward foreign exchange agreements, are financial instruments that are linked to a specific financial instrument or indicator (foreign currencies, government bonds, share price indexes, interest rates), or to a particular commodity (gold, sugar, etc.). They provide a hedge for market financial risk in a form that can be traded or otherwise offset in the market.
Reserve assets refer to those foreign financial assets available to, and controlled by the Reserve Bank of Australia, for meeting balance of payments needs.
Other investment is a residual category that captures transactions not classified to direct investment, portfolio investment, financial derivatives or reserve assets. It covers trade credits, loans, currency and deposits, and a residual category for any other assets and liabilities.
Assets and Liabilities
A financial asset is generally in the form of a financial claim by Australia on the rest of the world. It is either represented by a contractual obligation (such as a loan) or is evidenced by a security (such as a share certificate). A financial liability on the other hand, represents a financial claim of the rest of the world on Australia.
International investment position (IIP)
Australia’s IIP is a balance sheet of the stock of foreign financial assets and liabilities at a point in time. The IIP may be viewed more broadly as a reconciliation statement showing the levels of Australia’s international assets and liabilities at two points of time and the components of change, namely flows and other changes (such as price changes, exchange rate movements and other adjustments).

Page 93
Direction of investment
The direction of investment refers to whether a transaction or investment position is Australian investment abroad (AIA) or foreign investment in Australia (FIA). Total AIA and FIA are the same as foreign assets and foreign liabilities, respectively, except for an adjustment made to assets and liabilities to net off certain direct investment claims.
Table: Foreign assets and liabilities vs FIA and AIA
2014 2015 2016 A$m A$m A$m
Stock at the end of the period Foreign assets 1,969,461 2,141,088 2,226,432
AIA 1,925,964 2,078,455 2,170,810
Difference 43,497 62,633 55,622
Foreign liabilities 2,848,963 3,101,765 3,248,044
FIA 2,805,466 3,039,132 3,192,422
Difference 43,497 62,633 55,622
Based on ABS catalogues 5302.0 & 5352.0.
For example, reverse direct investment (where a foreign parent company borrows from its own Australian subsidiary) is treated as a foreign asset, while under the FIA concept the reverse direct investment is treated as negative direct FIA (ie a negative liability). When an Australian parent company borrows from its foreign subsidiary it is treated as a foreign liability, while under AIA it is treated as negative direct AIA. The table above shows that the values between the two concepts are marginal in difference.
For simplicity in this publication all tables use the terminology FIA or AIA, regardless of whether it is based on FIA/AIA or foreign liabilities/assets. Footnotes in the tables identify when the foreign liability/asset concepts are being used.
Instruments of investment
In the international investment position, all assets and liabilities can be classified to particular instruments of investment. The primary classification of instrument is by equity or by debt. All instruments can be classified under one of these headings.
For more information concerning the definitions and classifications used by the ABS in the compilation of balance of payments and IIP statistics, please refer to the ABS publication Balance of Payments and International Investment Position, Australia, Concepts Sources and Methods 1998 and 2011 (ABS catalogue 5331.0), A Guide to Australian Balance of Payments and International Investment Position Statistics, 2004 (ABS catalogue 5362.0.55.001), or the IMF Balance of Payments and International Investment Position Manual, sixth edition, 2008 (BPM6).
Gross direct investment flows Net inflows and net outflows of Australian direct investment have been split into their gross components (refer to Tables 3 and 4 in this publication) based on a special data service from the ABS. Data is shown for
Page 94
injections of direct investment (new investment), reinvested earnings (profits that are retained in Australia rather than repatriated abroad) and withdrawals of existing direct investment.
It is possible to have negative injections if the parent company borrows funds from the direct investment enterprise (i.e. its affiliate in Australia - branch, subsidiaries etc). When the parent company repays the funds it will be treated as a negative withdrawal (i.e. analogous to an injection).
Negative reinvested earnings may also occur in some cases, for example, if losses are recorded by the direct investment enterprise or where dividends payable in a period is larger than net earnings in that period. Just as positive reinvested earnings are treated as being an injection of equity into the direct investment enterprise by the direct investor, negative reinvested earnings are treated as a withdrawal of equity.
Quantum of new investment
The quantum of new direct investment in Australia (refer to Box A in this publication) is the sum of the gross inflows (injections) of foreign direct investment into Australia over the year plus any reinvested earnings for the same period. Reinvested earnings in Australia are treated as new direct investment as the foreign investor in Australia has made a decision to increase the amount of its foreign investment in Australia rather than repatriate the profits to its parent company abroad.
Note that some of the new gross inflows of foreign direct investment may be replacing existing foreign investment in Australia, for example if a foreign investor takes over a company in Australia that is already foreign owned. These transactions could not be separated by the ABS in its international investment statistics.
Country The ABS can usually only identify the country of the immediate source for foreign investment in Australia, or the first destination for Australian investment abroad.
Therefore care should be exercised in interpreting ABS partner country or UNCTAD world investment data as the investment data reflects the country of the immediate investor, rather than the country of the ultimate owner or investor. Many international investments are made through financial intermediaries, holding companies or investment managers which are often incorporated in third-party countries.
There are a number of countries which have become hubs as financial intermediaries and investment centres for global clientele. Examples include the British Virgin Islands and the Cayman Islands in the Caribbean, Hong Kong and Singapore in Asia, and to a lesser extent Switzerland and Luxembourg in Europe. In some cases these centres are the result of preferential tax arrangements.
Two-way investment Two-way (or mutual investment) is the sum of the stock of FIA and AIA. This is a useful measurement of the overall investment relationship between Australia and its investment partners. Two-way investment is useful in ranking Australia’s major investment partners, without a bias towards ranking only the larger foreign investment sources or the larger destinations for Australian investment abroad.
Net international investment position to GDP ratio The net international investment position to GDP ratio is derived from net foreign liabilities at the end of the period and GDP for the year ended with that period. The ratio is split at its two broad components: net foreign equity; and net foreign debt, as percentages of annual GDP as well as on a gross FIA and AIA basis.
Page 95
Openness: total trade and total FDI to GDP ratios The total trade to GDP ratio, constructed as ((total exports + total imports)/GDP) is one of the most widely used measures of trade openness. The higher the ratio, the more ‘open’ the economy with respect to international trade. Similarly, the ratio of two-way FDI (Foreign Direct Investment) to GDP provides an indication of openness with respect to foreign direct investment (both in terms of willingness to accept investment from abroad and to make investments abroad).
These measures of openness are influenced by a broad range of factors, including policy settings, geographic location, economy size and specialisation within economies. Users should be careful when using the ratios for comparison against one dimension (e.g. policy settings) when other factors may have a bigger influence. For instance when analysing Singapore and Hong Kong trade data users should be aware they are trade entrepôts which has the impact of inflating the total trade to GDP ratio. Similar cautions apply to the investment ratios where, for example, a country is used as an international investment hub.
Foreign ownership of Australian business by industry The ABS’s Business Characteristics Survey (BCS) is an annual survey based on a random sample of approximately 6,500 businesses using a mail-out questionnaire. The sample was stratified by industry and an employment based size indicator. All businesses on the ABS Business Register that identified as having 300 or more employees were included in the sample. The BCS included a question on whether the Australian business was foreign owned.
Australian investment flows – domestic vs foreign Australian investment flows sourced from domestic or foreign sources has been sourced from the National Capital Account in the ABS publication Australia’s National Accounts (catalogue number 5206.0). The Net lending to non-resident series has been used to calculate the foreign sources while the domestic sources have been calculated as the differences between the Total capital accumulation minus Net lending to non-residents. Net lending to non-residents is the sum of the following two balance of payments items - Financial account balance plus Net errors and omissions.
Foreign Investment Review Board statistics Foreign Investment Review Board (FIRB) approvals statistics presented in Section 5 of this publication provide information about proposed applications considered and approved by the FIRB. Depending on the type of investment, they will be made up of intended acquisition costs, establishment costs and development costs.
These ‘proposed’ investments differ markedly from the ‘actual’ investments reported by the Australian Bureau of Statistics (ABS). Users need to be aware that the FIRB data are not comprehensive in measuring transactions between Australian residents and non-residents and nor do they measure changes in net foreign ownership levels. FIRB only measures proposed investments falling within prescribed thresholds. Foreign investments by Australian residents are not in the scope of FIRB.
For more information on FIRB and FIRB statistics, and the differences between them and ABS statistics, refer to the information box in Section 5 of this publication.
Page 96
UNCTAD international investment statistics
Overview
United Nations Conference on Trade and Development (UNCTAD) international investment statistics are compiled in accordance with the International Monetary Fund (IMF) Balance of Payments and International Investment Position Manual, fifth edition, 1993 (BPM5).
Methodology for compiling country-level stocks data
For the international investment stocks information presented in Tables 13 to 17 of this publication UNCTAD has used a variety of sources and methods to compile stocks for individual countries. Where available the stocks data have been sourced directly from countries’ national bodies, which is the ideal outcome. However many countries’ datasets for international investment data are either not complete, not compiled in line with international standards or simply not available.
Datasets that are not complete might, for example, have stocks information available for some years but not others. Datasets not compiled in line with international standards might have the stocks valued on the basis of historical cost rather than (the recommended) market value.
To overcome missing or incomplete datasets UNCTAD has employed different strategies, including:
• partner country information
• information obtained from international organisations, such as the IMF and the World Bank
• flows information, either summed to estimate stocks or used in conjunction with stocks data that is available only intermittently.
Because of this users need to be careful when making inter-country comparisons within the tables. The treatment applied to each country by UNCTAD can be accessed via the UNCTAD World Investment Report Methodological note.
Trend growth rates Trend growth is derived by log-linear regression using the least squares method. It is a more robust measure than the ‘average’ annual growth rate as it takes account of all observations and, as such, is less likely to be affected by the end points of a given period.
This publication was compiled by Julie-Anne Andrew and Frank Bingham.
If you want to know more about these statistics or about other trade and economic publications produced by DFAT, please email [email protected].

Page 97
APPENDIX B – COMPOSITION OF REGIONS AND COUNTRY GROUPS
APEC Asia Pacific Economic Cooperation Australia; Brunei; Canada; Chile; China; Hong Kong China; Indonesia; Japan; Malaysia; Mexico; New Zealand; Papua New Guinea; Peru; Philippines; Republic of Korea; Russian Federation; Singapore; Chinese Taipei; Thailand; United States (incl Puerto Rico and the US Virgin Is.); Vietnam.
ASEAN Association of South East Asian Nations Brunei; Cambodia; Indonesia; Laos; Malaysia; Myanmar, Philippines; Singapore; Thailand; Vietnam.
Asia Major Asian economies only Brunei; Cambodia; China; Hong Kong (SAR of China); India; Indonesia; Japan; Laos; Malaysia; Myanmar, Philippines; Republic of Korea; Singapore; Taiwan; Thailand; Vietnam.
EU 25 European Union 25 Austria; Belgium; Cyprus; Czech Republic; Denmark; Estonia; Finland; France; Germany; Greece; Hungary; Ireland; Italy; Latvia; Lithuania; Luxembourg; Malta; Netherlands; Poland; Portugal; Slovak Republic; Slovenia; Spain; Sweden; United Kingdom.
EU 27 European Union 27 Austria; Belgium; Bulgaria; Cyprus; Czech Republic; Denmark; Estonia; Finland; France; Germany; Greece; Hungary; Ireland; Italy; Latvia; Lithuania; Luxembourg; Malta; Netherlands; Poland; Portugal; Romania; Slovak Republic; Slovenia; Spain; Sweden; United Kingdom.
EU 28 European Union 28 Austria; Belgium; Bulgaria; Croatia; Cyprus; Czech Republic; Denmark; Estonia; Finland; France; Germany; Greece; Hungary; Ireland; Italy; Latvia; Lithuania; Luxembourg; Malta; Netherlands; Poland; Portugal; Romania; Slovak Republic; Slovenia; Spain; Sweden; United Kingdom.
G20 Group of Twenty Argentina; Australia; Brazil; Canada; China; European Union; France; Germany; India; Indonesia; Italy; Japan; Republic of Korea; Mexico; Russian Federation; Saudi Arabia; South Africa; Turkey; United Kingdom; United States.
OECD Organisation for Economic Cooperation and Development Australia; Austria; Belgium; Canada; Chile; Czech Republic; Denmark; Estonia; Finland; France; Germany; Greece; Hungary; Iceland; Ireland; Israel; Italy; Japan; Luxembourg; Mexico; Netherlands; New Zealand; Norway; Poland; Portugal; Republic of Korea; Slovak Republic; Slovenia; Spain; Sweden; Switzerland; Turkey; United Kingdom; United States.

Page 98
APPENDIX C – ABBREVIATIONS AND SYMBOLS USED IN ALL DFAT TRADE STATISTICAL PUBLICATIONS
.. not meaningful $b $ billion
$m $ million ABARES Australian Bureau of Agricultural & Resource Economics & Sciences ABS Australian Bureau of Statistics
adp automatic data processing agric agricultural AHECC Australian Harmonized Export Commodity Classification
alum aluminium ANZSIC06 Australia and New Zealand Standard Industry Classification 2006 APEC Asia Pacific Economic Cooperation
bev beverage BOP Balance of Payments BPM5 IMF Balance of Payments and International Investment Position Manual 5th Edition
BPM6 IMF Balance of Payments and International Investment Position Manual 6th Edition chem chemical c.i.f. cost, insurance and freight
comp compounds conc concentrates confid confidential
constr construction consump consumption cont. continued
cool cooling Curr Acc Current Account CVM chain volume measure
Dem Democratic DET Department of Education & Training DFAT Department of Foreign Affairs and Trade
DIIS Department of Industry, Innovation & Science DIBP Department of Immigration & Border Protection distrib distributing
EBOP The ABS Extended Balance of Payments services classification elec electric, electrical elem elements
ELICOS English Language Intensive Courses for Overseas Students eng engineering
Page 99
equip equipment etc etcetera ETM Elaborately transformed manufactures
EU European Union excl excluding f.c.f. fresh, chilled or frozen
Fed Federation ferr ferrous FISIM Financial Intermediation Services Indirectly Measured
f.o.b. free on board GDP Gross Domestic Product hand handling
HTISC Harmonized Tariff Item Statistical Code HS Harmonized Commodity Description and Coding System ICT Information, Communication and Technology
IIP International Investment Position IIS (ABS) international Investment Survey IMF International Monetary Fund
IMF IFS International Monetary Fund, International Financial Statistics IMF WEO International Monetary Fund, World Economic Outlook incl including
Ind Independent IP Intellectual property Is Island/s
instr instruments insul insulated interm intermediate
Int’l Waters International Waters IPD implicit price deflator IVS International Visitors Survey
mach machinery, machines manuf manufactured, manufactures medic medicaments
misc miscellaneous mmf man-made fibres MSITS Manual on Statistics of International Trade in Services
na not available ncd no country details nec not elsewhere classified
nei not elsewhere indicated nfd not further defined nie not indicated elsewhere
nes not elsewhere specified np not published Nth North
nya not yet available OECD Organisation for Economic Cooperation and Development
Page 100
pharm pharmaceutical photo photographic PPP Purchasing Power Parity
prec precious prep preparations, prepared pres preserved
proc processing prod products Rep Republic
SAR of China Special Administrative Region of China SITC Standard International Trade Classification SITS Survey of International Trade in Services
spec specifically Sth South STM Simply transformed manufactures
struct structures synth synthetic TCI Telecommunications, computer & information
telecom telecommunications TRA Tourism Research Australia TREC Trade Export Classification
TRIEC Trade Import and Export Classification transport transportation TSA Tourism Satellite Account
TWI Trade Weighted Index UN United Nations UNCTAD United Nations Conference on Trade and Development
unmanuf unmanufactured USDA United States Department of Agriculture veg vegetables
WTO World Trade Organization yoy year on year


International Investment Australia 2016