Embed Size (px)
Citation preview

Md. Afroz Alam IJCPS, 2014, Vol.2(12): 1351-1366
International Journal of Chemistry and Pharmaceutical Sciences 1351
ISSN: 2321-3132Research Article
International Journal of Chemistry andPharmaceutical Scienceswww.pharmaresearchlibrary.com/ijcps
A Computational Network Model of Protein Kinases for Cell Survival/Deathand its congruent tanner circuit
Rose Mary Simon, Md. Afroz Alam*
Department of bioinformatics, Karunya University, Karunya Nagar, Coimbatore-641114, Tamil Nadu, IndiaReceived: 18 August 2014, Accepted: 29 November 2014, Available Online: 27 December 2014
Contents1. Introduction . . . . . . . . . . . . . . . . . . . . . . . . . . . . . . . . . . . . . . . . . . . . . . . . . . . . . . . . . . . . . . . . . . . . . . . ..13512. Methodology. . . . . . . . . . . . . . . . . . . . . . . . . . . . . . . . . . . . . . . . . . . . . . . . . . . . . . . . . . . . . . . . . . . . . . . .13533. Results and discussion . . . . . . . . . . . . . . . . . . . . . . . . . . . . . . . . . . . . . . . . . . . . . . . . . . . . . . . . . . . . . . . .13614. Conclusion . . . . . . . . . . . . . . . . . . . . . . . . . . . . . . . . . . . . . . . . . . . . . . . . . . . . . . . . . . . . .. . . . . . . . . . . ..13655. Acknowledgement. . . . . . . . . . . . . . . . . . . . . . . . . . . . . . . . . . . . . . . . . . . . . . . . . . . . . . . . . . . . . . . . . . ..13656. References . . . . . . . . . . . . . . . . . . . . . . . . . . . . . . . . . . . . . . . . . . . . . . . . . . . . . . . . . . . . . . . . . . . . . . . . .1365
PAPER-QR CODE
Copyright © 2014, IJCPS All Rights Reserved
1. Introduction1.1 Protein Kinases modelingA protein kinase is a kinase enzyme that modifies other proteins by chemically adding phosphate groups to them(phosphorylation). Phosphorylation usually results in a functional change of the target protein by changing enzymeactivity, cellular location, or association with other proteins (Manning, et al., 2002). Eukaryotic protein kinases areenzymes that share a conserved catalytic core. Phosphorylation of activation loops in protein kinases is acharacteristic activation step for many different protein kinases (Figure 1). Most kinases act on both serine andthreonine, others act on tyrosine, and a number of dual-specificity kinases act on all three. Up to 30% of all humanproteins may be modified by kinase activity, and kinases are known to regulate the majority of cellular pathways,especially those involved in signal transduction. Protein kinases belong to a diverse family of enzymes that havevarious regulatory roles, yet function similarly by catalyzing the transfer of the phosphate of adenosine triphosphate
AbstractComputational modeling is useful as a means to assemble and test what we know about proteins and networks.The network model of EGFR pathway for cell survival/death has been implemented using SPICE simulator andMatlab. The sub pathways in EGFR pathways have been simulated using Tanner EDA. The proteins in thepathway are combined and the further simulation is done using the Neural Network Toolbox in Matlab. Theability of quinazoline to compete with the ATP to bind to the EGFR protein has been extensively studied andfound out that mutated EGFR proteins have higher affinity for quinazoline which is having specific anti-tumoractivity.Keywords: Matlab, quinazoline, EGFR pathway.
*Corresponding authorMd. Afroz AlamDepartment of bioinformatics,Karunya University, Karunya Nagar,Coimbatore-641114, Tamil Nadu, IndiaManuscript ID: IJCPS2245

Md. Afroz Alam IJCPS, 2014, Vol.2(12): 1351-1366
International Journal of Chemistry and Pharmaceutical Sciences 1352
(ATP) to an enzyme-specific protein substrate (Gago, et al., 2008). Protein kinase cascades feature in many signaltransduction pathways. A single upstream protein kinase appears to be responsible for the control of multipledownstream targets (Parker, et al., 2001). Because protein kinases have profound effects on a cell, their activity ishighly regulated. Protein kinases have merged as key regulators of all aspects of neoplasia, including proliferation,invasion, angiogenesis and metastasis, hence making cancer fundamentally a disease of aberrant protein kinaseactivity and signal transmission (Dhanasekaran, et al., 1998).
Figure 1: Action of Protein kinase (Manning, et al., 2002).
1.2 Tyrosine Kinases-EGFR signaling pathway network model constructionOf the protein kinases, approximately 90 are tyrosine kinases, which are enzyme that can transfer a phosphate groupfrom ATP to a protein where the phosphate group is attached to the amino acid tyrosine on the protein. It functionsas an "on" or "off" switch in many cellular functions. The tyrosine kinases are important mediators of the signalingcascade, determining key roles in diverse biological processes like growth, differentiation, metabolism and apoptosisin response to external and internal stimuli (Hanks, et al., 1988). The receptor tyrosine kinases function intransmembrane signaling, whereas tyrosine kinases within the cell function in signal transduction to the nucleus.Tyrosine kinase activity in the nucleus involves cell-cycle control and properties of transcription factors. Cellulargrowth and reproduction may rely in some part on tyrosine kinase. Tyrosine kinase function has been observed inthe nuclear matrix, which is comprised not of chromatin, but of the nuclear envelope and a “fibrous web” that servesto physically stabilize DNA. Lyn and Src family tyrosine kinases in general have been known to function in signaltransduction pathways (Radha, et al., 1996).
The epidermal growth factor receptor (EGFR) pathway is one of the best-studied signal transduction systems. EGFRis a trans membrane receptor with a tyrosine kinase domain protruding into the cytoplasm. They contain anextracellular domain and an intracellular protein TK core and must form dimers to initiate signaling (James, et al.,2006). The growth-stimulatory signal of epidermal growth factor is mediated by the trans membrane EGF receptor.The binding of EGF at the cell surface induces dimerization of EGFR, which results in the activation of EGFRtyrosine kinase activity and trans-autophosphorylation (Wang, et al., 2002). The EGFR pathway plays an importantrole during the growth and development of a number of organs including the heart, the mammary gland, and thecentral nervous system. They also play a significant role in regulating cell division, cellular differentiation, andmorphogenesis (Carpenter, 2000). In the EGFR signaling pathway activated EGFR undergoes nucleartranslocalization and subsequently regulates gene expression and potentially mediates other cellular processes.Transcriptional activity of nuclear EGFR appears to depend on its C-terminal trans activation domain and itsphysical and functional interaction with other transcription factors that contain DNA binding activity (Lo, et al.,2006).
A mutation that causes certain EGFR pathway to be constitutively active has been associated with tumorigenesis ofthe breast, ovaries, brain, and prostate gland. Most oncogenes encode components of cell signaling pathway.Abnormal cell components in cancer include growth factors and their receptors, signaling molecules andtranscription factors. Aberrant cell signaling causes uncontrolled cell proliferation and survival, the hallmarks ofcancer. Constitutive oncogenic activation in cancer cells can be blocked by selective tyrosine kinase inhibitors andthus considered as a promising approach for innovative genome based therapeutics (Paul, et al., 2005).1.3 Formulation of problemKnowledge on molecular biological systems is increasing at an amazing pace. It is becoming harder to intuitivelyevaluate the significance of each interaction between molecules of the complex biological systems. Hence it isessential to develop an efficient computational method to explore the biological mechanism. Many diseasesincluding cancer, autoimmune disorders, cardiac disease and diabetes are associated with defects in proteinphosphorylation and there are over 500 protein kinases in the human genome, and it has emerged as a major target in

Md. Afroz Alam IJCPS, 2014, Vol.2(12): 1351-1366
International Journal of Chemistry and Pharmaceutical Sciences 1353
the design and development of small molecule inhibitors (Gago, et al., 2008). The role of tyrosine kinases in thepatho-physiology of cancer has obtained much interest in the area of cancer research. The emphasis is to be in thefield of parameters to disrupt receptor tyrosine kinases (RTK) signaling pathways for cancer therapy which includeantigrowth factor antibodies, receptor antagonists, antireceptor monoclonal antibodies, antisense, and smallmolecule tyrosine kinase inhibitors which are considered as promising approaches for innovative genome basedtherapeutics. Quinazoline analogs are potential inhibitors of tyrosine kinase pathway which can be used for thetreatment of cancer with much higher inhibitory activities (Hennequin, et al., 2002).
A short introduction into systems biology researchers will be able to develop and validate qualitative models ofbiological pathways in a systematic manner using the well-established C-mos technology. The candidate signaltransduction pathways including function-unknown proteins should be organized based on the proteomic data. Thedata of tyrosine kinase pathway obtained by in vivo studies is the relative quantitative data which should beimplemented in the simulation work to obtain the computational network model of EGFR pathway as well as toobtain the clinical efficacy of different quinazoline analogs like imatinib, gefitinib, erlotinib, lapatinib and manymore analogs which act on our pathway of interest and are also undergoing clinical trials. The numerical models ofcomplex biological processes such as signal transduction is in its infancy and faces challenges. The area of researchcomprises simulation and stepwise modeling, animation, model validation as well as qualitative and quantitativeanalysis for behavior prediction. The ways in which the proteins network to process and transduce signals are poorlyunderstood. The objective of this study to construct a computational network model of protein kinases for cellsurvival/death and action of Quinazoline on EGFR pathway for the better prediction of clinical efficacy againsttumor activity.
2. MethodologyComputational modeling is useful as a means to assemble and test what we know about proteins and networks. Thiswork represents an application of Very Large Scale Integration (VLSI) in System Biology. Inspired by thecomputational feasibility of Simulation Program For Integrated Circuit Emphasis (SPICE) a systematic signalingnetwork has been built that would enable the predictive signal of cell survival/death.2. 1 Simulation using T-SPICE simulatorThe EGFR signaling pathway is sub divided into JAK/STAT pathway, ERK pathway, PI3K pathway, p38 pathwayand JNK pathway. The proteins involved in these pathways are taken as the input for simulation. The parameters inthis model are to be tuned manually based on biological knowledge available in the literature (Fujii, et al., 2010).SPICE (Simulation Program with Integrated Circuit Emphasis) is a general-purpose open source electronic circuitsimulator. It is a powerful program that is used in integrated circuit to check the integrity of circuit designs and topredict circuit behavior (Nagel, et al., 1971). The software used for simulation of EGFR signaling pathway is TannerElectronic Design Automation. Tanner EDA provides a complete line of software solutions that catalyze innovationfor the design, layout and verification of analog and mixed-signal integrated circuits (ICs). It is widely used for theapplications in areas such as power management, displays and imaging, automotive, consumer electronics, lifesciences, and RF devices (Warwick, et al., 2009). Here the T-SPICE is used to represent the biological model byusing digital signals (Jain, et al., 2010)2.2 Composite protein data by using MatlabNeural networks are composed of simple elements operating in parallel. These elements are inspired by biologicalnervous systems. Neural networks have been trained to perform complex functions in various fields, includingpattern recognition, identification, classification and control systems. Neural networks can also be trained to solveproblems with a huge amount of data that are difficult for conventional computers or human beings. The toolboxemphasizes the use of neural network paradigms that build up to or are themselves used in engineering, and otherpractical applications. Typically, neural networks are adjusted, or trained, so that a particular input leads to a specifictarget output (Siegelmann, et al., 1991). Another incentive for these abstractions is to reduce the amount ofcomputation required to simulate networks, so as to allow one to experiment with larger networks and train them onlarger data sets (Balabin, et al., 2009).
After the simulation of EGFR sub pathways using T-Spice, the decomposed EGFR pathway is joined together bytaking almost 8 proteins which should be present for the cell to survive. They are EGFR, PI3K, Akt, p38, Ras, ERK,JAK, JNK. Since 8 proteins are taken as the input there will be a huge amount of data produced in the truth table(Table 1 – 7) as the values are calculated using the formula 2n where n is the number of inputs into the truth table,here the value of n is 8 and there will be 256 output values produced. So this huge amount of input and output isarranged into an excel sheet by which the Neural Network toolbox in Matlab is trained. The test set is considered asany of the input conditions taken.2.3 Computational Network Model of EGFR pathway using TannerThe goal was to construct a computational network model of EGFR signaling pathway for cell survival/death andalso to find out the affinity of quinazoline analogs towards the EGFR pathway. The area of research comprised

Md. Afroz Alam IJCPS, 2014, Vol.2(12): 1351-1366
International Journal of Chemistry and Pharmaceutical Sciences 1354
simulation, modeling, model validation as well as qualitative and quantitative analysis for behavior prediction. Thecomplex EGFR pathway had been decomposed into several sub pathways as the number of entities involved waslarge. In this study the digital analog 1 represents cell survival and 0 represents cell death as in truth table (Table 1 –7) and their respective tanner code (Tanner Code 1-7) as circuit shown in Figure 2 – 8.
Tanner Code-1
M1 N3 PI3K N7 Gnd NMOS L=2u W=22u AD=66p PD=24u AS=66pM2 N7 AkT N13 Gnd NMOS L=2u W=22u AD=66p PD=24u AS=66pM3 Output N3 Gnd NMOS L=2u W=120u AD=66p PD=24u AS=66pM4 N13 p53 Gnd NMOS L=2u W=10u AD=66p PD=24u AS=66pM5 N3 PI3K Vdd PMOS L=2u W=22u AD=66p PD=24u AS=66pM6 Vdd p53 N3 Vdd PMOS L=2u W=22u AD=66p PD=24u AS=66pM7 Vdd AkT N3 Vdd PMOS L=2u W=22u AD=66p PD=24u AS=66pM8 Output N3 Vdd PMOS L=2u W=22u AD=66p PD=24u AS=66pV9 p53Gnd pulse(0.0 5.0 0 .1n .1n 133n 266n)v10 AkT Gnd pulse(0.0 5.0 0 .1n .1n 421n 842n)v11 PI3K Gnd pulse(0.0 5.0 0 .1n .1n 109n 218n).model pmos pmos.model nmos nmos.tran 5n 1u.print v (Output) v (p53) v (AkT) v (PI3K)
Figure 2: Tanner Circuit-1

Md. Afroz Alam IJCPS, 2014, Vol.2(12): 1351-1366
International Journal of Chemistry and Pharmaceutical Sciences 1355
Tanner Code-2
M1 N3 SOS N7 Gnd NMOS L=2u W=22u AD=66p PD=24u AS=66pM2 N7 p38 N13 Gnd NMOS L=2u W=22u AD=66p PD=24u AS=66pM3 Output N3 Gnd NMOS L=2u W=120u AD=66p PD=24u AS=66pM4 N13 p38 Gnd NMOS L=2u W=10u AD=66p PD=24u AS=66pM5 N3 MK2 Vdd PMOS L=2u W=22u AD=66p PD=24u AS=66pM6 Vdd SOS N3 Vdd PMOS L=2u W=22u AD=66p PD=24u AS=66pM7 Vdd MK2 N3 Vdd PMOS L=2u W=22u AD=66p PD=24u AS=66pM8 Output N3 Vdd PMOS L=2u W=22u AD=66p PD=24u AS=66pV9 SOS Gnd pulse(0.0 5.0 0 .1n .1n 133n 266n)v10 p38 Gnd pulse(0.0 5.0 0 .1n .1n 421n 842n)v11 MK2 Gnd pulse(0.0 5.0 0 .1n .1n 109n 218n).model pmos pmos.model nmos nmos.tran 5n 1u.print v(Output) v(MK2) v(p38) v(SOS)
Figure 3: Tanner Circuit-2
Tanner Code-3M1 N3 RAS N7 Gnd NMOS L=2u W=22u AD=66p PD=24u AS=66pM2 N7 RAF N13 Gnd NMOS L=2u W=22u AD=66p PD=24u AS=66pM3 Output N3 Gnd NMOS L=2u W=120u AD=66p PD=24u AS=66pM4 N13 RAF Gnd NMOS L=2u W=10u AD=66p PD=24u AS=66pM5 N3 ERK Vdd PMOS L=2u W=22u AD=66p PD=24u AS=66p PS=24uM6 Vdd RAS N3 Vdd PMOS L=2u W=22u AD=66p PD=24u AS=66pM7 Vdd ERK N3 Vdd PMOS L=2u W=22u AD=66p PD=24u AS=66pM8 Output N3 Vdd Vdd PMOS L=2u W=22u AD=66p PD=24u AS=66pV9 RAS Gnd pulse(0.0 5.0 0 .1n .1n 133n 266n)v10 RAF Gnd pulse(0.0 5.0 0 .1n .1n 421n 842n)v11 ERK Gnd pulse(0.0 5.0 0 .1n .1n 109n 218n).model pmos pmos.model nmos nmos.tran 5n 1u.print v(Output) v(RAS) v(RAF) v(ERK)

Md. Afroz Alam IJCPS, 2014, Vol.2(12): 1351-1366
International Journal of Chemistry and Pharmaceutical Sciences 1356
Figure 4: Tanner circuit-3
Tanner Code-4
M1 N3 RAS N7 Gnd NMOS L=2u W=22u AD=66p PD=24u AS=66pM2 N7 MEKK N13 NMOS L=2u W=22u AD=66p PD=24u AS=66pM3 Output N3 Gnd NMOS L=2u W=120u AD=66p PD=24u AS=66pM4 N13 RAS Gnd NMOS L=2u W=10u AD=66p PD=24u AS=66pM5 N3 JNK Vdd Vdd PMOS L=2u W=22u AD=66p PD=24u AS=66pM6 Vdd MEKK N3 Vdd PMOS L=2u W=22u AD=66p PD=24u AS=66pM7 Vdd JNK N3 Vdd PMOS L=2u W=22u AD=66p PD=24u AS=66pM8 Output N3 Vdd PMOS L=2u W=22u AD=66p PD=24u AS=66pV9 RAS Gnd pulse(0.0 5.0 0 .1n .1n 133n 266n)v10 MEKK Gnd pulse(0.0 5.0 0 .1n .1n 421n 842n)v11 JNK Gnd pulse(0.0 5.0 0 .1n .1n 109n 218n).model pmos pmos.model nmos nmos.tran 5n 1u.print v(Output) v(RAS) v(MEKK) v(JNK)
Figure 5: Tanner circuit-4

Md. Afroz Alam IJCPS, 2014, Vol.2(12): 1351-1366
International Journal of Chemistry and Pharmaceutical Sciences 1357
Tanner Code-5
M1 Output N7 Gnd NMOS L=2u W=22u AD=66p PD=24u AS=66pM2 N6 STAT Gnd N16 NMOS L=2u W=22u AD=66p PD=24u AS=66pM3 N7 JAK N6 N16 NMOS L=2u W=22u AD=66p PD=24u AS=66pM4 N7 JAK Vdd Vdd PMOS L=2u W=22u AD=66p PD=24u AS=66pM5 Vdd STAT N7 Vdd PMOS L=2u W=22u AD=66p PD=24u AS=66pM6 Output N7 Vdd Vdd PMOS L=2u W=22u AD=66p PD=24u AS=66pv7 Vdd Gnd 5.0v8 JAK Gnd pulse(0.0 5.0 0 10n 10n 100n 200n)v9 STAT Gnd pulse(0.0 5.0 0 10n 10n 100n 200n).model pmos pmos.model nmos nmos.tran 5n 1u.print v(Output) v(STAT) v(JAK)
Figure 6: Tanner circuit-5
Tanner Code-6M1 N1 MK2 N7 Gnd NMOS L=2u W=22u AD=66p PD=24u AS=66pM2 N15 AP1 Gnd Gnd NMOS L=2u W=22u AD=66p PD=24u AS=66pM3 N7 N15 Gnd Gnd NMOS L=2u W=22u AD=66p PD=24u AS=66pM4 Output N1 Gnd NMOS L=2u W=22u AD=66p PD=24u AS=66p
Md. Afroz Alam IJCPS, 2014, Vol.2(12): 1351-1366
International Journal of Chemistry and Pharmaceutical Sciences 1358
M5 N1 MK2 Vdd Vdd PMOS L=2u W=22u AD=66p PD=24u AS=66pM6 Vdd N15 N1 Vdd PMOS L=2u W=22u AD=66p PD=24u AS=66pM7 N15 AP1 Vdd Vdd PMOS L=2u W=22u AD=66p PD=24u AS=66pM8 Output N1 Vdd PMOS L=2u W=22u AD=66p PD=24u AS=66pv9 Vdd Gnd 5.0.model pmos pmos.model nmos nmos.tran 40n 400nv1 MK2 gnd bit ({0011})v2 AP1 gnd bit ({0101}).print tran Output MK2 AP1
Figure 7: Tanner circuit-6
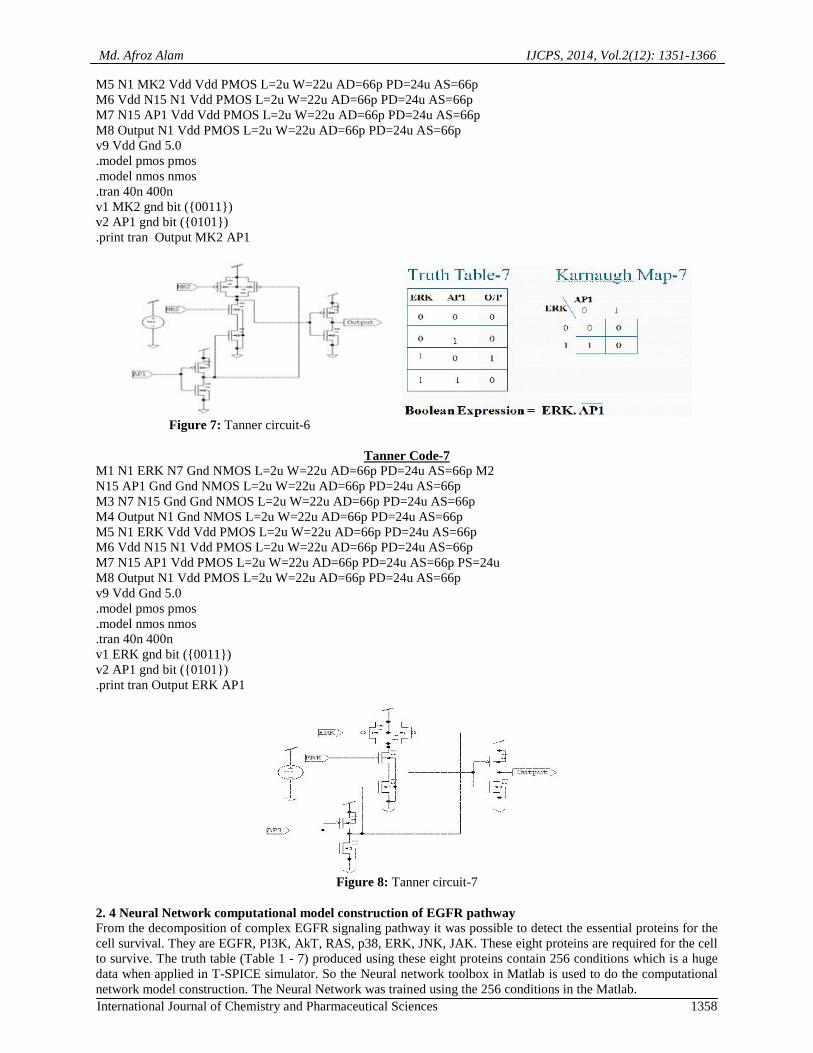
Tanner Code-7M1 N1 ERK N7 Gnd NMOS L=2u W=22u AD=66p PD=24u AS=66p M2N15 AP1 Gnd Gnd NMOS L=2u W=22u AD=66p PD=24u AS=66pM3 N7 N15 Gnd Gnd NMOS L=2u W=22u AD=66p PD=24u AS=66pM4 Output N1 Gnd NMOS L=2u W=22u AD=66p PD=24u AS=66pM5 N1 ERK Vdd Vdd PMOS L=2u W=22u AD=66p PD=24u AS=66pM6 Vdd N15 N1 Vdd PMOS L=2u W=22u AD=66p PD=24u AS=66pM7 N15 AP1 Vdd PMOS L=2u W=22u AD=66p PD=24u AS=66p PS=24uM8 Output N1 Vdd PMOS L=2u W=22u AD=66p PD=24u AS=66pv9 Vdd Gnd 5.0.model pmos pmos.model nmos nmos.tran 40n 400nv1 ERK gnd bit ({0011})v2 AP1 gnd bit ({0101}).print tran Output ERK AP1
Figure 8: Tanner circuit-7
2. 4 Neural Network computational model construction of EGFR pathwayFrom the decomposition of complex EGFR signaling pathway it was possible to detect the essential proteins for thecell survival. They are EGFR, PI3K, AkT, RAS, p38, ERK, JNK, JAK. These eight proteins are required for the cellto survive. The truth table (Table 1 - 7) produced using these eight proteins contain 256 conditions which is a hugedata when applied in T-SPICE simulator. So the Neural network toolbox in Matlab is used to do the computationalnetwork model construction. The Neural Network was trained using the 256 conditions in the Matlab.

Md. Afroz Alam IJCPS, 2014, Vol.2(12): 1351-1366
International Journal of Chemistry and Pharmaceutical Sciences 1359
Matlab Codetrain= xlsread('D:\matlab_pgms\work.xls',1);trainout= xlsread('D:\matlab_pgms\work.xls',2);test= xlsread('D:\matlab_pgms\work.xls',3);traint=train';testt=test';trainoutt=trainout'
Table 8: Truth table for Training set containing 256 conditionsEGFR PI3K AkT RAS p38 JAK JNK ERK EGFR PI3K AkT RAS p38 JAK JNK ERK
0 0 0 0 0 0 0 0 1 0 0 0 0 0 0 00 0 0 0 0 0 0 1 1 0 0 0 0 0 0 10 0 0 0 0 0 1 0 1 0 0 0 0 0 1 00 0 0 0 0 0 1 1 1 0 0 0 0 0 1 10 0 0 0 0 1 0 0 1 0 0 0 0 1 0 00 0 0 0 0 1 0 1 1 0 0 0 0 1 0 10 0 0 0 0 1 1 0 1 0 0 0 0 1 1 00 0 0 0 0 1 1 1 1 0 0 0 0 1 1 10 0 0 0 1 0 0 0 1 0 0 0 1 0 0 00 0 0 0 1 0 0 1 1 0 0 0 1 0 0 10 0 0 0 1 0 1 0 1 0 0 0 1 0 1 00 0 0 0 1 0 1 1 1 0 0 0 1 0 1 10 0 0 0 1 1 0 0 1 0 0 0 1 1 0 00 0 0 0 1 1 0 1 1 0 0 0 1 1 0 10 0 0 0 1 1 1 0 1 0 0 0 1 1 1 00 0 0 0 1 1 1 1 1 0 0 0 1 1 1 10 0 0 1 0 0 0 0 1 0 0 1 0 0 0 00 0 0 1 0 0 0 1 1 0 0 1 0 0 0 10 0 0 1 0 0 1 0 1 0 0 1 0 0 1 00 0 0 1 0 0 1 1 1 0 0 1 0 0 1 10 0 0 1 0 1 0 0 1 0 0 1 0 1 0 00 0 0 1 0 1 0 1 1 0 0 1 0 1 0 10 0 0 1 0 1 1 0 1 0 0 1 0 1 1 00 0 0 1 0 1 1 1 1 0 0 1 0 1 1 10 0 0 1 1 0 0 0 1 0 0 1 1 0 0 00 0 0 1 1 0 0 1 1 0 0 1 1 0 0 10 0 0 1 1 0 1 0 1 0 0 1 1 0 1 00 0 0 1 1 0 1 1 1 0 0 1 1 0 1 10 0 0 1 1 1 0 0 1 0 0 1 1 1 0 00 0 0 1 1 1 0 1 1 0 0 1 1 1 0 10 0 0 1 1 1 1 0 1 0 0 1 1 1 1 00 0 0 1 1 1 1 1 1 0 0 1 1 1 1 10 0 1 0 0 0 0 0 1 0 1 0 0 0 0 00 0 1 0 0 0 0 1 1 0 1 0 0 0 0 10 0 1 0 0 0 1 0 1 0 1 0 0 0 1 00 0 1 0 0 0 1 1 1 0 1 0 0 0 1 10 0 1 0 0 1 0 0 1 0 1 0 0 1 0 00 0 1 0 0 1 0 1 1 0 1 0 0 1 0 10 0 1 0 0 1 1 0 1 0 1 0 0 1 1 00 0 1 0 0 1 1 1 1 0 1 0 0 1 1 10 0 1 0 1 0 0 0 1 0 1 0 1 0 0 00 0 1 0 1 0 0 1 1 0 1 0 1 0 0 10 0 1 0 1 0 1 0 1 0 1 0 1 0 1 00 0 1 0 1 0 1 1 1 0 1 0 1 0 1 10 0 1 0 1 1 0 0 1 0 1 0 1 1 0 00 0 1 0 1 1 0 1 1 0 1 0 1 1 0 10 0 1 0 1 1 1 0 1 0 1 0 1 1 1 00 0 1 0 1 1 1 1 1 0 1 0 1 1 1 1

Md. Afroz Alam IJCPS, 2014, Vol.2(12): 1351-1366
International Journal of Chemistry and Pharmaceutical Sciences 1360
0 0 1 1 0 0 0 0 1 0 1 1 0 0 0 00 0 1 1 0 0 0 1 1 0 1 1 0 0 0 10 0 1 1 0 0 1 0 1 0 1 1 0 0 1 00 0 1 1 0 0 1 1 1 0 1 1 0 0 1 10 0 1 1 0 1 0 0 1 0 1 1 0 1 0 00 0 1 1 0 1 0 1 1 0 1 1 0 1 0 10 0 1 1 0 1 1 0 1 0 1 1 0 1 1 00 0 1 1 0 1 1 1 1 0 1 1 0 1 1 10 0 1 1 1 0 0 0 1 0 1 1 1 0 0 00 0 1 1 1 0 0 1 1 0 1 1 1 0 0 10 0 1 1 1 0 1 0 1 0 1 1 1 0 1 00 0 1 1 1 0 1 1 1 0 1 1 1 0 1 10 0 1 1 1 1 0 0 1 0 1 1 1 1 0 00 0 1 1 1 1 0 1 1 0 1 1 1 1 0 10 0 1 1 1 1 1 0 1 0 1 1 1 1 1 00 0 1 1 1 1 1 1 1 0 1 1 1 1 1 10 1 0 0 0 0 0 0 1 1 0 0 0 0 0 00 1 0 0 0 0 0 1 1 1 0 0 0 0 0 10 1 0 0 0 0 1 0 1 1 0 0 0 0 1 00 1 0 0 0 0 1 1 1 1 0 0 0 0 1 10 1 0 0 0 1 0 0 1 1 0 0 0 1 0 00 1 0 0 0 1 0 1 1 1 0 0 0 1 0 10 1 0 0 0 1 1 0 1 1 0 0 0 1 1 00 1 0 0 0 1 1 1 1 1 0 0 0 1 1 10 1 0 0 1 0 0 0 1 1 0 0 1 0 0 00 1 0 0 1 0 0 1 1 1 0 0 1 0 0 10 1 0 0 1 0 1 0 1 1 0 0 1 0 1 00 1 0 0 1 0 1 1 1 1 0 0 1 0 1 10 1 0 0 1 1 0 0 1 1 0 0 1 1 0 00 1 0 0 1 1 0 1 1 1 0 0 1 1 0 10 1 0 0 1 1 0 1 1 1 0 0 1 1 1 00 1 0 0 1 1 1 1 1 1 0 0 1 1 1 10 1 0 1 0 0 0 0 1 1 0 1 0 0 0 00 1 0 1 0 0 0 1 1 1 0 1 0 0 0 10 1 0 1 0 0 1 0 1 1 0 1 0 0 1 00 1 0 1 0 0 1 1 1 1 0 1 0 0 1 10 1 0 1 0 1 0 0 1 1 0 1 0 1 0 00 1 0 1 0 1 0 1 1 1 0 1 0 1 0 10 1 0 1 0 1 1 0 1 1 0 1 0 1 1 00 1 0 1 0 1 1 1 1 1 0 1 0 1 1 10 1 0 1 1 0 0 0 1 1 0 1 1 0 0 00 1 0 1 1 0 0 1 1 1 0 1 1 0 0 10 1 0 1 1 0 1 0 1 1 0 1 1 0 1 00 1 0 1 1 0 1 1 1 1 0 1 1 0 1 10 1 0 1 1 1 0 0 1 1 0 1 1 1 0 00 1 0 1 1 1 0 1 1 1 0 1 1 1 0 10 1 0 1 1 1 1 0 1 1 0 1 1 1 1 00 1 0 1 1 1 1 1 1 1 0 1 1 1 1 10 1 1 0 0 0 0 0 1 1 1 0 0 0 0 00 1 1 0 0 0 0 1 1 1 1 0 0 0 0 10 1 1 0 0 0 1 0 1 1 1 0 0 0 1 00 1 1 0 0 0 1 1 1 1 1 0 0 0 1 10 1 1 0 0 1 0 0 1 1 1 0 0 1 0 00 1 1 0 0 1 0 1 1 1 1 0 0 1 0 10 1 1 0 0 1 1 0 1 1 1 0 0 1 1 00 1 1 0 0 1 1 1 1 1 1 0 0 1 1 10 1 1 0 1 0 0 0 1 1 1 0 1 0 0 0

Md. Afroz Alam IJCPS, 2014, Vol.2(12): 1351-1366
International Journal of Chemistry and Pharmaceutical Sciences 1361
0 1 1 0 1 0 0 1 1 1 1 0 1 0 0 10 1 1 0 1 0 1 0 1 1 1 0 1 0 1 00 1 1 0 1 0 1 1 1 1 1 0 1 0 1 10 1 1 0 1 1 0 0 1 1 1 0 1 1 0 00 1 1 0 1 1 0 1 1 1 1 0 1 1 0 10 1 1 0 1 1 1 0 1 1 1 0 1 1 1 00 1 1 0 1 1 1 1 1 1 1 0 1 1 1 10 1 1 1 0 0 0 0 1 1 1 1 0 0 0 00 1 1 1 0 0 0 1 1 1 1 1 0 0 0 10 1 1 1 0 0 1 0 1 1 1 1 0 0 1 00 1 1 1 0 0 1 1 1 1 1 1 0 0 1 10 1 1 1 0 1 0 0 1 1 1 1 0 1 0 00 1 1 1 0 1 0 1 1 1 1 1 0 1 0 10 1 1 1 0 1 1 0 1 1 1 1 0 1 1 00 1 1 1 0 1 1 1 1 1 1 1 0 1 1 10 1 1 1 1 0 0 0 1 1 1 1 1 0 0 00 1 1 1 1 0 0 1 1 1 1 1 1 0 0 10 1 1 1 1 0 1 0 1 1 1 1 1 0 1 00 1 1 1 1 0 1 1 1 1 1 1 1 0 1 10 1 1 1 1 1 0 0 1 1 1 1 1 1 0 00 1 1 1 1 1 0 1 1 1 1 1 1 1 0 10 1 1 1 1 1 1 0 1 1 1 1 1 1 1 00 1 1 1 1 1 1 1 1 1 1 1 1 1 1 1
Table 9: Truth table for Test set 1 containing 5 conditionsEGFR PI3K AkT RAS p38 JAK JNK ERK1 1 1 0 1 1 1 10 0 0 0 0 1 0 10 0 0 0 0 1 1 01 1 1 1 0 1 0 11 1 1 1 1 1 1 1
Table 10: Truth table for Test set 2 containing 5 conditionsEGFR PI3K AkT RAS p38 JAK JNK ERK1 1 1 0 1 1 1 11 1 1 1 1 1 1 10 0 0 0 0 1 1 01 1 1 1 0 1 0 11 0 1 1 1 0 1 1
3. Results and DiscussionThe output of the SPICE simulation is in the wave form with time in the X-axis and voltage applied in the Y-axis.When the wave is in the raised position it represents 1 which indicates cell survival and when wave is in downposition it represents 0 which indicates cell death. This Karnaugh map, Boolean expression, C-Mos circuit and itsoutput shows that when the proteins PI3K, AkT and p53 are present, it leads to the cell survival condition.
Figure 9: Tanner Output-2 represents 1 for cell survival and 0 for cell deat
0 . 0 0 . 1 0 . 2 0 . 3 0 . 4 0 . 5 0 . 6 0 . 7 0 . 8 0 . 9 1 . 0
Time (us )
0 . 0
0 . 5
1 . 0
1 . 5
2 . 0
2 . 5
3 . 0
3 . 5
4 . 0
4 . 5
5 . 0
Vo
ltag
e (V
)
v( M K 2)
SOS
0 . 0 0 . 1 0 . 2 0 . 3 0 . 4 0 . 5 0 . 6 0 . 7 0 . 8 0 . 9 1 . 0
Time (us )
0 . 0
0 . 5
1 . 0
1 . 5
2 . 0
2 . 5
3 . 0
3 . 5
4 . 0
4 . 5
5 . 0
Vo
ltag
e (V
)
v( p38 )
SOS
0 . 0 0 . 1 0 . 2 0 . 3 0 . 4 0 . 5 0 . 6 0 . 7 0 . 8 0 . 9 1 . 0
Time (us )
0 . 0
0 . 5
1 . 0
1 . 5
2 . 0
2 . 5
3 . 0
3 . 5
4 . 0
4 . 5
5 . 0
Vo
ltag
e (V
)
v( SOS )
SOS
0 . 0 0 . 1 0 . 2 0 . 3 0 . 4 0 . 5 0 . 6 0 . 7 0 . 8 0 . 9 1 . 0
Time (us )
0 . 0
0 . 5
1 . 0
1 . 5
2 . 0
2 . 5
3 . 0
3 . 5
4 . 0
4 . 5
5 . 0
Vo
ltag
e (V
)
v( Out put )
SOS

Md. Afroz Alam IJCPS, 2014, Vol.2(12): 1351-1366
International Journal of Chemistry and Pharmaceutical Sciences 1362
Figure 10: Tanner Output-1 which represents 1 for cell survival and 0 for cell death
The output of the SPICE simulation is in the wave form with time in the X-axis and voltage applied in the Y-axis.When the wave is in the raised position it represents 1 which indicates cell survival and when wave is in downposition it represents 0 which indicates cell death. This Karnaugh map, Boolean expression, C-Mos circuit and itsoutput shows that when the proteins SOS, p38 and p53 are present, it leads to the cell survival conditio
Figure 11: Tanner Output-3 represents 1 for cell survival and 0 for cell death
The output of the SPICE simulation is in the wave form with time in the X-axis and voltage applied in the Y-axis.When the wave is in the raised position it represents 1 which indicates cell survival and when wave is in downposition it represents 0 which indicates cell death. This Karnaugh map, Boolean expression, C-Mos circuit and itsoutput shows that when the proteins RAS, RAF and ERK are present, it leads to the cell survival condition.
Figure 12: Tanner Output-4 represents 1 for cell survival and 0 for cell death
The output of the SPICE simulation is in the wave form with time in the X-axis and voltage applied in the Y-axis. When the wave is in the raised position it represents 1 which indicates cell survival and when wave is indown position it represents 0 which indicates cell death. This Karnaugh map, Boolean expression, C-Mos
0 . 0 0 . 1 0 . 2 0 . 3 0 . 4 0 . 5 0 . 6 0 . 7 0 . 8 0 . 9 1 . 0
Time (us )
0 . 0
0 . 5
1 . 0
1 . 5
2 . 0
2 . 5
3 . 0
3 . 5
4 . 0
4 . 5
5 . 0
Vo
ltag
e (V
)
v( PI 3 K)
mary
0 . 0 0 . 1 0 . 2 0 . 3 0 . 4 0 . 5 0 . 6 0 . 7 0 . 8 0 . 9 1 . 0
Time (us )
0 . 0
0 . 5
1 . 0
1 . 5
2 . 0
2 . 5
3 . 0
3 . 5
4 . 0
4 . 5
5 . 0
Vo
ltag
e (V
)
v( AkT )
mary
0 . 0 0 . 1 0 . 2 0 . 3 0 . 4 0 . 5 0 . 6 0 . 7 0 . 8 0 . 9 1 . 0
Time (us )
0 . 0
0 . 5
1 . 0
1 . 5
2 . 0
2 . 5
3 . 0
3 . 5
4 . 0
4 . 5
5 . 0
Vo
ltag
e (V
)
v( p53 )
mary
0 . 0 0 . 1 0 . 2 0 . 3 0 . 4 0 . 5 0 . 6 0 . 7 0 . 8 0 . 9 1 . 0
Time (us )
0 . 0
0 . 5
1 . 0
1 . 5
2 . 0
2 . 5
3 . 0
3 . 5
4 . 0
4 . 5
5 . 0
Vo
ltag
e (V
)
v( Out put )
mary
0 . 0 0 . 1 0 . 2 0 . 3 0 . 4 0 . 5 0 . 6 0 . 7 0 . 8 0 . 9 1 . 0
Time (us )
0 . 0
0 . 5
1 . 0
1 . 5
2 . 0
2 . 5
3 . 0
3 . 5
4 . 0
4 . 5
5 . 0
Vo
ltag
e (V
)
v( ERK )
Module0
0 . 0 0 . 1 0 . 2 0 . 3 0 . 4 0 . 5 0 . 6 0 . 7 0 . 8 0 . 9 1 . 0
Time (us )
0 . 0
0 . 5
1 . 0
1 . 5
2 . 0
2 . 5
3 . 0
3 . 5
4 . 0
4 . 5
5 . 0
Vo
ltag
e (V
)
v( RAF )
Module0
0 . 0 0 . 1 0 . 2 0 . 3 0 . 4 0 . 5 0 . 6 0 . 7 0 . 8 0 . 9 1 . 0
Time (us )
0 . 0
0 . 5
1 . 0
1 . 5
2 . 0
2 . 5
3 . 0
3 . 5
4 . 0
4 . 5
5 . 0
Vo
ltag
e (V
)
v( RAS )
Module0
0 . 0 0 . 1 0 . 2 0 . 3 0 . 4 0 . 5 0 . 6 0 . 7 0 . 8 0 . 9 1 . 0
Time (us )
0 . 0
0 . 5
1 . 0
1 . 5
2 . 0
2 . 5
3 . 0
3 . 5
4 . 0
4 . 5
5 . 0
Vo
ltag
e (V
)
v( Out put )
Module0
0 . 0 0 . 1 0 . 2 0 . 3 0 . 4 0 . 5 0 . 6 0 . 7 0 . 8 0 . 9 1 . 0
Time (us )
0 . 0
0 . 5
1 . 0
1 . 5
2 . 0
2 . 5
3 . 0
3 . 5
4 . 0
4 . 5
5 . 0
Vo
ltag
e (V
)
v( J NK )
Module0
0 . 0 0 . 1 0 . 2 0 . 3 0 . 4 0 . 5 0 . 6 0 . 7 0 . 8 0 . 9 1 . 0
Time (us )
0 . 0
0 . 5
1 . 0
1 . 5
2 . 0
2 . 5
3 . 0
3 . 5
4 . 0
4 . 5
5 . 0
Vo
ltag
e (V
)
v( M E KK)
Module0
0 . 0 0 . 1 0 . 2 0 . 3 0 . 4 0 . 5 0 . 6 0 . 7 0 . 8 0 . 9 1 . 0
Time (us )
0 . 0
0 . 5
1 . 0
1 . 5
2 . 0
2 . 5
3 . 0
3 . 5
4 . 0
4 . 5
5 . 0
Vo
ltag
e (V
)
v( RAS )
Module0
0 . 0 0 . 1 0 . 2 0 . 3 0 . 4 0 . 5 0 . 6 0 . 7 0 . 8 0 . 9 1 . 0
Time (us )
0 . 0
0 . 5
1 . 0
1 . 5
2 . 0
2 . 5
3 . 0
3 . 5
4 . 0
4 . 5
5 . 0
Vo
ltag
e (V
)
v( Out put )
Module0
Md. Afroz Alam IJCPS, 2014, Vol.2(12): 1351-1366
International Journal of Chemistry and Pharmaceutical Sciences 1363
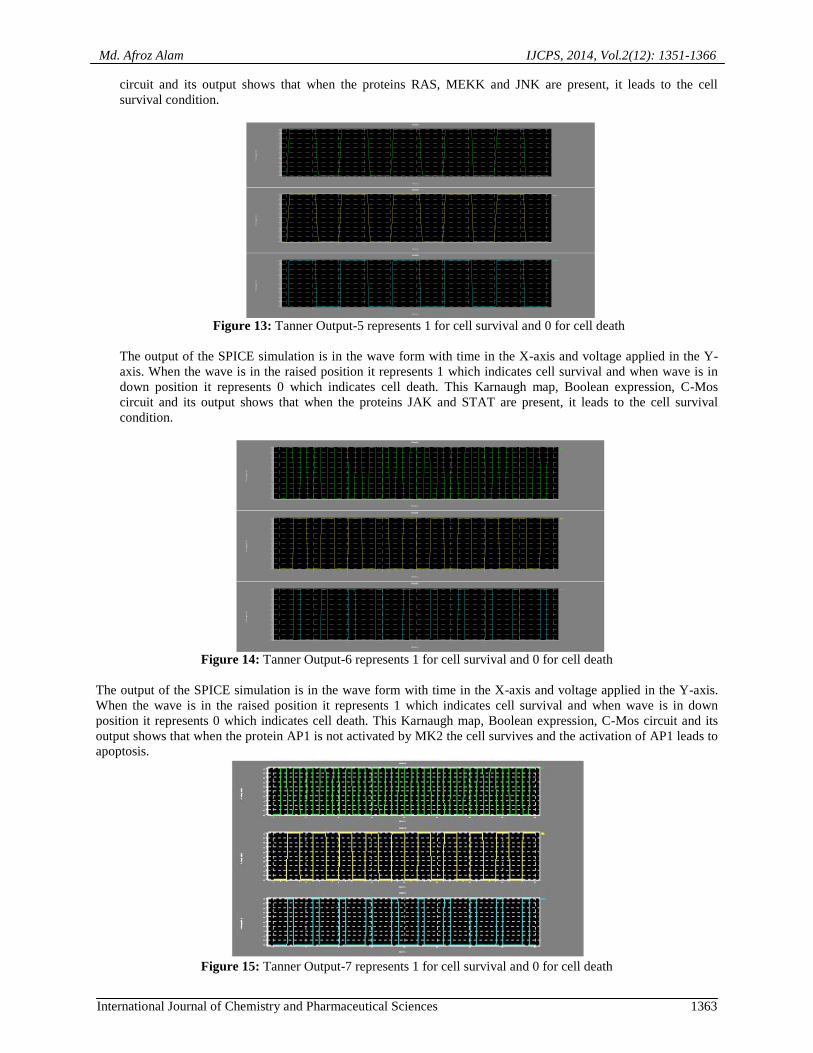
circuit and its output shows that when the proteins RAS, MEKK and JNK are present, it leads to the cellsurvival condition.
Figure 13: Tanner Output-5 represents 1 for cell survival and 0 for cell death
The output of the SPICE simulation is in the wave form with time in the X-axis and voltage applied in the Y-axis. When the wave is in the raised position it represents 1 which indicates cell survival and when wave is indown position it represents 0 which indicates cell death. This Karnaugh map, Boolean expression, C-Moscircuit and its output shows that when the proteins JAK and STAT are present, it leads to the cell survivalcondition.
Figure 14: Tanner Output-6 represents 1 for cell survival and 0 for cell death
The output of the SPICE simulation is in the wave form with time in the X-axis and voltage applied in the Y-axis.When the wave is in the raised position it represents 1 which indicates cell survival and when wave is in downposition it represents 0 which indicates cell death. This Karnaugh map, Boolean expression, C-Mos circuit and itsoutput shows that when the protein AP1 is not activated by MK2 the cell survives and the activation of AP1 leads toapoptosis.
Figure 15: Tanner Output-7 represents 1 for cell survival and 0 for cell death
0 .0 0 .1 0 .2 0 .3 0 .4 0 .5 0 .6 0 .7 0 .8 0 .9 1 .0
Time (us)
0 .0
0 .5
1 .0
1 .5
2 .0
2 .5
3 .0
3 .5
4 .0
4 .5
5 .0
Vo
ltag
e (V
)
v( JAK)
Module0
0 .0 0 .1 0 .2 0 .3 0 .4 0 .5 0 .6 0 .7 0 .8 0 .9 1 .0
Time (us)
0 .0
0 .5
1 .0
1 .5
2 .0
2 .5
3 .0
3 .5
4 .0
4 .5
5 .0
Vo
ltag
e (V
)
v( STAT)
Module0
0 .0 0 .1 0 .2 0 .3 0 .4 0 .5 0 .6 0 .7 0 .8 0 .9 1 .0
Time (us)
0 .0
0 .5
1 .0
1 .5
2 .0
2 .5
3 .0
3 .5
4 .0
4 .5
5 .0
Vo
ltag
e (V
)
v( Out put )
Module0
0 5 0 1 00 1 50 2 00 2 50 3 00 3 50 4 00
Time (ns)
0 .0
0 .5
1 .0
1 .5
2 .0
2 .5
3 .0
3 .5
4 .0
4 .5
5 .0
Vo
ltag
e (V
)
v( AP1 )
Module0
0 5 0 1 00 1 50 2 00 2 50 3 00 3 50 4 00
Time (ns)
0 .0
0 .5
1 .0
1 .5
2 .0
2 .5
3 .0
3 .5
4 .0
4 .5
5 .0
Vo
ltag
e (V
)
v( MK2)
Module0
0 5 0 1 00 1 50 2 00 2 50 3 00 3 50 4 00
Time (ns)
0 .0
0 .5
1 .0
1 .5
2 .0
2 .5
3 .0
3 .5
4 .0
4 .5
5 .0
Vo
ltag
e (V
)
v( Out put )
Module0

Md. Afroz Alam IJCPS, 2014, Vol.2(12): 1351-1366
International Journal of Chemistry and Pharmaceutical Sciences 1364
The output of the SPICE simulation is in the wave form with time in the X-axis and voltage applied in the Y-axis.When the wave is in the raised position it represents 1 which indicates cell survival and when wave is in downposition it represents 0 which indicates cell death. This Karnaugh map, Boolean expression, C-Mos circuit and itsoutput shows that when the protein AP1 is not activated by MK2 the cell survives and the activation of AP1 leads toapoptosis. In accordance with the previous work done the decomposed EGFR pathway has been successfullymodeled using the T-SPICE simulator and five cell survival conditions as well as two cell death conditions havebeen shown (Figure 9 -15). Which is similar model to (Jain, et. al., 2009, 2010).
Figure 16: Graph for Training Set of Neural Network
The graph shows (Figure 16) the 256 conditions in truth table (Table 8) by which the Neural Network toolbox ofMatlab has been trained. Since the eight proteins should be present for the cell to survive the truth table representedan AND gate and results congruence to (Jain et. al., 2009).
Figure 17: Graph for Test Set 1 of Neural Network
Figure 18: Graph for Test Set 2 of Neural Network
The graph (Figure 17) for test sets (Table 9) show the different conditions experimented with the Neural Networktoolbox of Matlab which had been trained using the 256 conditions. The graph (Figure 18) for test sets (Table 10)

Md. Afroz Alam IJCPS, 2014, Vol.2(12): 1351-1366
International Journal of Chemistry and Pharmaceutical Sciences 1365
also shows that each of the eight proteins should be present for the cell to survive. It also confirmed that quinazolinehave a great affinity towards mutated proteins when compared with the normally active protein (Kotra et al., 2008).
4. ConclusionThe computational network model of protein kinases for cell survival/death had been constructed by using theproteins involved in EGFR pathway. With that model the truth table, boolean expression and C–Mos circuit hadbeen made for each possible pathway. Then each sub pathway had been combined and simulated using the NeuralNetwork Toolbox in Matlab. The action of quinazoline drug on EGFR protein had been studied and found out thatthe EGFR proteins having mutation has higher affinity towards quinazoline than the normally active protein. It wasalso found out that each quinazoline derivatives have specific action on different mutations which eventually lead todifferent kinds of cancer. This study helped to guide the use of currently available EGFR inhibitors and providednew direction for the design and development of even more potent inhibitors that are tailored to specific EGFRmutants. We conclude that it is possible to build self consistent prediction model that can computationally yieldimportant insights into the control of cell survival/death responses. This work also helped in the better predicamentof clinical efficacy in terms of binding efficacy of quinazoline derivatives with EGFR protein.
5. AcknowledgementsWe are thankful to Dr. Patrik Gomez and Dr. J. Jannet Vennila, Karunya University for providing a very niceworking atmosphere and resource.
6. References1. Balabin, R. M. and Lomakina, E. I. Neural network approach to quantum-chemistry data: Accurate
prediction of density functional theory energies. J. Chem. Phys., 2009, 131, 74-104.2. Carpenter, G. The EGF receptor: a nexus for trafficking and signaling. J. Bioessays., 2000, 22, 697-707.3. Dhanasekaran, N. and Reddy, P. E. (1998). Signaling by dual specificity kinases. J. Oncogene, 1998, 17,
1447–1455.4. Fujii, Y., Okitsu, Y., Matsuno, H., Miyano, S. and Inouye, S. T. (2006). A New Regulatory Interactions
Suggested by Simulations for Circadian Genetic Control Mechanism in Mammals. J. Bioinfo. Comp. Bio.,2006, 4, 139-153.
5. Gago, F., Pande, V. and Ramos, M. J. The Protein Kinase Inhibitor Balanol: Structure–ActivityRelationships and Structure-Based Computational Studies. Anti-Cancer Agents in Medicinal Chemistry.,2008, 8, 638-645.
6. Hanks, S. K., Quinn, A. M. and Hunter, T. The protein kinase family: conserved features and deducedphylogeny of the catalytic domains. J. Science., 1988, 241, 42–52.
7. Hennequin, L. F., Stokes, E. S., Thomas, A. P., Johnstone, C., Ogilvie, D. J., Dukes, M., Wedge, S. R.,Kedrew, J. and Curwen, J. O. (2002). Novel 4-anilinoquinazolines with C-7 basic side chains: design andstructure activity relationship of a series of potent, orally active, VEGF receptor tyrosine kinase inhibitors.J Med Chem., 2002, 45, 1300–1312.
8. Jain, S., Naik, P. K. and Bhooshan, S. V. A system model for cell death/ survival using spice and ladderlogic. J. Nano. and Biosci., 2010, 5, 57-66.
9. Jain, S., Naik, P. K. and Sharma, R. A computational model for cell survival/death using VHDL andMatlab simulator. J. Nano. and Biosci., 2009, 4, 863-879.
10. Jain, S., Bhooshan, S. V. and Naik, P. K., (2010). Model of Mitogen Activated Protein Kinases for CellSurvival/Death and its equivalent Bio-circuit. J. Bio. Sci., 2010, 2, 59-71.
11. James, B. J., Navaratnam, S., Pitz, M. W., Maniate, J. M., Baust, H., Gingerich, J., Skliris, G. P., Murphy,L. C., Wiechec, E. and Los, M. (2006). Targeting the EGFR Pathway for Cancer Therapy. J. Med. Chem.,2006, 13, 1-10.
12. Kotra, S., Madala, K. and Jamil, K. Homology models of the mutated EGFR and their response towardsquinazoline analogues. J. Mol. Grap. and Model., 2008, 27, 244–254.
13. Lo, H. W. and Hung, M. C. Nuclear EGFR signalling network in cancers: linking EGFR pathway to cellcycle progression, nitric oxide pathway and patient survival. J. Cancer., 2006, 94,184-188.
14. Manning, G. and Whyte, D. B. The protein kinase complement of the human genome. J. Science., 2002,298, 1912–1934.
15. Nagel, L. W. and Rohrer, R. A. Computer Analysis of Nonlinear Circuits, Excluding Radiation. J. SolidState Circuits., 1971, 6, 166-182.
16. Parker, P. J. and Parkinson, S. J. AGC protein kinase phosphorylation and protein kinase. J. Biochem.,2001, 29, 860-863.
17. Paul, M. K. and Mukhopahyay, A. K. Tyrosine kinase- Role and significance in cancer. Int. J. Med. Sci.,2005, 2, 101-115.

Md. Afroz Alam IJCPS, 2014, Vol.2(12): 1351-1366
International Journal of Chemistry and Pharmaceutical Sciences 1366
18. Radha, V., Nambirajan, S. and Swarup, G. Association of Lyn tyrosine kinase with the nuclear matrix andcell-cycle-dependent changes in matrix-associated tyrosine kinase activity. J. Biochem., 1996, 236, 352–359.
19. Siegelmann, H. T. and Sontag, E.D. Turing computability with neural nets. J. Appl. Math. Lett., 1991, 4,77–80.
20. Wang, Y., Pennock, S., Chen, X. and Wang, Z. Endosomal Signaling of Epidermal Growth Factor ReceptorStimulates Signal Transduction Pathways Leading to Cell Survival. J. Mol. and Cell Bio., 2002, 22, 7279-7290.
21. Warwick, C. Everything you always wanted to know about SPICE, but were afraid to ask. J. EMC., 2009,82, 27-29.