Embed Size (px)
Citation preview
Int. J. Corros. Scale Inhib., 2017, 6, no. 1, 18–31
Study of surface morphology and inhibition efficiency of mild steel
in simulated concrete pore solution by lactic acid–Zn2+
system
P.N. Devi,1 J. Sathiyabama
1 and S. Rajendran
1,2
1 PG and Research Department of Chemistry, GTN Arts College, Dindigul-624005, India
2Corrosion Research Centre, Department of Chemistry, St Antony’s College of Arts
and Sciences for Women, Amala Annai Nagar, Thamaraipadi (Post),
Dindigul – 624 005, Tamilnadu, India
E-mail: [email protected]
Abstract
The inhibition efficiency (IE) of lactic acid–Zn2+
system in controlling corrosion of mild
steel in simulated concrete pore solution (SCPS) prepared in well water in the absence and
presence of Zn2+
has been investigated by weight loss study. The formulation consisting of
250 ppm of lactic acid and 50 ppm of Zn2+
provides 94% of inhibition efficiency.
Inhibition was found to increase with an increasing concentration of lactic acid and Zn2+
.
Polarization resistance was measured by weight loss method, polarization study. The
surface morphology has been investigated by SEM and AFM.
Keywords: concrete corrosion, simulated concrete pore solution, mild steel, lactic acid,
well water.
Received: November 19, 2016. Published: December 27, 2016. doi: 10.17675/2305-6894-2017-6-1-2
Introduction
The corrosion of concrete steel reinforcement is a major issue that concerns not only the
civil engineering industry but also other areas such as the nuclear industry. Due to the
alkalinity of the interstitial solution (pH 13), steel reinforcements remain passive. Long
term exposure to environmental actions (chemical, biological and physical effects of the
environment), causes deterioration of concrete and reinforcement. When considering the
reliability of structures all type of actions should be taken into accounts. This holistic
approach to the design and verification of structures shall be applied to all constructions
especially civil engineering works, because of their larger ratio between the area exposed
to the surrounding environment and cross-section dimensions as well as longer design life
[1].
Metals are extracted from their ores by reduction process. When metals come in
contact with the environment, especially oxygen and moisture, they deteriorate. This
process, we call corrosion. Corrosion is the desire of pure metals to go back to its original
state of ores. Corrosion is a natural, spontaneous and thermodynamically stable process.
The process of corrosion can be controlled but it cannot be prevented. Carbon steel

Int. J. Corros. Scale Inhib., 2017, 6, no. 1, 18–31 19
reinforcements in concrete structures are in passive conditions that they are protected by a
thin oxide layer promoted by the concrete alkalinity. Corrosion can initiate only when
passivity is destroyed. This occurs in two ways: carbonation of concrete, the reaction of
atmospheric CO2 with cement paste, that lowers pH and causes general corrosion; the
presence of chlorides at the steel surface in concentration higher than a critical threshold,
generally considered in the range of 0.4–1% by a cement weight [2]. Among available
methods, corrosion inhibitors seem to be attractive because of their low cost and easy
handling, compared with other preventive methods. Inhibitors can be divided in two
groups: admixed inhibitors, added to fresh concrete for new structures, and migrating
inhibitors, which can penetrate into the hardened concrete and are usually proposed in
repair systems. While admixed inhibitors are commercially available since 70’s, migrating
corrosion inhibitors for concrete structures were proposed in the last 15–20 years [3].
Nowadays, there are several admixtures available on the market: inorganic compounds
based on nitrites, especially used as additives [4–8] and sodium monofluorophosphate
used as migrating inhibitors [9, 10], organic compounds based on mixtures of
alkanolamines, amines or amino acids, or based on an emulsion of unsaturated fatty acid,
proposed both as admixed and migrating inhibitor [11]. Other non commercial inhibitors,
both inorganic and organic were studied: zinc oxide [12], molybdates and borates [13],
stannates [14], carboxylate ions, quaternary ammonium salts and many other organic
compounds [15]. The present work is undertaken:
1. To evaluate the inhibition efficiency and the corrosion resistance by weight loss method
and electrochemical studies.
2. To study of the surface morphology by FTIR, scanning electron microscopy (SEM) and
atomic force microscope (AFM).
Experimental section
Preparation of simulated concrete pore solution (SCPS)
Simulated concrete pore solution mainly consists of saturated Ca(OH)2, KOH, and NaOH
with the pH 13.5 [16]. However in numerous studies of rebar corrosion, saturated Ca(OH)2
has been used a substitute for pore solution. Saturated calcium hydroxide solution is used
in present study, as simulated concrete pore solution with the pH 12.5.
Preparation of the specimens
Metal specimens of the dimensions 1 × 4 × 0.2 cm were polished to a mirror finish and
degreased with acetone. Then they were used for the weight-loss method and surface
examination studies. The environment chosen is well water and the physico-chemical
parameters of well water are given in Table 1.

Int. J. Corros. Scale Inhib., 2017, 6, no. 1, 18–31 20
Table 1. Physicochemical parameters of well water.
Parameters Value
pH 8.38
Conductivity 1770 μΩ–1
cm–1
Chloride 665 ppm
Sulphate 214 ppm
TDS 1100 ppm
Total hardness 402 ppm
Total alkalinity 390 ppm
Magnesium 83 ppm
Potassium 55 ppm
Sodium 172 ppm
Calcium 88 ppm
Determination of Corrosion Rate
The weighed specimens in triplicate were suspended by means of glass hooks in 100 ml
SCPS prepared in well water containing various concentration of lactic acid in the presence
and absence of Zn2+
for one day. The specimen were taken out, washed in running water,
dried, and weighed. From the change in weights of the specimens, corrosion rates were
calculated using the following relationship:
CR=[(Weight loss in mg)/(Area of specimens in dm2×Immersion period in days)] mdd (1)
Corrosion inhibition efficiency (IE, %) was then calculated using the equation:
IE = 100[1– (W2/W1)] % (2)
Where, W1 = corrosion rate in the absence of the inhibitors, and W2 = corrosion rate in the
presence of the inhibitors.
Potentiodynamic Polarization
Polarization studies were carried out in a CHI – Electrochemical workstation with
impedance, Model 660A. A three-electrode cell assembly was used. The three electrode
assembly is shown in Figure 1. The working electrode was mild steel. A saturated calomel
electrode (SCE) was the reference electrode and platinum was the counter electrode. From
the polarization study, corrosion parameters such as corrosion potential (Ecorr), corrosion
current (Icorr) and Tafel slopes (anodic = ba and cathodic = bc) and Linear polarization
resistance (LPR) were calculated. The scan rate (V/s) was 0.01. Hold time at (Efcs) was
zero and quit time (s) was two.

Int. J. Corros. Scale Inhib., 2017, 6, no. 1, 18–31 21
Figure 1. Circuit diagram of three-electrode cell assembly.
Fourier Transform Infrared Spectra
These spectra were recorded in a Perkin-Elmer 1600 spectrometer using KBr pellets. The
spectrum of the protective film was recorded by carefully removing the film, mixing it with
KBr and making the pellet.
Scanning Electron Microscopic Studies (SEM)
The carbon steel immersed in blank solution and in the inhibitor solution for a period of
one day was removed, rinsed with double-distilled water, dried, and observed in a scanning
electron microscope to examine the surface morphology. The surface morphology
measurements of carbon steel were examined using JEOL MODEL6390 computer-
controlled scanning electron microscope.
Atomic Force of Microscopy
The mild steel specimens were immersed in blank and in the inhibitor solution for a period
of one day. The specimens were removed, rinsed with double distilled water, dried and
subjected to the surface examination. Atomic force microscopy (Veeco Innova model) was
used to observe the samples surface in tapping model, using cantilever with linear tips. The
scanning area in the images was 50 µm × 50 µm and the scan rate was 1 m/s.
Results and Discussion
Analysis of Weight loss Study
Corrosion rates of carbon steel immersed in SCPS prepared in well water in the absence
and presence of inhibitors (lactic acid and Zn2+
system) were calculated. The calculated
corrosion inhibition efficiency (IE) and corrosion rates (CR) of lactic acid in controlling
corrosion of SCPS in well water, for a period of one day in absence and presence of zinc
ion are given in Table 2 and represented in Figure 2. It is observed from the Table 2 that
lactic acid is a good inhibitor. The IE is found to be enhanced in the presence of Zn2+
ion.
Lactic acid alone shows some inhibition efficiencies. The formulation consisting of
250 ppm of lactic acid and 50 ppm of Zn2+
shows 94% of inhibition efficiency. Weight loss

Int. J. Corros. Scale Inhib., 2017, 6, no. 1, 18–31 22
study reveals that lactic acid and Zn2+
individually showed some IE, but exhibited better IE
when applied in combination. This suggests that LA and Zn2+
exhibit synergistic behaviour
[17–20].
Table 2. Corrosion rates (CR) of mild steel immersed in simulated concrete pore solution (SCPS)
prepared in well water in the presence and absence of lactic acid Zn2+
in the inhibition efficiency (IE)
obtained by weight loss method.
Lactic acid
ppm
Zn2+
(0 ppm) Zn2+
(25 ppm) Zn2+
(50 ppm)
IE% CR, mdd IE% CR, mdd IE% CR, mdd
0 – 16 17 13.2 21 14.0
50 19 12.96 31 11.04 38 9.92
100 25 12.00 38 9.92 50 8.00
150 36 10.24 40 9.60 65 5.60
200 44 8.96 50 8.00 81 3.40
250 63 5.92 75 4.00 94 0.96
Figure 2. Corrosion rates (CR) and inhibition efficiency (IE) of lactic acid–Zn2+
system in the
corrosion of mild steel immersed in simulated concrete pore solution (SCPS) prepared in well
water.
1 2 3 4 5 6
0
50
100
150
200
250
50 50 50 50 50 50
21
38 50
65 81
94
14 9.92 8 5.6 3.4 0.96
Lactic acid ppm Zn2+ IE (%) CR mdd

Int. J. Corros. Scale Inhib., 2017, 6, no. 1, 18–31 23
Analysis of Polarization Curves
When mild steel is immersed in simulated concrete pore solution prepared in well water
the corrosion potential was –842 mV vs SCE (Figure 3). When lactic acid (250 ppm) and
Zn2+
(50 ppm) are added to the above system the corrosion potential shifted to the anodic
side –774 mV vs SCE; that is noble side. This indicates that the LA–Zn2+
system controls
anodic reaction predominantly. It is inferred that a passive film is formed on the metal
surface in presence of inhibitor. The shifting of corrosion potential towards anodic side in
presence of inhibitors has been reported by several researchers [21–24].
Figure 3. Polarization curves of mild steel immersed in various test solution: a) SCPS ; b)
lactic acid 250 ppm + Zn2+
50 ppm.
Further, the LPR value increases from 41473 Ohm cm2 to 47099 Ohm cm
2; the
corrosion current decreases from 7.237·10–7
A/cm2 to 5.768·10
–7 A/cm
2. When a passive
film formed on mild steel surface, in presence of inhibitor system the electron transfer from
the metal surface towards the bulk of the solution is difficult and prevented. So rate of
corrosion decreases and hence corrosion current decreases in presence of inhibitor system.
Table 3. Corrosion parameters of mild steel immersed in SCPS prepared in well water in the absence and
presence of inhibitor system obtained from Potentiodynamic Polarization Study.
System Ecorr
mV vs SCE
bc
mV/ decade
ba
mV/decade
LPR
Ohm cm2
Icorr
A/cm2
SCPS –842 131 145 41473 7.237·10–7
SCPS + lactic acid 250 ppm +
Zn2+
50ppm –774 171 213 47099 5.768·10
–7

Int. J. Corros. Scale Inhib., 2017, 6, no. 1, 18–31 24
Analysis of AC Impedance spectra
AC impedance spectra (electrochemical impedance spectra) have been used to confirm the
formation of protective film on the metal surface. If a protective film is formed on the
metal surface, charge transfer resistance decreases and the impedance log (z/ohm) value
increases [25, 26]. The AC impedance spectra of mild steel immersed in SCPS prepared in
well water in the absence and presence of inhibitors (LA–Zn2+
) are shown in Figure 4
(Nyquist plots) and Figures 5a and 5b (Bode plots). The AC impedance parameters namely
charge transfer resistance (Rt) and double layer capacitance (Cdl) derived from Nyquist
plots are given in Table 4. The impedance log (z/ohm) values derived from Bode plots are
also given in Table 4.
Table 4. Corrosion parameters of mild steel immersed in SCPS prepared in well water in the absence and
presence of inhibitor system obtained from AC impedance spectra.
System
Nyquist plot Bode plot
Rt, Ohm cm2 Cdl, F/cm
2
Impedance value
log (z/Ohm)
SCPS 566 9.013·10–9
2.86
SCPS + lactic acid 250 ppm +
+ Zn2+
25 ppm 1385 3.683·10
–9 3.28
It is observed that when the inhibitors lactic acid (250 ppm) + Zn2+
(50 ppm) are
added to SCPS, the charge transfer resistance (Rt) increases from 566 Ohm cm2
to1385 Ohm cm2. The Cdl value decreases from 9.013·10
–9 F/cm
2 to 3.683·10
–9 F/cm
2. The
impedance values [log (z/ohm)] increases from 2.86 to 3.28. These results lead to the
conclusion that a protective film is formed on the metal surface.
Figure 4. AC Impendence curves of mild steel immersed in various test solution (Nyquist
plots ): a) SCPS; b) SCPS + lactic acid 250 ppm + Zn2+
50 ppm.

Int. J. Corros. Scale Inhib., 2017, 6, no. 1, 18–31 25
Figure 5(a). AC impendance spectra of mild steel immersed in SCPS (Bode plots).
Figure 5(b). AC impendance spectrum of mild steel immersed in SCPS + 250 ppm lactic acid +
25 ppm Zn2+
system (Bode plots).
Analysis of FTIR spectra
The FTIR spectra were used to analyze the inhibitor film formed on mild steel. The FTIR
spectrum of the pure lactic acid (Figure 6a) is compared with the FTIR spectrum of film
formed on the metal surface after immersion in SCPS prepared in well water containing
250 ppm of lactic acid and 50 ppm of Zn2+
(Fig. 6b). The results showed that the OH
stretching frequency of pure lactic acid appears at 3464 cm–1
where as in the SCPS
containing 250 ppm of lactic acid and 50 ppm of Zn2+
system, the stretching frequency has
shifted from 3464 cm–1
to 3358 cm–1
. In case of C=O, the stretching frequency which
appeared at 1733 cm–1
for lactic acid has disappeared for the SCPS system containing
250 ppm of lactic acid and 50 ppm of Zn2+
system. This confirms that the oxygen atom of

Int. J. Corros. Scale Inhib., 2017, 6, no. 1, 18–31 26
carboxyl group has coordinated with Fe2+
resulting in the formation of Fe2+
–lactic acid
complex formed on the metal surface. And also, the peak appearing at 1435, 1024 and
693 cm–1
confirmed the presence of calcium carbonate, calcium oxide and calcium
hydroxide formed on the metal surface [27, 28].
Figure 6(a). FTIR spectrum of pure lactic acid.
Figure 6(b). FTIR spectrum of inhibitor film formed on the mild steel after immersion in
SCPS prepared in well water containing of 250 ppm lactic acid and 50 ppm of Zn2+
.
ACICSt.Joseph's College ( Autonomous)
Trichy-2
Spectrum Name: IR--L1-.sp
4000.0 3600 3200 2800 2400 2000 1800 1600 1400 1200 1000 800 600 400.0
0.0
5
10
15
20
25
30
35
40
45
50
55
60
65
70
75
80
85
90
95
100.0
cm-1
%T
3464.53
2011.45
1733.61
1457.33
1377.38
1218.93
1126.81
1045.14
922.14
869.40
822.12
746.54
647.61
ACICSt.Joseph's College ( Autonomous)
Trichy-2
Spectrum Name: M-B.sp
4000.0 3600 3200 2800 2400 2000 1800 1600 1400 1200 1000 800 600 400.0
0.0
5
10
15
20
25
30
35
40
45
50
55
60
65
70
75
80
85
90
95
100.0
cm-1
%T
3967.74
3773.11
3358.21
2918.80 2428.69
2038.46
1616.28
1435.13
1024.86
693.85
598.41
491.34

Int. J. Corros. Scale Inhib., 2017, 6, no. 1, 18–31 27
Scanning Electron Microscopy( SEM)
Surface morphology of mild steel was studied by scanning electron microscopy after 24 h
immersion in SCPS before and after addition of inhibitor. Figure 7(a) represent the
micrograph obtained of polished steel without being exposed to the corrosive environment
while Figure 7(b) showed strongly damaged steel surface due to the formation of corrosion
products after immersion in SCPS. SEM images of steel surface after immersion in
250 ppm lactic acid and 50 ppm Zn2+
are shown in Figure 7(c).
The SEM micrograph (×1000) of Figure 7(a) shows the smooth surface of mild steel
without any corrosion product or inhibitor complex on the metal surface. Inspection of
Figure 7(b) reveals that the mild steel immersed in SCPS shows an aggressive attack of the
corroding medium on the steel surface. In contrast, in the presence of 250 ppm lactic acid
and 50 ppm Zn2+
the mild steel surface coverage increses which in turn results in the
formation of insoluble complex on the metal surface (LA + Zn inhibitor complex) [30–33].
a b c
Figure 7. SEM micrographs of (a) mild steel; magnification ×1000; (b) mild steel immersed in
SCPS prepared in well water; magnification ×1000; (c) mild steel immersed in SCPS prepared
in well water containing LA (250 ppm) + Zn2+
(50 ppm); magnification ×1000.
Atomic Force Microscopy Characterization
Atomic Force Microscopy (AFM Analysis) provides images with atomic or near-atomic-
resolution surface topography, capable of quantifying surface roughness of samples down
to the angstrom-scale. Atomic force microscopy (AFM) or scanning force microscopy
(SFM) is a very higher resolution type of scanning probe microscopy, with demonstrated
resolution on the order of fractions of a nanometer, more than 1000 times better than the
optical diffraction limit [21]. The three dimensional (3D) AFM morphologies and the AFM
cross-sectional profile for polished carbon steel surface (reference sample), carbon steel
surface immersed in SCPS (blank sample) and carbon steel surface immersed in SCPS
containing the formulation of 250 ppm of LA and 50 ppm of Zn2+
are shown as Figure 8
images (a, d), (b, e), (c, f) respectively [34, 35].

Int. J. Corros. Scale Inhib., 2017, 6, no. 1, 18–31 28
Figure 8. (a,b,c). Three dimensional AFM images of the surface of: a) As polished carbon
steel (control); b) carbon steel immersed in SCPS (blank); c) carbon steel immersed in SCPS
containing LA (250 ppm) + Zn2+
(50 ppm); (d,e,f). AFM cross-sectional images of the surface
of: d) as polished carbon steel (control); e) carbon steel immersed in SCPS (blank); f) carbon
steel immersed in SCPS containing LA (250 ppm) + Zn2+
(50 ppm).
Int. J. Corros. Scale Inhib., 2017, 6, no. 1, 18–31 29
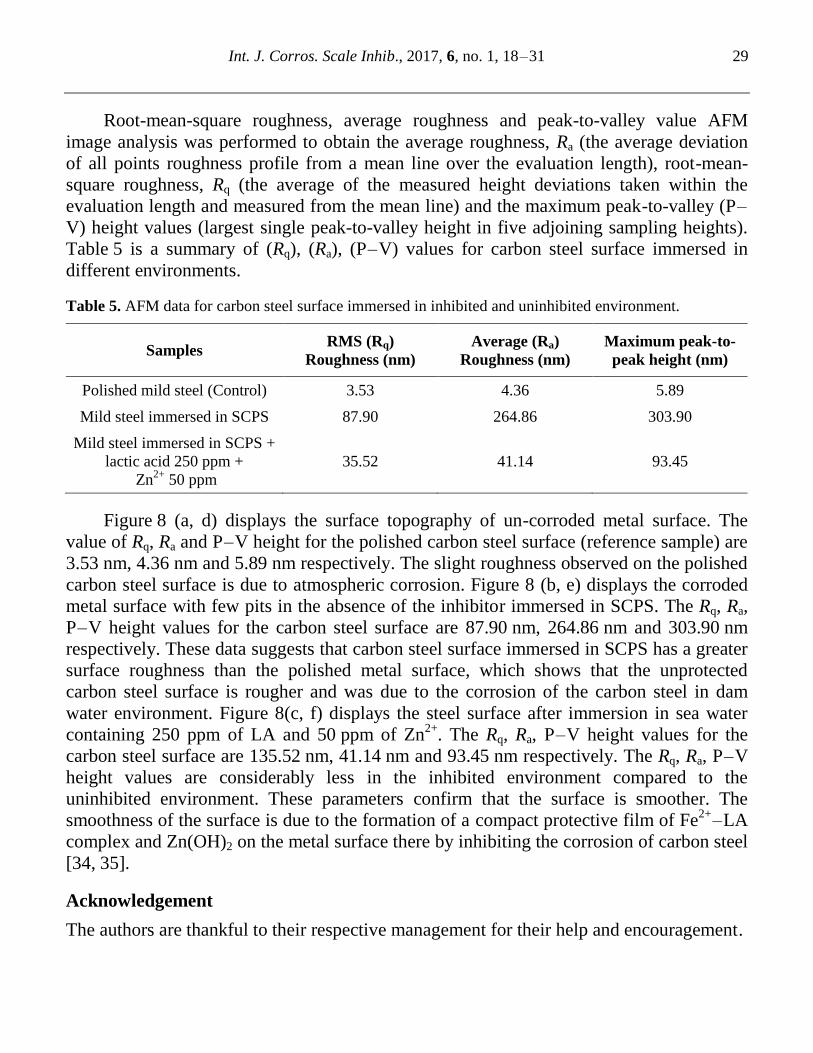
Root-mean-square roughness, average roughness and peak-to-valley value AFM
image analysis was performed to obtain the average roughness, Ra (the average deviation
of all points roughness profile from a mean line over the evaluation length), root-mean-
square roughness, Rq (the average of the measured height deviations taken within the
evaluation length and measured from the mean line) and the maximum peak-to-valley (P–
V) height values (largest single peak-to-valley height in five adjoining sampling heights).
Table 5 is a summary of (Rq), (Ra), (P–V) values for carbon steel surface immersed in
different environments.
Table 5. AFM data for carbon steel surface immersed in inhibited and uninhibited environment.
Samples RMS (Rq)
Roughness (nm)
Average (Ra)
Roughness (nm)
Maximum peak-to-
peak height (nm)
Polished mild steel (Control) 3.53 4.36 5.89
Mild steel immersed in SCPS 87.90 264.86 303.90
Mild steel immersed in SCPS +
lactic acid 250 ppm +
Zn2+
50 ppm
35.52 41.14 93.45
Figure 8 (a, d) displays the surface topography of un-corroded metal surface. The
value of Rq, Ra and P–V height for the polished carbon steel surface (reference sample) are
3.53 nm, 4.36 nm and 5.89 nm respectively. The slight roughness observed on the polished
carbon steel surface is due to atmospheric corrosion. Figure 8 (b, e) displays the corroded
metal surface with few pits in the absence of the inhibitor immersed in SCPS. The Rq, Ra,
P–V height values for the carbon steel surface are 87.90 nm, 264.86 nm and 303.90 nm
respectively. These data suggests that carbon steel surface immersed in SCPS has a greater
surface roughness than the polished metal surface, which shows that the unprotected
carbon steel surface is rougher and was due to the corrosion of the carbon steel in dam
water environment. Figure 8(c, f) displays the steel surface after immersion in sea water
containing 250 ppm of LA and 50 ppm of Zn2+
. The Rq, Ra, P–V height values for the
carbon steel surface are 135.52 nm, 41.14 nm and 93.45 nm respectively. The Rq, Ra, P–V
height values are considerably less in the inhibited environment compared to the
uninhibited environment. These parameters confirm that the surface is smoother. The
smoothness of the surface is due to the formation of a compact protective film of Fe2+
–LA
complex and Zn(OH)2 on the metal surface there by inhibiting the corrosion of carbon steel
[34, 35].
Acknowledgement
The authors are thankful to their respective management for their help and encouragement.

Int. J. Corros. Scale Inhib., 2017, 6, no. 1, 18–31 30
Conclusion
The present study leads to the following conclusions:
i. The formulation consisting of 250 ppm of lactic acid and 50 ppm of Zn2+
offers 94% IE
to mild steel immersed in simulated concrete pore solution prepared in well water.
ii. Polarization study reveals that lactic acid system controls the anodic reaction
predominantly.
iii. AC impedance spectra reveal that the formation of protective film on the metal surface.
iv. FTIR spectra reveal that the inhibitive film consists of Fe2+
–lactic acid complex,
calcium carbonate, calcium oxide and calcium hydroxide.
v. SEM and AFM images confirmed the protective film formed on the metal surface was
smooth and stable.
References
1. L. Bertonoli, B. Elsener, P. Pedeferi and R. Polder, Corrosion of Steel in Concrete:
Prevention, Diagnosis, Repair, Wiley, Weinhein, 2004.
2. C.L. Page, Nature and Properties of Concrete in Relation to Reinforcement Corrosion.
Corrosion of steel in Concrete, Aachen, 1992.
3. B. Elsener, Corrosion Inhibitors for steel in Concrete – State of the Art Report, EFC
Publications, Vol. 35, 2001.
4. N.S. Berke, Mater. Perform., 1989, 23, no. 10, 41.
5. N.S. Berke and T.G. Weil, World-wide Review of Corrosion Inhibitors in Concrete;
Advances in Concrete Technology, CANMET, 1992, Athen, Greece, pp. 899–924.
6. R. Cigna, G. Familiari, F. Gianetti and E. Proverbio, International Conference on
Corrosion and Corrosion Protection of steel in Concrete, 1994, Sheffild, 878.
7. I. Callander and A. Gianetti, A review on the use of C.N corrosion inhibitor to improve
the durability of reinforced concrete, The 2nd Annual Middle East Protection and
Rehabilitation of Reinforced Concrete Conference, Dubai, 1996, 1-1.
8. N.S. Berke and M.C. Hicks, Cem. Concr. Compos., 2004, 26, 191.
9. C. Andrade, C. Alons, M. Acha and B. Malric, Cem. Concr. Compos, 1996, 26, 191.
10. V.T. Nagla, C.L. Page and M.M. Page, Corros. Sci., 2003, 45, 1523.
11. D. Bejegovic, B. Miksic, Mater. Perform, 1999, 11, 52.
12. O.T. de Rincon Preez, E. Paredes, Y. Caldera, C. Urdaneta and C. Sandoval, Cem.
Concr. Compos, 2002, 24, 79.
13. K.K. Sagoe-Crentsil, V.T. Yilmaz and F.P. Glasser, Adv. Cem. Res., 1996, 4, 91.
14. K.K. Sagoe-Crentsil, F.P. Glasser and V.T. Yilmaz, Cem. Concr. Compos., 1994, 24,
313.
15. V. Saraswathy, S. Muralidharan, R.M. Kalyanasundaram, S. Thangavel and
S. Srinivasan, Cem. Concr. Compos., 2001, 31, 789.
16. R. Liu, L. Jiang, J. Xu, C. Xiong and Z. Song, Constr. Build. Mater., 2014, 56, 16.
17. M. Manivannan and S. Rajendran, Int. J. Eng. Sci. Technol., 2011, 3, 19.

Int. J. Corros. Scale Inhib., 2017, 6, no. 1, 18–31 31
18. V. Johnsirani, J. Sathiyabama, S. Rajendran, T. Shanthi, T.S. Muthumegala and
A. Krishnaveni, Bulg. Chem. Commun., 2012, 44, 41.
19. R. Epshiba, A.P.P. Regis and S. Rajendran, Int. J. Nano Corr. Sci. Eng., 2014, 1, no. 1,
1.
20. N. Kavitha and P. Manjula, Int. J. Nano Corr. Sci. Eng., 2014, 1, no. 1, 31.
21. R. Nagalakshmi, L. Nagarajan, R.J. Rathish, S.S. Prabha, N. Vijaya, J. Jeyasundari and
S. Rajendran, Int. J. Nano Corr. Sci. Eng., 2014, 1, no. 1, 39.
22. J. A. Thangakani, S. Rajendran, J. Sathiabam, R.M. Joany, R.J. Rathis and S.S. Prabha,
Int. J. Nano Corr. Sci. Eng., 2014, 1, no. 1, 50.
23. A. Nithya, P. Shanthy, N. Vijaya, R.J. Rathish, S.S. Prabha, R.M. Joany and
S. Rajendran, Int. J. Nano Corr. Sci. Eng., 2015, 2, no. 1, 1.
24. T. Gowrani, P. Manjula, C.N. Baby, K.N. Manonmani, R. Sudha and T. Vennila, Int. J.
Nano Corr. Sci. Eng., 2015, 2, no. 1, 12.
27. K. Namita, K. Johar, R. Bhrara, R. Epshiba and G. Singh, Int. J. Nano Corr. Sci. Eng.,
2015, 2, no. 1, 22.
25. A.C.C. Mary, S. Rajendran, H. Al-Hashem, R.J. Rathish, T. Umasankareswari and
J. Jeyasundari, Int. J. Nano Corr. Sci. Eng., 2015, 2, no. 1, 42.
26. V. Johnsirani, S. Rajendran, A. C.C. Mary, R.J. Rathish, T. Umasankareswari and
J. Jeyasundari, Int. J. Nano Corr. Sci. Eng., 2015, 2, no. 3, 22.
27. P.N. Devi, J. Sathiyabama, S. Rajendran, R. J. Rathish and S.S. Prabha, Int. J. Nano
Corr. Sci. Eng., 2015, 2, no. 4, 1.
28. T. Shanthi and S. Rajendran, J. Chem. Biol. Phys. Sci., 2013, 3, no. 4, 2550.
29. P.N. Devi, J. Sathiyabama, S. Rajendran, R.J. Rathish and S.S. Prabha, Int. J. Nano
Corr. Sci. Eng., 2015, 2, no. 3, 1.
30. D.B. Hmamou, R. Salghi, A. Zarrouk, M. Messali, H. Zarrok, M. Errami,
B. Hammouti, Lh. Bazzi and A. Chakir, Der Pharma Chemica, 2012, 4, no. 4, 1496.
31. M. Sangeetha, S. Rajendran, J. Sathiyabama, T. Umasankareswari, A. Krishnaveni and
R.M. Joany, Int. J. Nano Corr. Sci. Eng., 2015, 2, no. 3, 14.
32. P.N. Devi, J. Sathiyabama, S. Rajendran, R.J. Rathish and D. Renita, Int. J. Nano Corr.
Sci. Eng., 2015, 2, no.5, 347.
33. A.K. Singh and M.A. Quraishi, Corros. Sci., 2011, 53, no. 4, 1288.
34. M. Sangeetha, S. Rajendran, J. Sathiyabama, A. Krishnavani, N. Manimaran and
B. Shamaladevi, Port. Electrochim. Acta, 2014, 29, 429.
35. R. Vera, R. Schrebler, P. Cury, R. Del Rio and H. Romero, J. Appl. Elecrochem., 2007,
37, 519.