Embed Size (px)
Citation preview
International Journal of Database Management Systems ( IJDMS ) Vol.6, No.1, February 2014
DOI : 10.5121/ijdms.2014.6104 45
A HYBRID APPROACH FOR ANALYSIS OF
DYNAMIC CHANGES IN SPATIAL DATA
Ch. Mallikarjuna Rao1 and Dr.Ananda Rao.Akepogu
2
1Department of Computer and Engineering, G.R.I.E.T, Hyderabad, India
2Director of IR&P,SCDE, JNTUCEA, Ananthapuramu, India
ABSTRACT
Any geographic location undergoes changes over a period of time. These changes can be observed by
naked eye, only if they are huge in number spread over a small area. However, when the changes are small
and spread over a large area, it is very difficult to observe or extract the changes. Presently, there are few
methods available for tackling these types of problems, such as GRID, DBSCAN etc. However, these
existing mechanisms are not adequate for finding an accurate changes or observation which is essential
with respect to most important geometrical changes such as deforestations and land grabbing etc.,. This
paper proposes new mechanism to solve the above problem. In this proposed method, spatial image
changes are compared over a period of time taken by the satellite. Partitioning the satellite image in to
grids, employed in the proposed hybrid method, provides finer details of the image which are responsible
for improving the precision of clustering compared to whole image manipulation, used in DBSCAN, at a
time .The simplicity of DBSCAN explored while processing portioned grid portion.
KEYWORDS
Clustering, Grid-based algorithm, Grid-density, grids, Image.
1. INTRODUCTION
Detection of geometrical changes in the satellite imagery is a challenging issue as it is natural
phenomenon connected to naturally occurring disasters in the environment. The geographically
located objects are represented by spatial data which needs to be monitored for the analysis,
classification and study of various features of spatial objects. Spatial data mining is an intellectual
study of analyzing the different kinds of relationship such as topological information, spatial
indexing and distances etc..The data of collected objects are processed and there by information
of features that are distinct will be the outcome of spatial data mining.
An intensive study has been conducted on data mining, such as those are reported in [1,2,3,4]
the spatial data has been analyzed using clustering algorithms [5,6] with the main objective of
structuring data while considering similar features and attributes among the data objects.
Previous work in spatial data mining established many algorithms such as DBSCAN, GRID etc.,
DBSCAN cannot cluster data sets well with large differences in densities since the Min Pts-
combination cannot then be chosen appropriately for all clusters. Similarly, the GRID clustering
International Journal of Database Management Systems ( IJDMS ) Vol.6, No.1, February 2014
46
depends on the granularity of lowest level of grid structure. If the granularity is very fine, the cost
of processing will increase substantially. However, if the bottom level of grid structure is too
coarse, it may reduce the quality of cluster analysis. Hence, a new clustering method is proposed
,which associate with the features of GRID and DBSCAN at the same time their limitations have
been taken care.
The performance of proposed technique has been compared with existing methods using the
same data set. The innovative finding during investigation is observed as the kappa coefficient is
extremely high of our proposed hybrid algorithm [95%] when compared to the best GRID
approach [81%]. The ability of the clustering performance is carefully analyzed in both accuracy
and processing time. The innovative finding achieved in the proposed investigation is that
detection mechanism of geometrical changes in satellite image has been established with high
degree of accuracy in terms two parameters i) the number of clusters generated and ii) deviation
of spectral distribution of colors .
Paper organization: Section 2 concerns with literature survey associated with spatial data
analysis. The proposed method explained in detail in section 3..Implementation. Results and
discussions are made in section 4 and 5. Section 6 deals with conclusion and scope of the work.
2. LITERATURE SURVEY
Spatial data analysis is the process by which raw data generates useful information. In simple
words spatial analysis includes the formal methods which, study entities or objects using their
topological and geographic properties. Topology deals with the most basic properties of space
such as connectedness, geometric features, relative position of figures etc. Geographic details that
delivers in the study of science comprising of lands, features, inhabitants etc. Spatial analysis is
a set of methods whose results change when the objects location which is being analyzed, is
changed. Its results also change when the frame used to analyze them, changes. The most basic
methodology of approach in spatial data processes is modeling the spatial location of the
attributes and objects that are to be analyzed.
2.1 Significance of Spatial Data Analysis
In modern technological and scientific society, the spatio-temporal data analysis and spatial data
mining became an essential research area in solving the land cover mapping problems for urban
planning and land –usage [7] for a continuous processing and analysis of repositories of remote
sensing images to generate thematic usage of land maps and land usage [8,9] virtual globes.
Applications of the data mining covers the study of various fields such as Environment, Climate,
and Mobile-commerce etc.
Traditional techniques in data mining often exhibit poor performance when spatial and spatio-
temporal data sets are applied due to the various reasons [10,11]. First, these spatial datasets are
continuous and other kind of information is in discrete database. Second, patterns are confined to
local patterns but global patterns are most emphasized in traditional data mining techniques. A
general observed factor found in statistical treatment of analysis in the field of classical data set is
generation of data samples in an independent way. The concept of independency is the required
approach in analysis of spatial and spatio-temporal data as these data points are at high degree of
correlation [12,13]. In spatial statistical analysis mechanism of gathering the data of same
International Journal of Database Management Systems ( IJDMS ) Vol.6, No.1, February 2014
47
features or characteristics is called autocorrelation. Autocorrelation in analysis of data of spatial
and spatio-temporal characteristics may lead to hypothetical models that may not be at high
degree of accuracy or consistency with the collected data set.
Thus, there seems to be a need of introducing new innovative methods to attempt the analysis of
spatial and spatio-temporal data treated and modeled in a useful and non-trivial patterns. The
review of earlier attempts in [14,15,16] data processing suggests some of the new methods which
include the facilitation of interactions such as co-locations, co-occurrences, and tele-connections
in the process of detecting spatial outliers and prediction of locations in spite of innovative ideas
that emerges in the mining of spatio-temporal pattern.
2.2 Role of Clustering
Clustering is an important task in data mining to cluster data into significant sub groups to obtain
useful information. Clustering spatial data is a vital significant issue in detecting the hidden
patterns involved in useful sub groups. It has several applications like medical image analysis,
satellite data analysis, GIS issues etc. Clustering can be treated as data segmentation as large
data sets are made into groups in accordance with similarity in the features and characteristics.
Clustering can also be implemented for analysis of the outliers. Entities and attributes with
similar characteristics are assigned in one cluster. Outlier detection with the help of existence of
dissimilarities in the clusters is the most common application in data mining process.
3. PROPOSED METHODOLOGY AND APPROACH In this section we present our selection of techniques and analyze them according to the proposed
criteria.
3.1 Rational behind the selection of Clustering techniques:
We carefully selected clustering techniques after going through evaluation and non evaluations
data needs. The rational behind these categories is that the algorithms have to share several
properties such as spatial ,temporal and fuzzy based to improve the performance of the
techniques. The spatial evaluation concerns about mobile / immobile ,point ,line and region
features. Majority of clustering features makes use of these features. The , interval behavior of
temporal data can also guide efficient clustering. By conceding all these needs we have selected
GRID based approach to address spatial needs and DBSCAN to deal with localized temporal
features. The fusion of these techniques has become handy while arriving our new approach
“GRID-DBSCAN”. The number of clusters put the constraints on computational requirements
and accuracy of the approach. More clusters provide the finer details but require more
computational power. Less clusters limit the accuracy of approach. In our hybrid approach the
number of clusters are increase without effecting computational needs the scalability of the
approach i.e segmented images processing confined to local region there by reducing
computational needs. The approach is suitable even for parallel computing environment.
3.2 Proposed Approach.
Our new Algorithm is aimed to improve the accuracy of the clustering technique . In this method
International Journal of Database Management Systems ( IJDMS ) Vol.6, No.1, February 2014
48
the hybrid approach is used to combine the DBSCAN and GRID clustering algorithm to create a
new clustering algorithm GRID-DBSCAN. The cell hierarchical structure is formed by
rectangular cells, representing different resolutions, which are obtained by partitioning the spatial
image. These higher level rectangular cells are recursively partitioned to the corresponding lower
levels.
After construction of the GRID structure clustering on the GRID is done in the following way:
Top-down grid based method is used to perform clustering on earlier described data structure
with the help of density parameter supplied by the user. Detailed procedure is described below:
First a layer within the hierarchical structure is determined; in this work the root layer is selected.
For each cell in the current layer, compute the confidence interval that the cell which is relevant
to the clustering. Cells which do not meet the confident level are deemed as irrelevant. After
finishing the examination of the current layer, the next lower levels of the cells are examined. The
same process are repeated for the other levels .The difference is that instead of going through all
cells, only those cells that are children of the relevant cells of the previous layer are processed.
This procedure continues until it reaches the lowest level layer (bottom layer). At this time,
regions of relevant cells are processed. In GRID-DBSCAN algorithm the DBSCAN algorithm is
used for processing of the relevant bottom cells. In this process all the 6 regions (Agriculture,
water, greenery, urban, sea and other) are displayed on the clustering output. So the user need not
give any input parameter. The thresholds are calculated from the pixel information.
3.3.Image Histogram
An image histogram is a graphical representation of the tonal distribution in an image. An image
histogram plots each tonal value in terms of the respective pixels. On the visual base distribution
of colors for a specific image can be understood at glance in spectral plotting of color values.
The horizontal axis or the x-axis of the graph represents the tonal distribution and the vertical axis
or the y-axis represents the number of pixels in that particular tone. The black and dark areas are
indicated by left side of the horizontal axis. Medium grey is indicated by the middle of the
horizontal axis and light and pure white areas are shown by right side. The size of the areas
captured in the zones is shown by the vertical axis. From histogram of every dark image, it is
found that majority of data points exist in left side and center of the represented graph. In the
opposite way, bright image is found with majority of data points in the dark locations at the center
and right of the graph.
The distributions of colors are represented with a color histogram for an image. For digital
images, it represents the number of pixels that have colors in each of a fixed list of color range,
that span an image's color space.
A color histogram is plotted for any kind of color space, although it is in general used for 3-
dimensional spaces like HSV or RGB. For images, like the monochromatic images, the
term intensity histogram is generally used. For images where each pixel is denoted by an arbitrary
number of numerical estimations, i.e., the multi-spectral images, the color histogram is n-
dimensional, where n is the number of estimations carried out. Every specified pixel has identity
of certain spectrum range and limitation of wavelength, some of the pixels in the image can also
exist out of the limitations of the visible spectrum.
International Journal of Database Management Systems ( IJDMS ) Vol.6, No.1, February 2014
49
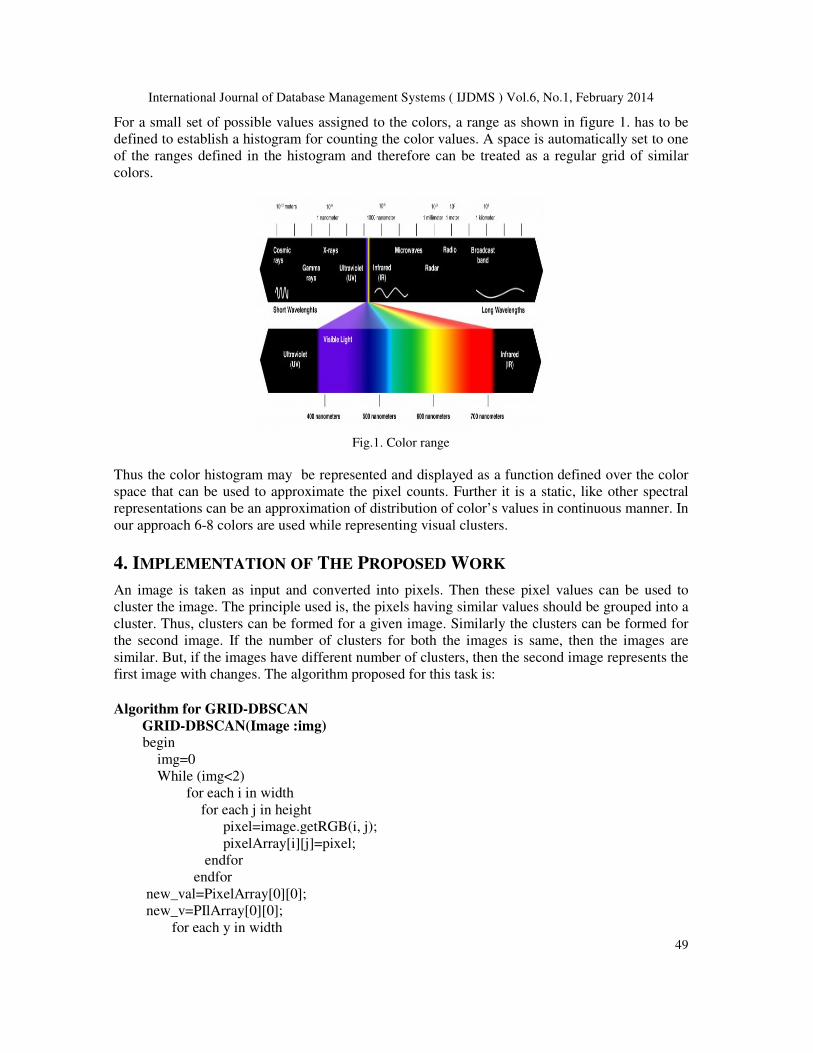
For a small set of possible values assigned to the colors, a range as shown in figure 1. has to be
defined to establish a histogram for counting the color values. A space is automatically set to one
of the ranges defined in the histogram and therefore can be treated as a regular grid of similar
colors.
Fig.1. Color range
Thus the color histogram may be represented and displayed as a function defined over the color
space that can be used to approximate the pixel counts. Further it is a static, like other spectral
representations can be an approximation of distribution of color’s values in continuous manner. In
our approach 6-8 colors are used while representing visual clusters.
4. IMPLEMENTATION OF THE PROPOSED WORK
An image is taken as input and converted into pixels. Then these pixel values can be used to
cluster the image. The principle used is, the pixels having similar values should be grouped into a
cluster. Thus, clusters can be formed for a given image. Similarly the clusters can be formed for
the second image. If the number of clusters for both the images is same, then the images are
similar. But, if the images have different number of clusters, then the second image represents the
first image with changes. The algorithm proposed for this task is:
Algorithm for GRID-DBSCAN
GRID-DBSCAN(Image :img) begin
img=0
While (img<2)
for each i in width
for each j in height
pixel=image.getRGB(i, j);
pixelArray[i][j]=pixel;
endfor
endfor
new_val=PixelArray[0][0];
new_v=PIlArray[0][0];
for each y in width

International Journal of Database Management Systems ( IJDMS ) Vol.6, No.1, February 2014
50
for each x within width
if(Math.abs(PixelArray[x][y]-new_v)>500)then
cluster[img]++;
endif
endfor
end for
img++
endwhile
if(cluster[0]==cluster[1]) then //two images are same
else // two images are different.
endif
end.
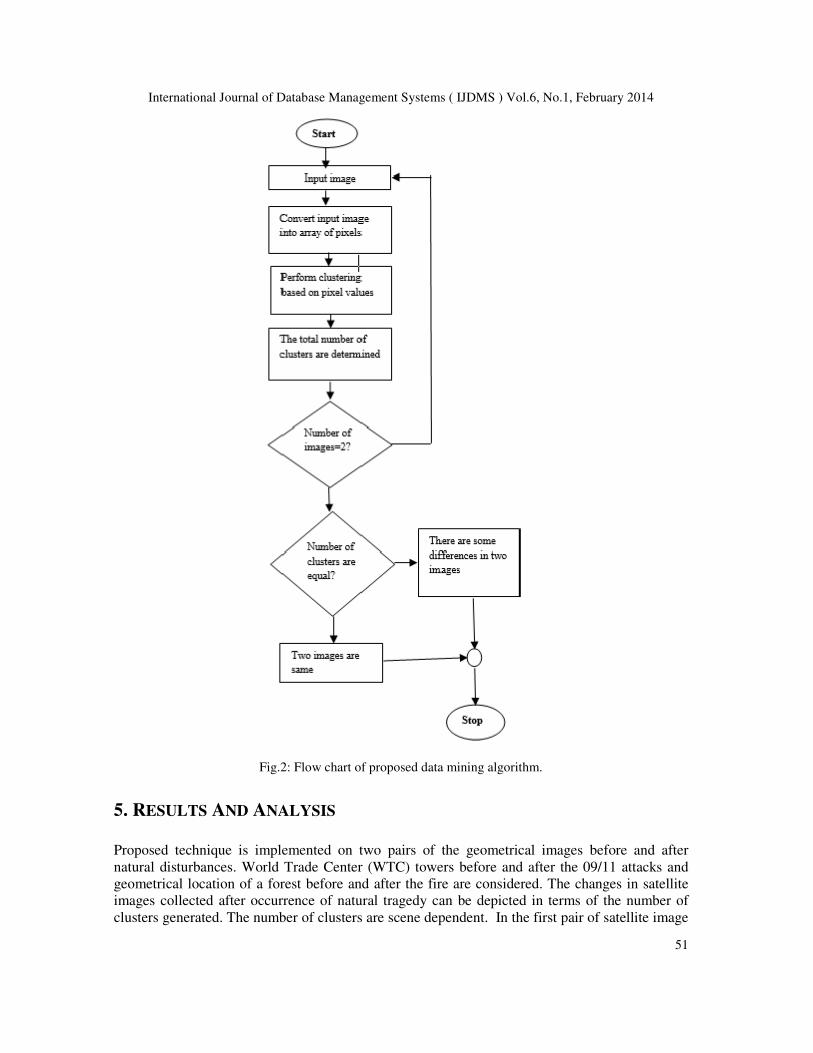
METHOD
1: Start
2: Input the first image.
3: Convert the images into pixels.
Store the pixel values as an array of pixels.
4: Determine the clusters, by placing the pixel
positions with similar pixel values into a cluster.
5: Store the total numbers of clusters in a variable.
6: Input the second image.
7: Steps 3 to 5 are made to be repeated
8: If the number of clusters for both the images
are equal then // The two images are equal
else // the two images are different.
9: End if.
10: Stop.
Flow chart for the proposed algorithm is shown below.
International Journal of Database Management Systems ( IJDMS ) Vol.6, No.1, February 2014
51
Fig.2: Flow chart of proposed data mining algorithm.
5. RESULTS AND ANALYSIS
Proposed technique is implemented on two pairs of the geometrical images before and after
natural disturbances. World Trade Center (WTC) towers before and after the 09/11 attacks and
geometrical location of a forest before and after the fire are considered. The changes in satellite
images collected after occurrence of natural tragedy can be depicted in terms of the number of
clusters generated. The number of clusters are scene dependent. In the first pair of satellite image
International Journal of Database Management Systems ( IJDMS ) Vol.6, No.1, February 2014
52
of WTC towers, the number of generated clusters is found to be 3135 and 2717 respectively
before and after the natural disturbance. In the second pair of images with forest, the numbers of
clusters generated by the proposed algorithm are 1301 and 1849 before and after the fire
respectively. The observation shows that grid or segmentation of the image fluctuates due to the
natural tragedy and it seems to be automatic alignment of the ranges of the colors as directed by
the proposed technique. And therefore corresponding changes in the number of clusters are
clearly displayed in the screen shots of the simulation of proposed algorithm in fig.(4,7).
A considerable statistical deviation of the distribution of colors that has been found in both the
pair of collected satellite images, as shown in fig 5.The spatial data gained attention from the
researchers after observing these deviations during the natural calamities and disasters. We
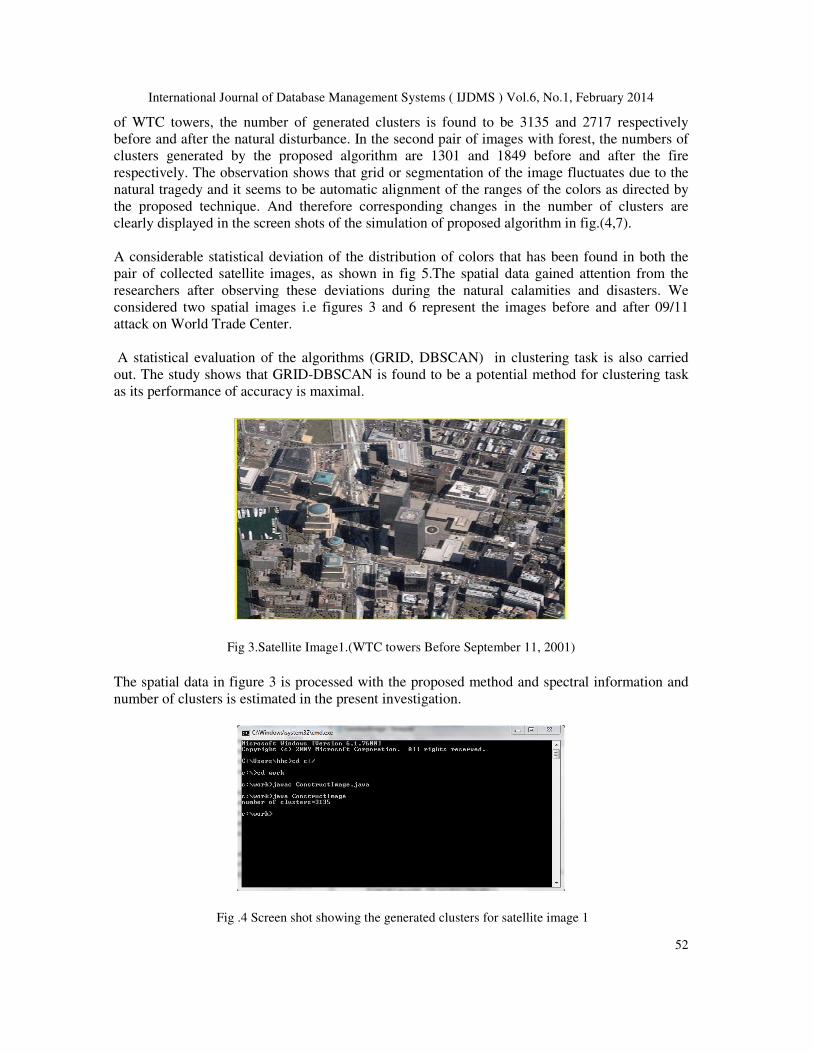
considered two spatial images i.e figures 3 and 6 represent the images before and after 09/11
attack on World Trade Center.
A statistical evaluation of the algorithms (GRID, DBSCAN) in clustering task is also carried
out. The study shows that GRID-DBSCAN is found to be a potential method for clustering task
as its performance of accuracy is maximal.
Fig 3.Satellite Image1.(WTC towers Before September 11, 2001)
The spatial data in figure 3 is processed with the proposed method and spectral information and
number of clusters is estimated in the present investigation.
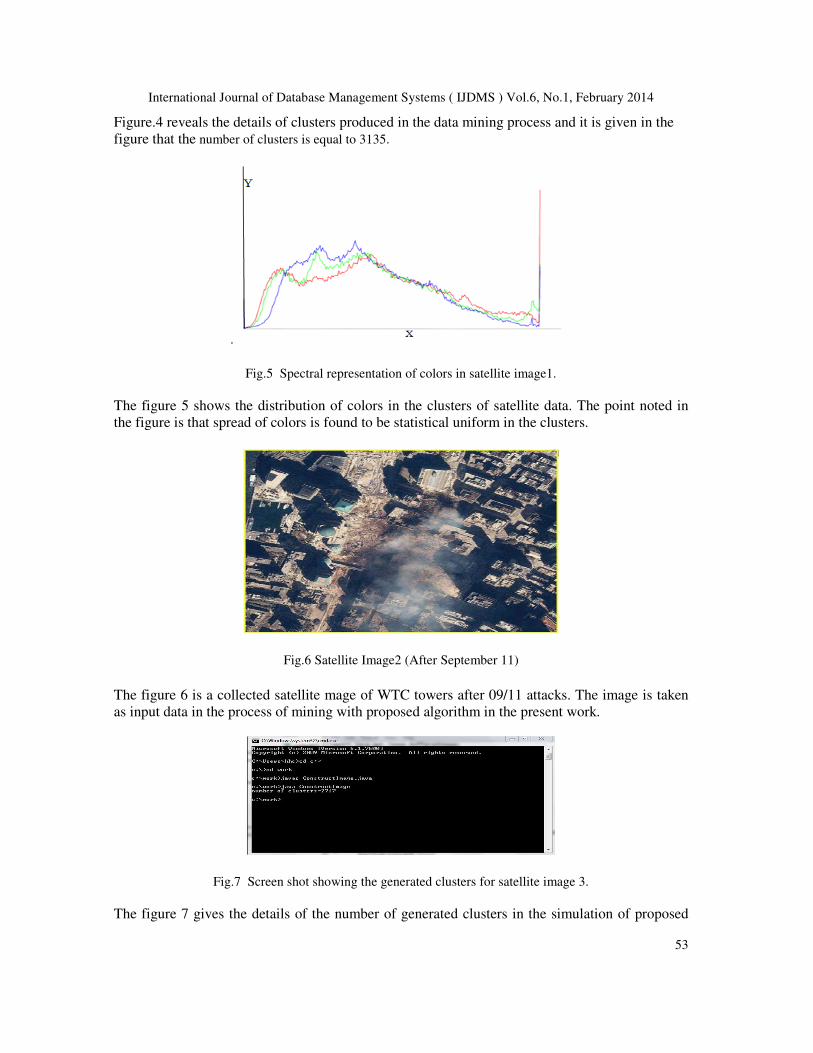
Fig .4 Screen shot showing the generated clusters for satellite image 1
International Journal of Database Management Systems ( IJDMS ) Vol.6, No.1, February 2014
53
Figure.4 reveals the details of clusters produced in the data mining process and it is given in the
figure that the number of clusters is equal to 3135.
.
Fig.5 Spectral representation of colors in satellite image1.
The figure 5 shows the distribution of colors in the clusters of satellite data. The point noted in
the figure is that spread of colors is found to be statistical uniform in the clusters.
Fig.6 Satellite Image2 (After September 11)
The figure 6 is a collected satellite mage of WTC towers after 09/11 attacks. The image is taken
as input data in the process of mining with proposed algorithm in the present work.
Fig.7 Screen shot showing the generated clusters for satellite image 3.
The figure 7 gives the details of the number of generated clusters in the simulation of proposed
International Journal of Database Management Systems ( IJDMS ) Vol.6, No.1, February 2014
54
technique. The total number of clusters in the satellite data is 2717. It is noted that this number is
less than that in the spatial data of figure 4.
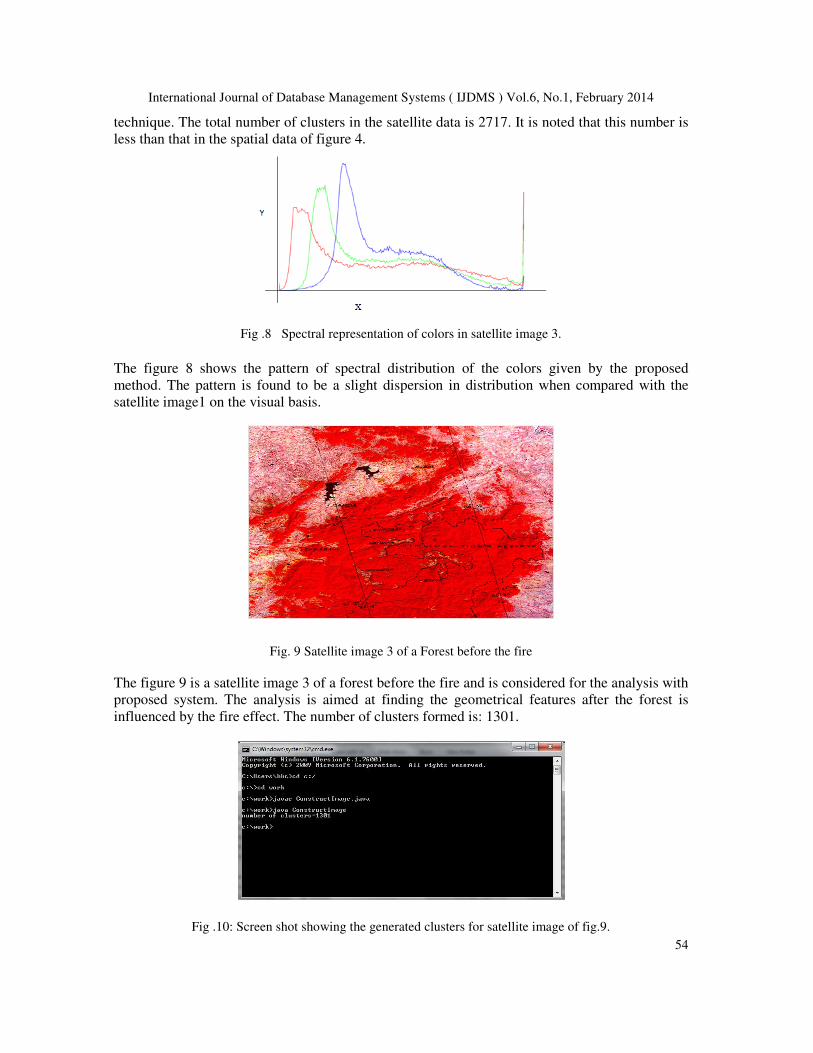
Fig .8 Spectral representation of colors in satellite image 3.
The figure 8 shows the pattern of spectral distribution of the colors given by the proposed
method. The pattern is found to be a slight dispersion in distribution when compared with the
satellite image1 on the visual basis.
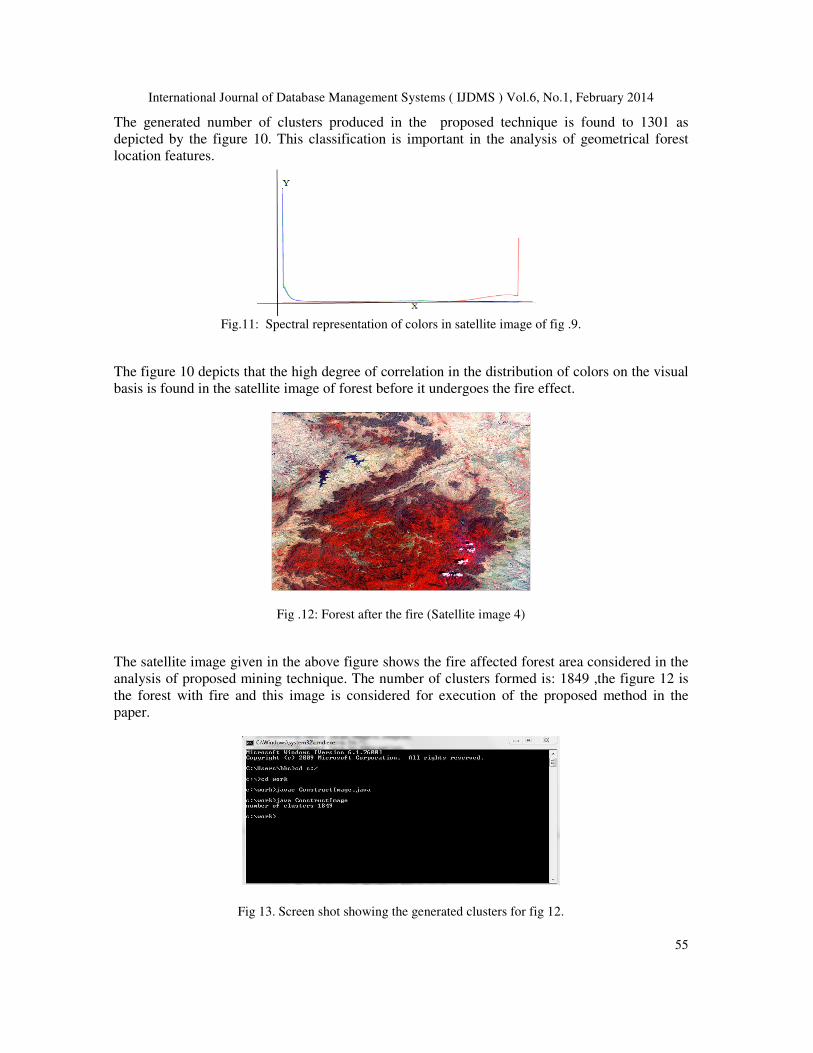
Fig. 9 Satellite image 3 of a Forest before the fire
The figure 9 is a satellite image 3 of a forest before the fire and is considered for the analysis with
proposed system. The analysis is aimed at finding the geometrical features after the forest is
influenced by the fire effect. The number of clusters formed is: 1301.
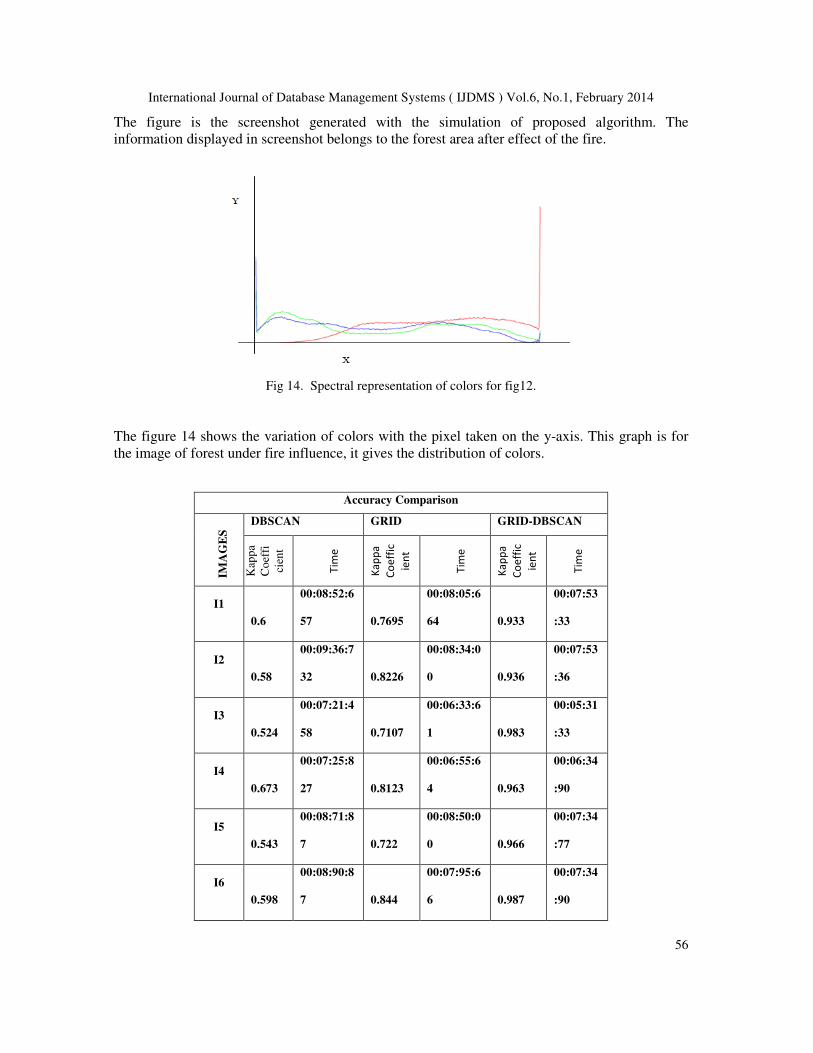
Fig .10: Screen shot showing the generated clusters for satellite image of fig.9.
International Journal of Database Management Systems ( IJDMS ) Vol.6, No.1, February 2014
55
The generated number of clusters produced in the proposed technique is found to 1301 as
depicted by the figure 10. This classification is important in the analysis of geometrical forest
location features.
Fig.11: Spectral representation of colors in satellite image of fig .9.
The figure 10 depicts that the high degree of correlation in the distribution of colors on the visual
basis is found in the satellite image of forest before it undergoes the fire effect.
Fig .12: Forest after the fire (Satellite image 4)
The satellite image given in the above figure shows the fire affected forest area considered in the
analysis of proposed mining technique. The number of clusters formed is: 1849 ,the figure 12 is
the forest with fire and this image is considered for execution of the proposed method in the
paper.
Fig 13. Screen shot showing the generated clusters for fig 12.
International Journal of Database Management Systems ( IJDMS ) Vol.6, No.1, February 2014
56
The figure is the screenshot generated with the simulation of proposed algorithm. The
information displayed in screenshot belongs to the forest area after effect of the fire.
Fig 14. Spectral representation of colors for fig12.
The figure 14 shows the variation of colors with the pixel taken on the y-axis. This graph is for
the image of forest under fire influence, it gives the distribution of colors.
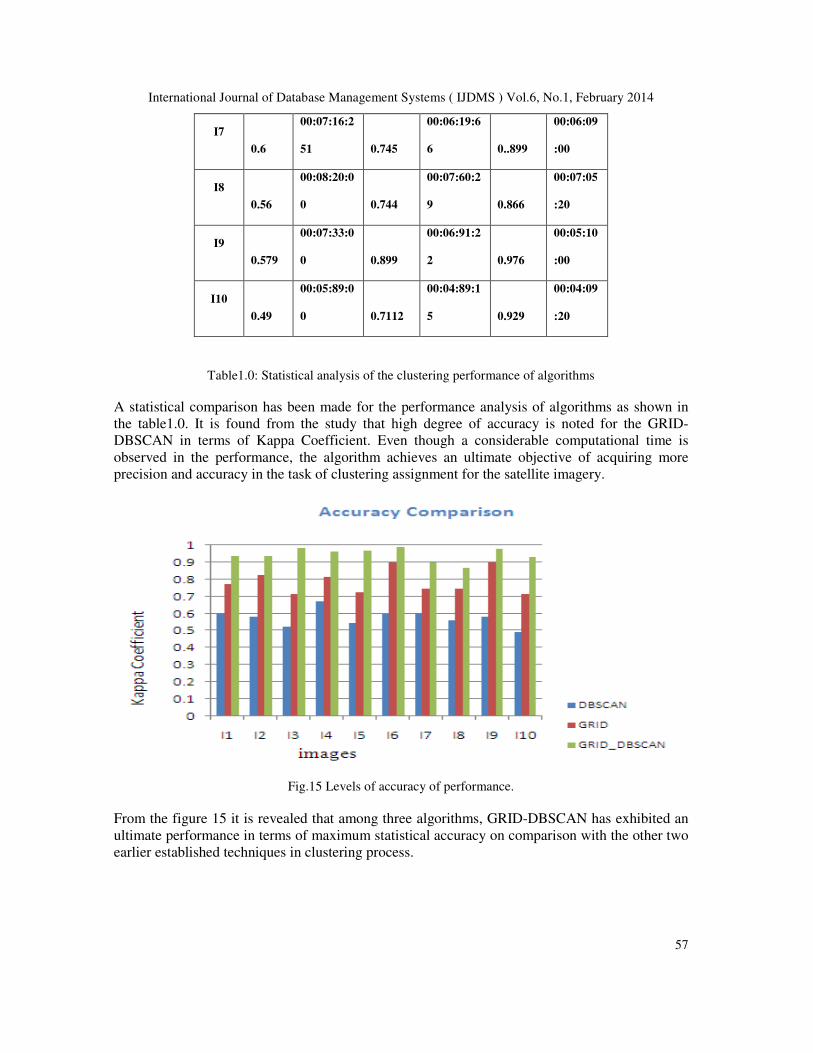
Accuracy Comparison
IMA
GE
S DBSCAN GRID GRID-DBSCAN
Kap
pa
Co
effi
cien
t
Tim
e
Ka
pp
a
Co
eff
ic
ien
t
Tim
e
Ka
pp
a
Co
eff
ic
ien
t
Tim
e
I1
0.6
00:08:52:6
57 0.7695
00:08:05:6
64 0.933
00:07:53
:33
I2
0.58
00:09:36:7
32 0.8226
00:08:34:0
0 0.936
00:07:53
:36
I3
0.524
00:07:21:4
58 0.7107
00:06:33:6
1 0.983
00:05:31
:33
I4
0.673
00:07:25:8
27 0.8123
00:06:55:6
4 0.963
00:06:34
:90
I5
0.543
00:08:71:8
7 0.722
00:08:50:0
0 0.966
00:07:34
:77
I6
0.598
00:08:90:8
7 0.844
00:07:95:6
6 0.987
00:07:34
:90
International Journal of Database Management Systems ( IJDMS ) Vol.6, No.1, February 2014
57
I7
0.6
00:07:16:2
51 0.745
00:06:19:6
6 0..899
00:06:09
:00
I8
0.56
00:08:20:0
0 0.744
00:07:60:2
9 0.866
00:07:05
:20
I9
0.579
00:07:33:0
0 0.899
00:06:91:2
2 0.976
00:05:10
:00
I10
0.49
00:05:89:0
0 0.7112
00:04:89:1
5 0.929
00:04:09
:20
Table1.0: Statistical analysis of the clustering performance of algorithms
A statistical comparison has been made for the performance analysis of algorithms as shown in
the table1.0. It is found from the study that high degree of accuracy is noted for the GRID-
DBSCAN in terms of Kappa Coefficient. Even though a considerable computational time is
observed in the performance, the algorithm achieves an ultimate objective of acquiring more
precision and accuracy in the task of clustering assignment for the satellite imagery.
Fig.15 Levels of accuracy of performance.
From the figure 15 it is revealed that among three algorithms, GRID-DBSCAN has exhibited an
ultimate performance in terms of maximum statistical accuracy on comparison with the other two
earlier established techniques in clustering process.
International Journal of Database Management Systems ( IJDMS ) Vol.6, No.1, February 2014
58
6. CONCLUSIONS & FUTURE WORK
In this paper, the proposed algorithm called GRID-DBSCAN is found to be a potential technique
in detecting the geometrical changes of the spatial data and having better performance. The
simulations are performed on dual core machine with 1GB graphic card using MatLab10.0 The
simulation of proposed algorithm indicates the realignment of geometrical locations in terms of
the number of clusters. The proposed methodology in the present paper also reveals the
corresponding variation of color distribution in the spectral figures. The performance of the
proposed GRID-DBSCAN technique is found to be more accurate than the already established
algorithms of DBSCAN and GRID. The spatial disturbances over a time and location can easily
be detected with two coined parameters the number of clusters and the variation distribution of
colors with and without the natural disturbances in geometrical locations. The research findings
achieved in the paper establish a powerful detecting system of dynamic changes in geometrical
locations in satellite imagery.
In future scope, this clustering technique can be extended to hexagonal grids, Circular grids
which may be suitable for the respective target domain. Some of the potential areas where our
work can be complementing the heuristic approaches are GIS, Spatial, Agriculture and climate
analysis.
REFERENCES
[1] R. Agrawal, S. Ghosh, T. Imielinski, B. Iyer, and A. Swami, “An Interval Classifier for Database
Mining Applications,” Proc. 18th Conf. Very Large Databases, pp. 560–573, 1992.
[2] R. Agrawal, T. Imielinski, and A. Swami, “Mining Association Rules between Sets of Items in Large
Databases,” Proc. 1993 ACM Special Interest Group on Management of Data, pp. 207–216, 1993.
[3] Borgida and R. J. Brachman, “Loading Data into Description Reasoners,” Proc. 1993 ACM Special
Interest Group on Management of Data, pp. 217–226, 1993.
[4] D. Dobkin and D. Kirkpatrick, “A Linear Algorithm for Determining the Separation of Convex
Polyhedra,” J. Algorithms,vol. 6, no. 3, pp. 381–392, 1985.
[5] R. Agrawal, J. Gehrke, D. Gunopulos, and P. Raghavan,“Automatic Subspace Clustering of High
Dimensional Data for Data Mining Applications,” Proc. 1998 ACM-SIGMOD, pp. 94–105, 1998.
[6] Jiadong Ren, Lili Meng and Changzhen Hu, “CABGD: An Improved Clustering Algorithm Based
on Grid-Density”. Fourth International Conference on Innovative Computing, Information and
Control, Pages 381-384,2009.
[7] L. David, “Hyperspectral image data analysis as a high dimensional signal processing problem,”
IEEE Signal Process. Mag., vol. 19, no. 1,pp. 17–28, 2002. [8] T.Brinkhoff and H.-P. Kriegel, B.
Seeger, “Efficient Processing of Spatial Joins Using R-Trees,” Proc. 1993 ACM Special Interest
Group on Management of Data, pp. 237-246, 1993.
[8] J. Senthilnath, S. N. Omkar, V. Mani, N. Tejovanth, P. G. Diwakar, and S. B. Archana, “Multi-
spectral satellite image classification using glowworm swarm optimization,” in Proc. IEEE Int.
Geoscience and Remote Sensing Symp. (IGARSS), 2011, pp. 47–50.
[9] J. Senthilnath, Student Member, IEEE, S.N.Omkar, V.Mani, TejovanthN, P.G. Diwakar, and Archana
Shenoy B” Hierarchical Clustering Algorithm for Land Cover Mapping Using Satellite Images” ieee
journal of selected topics in applied earth observations and remote sensing, vol. 5, no. 3, june 2012.
[10] M. Ankerst, M. Breunig, H.-P. Kriegel, and J. Sander, “OPTICS: Ordering Points To Identify the
Clustering Structure,” Proc. 1999 ACM Special Interest Group on Management of Data, pp. 49–60,
1999.
[11] W.G. Aref and H. Samet, “Optimization Strategies for Spatial Query Processing,” Proc. 17th Conf.
Very Large Databases, pp. 81-90,1991.
[12] A. E. Zaart, D. Ziou, S. Wang, and Q. Jiang, “Segmentation of SAR images using mixture of gamma
distribution,” Pattern Recognit., vol.35, no. 3, pp. 713–724, 2002.
International Journal of Database Management Systems ( IJDMS ) Vol.6, No.1, February 2014
59
[13] P. Gamba and M. Aldrighi, “SAR data classification of urban areas by means of segmentation
techniques and ancillary optical data,”IEEE J. Sel. Top. Appl.Earth Observ. Remote Sens., vol. 5, no.
4, pp.1140–1148, 2012.
[14] W. Chumsamrong, P. Thitimajshima, and Y. Rangsanseri, “Synthetic aperture radar (SAR) image
segmentation using a new modified fuzzy c-means algorithm,” in Proc. IEEE Symp. Geosci. Remote
Sens., Honolulu,HI, 2000, pp. 624–626.
[15] D. H. Hoekman, M. A. M. Vissers, and T. N. Tran, “Unsupervised full-polarimetric SAR data
segmentation as a tool for classification ofAgricultural areas,” IEEE J. Sel.Top. Appl. EarthObserv.
Remote Sens.,vol. 4, no. 2, pp. 402–411, 2011.
[16] Y.Dong, B. C. Forster, and A. K.Milne, “Comparison of radar image segmentation by Gaussian and
Gamma-Markov random field models,”Int. J. Remote Sens., vol. 24, no. 4, pp. 711–722, 2003.
AUTHORS
Dr. Ananda Rao Akepogu received B.Tech degree in Computer Science & Engineering from University
of Hyderabad, Andhra Pradesh, India and M.Tech degree in A.I & Robotics from University of Hyderabad,
Andhra Pradesh, India. He received PhD degree from Indian Institute of Technology Madras, Chennai,
India. He is Professor of Computer Science & Engineering Department and currently working as Principal
of JNTUA College of Engineering, Anantapur, Jawaharlal Nehru Technological University, Andhra
Pradesh, India. Dr. Rao published more than 100 publications in various National and International
Journals/Conferences. He received Best Research Paper award for the paper titled “An Approach to Test
Case Design for Cost Effective Software Testing” in an International Conference on Software Engineering
held at Hong Kong, 18-20 March 2009. He also received Best Educationist Award for outstanding
achievements in the field of education by International Institute of Education & Management, New Delhi
on 21st Jan. 2012. He bagged Bharat Vidya Shiromani Award from Indian Solidarity Council and
Rashtriya Vidya Gaurav Gold Medal Award from International Institute of Education & Management,
New Delhi on 19th
March, 2012. His main research interest includes software engineering and data mining.
Ch.Mallikarjuna Rao received the B.Tech degree in computer science from the Dr.Baba sahib Ambedkar
Marathwada University, Aurangabad,Maharastra in 1998,and the M.Tech Degree in Computer Science and
Engineering from J.N.T.U Anantapur ,Andhrapradesh in 2007. He is currently pursuing his PhD degree
from JNTU Ananthapur University, Andhra Pradesh. His research interest includes Data bases and data
mining.