Embed Size (px)
Citation preview

International Journal of Engineering Research-Online
A Peer Reviewed International Journal Email:[email protected] http://www.ijoer.in ISSN: 2321-7758
Vol.4., Issue.5., 2016 (Sept.-Oct.)
47 PASUPULETI. MURAHARI KRISHNA, G.GANESH NAIDU
1. INTRODUCTION In every country, the need of electric power
consumption has continued to increase, the rate of
demand being greater in the developing countries.
The Transmission towers are necessary for the
purpose of supplying electricity to various regions of
the nation. This has led to the increase in the
building of power stations and consequent increase
in power transmission lines from the generating
stations to the different corners where it’s needed.
Transmission line should be stable and carefully
designed so that they do not fail during natural
disaster. It should also conform to the national and
international standard. In the planning and design of
a transmission line, a number of requirements have
to be met from both structural and electrical point
of view. From the electrical point of view, the most
important requirement is insulation and safe
clearances of the power carrying conductors from
the ground. The cross-section of conductors, the
spacing between conductors, and the location of
ground wires with respect to the conductors will
decide the design of towers and foundations.
RESEARCH ARTICLE ISSN: 2321-7758
DYNAMIC ANALYSIS OF ELECTRICAL TRANSMISSION TOWER USING
FINITE ELEMENT TECHNIQUE
PASUPULETI. MURAHARI KRISHNA1, G.GANESH NAIDU2 1M.Tech student, IV semester, PACE Institute of technology and sciences, Ongole
2Assistant Professor and Head , Department of Civil Engineering, PACE Institute of technology and sciences, Ongole.
ABSTRACT
The electrical transmission towers carry heavy electrical transmission conductors
at a sufficient and safe height from ground. In addition to their self-weight they
have to withstand all forces of nature like strong wind, earthquake and snow load.
Therefore transmission line towers should be designed considering both structural
and electrical requirements for a safe and economical design. . A model of the
transmission tower used effective element types on various components of
transmission tower for static and dynamic analysis. Further determine the static
response and corresponding stress resultants of transmission tower structure due
to wind load at one static instant time on vertical and transversely position of
transmission tower using ANSYS. Also studied free vibrational or modal analysis
characteristics of the transmission tower by determine the frequencies and mode
shapes of transmission tower using ANSYS and validating the finite element based
results with closed form solution. At last elaborate study on the transient dynamic
analysis of transmission tower using ANSYS with emphasis on the evaluation of
dynamic response of transmission tower due to time varying wind load with
various wind velocity like displacement and axial force.
Keywords: Transmission tower, FEM, ANSYS, static analysis, modal analysis and
dynamic analysis due time varying loads.
©KY PUBLICATIONS
International Journal of Engineering Research-Online
A Peer Reviewed International Journal Email:[email protected] http://www.ijoer.in ISSN: 2321-7758
Vol.4., Issue.5., 2016 (Sept.-Oct.)
48 PASUPULETI. MURAHARI KRISHNA, G.GANESH NAIDU
The major components of a transmission
line consist of the conductors, ground wires,
insulation, towers and foundations. Most of the time
transmission lines are designed for wind and ice in
the transverse direction. However, the Indian Sub-
continent is prone to moderate to severe
earthquakes seismic loads may be important
because the transmission line towers and the cables
may be subjected to higher force and stressed
during ground motion. However, the major concern
of the transmission line during high earthquakes
may be that the large displacements do not causes
the cables to touch each other or any surrounding
objects, causing power failure and accidents.
Therefore, earthquake forces may be important in
design in high earthquake zones of the country. In
this project Seismic behavior of transmission line is
determined from the dynamics analysis of the tower
and the cable subjected to earthquake ground
motion.
2. AIM AND OBJECTIVES • Modelling of Transmission of tower as per
codal provisions.
• To find out the static response of
transmission tower like deflections due to
self-weight of the transmission tower
using ANSYS.
• To determine static response and
corresponding stress resultants of
transmission tower structure due to wind
load using ANSYS like deflections,
directional deformation, and shear force
and bending moment.
• To study free vibrational or modal analysis
characteristics of the transmission tower
by determine the frequencies and mode
shapes of transmission tower using ANSYS.
• Dynamic analysis of a transmission tower
using ANSYS.
3. TYPES OF TRANSMISSION TOWERS There are two types of transmission towers are there, they are Suspension Tower. Tension Tower Towers based on Deviation angle.
3.1 Suspension Tower:The Suspension towers are
used primarily on tangents but often are designedto
withstand angles in the line up to two degrees or
higher in addition to the wind, ice, and broken-
conductor loads. If the transmission line traverses
relatively flat Featureless terrain, 90 percent of the
line may be composed of this type of tower.
3.2 Tension Tower:As they must resist a transverse
load from the components of the line tension
induced by this angle, in addition to the usual wind,
ice and broken conductor loads, they are necessarily
heavier than suspension towers.
3.3 Towers based on deviation angle:
1 Small Angle
Towers( 00 to 15
0)
with tension string
Deviation of 00 to 15
0.
2 Medium angle
towers ( 00 to 30
0 )
with tension string
Deviation of 00 to 30
0
3 Large angle towers
( 300 to 60
0 ) with
tension string
Deviation of 300 to 60
0
4 Dead-end towers
with tension string
To be used as dead-
end (terminal) tower or
Anchor tower
5 Large angle and
dead-end towers
with tension string
To be used for line
deviation from 300 to
600.
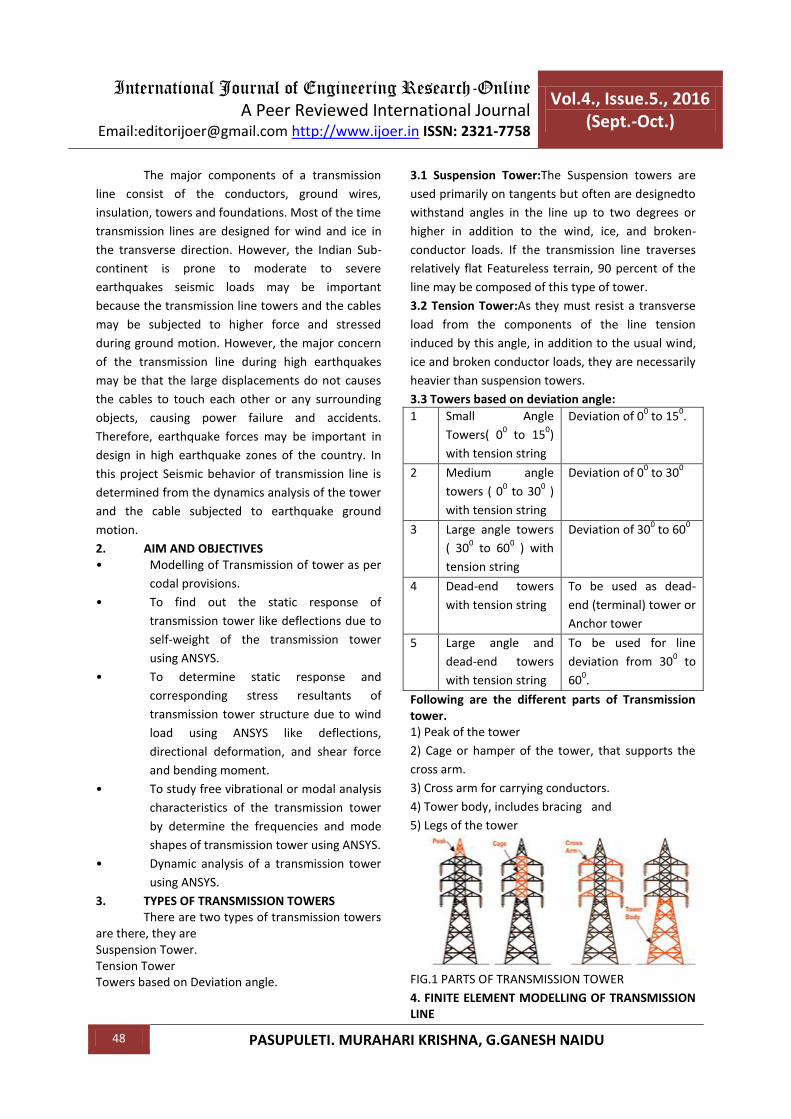
Following are the different parts of Transmission tower. 1) Peak of the tower
2) Cage or hamper of the tower, that supports the
cross arm.
3) Cross arm for carrying conductors.
4) Tower body, includes bracing and
5) Legs of the tower
FIG.1 PARTS OF TRANSMISSION TOWER
4. FINITE ELEMENT MODELLING OF TRANSMISSION LINE
International Journal of Engineering Research-Online
A Peer Reviewed International Journal Email:[email protected] http://www.ijoer.in ISSN: 2321-7758
Vol.4., Issue.5., 2016 (Sept.-Oct.)
49 PASUPULETI. MURAHARI KRISHNA, G.GANESH NAIDU
The basis of the finite element method is
the representation of a body or a structure by an
assemblage of subdivisions called finite elements.
The Finite Element Method translates partial
differential equation problems into a set of linear
algebraic equations. The finite element method is a
numerical technique of solving differential equations
describing a physical phenomenon. It is a convenient
way to find displacements and stresses of structures
at definite physical coordinates called nodes. The
structure to be analysed is discredited into finite
elements connected to each other at their nodes.
Elements are defined and equations are formed to
express nodal forces in terms of the unknown nodal
displacements, based on known material
constitutive laws. Forces and initial displacements
are prescribed as initial conditions and boundary
conditions. A global matrix system is assembled by
summing up all individual element stiffness matrices
and the global vector of unknown nodal
displacement values is solved for using current
numerical techniques. Many software programs are
available in the market for the analysis of structures
by this method. In the present study, the computer
program ANSYS is used for the analyses performed
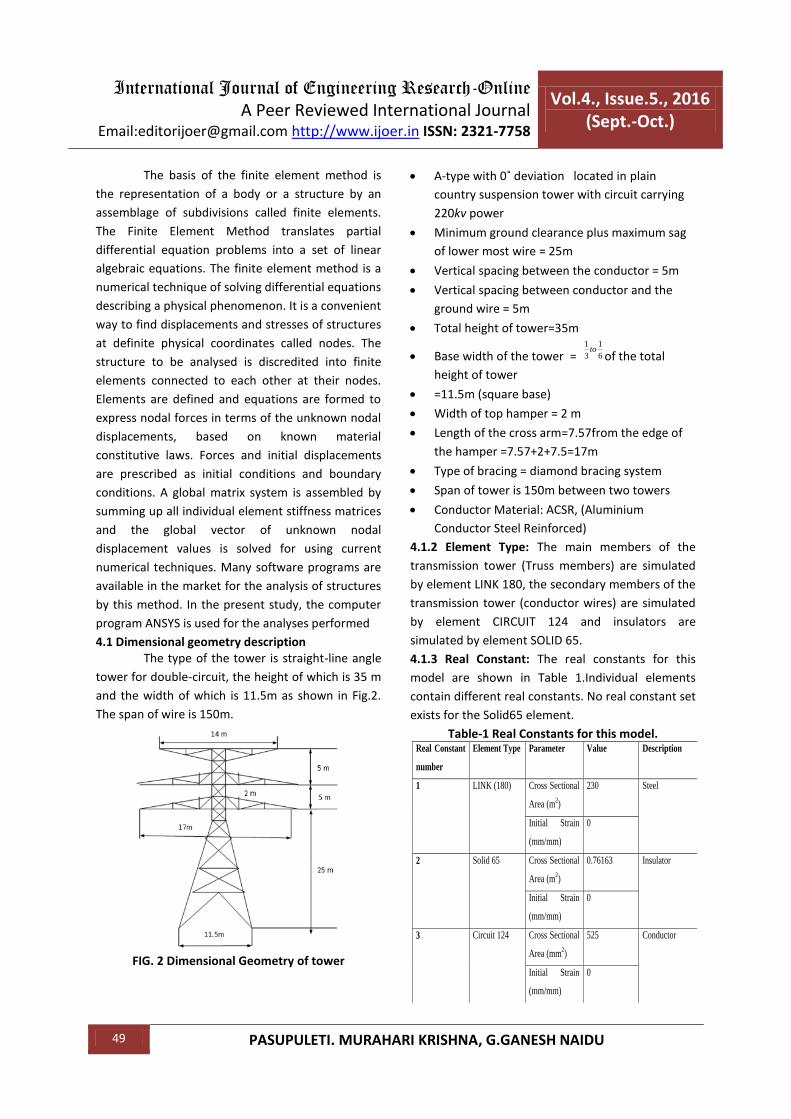
4.1 Dimensional geometry description The type of the tower is straight-line angle
tower for double-circuit, the height of which is 35 m
and the width of which is 11.5m as shown in Fig.2.
The span of wire is 150m.
FIG. 2 Dimensional Geometry of tower
A-type with 0˚ deviation located in plain
country suspension tower with circuit carrying
220kv power
Minimum ground clearance plus maximum sag
of lower most wire = 25m
Vertical spacing between the conductor = 5m
Vertical spacing between conductor and the
ground wire = 5m
Total height of tower=35m
Base width of the tower = 1 1
3 6to
of the total
height of tower
=11.5m (square base)
Width of top hamper = 2 m
Length of the cross arm=7.57from the edge of
the hamper =7.57+2+7.5=17m
Type of bracing = diamond bracing system
Span of tower is 150m between two towers
Conductor Material: ACSR, (Aluminium
Conductor Steel Reinforced)
4.1.2 Element Type: The main members of the
transmission tower (Truss members) are simulated
by element LINK 180, the secondary members of the
transmission tower (conductor wires) are simulated
by element CIRCUIT 124 and insulators are
simulated by element SOLID 65.
4.1.3 Real Constant: The real constants for this
model are shown in Table 1.Individual elements
contain different real constants. No real constant set
exists for the Solid65 element.
Table-1 Real Constants for this model.
Real Constant
number
Element Type Parameter Value Description
1 LINK (180) Cross Sectional
Area (m2)
230 Steel
Initial Strain
(mm/mm)
0
2 Solid 65 Cross Sectional
Area (m2)
0.76163 Insulator
Initial Strain
(mm/mm)
0
3 Circuit 124 Cross Sectional
Area (mm2)
525 Conductor
Initial Strain
(mm/mm)
0
International Journal of Engineering Research-Online
A Peer Reviewed International Journal Email:[email protected] http://www.ijoer.in ISSN: 2321-7758
Vol.4., Issue.5., 2016 (Sept.-Oct.)
50 PASUPULETI. MURAHARI KRISHNA, G.GANESH NAIDU
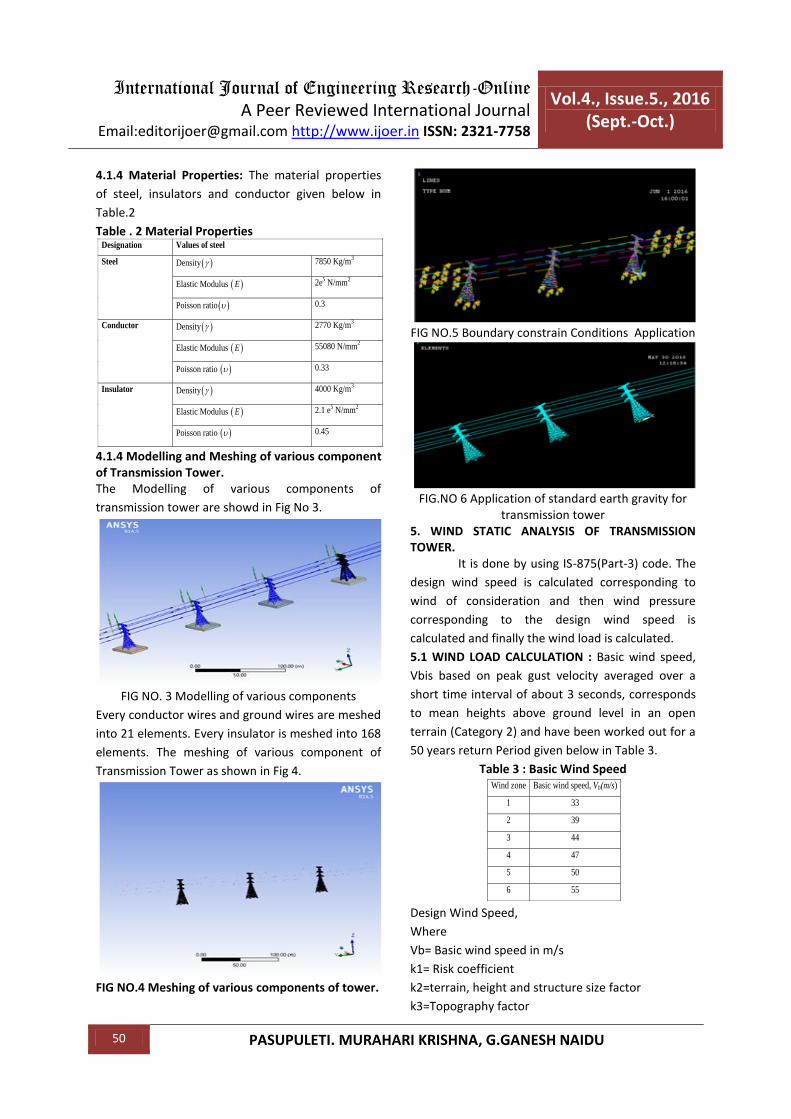
4.1.4 Material Properties: The material properties
of steel, insulators and conductor given below in
Table.2
Table . 2 Material Properties
4.1.4 Modelling and Meshing of various component of Transmission Tower. The Modelling of various components of
transmission tower are showd in Fig No 3.
FIG NO. 3 Modelling of various components
Every conductor wires and ground wires are meshed
into 21 elements. Every insulator is meshed into 168
elements. The meshing of various component of
Transmission Tower as shown in Fig 4.
FIG NO.4 Meshing of various components of tower.
FIG NO.5 Boundary constrain Conditions Application
FIG.NO 6 Application of standard earth gravity for
transmission tower 5. WIND STATIC ANALYSIS OF TRANSMISSION TOWER. It is done by using IS-875(Part-3) code. The
design wind speed is calculated corresponding to
wind of consideration and then wind pressure
corresponding to the design wind speed is
calculated and finally the wind load is calculated.
5.1 WIND LOAD CALCULATION : Basic wind speed,
Vbis based on peak gust velocity averaged over a
short time interval of about 3 seconds, corresponds
to mean heights above ground level in an open
terrain (Category 2) and have been worked out for a
50 years return Period given below in Table 3.
Table 3 : Basic Wind Speed
Design Wind Speed,
Where
Vb= Basic wind speed in m/s
k1= Risk coefficient
k2=terrain, height and structure size factor
k3=Topography factor
Designation Values of steel
Steel Density 7850 Kg/m3
Elastic Modulus E 2e5 N/mm
2
Poisson ratio 0.3
Conductor Density 2770 Kg/m3
Elastic Modulus E 55080 N/mm2
Poisson ratio 0.33
Insulator Density 4000 Kg/m3
Elastic Modulus E 2.1 e5 N/mm
2
Poisson ratio 0.45
Wind zone Basic wind speed, Vb(m/s)
1 33
2 39
3 44
4 47
5 50
6 55

International Journal of Engineering Research-Online
A Peer Reviewed International Journal Email:[email protected] http://www.ijoer.in ISSN: 2321-7758
Vol.4., Issue.5., 2016 (Sept.-Oct.)
51 PASUPULETI. MURAHARI KRISHNA, G.GANESH NAIDU
Table 4 gives the values of risk coefficients k1 for
different wind zones for the three reliability levels
TABLE .4 Risk Coefficient, k1
TABLE 5 Terrain roughness coefficient.
Terrain Categories:
Category 1: Exposed open terrain land scape with
few or no obstacles.
Category 2: Open terrain with scattered obstructions
having height generally between 1.5 m to 10 m.
Category 3: Terrain with number of closely spaced
obstructions.
Design Wind Pressure, Pd 20.6d dP V
Where Pd=design wind pressure in N/m2 at height z
Vd=design wind velocity in m/s at height z
Table 6 shows the design wind pressures ‘Pd’ for the
three reliability level and pertaining to six wind
zones and the three terrain categories are
Table 6: Design Pressures
Wind load on tower,Fwt
Where,
Pd= design wind pressure, in N/m2,
Cdt = drag coefficient is given in Table 5.5,
Ae= total net surface area of tower in m2.
Gt =gust response factor, depends on the height
above ground.
Table 7:Drag coefficient, Cdt for tower
Wind Load on Conductor and Ground wire
The following expression gives the wind load that
each conductor and ground wire carries:
Where,
Pd = Design wind pressure, in N/m2
Cdc = Drag coefficient, taken as 1.0 for conductor
and 1.2 for ground wire
L = Wind span, in meters
d = Diameter of cable, in meters and
Gc = Gust response factor, which take account the
turbulence of the wind at different height
L=150 m
Calculation of wind pressure, Pd
Basic wind speed (Vb)=55 m/s for zone 6
Meteorological reference wind speed,
bR
o
VV
k
5040 / sec
1.375RV m
Design wind speed, Vd
k1= Risk coefficient=1.3 for zone 6 with reliability
level 3
k2=Terrain roughness coefficient
k2=1.08 for terrain category1 m/s
40 1.3 1.08 1 56.16dV
Design wind pressure (Pd), 2 20.6*56.162 1890 /dP N m
Calculation of wind load on wires
1) Wind Load on lowest Conductor (Gc=1.9) at a
height of 25m
1890 1 0.016 150 1.9 8618 8.618N KN 2) Wind Load on mid Conductor (Gc =2) at a height
of 30m
1890 1 0.016 150 2 9072 9.072N KN
Reliability Level Coefficient k1 for wind zones
1 2 3 4 5 6
1 1.00 1.00 1.00 1.00 1.00 1.00
2 1.08 1.10 1.11 1.12 1.13 1.14
3 1.17 1.22 1.25 1.27 1.28 1.30
Terrain category 1 2 3
Coefficient,K2 1.08 1.0 0.85
Reliability level Terrain category wind pressure Pd for wind zones
1 2 3 4 5 6
1
1 403 563 717 818 925 1120
2 346 483 614 701 793 960
3 250 349 444 506 573 694
2
1 470 681 883 1030 1180 1460
2 403 584 757 879 1010 1250
3 291 422 547 635 732 901
3
1 552 838 1120 1320 1520 1890
2 473 718 960 1130 1300 1620
3 342 519 694 817 939 1170
Solidity ratio Drag coefficient (Cdt)
Up to 0.05 3.6
0.1 3.4
0.2 2.9
0.3 2.5
0.4 2.2
0.5 and above 2.0

International Journal of Engineering Research-Online
A Peer Reviewed International Journal Email:[email protected] http://www.ijoer.in ISSN: 2321-7758
Vol.4., Issue.5., 2016 (Sept.-Oct.)
52 PASUPULETI. MURAHARI KRISHNA, G.GANESH NAIDU
3) Wind Load on top Conductor (Gc =2.05) at a
height of 35m.
1890 1 0.016 150 2.05 9300 9.3N KN
4) Wind Load on insulator wire (Cdc=1.2, d=20,
Gc=2.07) at a height of 40m.
1890 1 0.016 150 2.07 9400 9.4N KN
Total Traverse Load= wt wc wiF F F
Fwi and Fwc are to be applied on all
conductors/ground wire points and
Fwt to be applied on tower at ground wire peak and
cross arm levels
The Fig.7 to Fig. 10 shows results obtained
due to application of transverse load. The maximum
and minimum deformations of transmission tower
are 4.7 cm and 0 cm. The maximum and minimum
directional deformations of transmission tower are
0.053 cm and 0 cm. The maximum and minimum
bending moment of transmission tower are 9251.2
N-m cm and 0 N-m. The maximum and minimum
shear forces of transmission tower are 9165.2 N and
0 N. The maximum and minimum variation shows
red and blue colour from Fig.7 to Fig. 10.
FIG. 7Total deformation for transversally applied load
FIG.8Directional deformation for transversally applied load
FIG.9Bending moment for transversally applied load
FIG. 10.Shear force for transversally applied load VERTICAL LOAD Dead load of the wire and insulator disk=7000 N
The results of transmission tower are deformation,
directional deformation, bending moment and shear
force which shows displacement, force and
deformation. The Fig.11 to Fig. 12 shows results
obtained due to application of vertical load. The
maximum and minimum bending moment of
transmission tower are 298.51 N-m cm and 0 N-m.
The maximum and minimum shear forces of
transmission tower are 465.45 N and 0 N. The
maximum and minimum variation shows red and
blue colour from Fig.11 to Fig.12.
International Journal of Engineering Research-Online
A Peer Reviewed International Journal Email:[email protected] http://www.ijoer.in ISSN: 2321-7758
Vol.4., Issue.5., 2016 (Sept.-Oct.)
53 PASUPULETI. MURAHARI KRISHNA, G.GANESH NAIDU
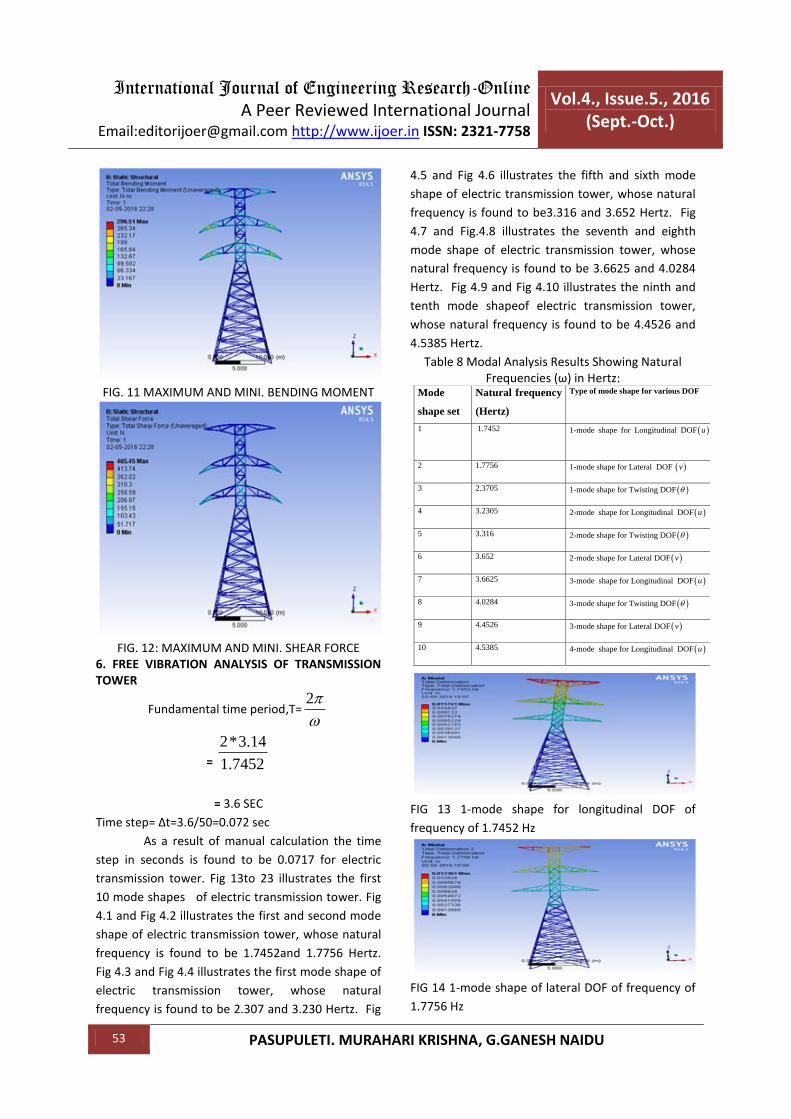
FIG. 11 MAXIMUM AND MINI. BENDING MOMENT
FIG. 12: MAXIMUM AND MINI. SHEAR FORCE
6. FREE VIBRATION ANALYSIS OF TRANSMISSION TOWER
Fundamental time period,T=2
=
2*3.14
1.7452
= 3.6 SEC
Time step= Δt=3.6/50=0.072 sec
As a result of manual calculation the time
step in seconds is found to be 0.0717 for electric
transmission tower. Fig 13to 23 illustrates the first
10 mode shapes of electric transmission tower. Fig
4.1 and Fig 4.2 illustrates the first and second mode
shape of electric transmission tower, whose natural
frequency is found to be 1.7452and 1.7756 Hertz.
Fig 4.3 and Fig 4.4 illustrates the first mode shape of
electric transmission tower, whose natural
frequency is found to be 2.307 and 3.230 Hertz. Fig
4.5 and Fig 4.6 illustrates the fifth and sixth mode
shape of electric transmission tower, whose natural
frequency is found to be3.316 and 3.652 Hertz. Fig
4.7 and Fig.4.8 illustrates the seventh and eighth
mode shape of electric transmission tower, whose
natural frequency is found to be 3.6625 and 4.0284
Hertz. Fig 4.9 and Fig 4.10 illustrates the ninth and
tenth mode shapeof electric transmission tower,
whose natural frequency is found to be 4.4526 and
4.5385 Hertz.
Table 8 Modal Analysis Results Showing Natural Frequencies (ω) in Hertz:
FIG 13 1-mode shape for longitudinal DOF of
frequency of 1.7452 Hz
FIG 14 1-mode shape of lateral DOF of frequency of
1.7756 Hz
Mode
shape set
Natural frequency
(Hertz)
Type of mode shape for various DOF
1 1.7452 1-mode shape for Longitudinal DOF u
2 1.7756 1-mode shape for Lateral DOF v
3 2.3705 1-mode shape for Twisting DOF
4 3.2305 2-mode shape for Longitudinal DOF u
5 3.316 2-mode shape for Twisting DOF
6 3.652 2-mode shape for Lateral DOF v
7 3.6625 3-mode shape for Longitudinal DOF u
8 4.0284 3-mode shape for Twisting DOF
9 4.4526 3-mode shape for Lateral DOF v
10 4.5385 4-mode shape for Longitudinal DOF u
International Journal of Engineering Research-Online
A Peer Reviewed International Journal Email:[email protected] http://www.ijoer.in ISSN: 2321-7758
Vol.4., Issue.5., 2016 (Sept.-Oct.)
54 PASUPULETI. MURAHARI KRISHNA, G.GANESH NAIDU
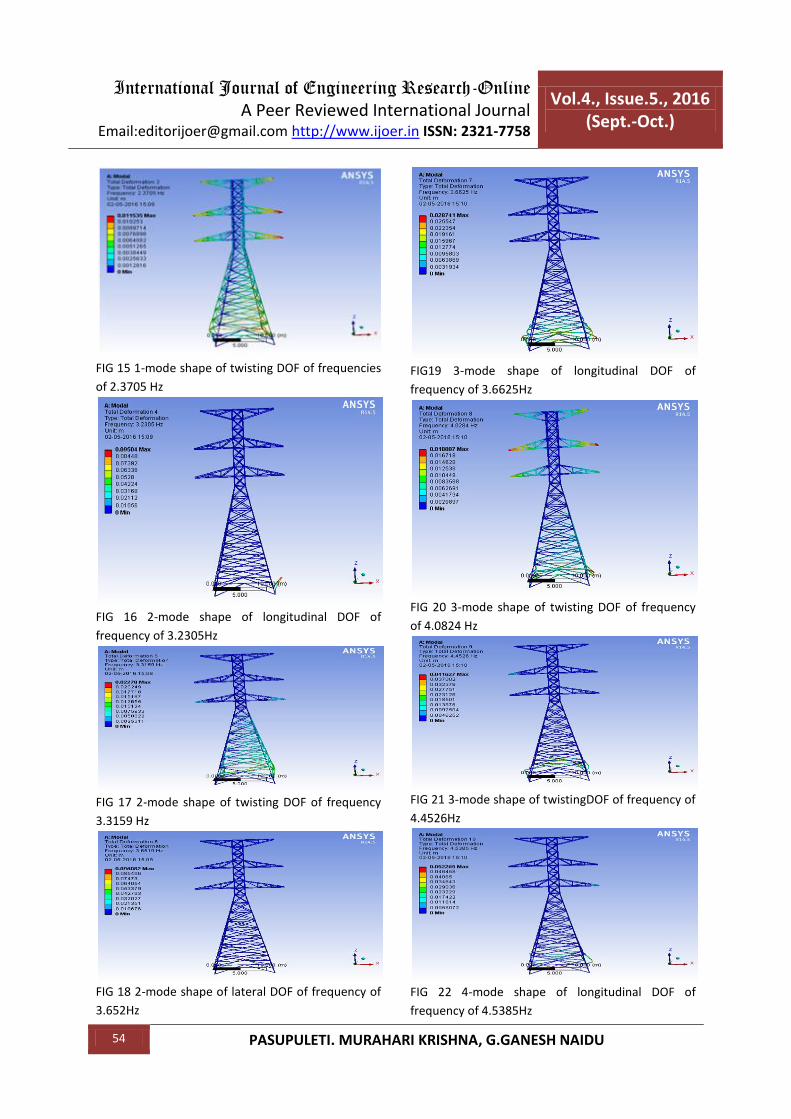
FIG 15 1-mode shape of twisting DOF of frequencies
of 2.3705 Hz
FIG 16 2-mode shape of longitudinal DOF of
frequency of 3.2305Hz
FIG 17 2-mode shape of twisting DOF of frequency
3.3159 Hz
FIG 18 2-mode shape of lateral DOF of frequency of
3.652Hz
FIG19 3-mode shape of longitudinal DOF of
frequency of 3.6625Hz
FIG 20 3-mode shape of twisting DOF of frequency
of 4.0824 Hz
FIG 21 3-mode shape of twistingDOF of frequency of
4.4526Hz
FIG 22 4-mode shape of longitudinal DOF of
frequency of 4.5385Hz

International Journal of Engineering Research-Online
A Peer Reviewed International Journal Email:[email protected] http://www.ijoer.in ISSN: 2321-7758
Vol.4., Issue.5., 2016 (Sept.-Oct.)
55 PASUPULETI. MURAHARI KRISHNA, G.GANESH NAIDU
7. FORCED VIBRATION ANALYSIS OF TRANSMISSION TOWER DUE TO TIME VARYING WIND LOAD Equations of Motion for a Structure TMD
System
The tuned mass damper and structure are assumed
to vibrate with the same frequency. With the
opposite movement exerted by tuned mass damper
to structure, the purpose of vibration control is
obtained. Assume that a structure can be modelled
as a single degree of freedom system, and a tuned
mass damper is installed, reducing vibration. The
equation of motion of the structure for the TMD
control can be expressed as
(c ) F(t)tmd tmd tmdMx Cx Kx x kx
( ) c 0tmd tmd tmd tmdm x x x k x
Where, M, C, K are the mass, damping and
stiffness matrix for the structure, respectively. x,
and are the displacement, velocity and acceleration
vectors for the structure, respectively .F (t) is the
wind-induced loading vector. , and are the
displacement, velocity and acceleration for the TMD,
respectively. and are the mass, damping and
stiffness for the TMD, respectively.
FIG.23 GRAPH B/W HEIGHT V/S WIND SPEED
FIG.24 HEIGHT V/S WIND PRESSURE
FIG 25: Time(s) vs Wind Velocity (m/s)
FIG 26: Time(s) vs Wind Force (kN)
FIG 27 :Time(s) vs Axial Force (kN)
FIG 28: Time (s) vs Displacement (cm)
8. CONCLUSION 8.1 Wind Static Analysis
I. The static response of the transmission
tower like deformation and rotation on all
direction and the corresponding stress
resultants like bending moment and shear

International Journal of Engineering Research-Online
A Peer Reviewed International Journal Email:[email protected] http://www.ijoer.in ISSN: 2321-7758
Vol.4., Issue.5., 2016 (Sept.-Oct.)
56 PASUPULETI. MURAHARI KRISHNA, G.GANESH NAIDU
force on corresponding direction due to
static transverse and vertical loads applied
on electric transmission tower systems are
within allowable or safe limit.
8.2 Free Vibration Analysis I. The studies on free vibrational characteristics of
electric transmission tower have been carried
out since the modal parameters like natural
frequencies and mode shapes are important for
understanding the dynamic behavior of the
structure. The electric transmission tower
systems with continuously distributed mass
have infinite number of natural frequencies,
however, only few lower of those frequencies
have practical significance. The finite element
model of electric transmission tower has been
considered for the free vibration analysis of
electric transmission tower. The subsequent
studies on complex forced vibration dynamic
analysis due to wind load problems have been
carried out based on the satisfactory
performance of the evaluated modal
parameters.
II. The free vibration analysis summary gives the
first fundamental frequency and time periods
from frequency summary Table 8. The first
fundamental frequency and time periods gives
the time step in seconds is found to be 0.0717
for the purpose of forced vibration dynamic
analysis dueto wind load problems of electric
transmission tower.
8.3 Dynamic Analysis due to Wind Load I. The transition tower line system is used in
simulation analysis. The proportional damping is
adopted in tower line system, since the system
is composed of both cable and tower. The
damping ratio of ground and conductors is 1%
and the damping ratio of the tower is assumed
to be 2%. The wind load time history obtained
in above work is exerted on specified position of
tower line system. Based on ANSYS nonlinear
time history analysis, the tower-line system
with optimal TMD is studied, respectively.
II. The response contains the axial force and
displacement. The comparison of axial force and
displacement time history curve with optimal
TMD.It can be seen from the Fig 27 and Fig 28
that optimal TMD can reduce the axial force and
displacement. The displacement response of
tower with optimal TMD curve is smaller than it
without control and the decreasing ratio is
about 7.6%. It can be seen that the axial force is
significantly decreased by optimal TMD with the
decreasing ratio is around 12.9%. A graph
demonstrates curve of maximum axial force of a
series of vertical tower elements along the
height of tower, the values in optimal TMD
curve at any height is all smaller than those in
curve without control. It also can be seen from
the graph that with the growth of height, the
optimal TMD exert a more effectively act to
transmission tower.
9. Scope for future study
To further carry out investigations on finite element modelling of Electrical transmission Tower effectively. So that it nullifies incorrect applicability of modal analysis and dynamic analysis .
To effectively bring about the optimisation of structural aspects of electrical transmission tower which could be coupled with its conceptualisation based on optimal tune mass damper
REFERENCES [1]. AlokDua, Mathias Clobes, Thomas Hobbel,
Vasant Matsagar This paper compares the dynamic response of test transmission line with the response due to static loads.
[2]. Srikanth L and Neelima Satyam D, “Dynamic analysis of transmission line towers
[3]. Li Tian, Qiqi Yu, Ruisheng Ma and Chengwu Wang, “The collapse analysis of a transmission tower under wind excitation”.
[4]. V. Lakshmi, M.V.R. Satyanarayana and V.Ravindra, “Study on performance of 220 kv M/C MA tower due to wind”.
[5]. Y. M. Desai, P. Yu, N. Popplewelland A. H. Shah, “Finite element modelling of transmission line galloping”.
[6]. C. Preeti and K. Jagan Mohan, “Analysis of transmission towers with different configurations