Embed Size (px)
Citation preview
International Journal of Geospatial and Environmental Research International Journal of Geospatial and Environmental Research
Volume 8 Number 2 Geospatial Technology in Sustainable Cities and Communities
Article 1
May 2021
Travel Time Patterns of Students with Special Needs to Special Travel Time Patterns of Students with Special Needs to Special
Education Integrated Program-based Schools in Johor Bahru, Education Integrated Program-based Schools in Johor Bahru,
Malaysia: An Initial Finding Malaysia: An Initial Finding
Nurul Hawani Idris Universiti Teknologi Malaysia, [email protected]
Nur Afiqah Ahmad Bakhtiar Universiti Teknologi Malaysia, [email protected]
Mohamad Hafis Izran Ishak Universiti Teknologi Malaysia, [email protected]
Follow this and additional works at: https://dc.uwm.edu/ijger
Part of the Earth Sciences Commons, Environmental Sciences Commons, and the Geography
Commons
Recommended Citation Recommended Citation Idris, Nurul Hawani; Ahmad Bakhtiar, Nur Afiqah; and Ishak, Mohamad Hafis Izran (2021) "Travel Time Patterns of Students with Special Needs to Special Education Integrated Program-based Schools in Johor Bahru, Malaysia: An Initial Finding," International Journal of Geospatial and Environmental Research: Vol. 8 : No. 2 , Article 1. Available at: https://dc.uwm.edu/ijger/vol8/iss2/1
This Research Article is brought to you for free and open access by UWM Digital Commons. It has been accepted for inclusion in International Journal of Geospatial and Environmental Research by an authorized administrator of UWM Digital Commons. For more information, please contact [email protected].

Travel Time Patterns of Students with Special Needs to Special Education Travel Time Patterns of Students with Special Needs to Special Education Integrated Program-based Schools in Johor Bahru, Malaysia: An Initial Finding Integrated Program-based Schools in Johor Bahru, Malaysia: An Initial Finding
Abstract Abstract Education for all has been a global priority to ensure that all students have equal access to high-quality education regardless of disability or minority status. In Malaysia, the special education integrated programme (SEIP) is designed to close the inequality gap by integrating special education into existing government and vernacular schools. Numerous studies examine the travel patterns of regular students to school, resulting in a dearth of research on the travel patterns of special needs students to formal school. Thus, this paper uses spatial analysis to demonstrate the travel patterns of students with special needs to SEIP schools. This paper demonstrated that the majority of SEIP schools in the Johor Bahru district can be reached within a 5 to 10 minute drive. Individual travel time analyses between origin (home) and destination (current versus ideal school) indicate that the majority of secondary school students attend their ideal neighbourhood schools, but not primary school students. The average travel time is 12 minutes, with 89 percent of them travelling by car. The travel time clustering analysis revealed that the majority of students who commute to school live within a radius of 2 to 10 km and within a time range of 10 to 20 minutes. However, a small group of these special students commutes to school for 20 to 25 minutes each day. The preliminary findings can be improved and may aid in the design of carpool and transit schedules, as the majority of these students heavily rely on their cars for transportation. The effects of the lengthy commute to school could be further investigated, as these children are vulnerable and any negative impact on their mental, emotional, or physical development must be addressed.
Keywords Keywords Travel Time Pattern, Special Integrated Education Program (PPKI), Learning disability student, Spatial Analysis
Acknowledgements Acknowledgements The authors would like to thank the Ministry of Education Malaysia (MOE) and the Universiti Teknologi Malaysia for the GUP Tier-2 (vote 16J60) awarded to the corresponding author to support this study.
This research article is available in International Journal of Geospatial and Environmental Research: https://dc.uwm.edu/ijger/vol8/iss2/1
1 INTRODUCTION
Education is critical for individual development and nation-building. It is a fundamental human right that fosters the development of a person's intellectual and personal qualities. Not only that, but it also aids in the job search process. Education is critical because it enables them to read and write, communicate, find work, and make judgment. The purpose of education is to equip people with knowledge, skills, and fundamental values which are necessary to succeed in a highly competitive and globalized world, despite the impact of rapid advancements in science, technology, and information (Ganeswaran 2013).
The growing number of disabled children and their varying abilities raise serious concerns about how to provide an appropriate public education in the least restrictive environment for children on the spectrum. Special needs students are children who have been identified as having significant disabilities endorsed by a medical practitioner, an audiologist, an optometrist, or psychologist who has significant disabilities (Yan-li and Sofian 2018). Special needs students fall into six categories: those who have a hearing disability, a visual disability, a speech disability, a physical disability, a learning disability, or a combination of disabilities or difficulties. A student diagnosed with Autism, Attention Deficit Hyperactivity Disorder (ADHD), Dyslexia, Dyscalculia, or Dysgraphia is considered to have a learning disability (Awang Mat 2001).
Special education means a curriculum designed to meet exceptional children's unique needs (Hallahan and Kauffman 2006). There are three types of special education programs in Malaysia, which are placed in a specialized public school and integrated mainstream school. There are 34 special education schools which also known as Sekolah Pendidikan Khas. Whereas 16,293 students are under Inclusive Education Program or Program Pendidikan Inklusif (PPI), and 69628 students are under Special Education Integration Program (SEIP) or Program Pendidikan Khas Integrasi (PPKI) in the mainstream school settings (MOE 2019).
A few decades ago, a pressing issue was the schools' inability to provide facilities and trained teachers to teach students with learning disabilities, particularly in mainstream schools (Utusan Online 2009). Parents of children with learning disabilities have been unable to enroll them in mainstream education following kindergarten due to a shortage of qualified teachers capable of handling and accepting these children (Lim 2015). For instance, students with autism spectrum disorder may struggle with sensory processing disorder, which causes them to struggle to adapt to a noisy environment or maintain eye contact. They may have difficulty communicating with or interacting with their friends and family. Additionally, they struggle to comprehend certain instructions and directions conveyed through the vocal and facial expressions of someone interacting with them. This type of social interaction may result in challenging behaviors and expose the individual to bullying and depression.
This issue presents difficulties for children with learning disabilities, and teachers often struggle to understand their needs. Nonetheless, skill development may aid children with learning disabilities in surviving in this difficult real world. Frequently used instructional strategies with non-disabled students may be ineffective with disabled students (Kuparinen 2017). As a result, the Malaysian Ministry of Education (MOE) has established a program for students with learning disabilities at the primary level in all
1
Idris et al.: Travel Time Patterns of Special Needs Students to School
Published by UWM Digital Commons, 2021

states (MOE 2019). The MOE's empowerment of the Zero Reject Policy to ensure that all children, including undocumented and special needs children, have access to general education (The Star 2019). This policy has encouraged more special needs children to enroll in public schools nearby which are attuned to their disabilities, whether in Integrated Special Education Programs and Inclusive Education Programs in mainstream schools or in Special Education Schools (Abdul Rashid 2018).
Effective pedagogy and environmental factors, such as a well-equipped classroom, have been identified as critical criteria for promoting access to special needs children (Nasir and Efendi 2016; Lee et al. 2008). Several studies have examined the difficulties inherent in teaching and learning, as well as the school facilities required to successfully implement their education access (Mohd Yasin 2016; Nasir and Efendi 2016).
In Malaysia, parents of mainstream students have limited options for where to send their children. There is a policy that requires residents to register a public school within their neighborhood to ensure accessibility; this may help reduce the number of school dropouts. In Malaysia, most of the government and semi-government schools offer a Special Education Integrated Program (SEIP) for students with special education needs (SEN). The Zero Reject Policy, which was endorsed in 2019, has resulted in a significant increase in the enrollment of special needs students (SNS) in government schools, from 83,598 in 2018 to 88,427 in 2019 (Othman and Matore 2019; The Sun Daily 2019), with the goal of ensuring no rejection in terms of school enrollment (Chin 2020). Thus, parents of students with disabilities may enroll their children in schools located outside their neighborhood. Thus, the purpose of this paper is to present preliminary findings about the travel patterns of students with special needs between their homes and schools in Johor Bahru district, Malaysia, using spatial analysis.
This study is critical because little attention has been paid in the literature to SNS travel patterns to school, despite the active encouragement of UNESCO through three significant United Nations conferences, including the Jomtien Conference on Education for All in 1999 and the Dakar Framework for Action in 2000, and the Malaysian government through the Special Education Regulations and the Special Education Act (Chin 2020). Numerous local studies focus on the implementation challenges associated with providing equal education to SNS for them to access formal education in Malaysia (Chin 2020; Nasir and Efendi 2016; Ganeswaran 2013). This is the first study to examine the travel time patterns of SNS to schools in Malaysia, specifically in SEIP-based schools. Most of the research on travel time patterns and assessment has been conducted on mainstream students, and thus is not specific to these SNS groups. A few studies have suggested that a longer daily commute may influence a student's performance and engagement. This includes tardiness to school, inability to participate in after-school activities (Blagg et al. 2018), sleep deprivation (Pradhan and Sinha 2017), and obesity (Blagg et al. 2018). Therefore, it is critical to understand their travel time before additional analysis can be conducted to determine the impact of travel on their academic and social performance, as well as mental and physical development. Additionally, many studies in transportation planning that attempt to demonstrate travel time between spaces lack spatial visual representation, which results in a vague local interpretation by readers, especially when describing a specific origin and
2
International Journal of Geospatial and Environmental Research, Vol. 8, No. 2 [2021], Art. 1
https://dc.uwm.edu/ijger/vol8/iss2/1
destination. As a result, a few spatial visualization tools based on the QGIS software were used to aid to understand the details.
1.1 Special Education Needs (SEN) In Malaysia
The first initiatives in Malaysia to establish a program for special needs children focused on visually impaired and deaf and hard of hearing students. The blind school was established in the 1920s, followed by the deaf school (Ganeswaran 2013). The Education Act 1996 and the Special Education Regulation 1997 have been endorsed by the government, marking a watershed moment in Malaysia's special education needs.
The Ministry of Education's Special Education Division is responsible for managing special education programs. The Special Education Integration Program (SEIP) is a public-school program in which children with a variety of learning disabilities are grouped together. Students who are fully functioning, referred to as educable, are permitted to enroll in semi or fully inclusive programs where they can learn alongside typical students. SEIP's primary objective is to ensure that all children have an equal opportunity to receive an education. In other words, the government is committed to advancing the international agenda of removing barriers between disabled children and individuals or communities. Additionally, this action may help prevent violence, abuse, or bullying in and around the school environment.
In 2019, Malaysia's Ministry of Education implemented a Zero Rejection Policy for students with disabilities. The Zero Reject Policy serves as a foundation for strengthening the country's existing framework for education for disabled children. It ensures that students with disabilities receive an equal education in general education settings through the Special Education Integration Program (SEIP) or Inclusive Education Program (Ahmad 2018). This policy complements Malaysia's existing special education policy and demonstrates Malaysia's commitment to providing an inclusive, high-quality education to all children regardless of their individual difficulties or diversity (Chin 2020). 1.2 Travel Time to School Travel time is one of performance metrics in transportation planning. Jia et al. (2020) define travel time as the time required for a person to move between two distinct spatial positions. In other studies, it is interpreted as an indication of delay in terms of the route's capacity to carry traffic volume in comparison to alternative routes (Raqib et al. 2005). Travel time has been used in traffic management systems to determine the level of congestion in individual traffic corridors (Ashara et al. 2020), as well as in highway traffic monitoring (Quiroga and Bullock 1998). This parameter is critical for forecasting traffic demand (Wang and Xu 2011) and predicting the arrival of public and private transport, as well as supply chain transportation (Kumar et al. 2017). Suwardo et al. (2010), for example, use an Autoregressive Integrated Moving Average (ARIMA) model to predict bus travel time from time series data, which is beneficial for providing accurate bus schedules. Table 1 summarizes the findings of several studies on the average travel time to school in several countries.
3
Idris et al.: Travel Time Patterns of Special Needs Students to School
Published by UWM Digital Commons, 2021

Table 1. The summary of average travel time to school in several countries.
Country Travel Time Year Description Source
Kuala Lumpur, Malaysia
Average travel time for all/school trips (car) (25/20 minutes) Average travel time for all/school trips (bus) (60 minutes) Average travel time for all/school trips (train) (45/40 minutes)
2005 Based on survey of average time to work and school (N=1200)
Nurdden et al. (2005)
Vietnam 29.79 minutes 2018-2021
Based on survey of average time to work and school (N=155)
Numbeo (2021)
Bandung, Indonesia
76.7% (1-20minutes) 23.3% (21-30 minutes) 39% walking
Based on survey of high school students (N=400)
Badriyah et al. (2021)
Indonesia 12.5 minutes (elementary) Junior high school (16.5 minutes) Senior high school (18.89 minutes)
Average (14.36 minutes) Max (60-90 minutes)
1993 Based on IFLS data that represent 83 percent of Indonesia’s population living in 13 of 26 provinces covering the islands of Java, Sumatra, Bali, West Nusa Tenggara, Kalimantan, and Sulawesi
Parhah (2018)
Singapore Car (15 minutes) Chartered van (30 minutes) Public bus (50 minutes) MRT (45 minutes)
2020 Based on students between aged 5 to 14 years old.
Department of Statistics Singapore (2020)
Japan 30 minutes (2011) 41 minutes (2016)
2011, 2016
Based on survey 5 years survey of average time to work and school (N=200,000)
Statista Research Department (2020)
United States
Elementary school (21.08 minutes) middle school (24.02 minutes) high school (26.76 minutes)
2017 Based on the 2017 National Household Travel Survey data (N = 58.6 million)
Lidbe et al. (2020)
4
International Journal of Geospatial and Environmental Research, Vol. 8, No. 2 [2021], Art. 1
https://dc.uwm.edu/ijger/vol8/iss2/1

United Kingdom
Elementary school (12 minutes secondary school (20 minutes)
Based on the national transport survey of the average time travel by car
Department of Transport (2014)
Because travel time is frequently associated with spatial movement from one
location to another, the capability of Geographic Information Systems (GIS) via the components of spatial visualization and analysis can contribute to a more complete understanding and analysis. Mustapha et al. (2016) present the spatial distribution of primary schools using GIS, whereas Richard and Ogba (2016) use spatial analysis to select suitable sites for new schools using weighted overlay.
Numerous studies, on the other hand, that demonstrate travel time in specific contexts employ descriptive and statistical models and present data in the form of tabular and visual graphs. For instance, see Badriyah et al. (2020), Holmgren and Ivehammar (2020), Lidbe et al. (2020), Parhah (2018) and Nurdden et al. (2007). Without spatial visualization, the tabular results may be difficult to interpret spatially and to provide additional understanding of the spatial and travel connections between real-world locations such as origin and destination. Nonetheless, a few studies, such as Yahya et al. (2019) and Kumar et al. (2017) have used Google Maps to present the prediction of bus arrival time and travel time to the closest facility, respectively. Ashara et al. (2020) and Quiroga and Bullock (1998) used GIS to store and manage databases, analyze, and visualize reports in tabular and thematic maps of highway traffic segments to monitor congestion levels and areas prone to congestion. Whereas GIS has been integrated with satellites for the purpose of tracking ships, referred to as the Automatic identification system (AIS), which is used to monitor vessel and speed movement (Jia et al. 2020).
Numerous studies devoted to the accessibility aspect, however, used spatial analysis, specifically network analysis, to demonstrate a target facility's accessibility. For instance, Qin et al. (2020) used spatial analysis to determine the spatial accessibility of a park in Beijing; Rekha et al.(2020) and Richard and Ogba (2016), respectively, analyze school accessibility in India and Nigeria. Accessibility is a term that is frequently used in transportation and land use planning and refers to easy access (Sikdar et al. 2002). When calculating accessibility, metrics such as distance travelled, travel time, labour and transportation costs are considered (Kaszczyszyn and Sypion-Dutkowska 2019; Boisjoly et al. 2017). However, travel time pattern does not directly describe accessibility. Accessibility is frequently used to refer to people's ability and opportunity to access services and activities (Kaszczyszyn and Sypion-Dutkowska 2019). The amount of time spent travelling is one of the performance indicators that affect accessibility (Todd 2020).
5
Idris et al.: Travel Time Patterns of Special Needs Students to School
Published by UWM Digital Commons, 2021
2 METHODOLOGY
2.1 Respondents Sampling The study's target population is a group of students with special needs (SEN) who have been diagnosed with a learning disability and are enrolled in a Special Education Integrated Program (SEIP) in a government or government-aided school in Johor Bahru. SEIP is offered in most government-funded schools to ensure that those with SEN who are educable have access to education. According to Chin ( 2020), educable means that a student can manage himself or herself without assistance where high functioning student that is able to cope with mainstream curriculum will be encouraged to attend either inclusive or semi-inclusive program. Whereas moderate functioning students will continue to attend SEIP, and low functioning student (uneducable) is encouraged to attend special education school and may be referred to a Department of Social Welfare-managed community-based rehabilitation center (CBR). Physically handicapped children with mental disabilities and multiple disabilities may enroll in specific government-run special education schools. Most of students enrolled in SEIP have a learning disability, such as Down Syndrome, Mild Autism, Attention Deficit Hyperactivity Disorder (ADHD), or dyslexia. The SEIP eligibility criteria are critical in assisting the Ministry of Education in providing a common infrastructure, curriculum, and qualified teachers to assist educable SEN in accessing formal education.
The respondents in this study are parents/guardians who have registered their educable special needs children with the government, including government aided SEIP schools in the Johor Bahru district. In Johor Bahru, the population of primary (elementary) and secondary students enrolled in SEIP is 611 and 608, respectively (MOE 2019). In Johor Bahru, 485 primary and 473 secondary students were identified as having a learning disability.
Online questionnaires were distributed via Google Form to guardians of children with learning disabilities who were members of an NGO's social media group, specifically the Facebook page of GIAT Society Johor Bahru. This non-profit organization is an active member of the community and serves as a support group for parents of children diagnosed with a learning disability, specifically Autism, ADHD, or dyslexia. This questionnaire was distributed to GIAT Society Johor Bahru from November 2018 to February 2019. Most respondents identified as having a learning disability, which includes autism spectrum disorder (ASD) and attention deficit and hyperactivity disorder (ADHD).
The Google form link was shared on this Facebook page, and volunteers completed the online form. The data for this preliminary study were gathered through volunteered sampling via Facebook. The term "volunteer sampling" is also used to refer to convenience sampling. It is a purposive and non-random sampling technique, with the primary concern being the target population's representativeness (Jupp 2006), as well as the possibility of selection bias due to self-selected respondents (Awang 2021). As a result, the sampling is not random, and the findings must be interpreted cautiously.
After approximately four months of distribution, 91 respondents returned questionnaires, but only 87 respondents’ data were used in the analysis. This study
6
International Journal of Geospatial and Environmental Research, Vol. 8, No. 2 [2021], Art. 1
https://dc.uwm.edu/ijger/vol8/iss2/1

surveyed 9% of the total population (N=958) of educable SEIP students in Malaysia's Johor Bahru district. According to Krejcie and Morgan (1970), a minimum sample size of 274 respondents is required for a 950 population. While the sample size was insufficient to represent the total population of students with learning disabilities in Johor Bahru, Malaysia, this study may provide a preliminary understanding of these students' travel patterns to formal education. The questionnaire was distributed in conjunction with the ethical consent form. Four questionnaires returned were discarded due to missing addresses in the responses. The flow chart in Figure 1 illustrates the methodology used in this study.
Figure 1. The flowchart of research methodology.
2.2 Study Area
The study area is the Johor Bahru district, which is in southern Peninsular Malaysia and has a population of 1,334,188. (mycensus 2021). Jelutong, Plentong, Pulai, Sungai Tiram, Tanjung Kupang, Tebrau, and Bandar Johor Bahru are its seven mukims. The city is 22 kilometers (14 miles) from Singapore, separated by the Tebrau Strait. Figure 2 depicts the location of Johor Bahru on a map of Malaysia.
7
Idris et al.: Travel Time Patterns of Special Needs Students to School
Published by UWM Digital Commons, 2021

Figure 2. Johor Bahru district in Peninsular Malaysia map.
The schools targeted for this study were public and government-aided schools
that provide Special Education Integration Programs (SEIP). According to statistics (MOE 2019), 41 schools in the Johor Bahru district offer this program. Twelve are secondary schools and six are primary vernacular schools. A total of 23 schools in Johor Bahru that offer the SEIP enrolled by the respondents. The district education office (PPD) in Johor Bahru and the Open Malaysia Portal Data were used to obtain school-related data (MOE 2019). The distribution of schools offering SEIP in the Johor Bahru district is depicted in Figure 3.
2.3 Data This study uses two types of data: spatial and aspatial—the base map for Johor Bahru is derived from the cloud-based OpenStreetMap. Google Maps was used to extract the coordinates of schools that offer the SEIP program. Table 2 summarizes the data used in this study.
The online questionnaire contains fifteen items. It is divided into two sections, each of which contains multiple choice, closed-ended, and one open-ended questions. It was designed in such a way that only direct, succinct, brief, and concise responses were required. The questionnaire was taken between 20 and 25 minutes to complete. The questionnaire was divided into two sections; Part A was titled "Child's Profile" and included variables such as age, gender, type of disability, school name, mode of transport, distance travelled, and travel time to school. Part B was titled "Parent's Profile" and asked for the parent's home address (which could be in the street name or a residential area) and to identify any challenges with the current school.
8
International Journal of Geospatial and Environmental Research, Vol. 8, No. 2 [2021], Art. 1
https://dc.uwm.edu/ijger/vol8/iss2/1

Figure 3. Distribution of SEIP schools in Johor Bahru district.
Table 2. Description of main data used in this study.
Data Sources Description
Respondents demographic profile Questionnaires
Enrolled school name Questionnaires
School coordinate Google Map WGS84 coordinate
Respondent's house street name/residential name
Questionnaires
Home coordinate (origin) Google Map WGS84 coordinate
Travel time (minutes) Questionnaires
Estimate distance to school (km) Questionnaires
Mode of transport Questionnaires
The list of schools offering SEIP in the Johor Bahru district was extracted in excel
format using the Open Data Portal Malaysia (MOE 2019). The respondents' addresses (either street or residential name) and enrolled schools were converted to latitude and longitude using Google Maps pinpoint locations. The procedure was carried out to convert the features to a real-world coordinate system (latitude and longitude). Using QGIS 3.10.9, the points were then superimposed on the OpenStreetMap base map. The attribute data for this study are the respondent's details, which include mode of transport, distance between home and school, and travel time to school as provided by respondents. It was imported as a *.csv file into QGIS to accompany the home (origin) layer.
9
Idris et al.: Travel Time Patterns of Special Needs Students to School
Published by UWM Digital Commons, 2021
2.4 Spatial Analysis Tools
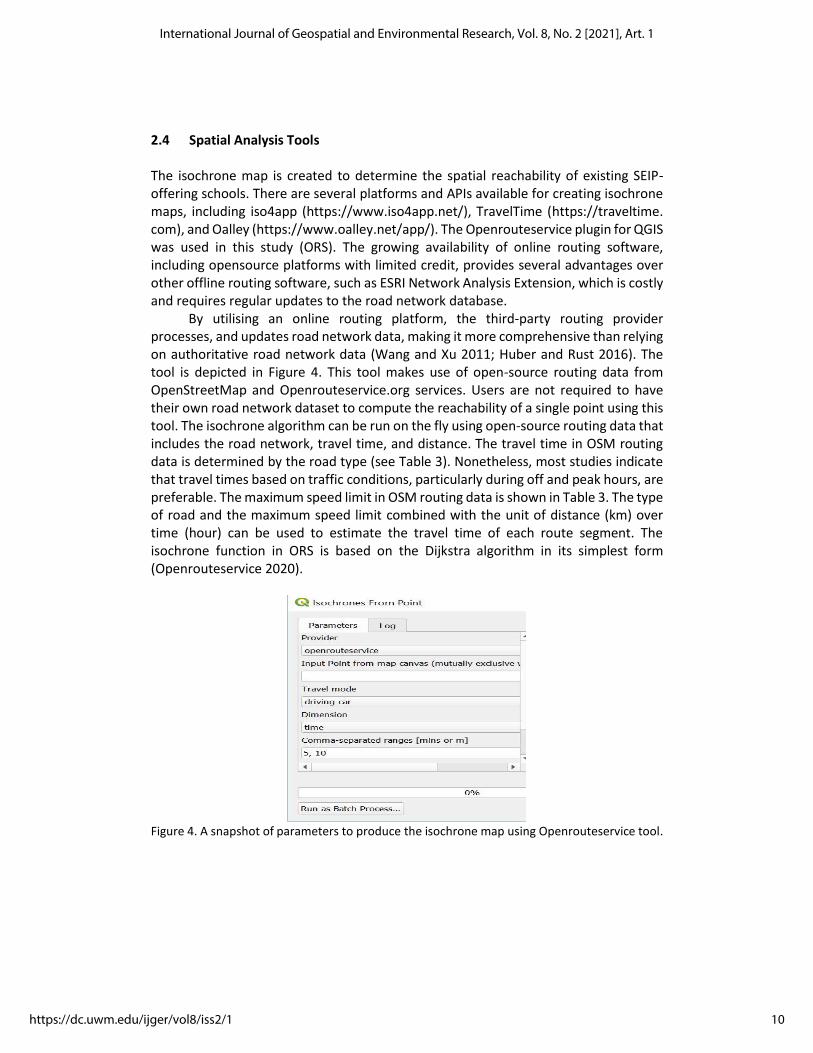
The isochrone map is created to determine the spatial reachability of existing SEIP-offering schools. There are several platforms and APIs available for creating isochrone maps, including iso4app (https://www.iso4app.net/), TravelTime (https://traveltime. com), and Oalley (https://www.oalley.net/app/). The Openrouteservice plugin for QGIS was used in this study (ORS). The growing availability of online routing software, including opensource platforms with limited credit, provides several advantages over other offline routing software, such as ESRI Network Analysis Extension, which is costly and requires regular updates to the road network database.
By utilising an online routing platform, the third-party routing provider processes, and updates road network data, making it more comprehensive than relying on authoritative road network data (Wang and Xu 2011; Huber and Rust 2016). The tool is depicted in Figure 4. This tool makes use of open-source routing data from OpenStreetMap and Openrouteservice.org services. Users are not required to have their own road network dataset to compute the reachability of a single point using this tool. The isochrone algorithm can be run on the fly using open-source routing data that includes the road network, travel time, and distance. The travel time in OSM routing data is determined by the road type (see Table 3). Nonetheless, most studies indicate that travel times based on traffic conditions, particularly during off and peak hours, are preferable. The maximum speed limit in OSM routing data is shown in Table 3. The type of road and the maximum speed limit combined with the unit of distance (km) over time (hour) can be used to estimate the travel time of each route segment. The isochrone function in ORS is based on the Dijkstra algorithm in its simplest form (Openrouteservice 2020).
Figure 4. A snapshot of parameters to produce the isochrone map using Openrouteservice tool.
10
International Journal of Geospatial and Environmental Research, Vol. 8, No. 2 [2021], Art. 1
https://dc.uwm.edu/ijger/vol8/iss2/1
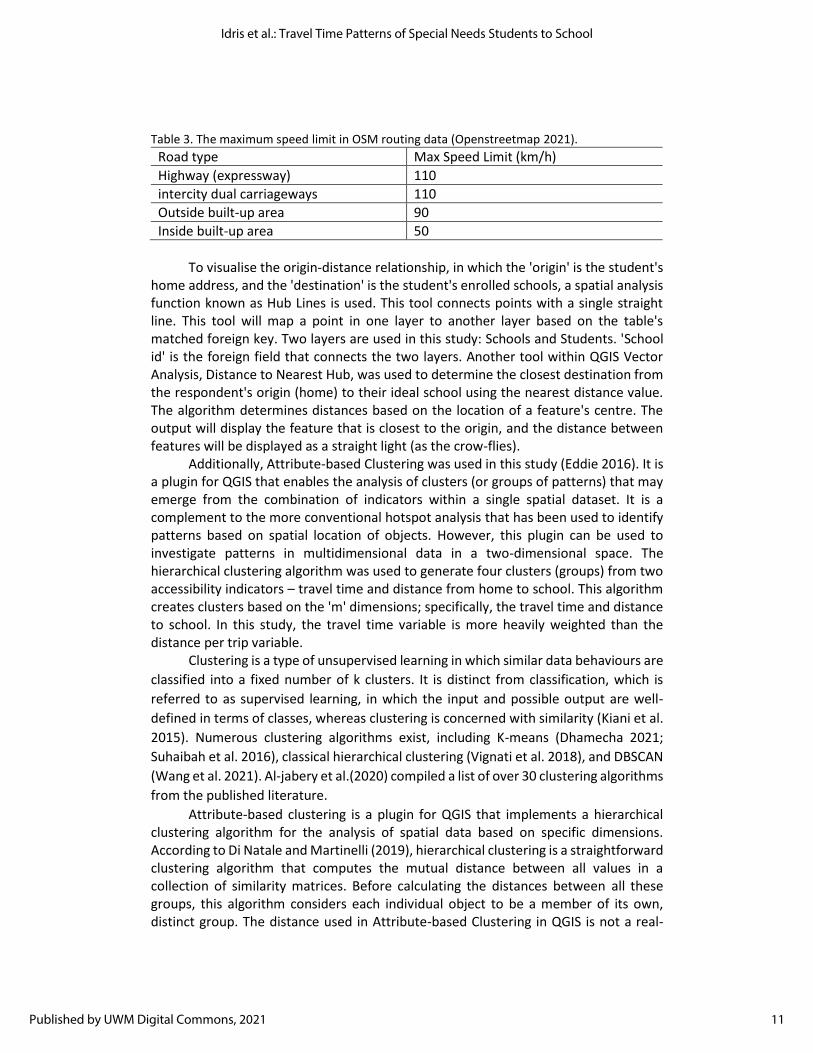
Table 3. The maximum speed limit in OSM routing data (Openstreetmap 2021).
Road type Max Speed Limit (km/h)
Highway (expressway) 110
intercity dual carriageways 110
Outside built-up area 90
Inside built-up area 50
To visualise the origin-distance relationship, in which the 'origin' is the student's
home address, and the 'destination' is the student's enrolled schools, a spatial analysis function known as Hub Lines is used. This tool connects points with a single straight line. This tool will map a point in one layer to another layer based on the table's matched foreign key. Two layers are used in this study: Schools and Students. 'School id' is the foreign field that connects the two layers. Another tool within QGIS Vector Analysis, Distance to Nearest Hub, was used to determine the closest destination from the respondent's origin (home) to their ideal school using the nearest distance value. The algorithm determines distances based on the location of a feature's centre. The output will display the feature that is closest to the origin, and the distance between features will be displayed as a straight light (as the crow-flies).
Additionally, Attribute-based Clustering was used in this study (Eddie 2016). It is a plugin for QGIS that enables the analysis of clusters (or groups of patterns) that may emerge from the combination of indicators within a single spatial dataset. It is a complement to the more conventional hotspot analysis that has been used to identify patterns based on spatial location of objects. However, this plugin can be used to investigate patterns in multidimensional data in a two-dimensional space. The hierarchical clustering algorithm was used to generate four clusters (groups) from two accessibility indicators – travel time and distance from home to school. This algorithm creates clusters based on the 'm' dimensions; specifically, the travel time and distance to school. In this study, the travel time variable is more heavily weighted than the distance per trip variable.
Clustering is a type of unsupervised learning in which similar data behaviours are
classified into a fixed number of k clusters. It is distinct from classification, which is
referred to as supervised learning, in which the input and possible output are well-
defined in terms of classes, whereas clustering is concerned with similarity (Kiani et al.
2015). Numerous clustering algorithms exist, including K-means (Dhamecha 2021;
Suhaibah et al. 2016), classical hierarchical clustering (Vignati et al. 2018), and DBSCAN
(Wang et al. 2021). Al-jabery et al.(2020) compiled a list of over 30 clustering algorithms
from the published literature.
Attribute-based clustering is a plugin for QGIS that implements a hierarchical clustering algorithm for the analysis of spatial data based on specific dimensions. According to Di Natale and Martinelli (2019), hierarchical clustering is a straightforward clustering algorithm that computes the mutual distance between all values in a collection of similarity matrices. Before calculating the distances between all these groups, this algorithm considers each individual object to be a member of its own, distinct group. The distance used in Attribute-based Clustering in QGIS is not a real-
11
Idris et al.: Travel Time Patterns of Special Needs Students to School
Published by UWM Digital Commons, 2021
world distance, as another tool for grouping by spatial location (e.g., K-means Clustering under the vector analysis tool) uses real-world coordinates to generate the cluster centroid. However, in QGIS's Weighted hierarchical clustering, the distance between groups is calculated using the following N-dimensional Euclidean distance space equation (Eddie 2016).
𝑑 = √𝑤1(𝑎1 − 𝑏1)2 +𝑤2(𝑎2 − 𝑏2)
2 +⋯+𝑤𝑛(𝑎𝑛 − 𝑏𝑛)2 (1)
where a and b are two points defined as a = { a1 … aN} and b = {b1 … bN}. The parameter 𝒅 defines the distance and w is a weightage. As a result, a matrix of distances is created. At first, there are numerous clusters containing data points. As data points are gradually merged into clusters, those that are physically close to one another are merged into a similar group. When data points are grouped, they become indistinguishable and are replaced by another. The algorithm then repeats the search for the shortest distance by executing equation (1) and comparing the mean of temporary clusters before merging the points that are the closest association. Eventually, all similar and closest objects within an arbitrary distance are merged into a single cluster. Finally, depending on the number of expected groups defined by the user, distinct and significant clusters may persist.
3 RESULTS AND DISCUSSION This section summarizes the findings of demographic and spatial analyses. The survey's findings are presented. Then, the spatial analysis's results are demonstrated. 3.1 Demographic Profile Analysis The demographic profiles of 91 returned questionnaires were analyzed in this study. However, only 87 responses were suitable for spatial analysis, as the remaining responses lacked an address data. The 87 respondents represented the 23 SEIP schools in the district of Johor Bahru. According to the survey, 31% of respondents' child (referred to as 'student') is between the ages of 10 and 12, while another 31% is between the ages of 13 and 15. 25% of students are between the ages of 7 and 9, and 12% are between the ages of 15 and 17. In Malaysia, the primary and secondary school age groups are 7 to 12 years old and 13 to 17 years old, respectively. Students with special needs, on the other hand, are given additional years in primary school to develop their readiness, and thus do not follow the normal student's age. There were 68% of the students sampled in this study were male, compared to 31% of female students.
Most students in this study are solicited from educable qualified students who attended SEIP schools. They have been classified as a form of learning disability (89%), but there is a small group of students that have other disabilities such as speech impairment and multiple impairments in the sample. From the questionnaires, 80 of students (89%) is going to school by car, and the rest is using other modes of transportation including motorcycle, bus, and walking.
12
International Journal of Geospatial and Environmental Research, Vol. 8, No. 2 [2021], Art. 1
https://dc.uwm.edu/ijger/vol8/iss2/1
Item 14 (i.e., what are the factors that influence your school choice) was created to help parents identify the criteria they used to choose their current school for their special child. The questionnaires include a list of check boxes to assist respondents in providing an answer. According to the responses, 25 respondents (28%) believe that school lessons are appropriate and appropriate for their children. Twenty-two respondents (22%) said they chose the school because it is close to home; 17.5% said they chose it because of the well-trained teachers and the fact that their children's progress is improving, which is consistent with the 17.5% of results. There are 13% who agree that school facilities are the reason.
Item 15 of a questionnaire (i.e., I have difficulty finding a school or program that is a good fit for my child) was constructed to imply that there is a difficulty in selecting the best school (as indicated by a yes/no response). About 51.6% of respondents agreed that they have difficulty finding the best school that offers SEIP for their child.
3.2 The Travel Time Reachability Map of Special Education Integrated Program
(SEIP)
According to official statistics (MOE 2019), 41 schools in the Johor Bahru district offer SEIP (see Figure 3); 12 of them are secondary schools. The map demonstrates that the government has made an outstanding effort to allocate sufficient SEIP schools for students with special needs to attend either public or semi-public schools. Except for the new development area of Medini City, the distribution of existing schools has completely covered the area in Johor Bahru district. The reachability of selected schools is illustrated in Figure 5 using an isochrone travel time map created with Openrouteservice. The maps illustrate the travel time between selected points (i.e., SEIP schools) in a series of buffering regions between 5 and 30 minutes. According to the map, the majority of SEIP schools are within 5 to 10 minutes (by car) of students who live in the surrounding neighborhood.
Figure 5a illustrates respondents' accessibility to SMK Taman Universiti 2 (secondary school) from their homes, which is approximately 5 to 10 minutes. However, as illustrated in Figure 5b, other schools such as SMK Gelang Patah, which is in a sub-urban area, are within a 5- to 15-minute walk of SEIP, which is classified as a neighborhood school. While Figure 5c indicates that the travel time to SK Desa Skudai (primary school) is between 5 and 10 minutes, one student travelled 15 minutes due to being enrolled in a non-neighborhood school.
13
Idris et al.: Travel Time Patterns of Special Needs Students to School
Published by UWM Digital Commons, 2021

Figure 5. (a) Isochrone map of SMK Taman Universiti 2 (secondary school), (b) Isochrone map
of SMK Gelang Patah (secondary school), (c) Isochrone map of SK Desa Skudai (primary school)
that offer Special Education Integrated Programs in Johor Bahru district.
14
International Journal of Geospatial and Environmental Research, Vol. 8, No. 2 [2021], Art. 1
https://dc.uwm.edu/ijger/vol8/iss2/1

The QGIS plugin tool used to create the isochrone map is called web ORS, and it
is supplied by Openrouteservice, a third-party provider of Openstreetmap data based on the types of roads supplied by the crowd; thus, the finding should be interpreted cautiously. Nonetheless, Husen et al. (2018) concluded that the quality of Malaysia's road network via the OpenStreetMap platform is sufficient in comparison to suburban and rural areas.
3.3 Origin-Destination Home to School Distribution
Origin-Destination is used to track students' movement between their homes and their enrolled schools. Figure 6 depicts the route taken by each student from his or her home to the registered school.
Figure 6. Origin-Destination map to present individual home address to enrolled schools.
A subset analysis was performed to compare the number of primary school
students enrolled in nearby schools to those enrolled in non-neighborhood schools. The origin-destination of home to primary schools (black dotted line) is compared to the nearby ideal schools (red dotted line) using Euclidean distance. About 75.8 percent of students in the 33 primary schools were enrolled in non-neighborhood schools, according to the analysis. Whereas, in SEIP secondary schools, 81 percent of students attended schools located within their neighborhoods, according to the 32 respondents who participated in the survey. The number of SEIP schools for secondary students in Johor Bahru (N=12) and in the sample (n=9) are less compared to existing primary schools (including vernacular schools) (N=29) and in the sample (n=14).Perhaps the fact that secondary schools offer fewer options than primary schools explain this finding.
15
Idris et al.: Travel Time Patterns of Special Needs Students to School
Published by UWM Digital Commons, 2021

Figure 7. The comparison of respondent's primary school preferences (enrolled school) versus ideal neighborhood school.
3.5 Travel Time Pattern to Access SEIP Schools
Previous section presented individual visual distances in straight lines as the crow flies using routing Openstreetmap data provided by the ORS provider. Additional analysis is conducted to determine the reachability of schools based on travel time. The average travel time for primary and secondary students is 12 minutes, with 89 percent of them travelling by car.
The travel time and distance calculated in this analysis were based on respondents' responses regarding the time and distance required to commute to school from their homes. Numerous studies of travel time patterns use questionnaires to collect data on the distance and time travelled (see Table 1). This method is the most convenient because respondents have completed the trips numerous times and can thus estimate the distance and travel time based on their daily experience. While these attributes can be gathered using GIS tools such as the QGIS ORS plugin and Google Map Directions from respondents' home and school addresses, the travel time values are somewhat different. For instance, as illustrated in Figure 8, the upper map depicts the travel time calculated using ORS routing data (11 minutes) and the bottom map depicts a snapshot from the Google Map Direction menu (17 minutes) in comparison to the respondent's data (travel time is 25 minutes). The differences in travel time values obtained from online routing tools can be investigated further, though we believe the data provided by respondents accurately represents their daily commute experience in this study.
16
International Journal of Geospatial and Environmental Research, Vol. 8, No. 2 [2021], Art. 1
https://dc.uwm.edu/ijger/vol8/iss2/1

Figure 8. The comparison of travel time.
Further analysis is conducted to visualize the travel time clusters that consider
commuting time and distance travelled to and from school by the student. Two variables are used to identify potential clusters. In this analysis, the travel time variable is given greater weight than the distance variable. Travel time is valued more than physical distance (Parthasarathi et al. 2013). The clustering map depicted in Figure 9 depicts the individual travel time to SEIP schools. According to Figure 9, more than two-thirds of respondents (72%) commute to school within a 10- to 20-minute range of 2 to 10 kilometers. Another group (22 percent) arrived at nearby schools within five minutes (2-5 kilometers). There is a small group of students who must travel to school within 20 to 25 minutes for between 10 and 15 kilometers (5%) (orange colored) and 2 to 10 kilometers for approximately 25 to 30 minutes (5%) (red colored). 3.6 Discussions As illustrated in Figure 3, the SEIP schools are distributed randomly throughout the Johor Bahru district, except for Medini City, a new development area. In general, schools are within a 5-to-10-minute drive, and enrollment is sufficient for high-functioning children with learning disabilities such as autism, ADHD, or dyslexia to attend public schools. The government's approach of integrating special education into existing government schools has increased these children's chances of attaining educational equality. As is the case in other countries, such as the United Kingdom, enrollment in government schools is determined by the student's residence. As illustrated in Figure 5, this policy contributes to the excellent school reachability.
17
Idris et al.: Travel Time Patterns of Special Needs Students to School
Published by UWM Digital Commons, 2021

Figure 9. Clusters of individual travel time to SEIP schools.
The comparison of the origin-destination of students from their homes to their
current enrolled school and their ideal neighborhood schools revealed that 81 percent of secondary school students attended SEIP schools located in their neighborhoods. However, 75.8 percent of primary school students were enrolled in schools located outside their neighborhoods. The average travel time to school from several countries is shown in Table 1. From the perspective of the journey to school, the findings indicate that the average travel time for primary and secondary students to SEIP schools is 12 minutes, with 89 percent of them travelling by car. This conclusion holds true for other Asian countries such as Indonesia (see Badriyah et al. 2021; Parhah 2018) and Singapore (Department of Statistics Singapore 2020) and in developed nations such as the United Kingdom (National Transport Survey 2014). The average travel time is shorter than in other countries such as Vietnam (Numbeo 2020), Japan (Statista Research Department 2020), and the United States (Lidbe et al. (2020), as well as in the capital city of Kuala Lumpur (Nurdden et al. 2005). However, the findings should be interpreted cautiously due to the sampling method and sample size used to determine the preliminary travel time to SEIP schools in Johor Bahru, Malaysia's second fastest growing city after Kuala Lumpur.
Although more than 70% of primary school students attend non-neighborhood SEIP schools, travel time is still comparable to that of other countries' typical students. Is this average travel time acceptable for these special children? Additionally, the findings indicate that more than two-thirds of students (72%) commute to SEIP schools located within a 10- to 20-minute drive of their homes. A small percentage of students (10%) continue to commute daily for a lengthy journey (20 to 30 minutes) of between 2 and 15 kilometers, as illustrated in the clustering map in Figure 9.
18
International Journal of Geospatial and Environmental Research, Vol. 8, No. 2 [2021], Art. 1
https://dc.uwm.edu/ijger/vol8/iss2/1
According to this study, parents register their children in current schools because they believe the lessons are appropriate and suitable for their children (28%); the school is in their neighborhood (22%); the teachers are well-trained (17.5%) and care about their child's development (17.5%); and the school has good facilities (13%). However, schooling in a non-neighborhood area may amplify the negative impact of extended travel time. As Richard (2014) argues, a lengthy commute by car or bus may decrease children's physical activity and contribute to weight gain. Additionally, it contributes to sleep deprivation by requiring students to spend more time travelling to and from school (Prandhan and Sinha 2017), which results in poor academic performance (Tigre et al. 2017). As a result, the effect of the lengthy commute to school on students' emotional, mental, and physical development warrants additional research.
4 CONCLUSION The purpose of this study is to examine the travel patterns of students with special needs who attend SEIP schools in Malaysia. As a result, this paper presents preliminary findings regarding the travel patterns of special needs students to SEIP schools. This paper established the SEIP school's reachability in the Johor Bahru district, which is typically within 5 to 10 minutes for students enrolled in neighborhood schools. Individual travel time analysis based on origin (home) and destination (current versus ideal school) reveals that the majority (more than two-thirds) of secondary school students attend their ideal neighborhood schools, but not primary school students. The travel time clustering analysis revealed that the largest cluster consists of students who commute to school in a range of 2 to 10 kilometers within 10 to 20 minutes. However, a smaller cluster of students is identified as travelling nearly half an hour each day to school.
The study's limitations include the fact that the sample does not include all schools offering SEIP in the Johor Bahru district. The sample was drawn from volunteers and thus did not adequately represent the population of learning-disabled students enrolled in SEIP schools. The travel time and distance estimates used in this study were based on respondents' perceptions and estimates during the survey. The values may be slightly inaccurate due to human bias in interpreting the precise measurement. Additional research could include a more representative sample of SEIP-enrolled students with learning disabilities. The effect of the longer travel time and distance on the psychology, academic, and physical performance of these special children can be investigated further.
Without a doubt, access to high-quality education is critical for developing countries because it contributes significantly to poverty reduction, economic growth, and individual income growth. This preliminary study may serve as a foundation for further investigation, assisting responsible authorities, particularly the Ministry of Education, in comprehending and implementing strategies that would improve students' transportation and educational services delivered to SEIP schools.
19
Idris et al.: Travel Time Patterns of Special Needs Students to School
Published by UWM Digital Commons, 2021

REFERENCES Abdul Rashid, H.R. (2018) Zero Reject Policy to be implemented next year: Maszlee.
New Straits Times. https://www.nst.com.my/news/nation/2018/10/426683/zero-reject-policy-be-implemented-next-year-maszlee
Ahmad, A. (2018) KPM laksana 'Zero Reject Policy' untuk murid berkeperluan khas bermula 2019. Astro Awani. http://www.astroawani.com/berita-malaysia/kpm-laksana-zero-reject-policy-untuk-murid-berkeperluan-khas-bermula-2019-193974
Al-jabery, K.K., Obafemi-Ajayi, T., Olbricht, G.R. and Wunsch D.C. (2020) 3-Clustering algorithms. In K. K. Al-jabery (Eds.) Computational Learning Approaches to Data Analytics in Biomedical Applications, 29-100 Academic Press. doi:10.1016/B978-0-12-814482-4.00003-6
Ashara, A.H., Saleh, S., Hassan, U. and Kaura, M.J. (2020) Traffic Management System in Abuja City Center, using Geographic Information Systems (GIS) and Global Positioning System (GPS). A case study of FCT, Nigeria. Journal of Physics: Conference Series, 1529(5). doi:10.1088/1742-6596/1529/5/052068
Awang Mat, H.M.N. (2001) Program Pendidikan Khas Kementerian Pendidikan Malaysia. Proceedings of Conference on Special Education Integration Program for Secondary School Principals. 1–3 October. Shah Alam, Malaysia
Awang, Z (2012) Research Methodology and Data Analysis. 2 Edition. Selangor: Penerbit Press Universiti Teknologi Mara
Badriyah, O., Ruhimat, M. and Setiawan, I. (2021) Travel time efficiency for students to school in bandung regency. IOP Conference Series: Earth and Environmental Science, 683(1). doi:10.1088/1755-1315/683/1/012009
Blagg, K., Chingos, M., Corcoran, S.A., Cowen,C.J., Denice, P. Gross, B., Lincove, J.A., Sattin-Bajaj, C., Schwartz, A.E. and Valant, J. (2018) The Road to School: How Far Students Travel to School in the Choice-Rich Cities of Denver, Detroit, New Orleans, New York City, and Washington, DC. Research Report. Urban Institute https://www.urban.org/sites/default/files/publication/97151/the_road_to_school_7.pdf
Boisjoly, G. and El-Geneidy, A. (2017) Measuring performance: accessibility metrics in metropolitan regions around the world. Moving to access. Brookings Reports. https://www.brookings.edu/research/measuring-performance-accessibility-metrics-in-metropolitan-regions-around-the-world/
Chin, M (2020) The Zero Reject policy: a way forward for inclusive education in Malaysia? International Journal of Inclusive Education, 1-15. doi: 10.1080/13603116.2020.1846800
Department of Transport (2014) Travel to School. National Travel Survey 2014. https://assets.publishing.service.gov.uk/government/uploads/system/uploads/attachment_data/file/476635/travel-to-school.pdf
Department of Statistics Singapore (2020) Usual Mode of Transport Among Resident Students/Working Persons Travelling to School/Work Dashboard. https://www.singstat.gov.sg/find-data/search-by-theme/population/mode-of-transport/visualising-data/mode-of-transport-dashboard
20
International Journal of Geospatial and Environmental Research, Vol. 8, No. 2 [2021], Art. 1
https://dc.uwm.edu/ijger/vol8/iss2/1

Dhamecha, M. (2021) Improve K-Mean Clustering Algorithm in Large-Scale Data for Accuracy Improvement. In: Bhattacharyya D., Thirupathi Rao N. (eds) Machine Intelligence and Soft Computing. Advances in Intelligent Systems and Computing, 1280. Springer Singapore. doi:10.1007/978-981-15-9516-5_5
Di Natale, C. and Martinelli, E. (2019) Chapter 5 - Data Analysis. In G. Pennazza and M. B. Santonico (Eds.) Breadth. Academic Press. 81–94. doi:10.1016/B978-0-12-814562-3.00005-9
Eddie, S. (2016) Attribute-based Clustering Plugin for QGIS Short Manual. http://www. ekazakov.info/projects/abc_tutorial.html
Florida, R. (2019) Long school commute are terrible for kid. Bloomberg News https://www.bloomberg.com/news/articles/2019-05-07/how-distance-to-school-affects-student-well-being
Ganeswaran, L.K. (2013) Challenges of Special Education in Rural Schools: Teachers Perspective. The 2nd International Seminar on Quality and Affordable Education, Johor Bahru, Johor, Malaysia
Gao, H., Wang, X., Barbier, G. and Liu, H. (2011) Promoting Coordination for Disaster Relief – From Crowdsourcing to Coordination. In J. Salerno, S. Yang, D. Nau, and S.-K. Chai (Eds.), Social Computing, Behavioral-Cultural Modeling and Prediction, 6589, 197–204. Springer Berlin Heidelberg. doi:10.1007/978-3-642-19656-0_29
Hallahan, D.P., Kauffman, J.M. (2006) Exceptional Learners: Introduction to Special Education. Casebooks for Reflection and Analysis, 10th Edition, University of Virginia
Holmgren, J. and Ivehammar, P. (2020) Mode Choice in Home-to-Work travel in mid-size towns: The competitiveness of public transport when bicycling and walking are viable option. Transportation Research Procedia, 48, 1635-1643.
Huber, S. and Rust, C. (2016) Calculate Travel Time and Distance with Openstreetmap Data using the Open-Source Routing Machine (OSRM). Stata Journal, 16(2). 416-423
Husen, S.N.R.M., Idris, N.H. and Ishak, M.H.I. (2018) The quality of Openstreetmap in Malaysia: a preliminary assessment. International Archive Photogrammetry Remote Sensing and Spatial Information Science, XLII-4/W9,291–298, doi:10.5194/isprs-archives-XLII-4-W9-291-2018
Jia, H., Lam, J.S.L. and Tran, N.K. (2020) Transportation Research Procedia, 48,1740-1749
Jupp, V. (2006) The SAGE dictionary of social research methods, 10. London, SAGE Publications, Ltd. doi: 10.4135/9780857020116
Kaszczyszyn, P. and Sypion-Dutkowska,N. (2019) Walking Access to Public Transportation Stops for City Residents. A Comparison of Methods. Sustainability, 11(14), 3753
Kiani, R., Mahdavi, S. and Keshavarzi, A. (2015) Analysis and Prediction of Crimes by Clustering and Classification. International Journal of Advanced Research in Artificial Intelligence, 4(8), 11-17
Krejcie R.V. and Morgan D.W. (1979) Determining Sample Size for Research Activities. Educational and Psychological Measurement, 30(3),607-610. doi:10.1177/001316447003000308
Kumar, B., Vanajakshi, L. and Subramanian, S. (2017) Bus Travel Time Prediction using
21
Idris et al.: Travel Time Patterns of Special Needs Students to School
Published by UWM Digital Commons, 2021
a Time-Space Discretization Approach. Transportation Research Part C: Emerging Technologies, 79, 308-332
Kuparinen, T. (2017) Perceptions of EFL Learning and Teaching by Autistic Students, Their Teachers and Their School Assistants. Master’s Thesis. University of Jyväskylä, Finland
Lidbe, A., Li, X., Adanu, E. K., Nambisan, S. and Jones, S. (2020) Exploratory analysis of recent trends in school travel mode choices in the U.S. Transportation Research Interdisciplinary Perspectives, 6. doi:10.1016/j.trip.2020.100146
Lim, J.M. (2015) Living with Autism in Malaysia. Policy IDEAS, 21, 11 MOE (Ministry of Education) (2019) Data Pendidikan Khas Tahun 2019. Open Data
Malaysia. http://www.data.gov.my Mohd Yasin, M.H. (2016) Pelaksanaan Program Pendidikan Inklusif Murid Berkeperluan
Khas dalam Pelan Pembangunan Pendidikan Malaysia 2013-2015. Paper Presented International Conference on Special Education in Southeast Asia Region 6th Series. Universiti Kebangsaan Malaysia, Selangor
Mustapha, O.O., Rakiat, H.L., Henry,O.U., Success,O.O, Ali,A.J. and Idayat, O.A.(2016) A GIS Approach to Evaluation of Accessibility to Private Primary Schools in Ilorin West Local Government Area, Kwara State, Nigeria. International Journal of Scientific Research in Science, Engineering and Technology, 2, 196-200
Nasir, M.N.A. and Efendi, A.N.A.E. (2016) Special education for children with disabilities in Malaysia: Progress and obstacles. Malaysian Journal of Society and Space, 12(10) ,78-87
Numbeo. (2021) Traffic in Vietnam. https://www.numbeo.com/traffic/country_result.jsp?country=Vietnam
Nurdden, A., Riza Atiq, O.K. and Rahmat, A.I. (2005) Policies to Coerce Car Drivers to Utilize Public Transportation (for all Trips and School Trips) in Malaysia. European Journal of Scientific Research, 7(1), 596-605
Openrouteservices (2020) Routing algorithm of open route service https://ask.openrouteservice.org/t/routing-algorithm-of-open-route-service/2249andtype=pdf#page=112
Othman, N. and Matore, E.M. (2020) The Zero-Reject Policy in Special Education: A Critique Review. Journal of Critical Review, 7(110) 2507-2515
Parhah, S. (2018) Accessibility of Schools in Indonesia: Is School Zoning Required?, In Proceedings of the 2nd International Conference on Economic Education and Entrepreneurship, Bandung, Indonesia, 622–625. doi:10.5220/00068906 06220625
Parthasarathi, P., Levinson, D., and Hochmair, H. (2013) Network Structure and Travel Time Perception. PLoS ONE 8(10), e77718. doi:10.1371/journal.pone.0077718
Pradhan, R.K. and Sinha, N. (2017) Impact of Commuting Distance and School Timing on Sleep of School Students. Sleep and Biological Rhythms, 15(2),153-158
Qin, J., Liu, Y., Yi, D., Sun, S. and Zhang, J. (2020) Spatial Accessibility Analysis of Parks with Multiple Entrances Based on Real-Time Travel: The Case Study in Beijing. Sustainability, 12(18),7618. doi:10.3390/su12187618
Quiroga, C.A. and Bullock, D. (1998) Travel Time Studies with Global Positioning and Geographic Information System: An Integrated Methodology. Transportation Research Part C, 6, 101-127
22
International Journal of Geospatial and Environmental Research, Vol. 8, No. 2 [2021], Art. 1
https://dc.uwm.edu/ijger/vol8/iss2/1

Raqib, A. Wan Ibrahim, W.H. and Mohd Sadullah, A.F. (2005) Estimating Travel Time of Arterial Road Using Car Chasing Method and Moving Observer Method. Journal of Transportation Science Society of Malaysia, 1,77-87
Rekha, R.S., Radhakrishnan, N. and Mathew, S. (2020) Spatial accessibility analysis of schools using geospatial techniques. Spatial Information Research, 28(6),699-708
Richard, L. (2014) Exploring the Association Between Commute to School Duration and Children's Physical Activity Level and Bodyweight Status. Electronic Thesis and Dissertation Repository Master Thesis. The University of Western Ontario. 2238. https://ir.lib.uwo.ca/etd/2238
Richard, J.U. and Ogba, D.C. (2016) Suitability Analysis of Secondary School Accessibility in Andoni L,G.A, Rivers State, Nigeria. International Journal of Scientific and Engineering Research, 7(1), 969-976
Sikdar P.K., Kanagadurai, B, Mahesh Chand and Singh A.K. (2002) Rural road network planning based on functional accessibility. Proceedings of the International Conference on Advances in Civil Engineering. January 3-5. IIT Kharagpur
Statista Research Department. (2020) Weekly average duration of commuting to and from school or work among people in Japan from 1976 to 2016. https://www.statista.com/statistics/867902/japan-time-spent-commuting-school-work-weekly-average/
Suhaibah, A., Uznir, U., Anton, F., Mioc, D. and Rahman, A.A. (2016). 3d Nearest Neighbour Search Using a Clustered Hierarchical Tree Structure. The International Archives of the Photogrammetry, Remote Sensing and Spatial Information Sciences, XLI-B2, 87–93, doi:10.5194/isprs-archives-XLI-B2-87-2016
Suwardo, Napiah, M. and Kamaruddin, I. (2010) ARIMA models for Bus Travel Time Prediction. Journal The Institution of Engineers, Malaysia, 71(2). 49-58.
The Star. (2019) More students enrolled under Zero Reject Policy. https://www.thestar.com.my/news/education/2019/10/06/more-students-enrolled-under-zero-reject-policy
TheSundaily. (2019) More than 87000 students registered under zero reject policy. https://www.thesundaily.my/local/more-than-87-000-students-registered-under-zero-reject-policy-GJ1319844
Tigre, R., Sampaio, B. and Menezes, T. (2017) The impact of commuting time on youth's school performance. Journal of Regional Science, 57(1),28-47
Utusan Online. (2009) Ibu bapa anak istimewa rayu PPD Johor Bahru kekal sistem lama. Utusan Melayu (M) Berhad. http://ww1.utusan.com.my/utusan/info.asp?y=2009anddt=0827andpub=Utusan_Malaysiaandsec=Forumandpg=fo_04.htm#ixzz5Y8Mr1tru
Vignati, F., Fustinoni, D. and Niro, A. (2018) A novel scale-invariant, dynamic method for hierarchical clustering of data affected by measurement uncertainty, Journal of Computational and Applied Mathematics, 344, 521-531
Wang, F. and Xu, Y. (2011) Estimating O-D Travel Time Matrix by Google Maps API: implementation, advantages and implications. Annal of GIS. 17(4), 199-209
Wang, H., Tian,H. Zhang, Y. and Gu, B. (2021) Research on Classification of Travel Time for Electronic Police Based on the DBSCAN Algorithm. The 2nd International
23
Idris et al.: Travel Time Patterns of Special Needs Students to School
Published by UWM Digital Commons, 2021
Conference on Big Data and Informatization Education (ICBDIE), 257-260. doi: 10.1109/ICBDIE52740.2021.00064
Yahya, N., Sukiman, N., Suhaimi, N.A., Azmi, N.A. and Manan, H.A. (2019) How Many Roads Must a Malaysian walk down? Mapping the Accessibility of Radiotherapy Facilities in Malaysia. PLoS One, 14(3),1-10
Yan-Li, S. and Sofian, N.S. (2018) A Preliminary Study on Leading Special Education in National School in Malaysia: Special Education Integrated Programme (SEIP). The 5th National and 3rd International Conference on Education (NICE), Phuket, Thailand
24
International Journal of Geospatial and Environmental Research, Vol. 8, No. 2 [2021], Art. 1
https://dc.uwm.edu/ijger/vol8/iss2/1