Embed Size (px)
Citation preview
IJMRR/ Feb 2014/ Volume 4/Issue 2/Article No-3/192-206 ISSN: 2249-7196
*Corresponding Author www.ijmrr.com 192
INTERNATIONAL JOURNAL OF MANAGEMENT RESEARCH
AND REVIEW
SUSTAINABILITY PERFORMANCE MEASUREMENT: AN INVESTIGATION
INTO CORPORATE PERFORMANCE THROUGH ENVIRONMENTAL
INDICATORS
Karun Kumar*1
1PhD Candidate, Graduate School of Public Administration, National Institute of
Development Administration, Bangkok.
ABSTRACT
The concept of sustainable development has emerged as a key guiding principle and action
agenda for all forms of environmental management, economic development and social
justice. The much professed “triple bottom line” TBL (Financial, Social, and Environmental)
has its proponents and detractors who argues whether holding corporations accountable to
economic prosperity, social justice, and environmental quality, constitutes progress.
International businesses often have improved performance when they include their social,
ethical and environmental responsibilities in business planning – their corporate and social
responsibility. The “value” concept and sustainability is all the more relevant today when the
world economy is reeling in deep economic crisis. This research is an attempt to explore and
explain Sustainability Performance Measurement (SPM) based on environmental values and
indicators (Energy, Water, Emission, Water, and Recycling) that is measuring the
immeasurable and that has implications and consequences for corporate governance in
particular, and more generally for the economy, business and society. The study used a
qualitative exploratory approach, using a mix investigative and content analysis as research
strategy to develop insight into sustainability performance measurement practices of
Corporations. The scope of this study extended to large number of Corporations leading in
sustainability practices and not limited to any geographical region. The study found
significant inconsistencies and gaps among company data undermining the comparability of
this information as Corporations approach reporting in differing ways. This is of importance
to policy making, lack an accurate picture of the landscape, particularly acute in areas such as
climate change, that are of rapidly increasing importance in terms of value creation and
integration. The issue of sustainability poses a value proposition that is inflicted by a
measurement challenge. The challenge is to redefine the conventional economic system that
is designed to avoid paying for any external (environmental and social) cost. The paradigm
shift would require harnessing the financial firepower of global corporations to create a
robust incentive structure and integrated approach through value creation. A strategic model
is proposed for value creation and effectively measuring in integrated sustainability
performance.
Keywords: Sustainability Performance Measurement (SPM), Corporate Social
Responsibility (CSR), Compliance and Reporting.
IJMRR/ Feb 2014/ Volume 4/Issue 2/Article No-3/192-206 ISSN: 2249-7196
Copyright © 2012 Published by IJMRR. All rights reserved 193
INTRODUCTION
“If you can’t measure it, you can’t manage it” Peter Drucker
The beginning of 21st century ushered in a new era in corporate strategy and management
towards sustainable thinking. The concept of sustainable development has emerged as a key
guiding principle and action agenda for all forms of environmental management, economic
development and social justice. The much professed “triple bottom line” (TBL: Financial,
Social, and Environmental) (Elkington, 1998) has its proponents and detractors who argues
whether holding corporations accountable to economic prosperity, social justice, and
environmental quality, constitutes progress.
The emergence of sustainability in its contemporary form stems from the UN’s creation in
1983 of The World Commission on Environment and Development (WCED), headed by
former prime minister of Norway, Gro Harlem Brundtland. The most acceptable quote from
the Brundtland report defined sustainable development as “development that meets the need
of the present generation without compromising the ability of future generations to meet
their needs”.
The main catalyst for the importance to concept of sustainability was the Rio de Janeiro Earth
Summit held in 1992. The Rio summit agreed to set of action points for sustainable
development, collectively referred to as Agenda 21, and 172 signatory governments
committed them to action . The business environment has evolved rapidly over the past few
decades which have caused almost every aspect of organization and management to change
accordingly. In this environment, a necessary condition to achieve high performance
standards is being able to effectively measure and monitor company’s performance. Business
environment requires management accounting information to provide relevant measures of
performance, and reflect the strategic goals of a modern firm. The performance measurement
system (PMS) developed as strategic orientation aimed at providing information to enhance
the firm’s strategic goals.
Performance-measurement systems can play a crucial role in strategy implementation by
helping to translate firm’s strategy into desired behaviors and results, communicate
expectations, monitor progress, provide feedback, and motivate employees to improve firm’s
performance (Kaplan and Norton 1992). The benefits of employing a balanced performance
system are typically articulated in terms of the limitations of traditional financial measures
(McNamara and Mong, 2005)
RESEARCH OBJECTIVE
To analyse corporate environmental sustainability performance by examining environmental
indicator data (Energy, Water, Emission, Waste, and Recycling) in terms of disclosure and
reporting practices.
LITERATURE REVIEW
A survey by PricewaterhouseCoopers (2011) reported, an unprecedented level of business
transparency is allowing companies to compete for investor attention by using non-financial
indicators that may have implications for business value.
IJMRR/ Feb 2014/ Volume 4/Issue 2/Article No-3/192-206 ISSN: 2249-7196
Copyright © 2012 Published by IJMRR. All rights reserved 194
Epstein (2008) argues that Corporations today have become more sensitive to social issues
and stakeholder concerns and are striving to become better corporate citizens. Paine (1994)
had argued that organizational integrity is based on an organization’s guiding values.
Corporations, however, are being seen as the catalyst to play leading role in this model.
Bakan (2004) noted that over the last 150 years the corporations have risen from relative
obscurity to become the world’s dominant economic institution.
The Environmental Tracking (ET) scores the world’s largest companies by their GHG
emissions intensity, whilst factoring in different levels of disclosure and verification. Paine
(2003) argues that ethics is an important corporate concern and “values are a critical success
factor in today’s business world.” Further, corporate values are constantly shifting because of
several factors. The “value” concept and sustainability is all the more relevant today when
the world economy is reeling in deep economic crisis.
Edwards (2009) links sustainability to natural eco-system and profess that sustainability
revolution encourages business practices to mimic natural system. The industrial ecology
perspective applies to the efficient design of products and services and the elimination of
waste. Elkington (1998) professed that this would require dramatic changes in the
organizations’ performance against the economic, social and environmental (triple) bottom
lines and thus paying more and more attention to their values and responsibility.
Sustainability also necessitates the transformation of mindset and commitment of the
leadership and organizational performance to include key stakeholders. Epstein (2008)
established the emergence of sustainability as corporate strategy, and making sustainability
an integral part of a company’s business strategy in order to obtain the bottom-line benefits.
Tebo (2005) describes sustainable growth as a growth that creates economic and societal
values while reducing overall environmental impact. Edwards (2009) further substantiates
that the limits of natural resources, declining ecosystem and increasing economic disparity
has given birth to sustainable practices in business.
Managing sustainability holistically is challenging and requires a sound management
framework that integrates environmental and social performance with economic business
performance (Johnson, 2007; Schaltegger and Wagner, 2006; Epstein and Roy, 2003).
However, Schaltegger and Wagner, (2006) raises a vital question on managing sustainability
as its activities may result in establishing a parallel organization within the company dealing
with non-economic issues and measuring non-economic aspects of performance.
The academic view on sustainability and CSR sees it as balancing act by corporations to
achieve profit and stakeholder fulfillment while trying to be socially responsible. Van
Marrewijk & Verre (2003) refers sustainability to an organization’s activities, typically
considered voluntary, that demonstrate the inclusion of social and environmental concerns in
business operations and in interactions with stakeholders. Doane (2005) shed the eyewash by
suggesting that although some see CSR as simply philanthropy by a different name, it can be
defined broadly as the efforts corporations make above and beyond regulation to balance the
needs of stakeholders with the need to make a profit. Gillis & Spring (2001) have a more
comprehensive and balanced view to suggest that CSR is defined as business decision
IJMRR/ Feb 2014/ Volume 4/Issue 2/Article No-3/192-206 ISSN: 2249-7196
Copyright © 2012 Published by IJMRR. All rights reserved 195
making based on ethical values; compliance with legal standards; and respect for
communities, citizens, and the environment.
A large number of performance measurement frameworks aimed at evaluating performance
have been developed. The Balanced Scorecard (BSC) (Kaplan and Norton 1990) identified
many companies tended to manage their businesses based solely on financial measures.
While that may have worked well in the past, the pace of business in today's world requires
more comprehensive measures. Though financial measures are necessary, they can only
report what has happened in the past where a business has been, but not where it is headed.
Literature and surveys suggest that Balanced Scorecard prevails as the most influential and
widely accepted performance measurement system. It offers a medium to deliver strategic
vision while providing an evaluation system (Bhagyashree et. al. 2006; Amaratunga et. al.
2001). The concept has delivered a totally new and radical approach to business process
management but performance measurement is still a rather broad and problematic area for
many organizations and involves design, measures, and implementation issues relevant to
organizational changes.
The world is changing, thus, requiring changes in the way organizations are managed.
Increasing emphasis on sustainability could be a touchstone of future competitive advantage,
as it drives cost reduction, increases in revenues and innovations it is evident that in response
to internal and external pressure, organizations are introducing sustainable principles to the
business. Further, this analysis does not show evidence of a linkage between classic
references in performance measurement (as identified by Neely, 1995, 2005) with
sustainability highlighting this gap.
Sustainability is an activity of lasting value with capacity to endure within earth’s carrying
capacity. This in terms of business and economic activity has become a major issue for global
business and for government at all levels. But there is no universally accepted definition of
'sustainability' and measurement of progress toward sustainability is still more art than
science. What is measured, how it is measured, what range of indicators are appropriate, how
one values the present in relation to the future and how one arrives at a final judgment where
ecological, social and economic indicators move in different directions, are all matters of
intense debate and open for interpretation.
METHODOLOGY
The study used qualitative and explorative approach, a process of examining and interpreting
data in order to elicit meaning, gain understanding, and develop empirical knowledge (Corbin
and Strauss, 2008). This study used a mix of investigative techniques and content analysis as
research strategy using multiple convergent methodologies of data collection to develop
insight into sustainability performance measurement strategies and practices of international
companies.
The research study firstly focused in the sustainability performance measurement of
corporations. For this study a corporation is defined to include a firm that operates in more
than one country at a time, also called Transnational Corporation (TNC) or Multinational
Corporation (MNC). A total of 80 corporations, not limited to any geographical region were
IJMRR/ Feb 2014/ Volume 4/Issue 2/Article No-3/192-206 ISSN: 2249-7196
Copyright © 2012 Published by IJMRR. All rights reserved 196
included in this study as representatives of global corporation. The limitation was the
dynamic nature of sustainability measurement framework which is global in nature and
constantly being driven by evolving principles, guidelines, framework, regulation and
industry practices, both voluntary and mandatory. Most reporting and analysis tends to
currently tend focus more on process issues, rather than actual performance and impact. It is
hard to determine from sustainability reports, a full picture of organizations environmental
impact. Their communications demonstrate engagement with their wider responsibilities, but
not always providing concrete comparable data on environmental performance.
A host of key informants were approached by researcher in three international conferences.
This strategy was particularly useful because environmental sustainability in present era is a
phenomena and being evolved as a core business strategy for businesses. 80 international
companies were selected through multistage sampling for analysis of sustainability
development report (data) published used for content analysis. A qualitative methodology
ensured the context of and relationship between sustainability issues is captured.
The unit of analysis for this study was data environmental data from 80 corporations, and
qualitative information from interview and conference transcripts, published articles, journals
and industry reports. The data gathered from 80 companies were grouped as environmental
indicators. Five measurable indicators were chosen for this study which can be measured and
then a trend analysis was carried out to chart the trend. Data was sought for seven year range
(2006-2012) because sustainability reporting is relatively new phenomenon and in most
instance data were available for only three to five years. This range gave sufficient range to
extract comparable and valid data.
The five vital indicators are Energy, Water, Emission, Waste, and Recycling. For 80
corporations reporting on 5 indicators, the aim was to get 400 data sets for the final analysis.
The companies were grouped according to Global Industry Classification Standard (GICS).
The GICS methodology (www.msci.com) are designed to respond to the global financial
community’s need for an accurate, complete and standard industry definition and used by
financial professionals worldwide and has been widely accepted as an industry analysis
framework. The GICS structure consists of 10 sectors, 23 industry groups, 59 industries and
122 sub-industries. Following 10 GICS classified sectors has been used for data analysis in
this study;
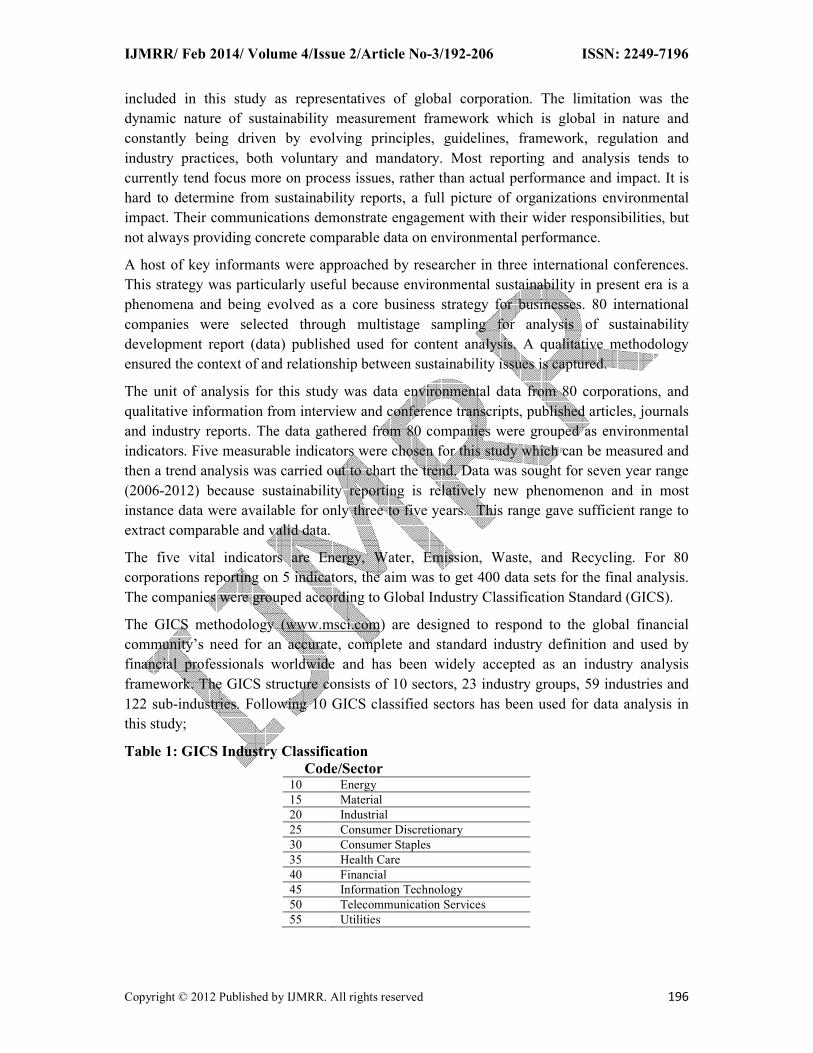
Table 1: GICS Industry Classification
Code/Sector 10 Energy
15 Material
20 Industrial
25 Consumer Discretionary
30 Consumer Staples
35 Health Care
40 Financial
45 Information Technology
50 Telecommunication Services
55 Utilities
IJMRR/ Feb 2014/ Volume 4/Issue 2/Article No-3/192-206 ISSN: 2249-7196
Copyright © 2012 Published by IJMRR. All rights reserved 197
The environmental impacts analyzed in this study represent some of most significant global
environmental impacts. The indicators selected were reported by companies’ in variety of
data unit formats that posed a huge challenge for researcher to express it in common units
that can be compared. For example measurement of energy units are joules but it was
expressed in several units like kilo watt hours (kWh), megagajouls (MJ), Terajouls (TJ), Btu,
Watt hours (Wh) etc. Also there was huge variation among company data in terms of
consumption. For example a mining company that is highly energy intensive may report The
extremely high amount of energy consumption compare to an IT company. All data sets were
grouped into intervals analyze trends.
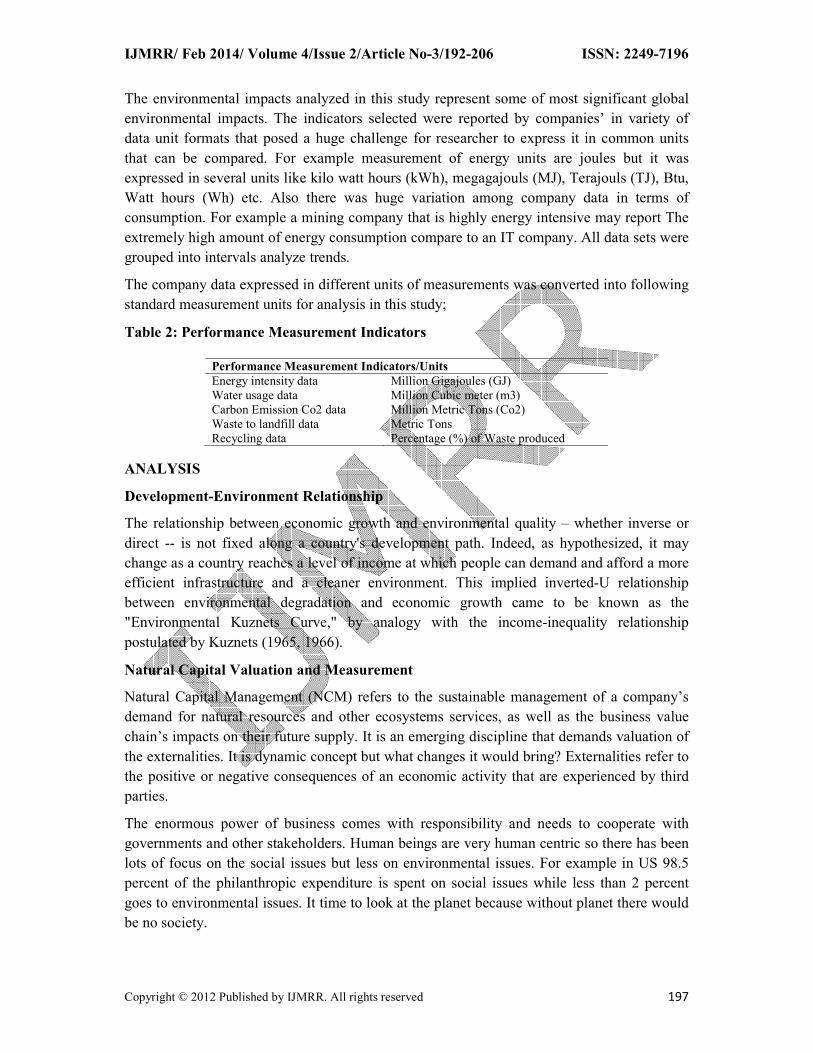
The company data expressed in different units of measurements was converted into following
standard measurement units for analysis in this study;
Table 2: Performance Measurement Indicators
ANALYSIS
Development-Environment Relationship
The relationship between economic growth and environmental quality – whether inverse or
direct -- is not fixed along a country's development path. Indeed, as hypothesized, it may
change as a country reaches a level of income at which people can demand and afford a more
efficient infrastructure and a cleaner environment. This implied inverted-U relationship
between environmental degradation and economic growth came to be known as the
"Environmental Kuznets Curve," by analogy with the income-inequality relationship
postulated by Kuznets (1965, 1966).
Natural Capital Valuation and Measurement
Natural Capital Management (NCM) refers to the sustainable management of a company’s
demand for natural resources and other ecosystems services, as well as the business value
chain’s impacts on their future supply. It is an emerging discipline that demands valuation of
the externalities. It is dynamic concept but what changes it would bring? Externalities refer to
the positive or negative consequences of an economic activity that are experienced by third
parties.
The enormous power of business comes with responsibility and needs to cooperate with
governments and other stakeholders. Human beings are very human centric so there has been
lots of focus on the social issues but less on environmental issues. For example in US 98.5
percent of the philanthropic expenditure is spent on social issues while less than 2 percent
goes to environmental issues. It time to look at the planet because without planet there would
be no society.
Performance Measurement Indicators/Units
Energy intensity data Million Gigajoules (GJ)
Water usage data Million Cubic meter (m3)
Carbon Emission Co2 data Million Metric Tons (Co2)
Waste to landfill data Metric Tons
Recycling data Percentage (%) of Waste produced
IJMRR/ Feb 2014/ Volume 4/Issue 2/Article No-3/192-206 ISSN: 2249-7196
Copyright © 2012 Published by IJMRR. All rights reserved 198
Key Measurement Indicators
Energy, Water, Emission, Waste are key factors of organizations sustainable life. Water and
energy must be seen as key strategic resources, with food security as the final goal for
sustainable development for any nation.
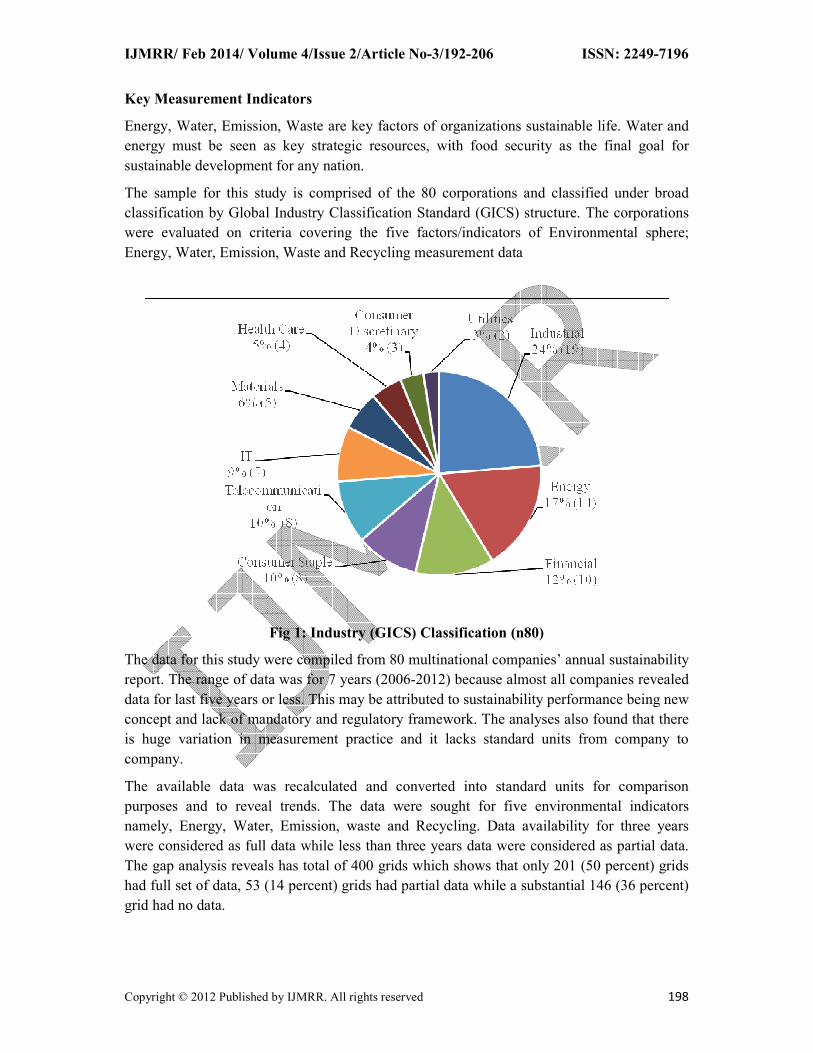
The sample for this study is comprised of the 80 corporations and classified under broad
classification by Global Industry Classification Standard (GICS) structure. The corporations
were evaluated on criteria covering the five factors/indicators of Environmental sphere;
Energy, Water, Emission, Waste and Recycling measurement data
Fig 1: Industry (GICS) Classification (n80)
The data for this study were compiled from 80 multinational companies’ annual sustainability
report. The range of data was for 7 years (2006-2012) because almost all companies revealed
data for last five years or less. This may be attributed to sustainability performance being new
concept and lack of mandatory and regulatory framework. The analyses also found that there
is huge variation in measurement practice and it lacks standard units from company to
company.
The available data was recalculated and converted into standard units for comparison
purposes and to reveal trends. The data were sought for five environmental indicators
namely, Energy, Water, Emission, waste and Recycling. Data availability for three years
were considered as full data while less than three years data were considered as partial data.
The gap analysis reveals has total of 400 grids which shows that only 201 (50 percent) grids
had full set of data, 53 (14 percent) grids had partial data while a substantial 146 (36 percent)
grid had no data.
IJMRR/ Feb 2014/ Volume 4/Issue 2/Article No-3/192-206 ISSN: 2249-7196
Copyright © 2012 Published by IJMRR. All rights reserved 199
Fig 2: Indicator wise data reporting n80
The above figure reveals that even the biggest corporations are not yet to the mark for full
compliance. It is important to note that companies have a different level of impact and face a
different level of risk for each Environmental indicator, depending on the industry and
location of operations. High-risk exposure or high impact for a particular indicator signifies
greater relevance or materiality than low-risk exposure or low impact.
Indicator wise analysis reveals that 72 percent corporations reported Emission data that was
the best performing result followed by 50 percent Energy data, 49 percent Waste data, 47
percent Water data, and the lowest 34 percent corporations reporting Recycling data. On
average 13 percent corporations reported partial data for all five indicators while over a third
corporations, failed to report data on average for all five indicators. The Emission disclosure
of 83 percent (full and partial data) followed by Energy disclosure 63 percent (full and partial
data) suggests that Emission and Energy disclosure is a mainstream practice among large
corporations.
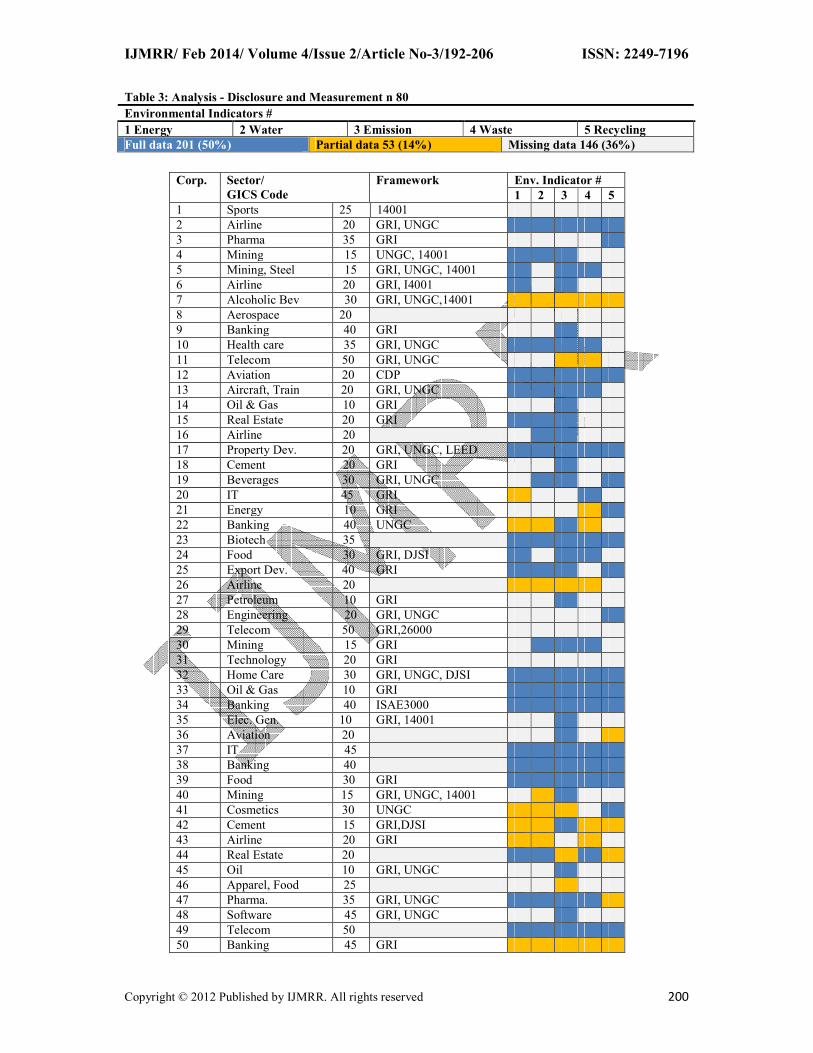
Table below provides an overview of the 80 corporations overall performance as well as
specific environmental indicator disclosure. Additional information in the shaded squares
provides a gap analysis indicating whether or not each company has a provided data on
specific environmental indicator. A dark shaded square indicates that the item has been
disclosed (i.e. the company has provided data for at least three years) while the light shade
squares indicate partial data gaps (i.e. less than three years data disclosed). The blank squares
indicate that no measurable data were disclosed (i.e. not considered material or relevant).Also
indicated is the company origin and its classification on GICS structure and whether the
company is a signatory to the UN Global Compact and whether it produces a
CSR/Sustainability Report using GRI guidelines.
Energy Water Emission Waste Recycling
Full 40 37 58 39 27
Partial 13 9 11 9 11
Missing 27 34 11 32 42
0
10
20
30
40
50
60
70
Data Set #
IJMRR/ Feb 2014/ Volume 4/Issue 2/Article No-3/192-206 ISSN: 2249-7196
Copyright © 2012 Published by IJMRR. All rights reserved 200
Table 3: Analysis - Disclosure and Measurement n 80
Environmental Indicators #
1 Energy 2 Water 3 Emission 4 Waste 5 Recycling
Full data 201 (50%) Partial data 53 (14%) Missing data 146 (36%)
Corp. Sector/
GICS Code
Framework Env. Indicator #
1 2 3 4 5
1 Sports 25 14001
2 Airline 20 GRI, UNGC
3 Pharma 35 GRI
4 Mining 15 UNGC, 14001
5 Mining, Steel 15 GRI, UNGC, 14001
6 Airline 20 GRI, I4001
7 Alcoholic Bev 30 GRI, UNGC,14001
8 Aerospace 20
9 Banking 40 GRI
10 Health care 35 GRI, UNGC
11 Telecom 50 GRI, UNGC
12 Aviation 20 CDP
13 Aircraft, Train 20 GRI, UNGC
14 Oil & Gas 10 GRI
15 Real Estate 20 GRI
16 Airline 20
17 Property Dev. 20 GRI, UNGC, LEED
18 Cement 20 GRI
19 Beverages 30 GRI, UNGC
20 IT 45 GRI
21 Energy 10 GRI
22 Banking 40 UNGC
23 Biotech 35
24 Food 30 GRI, DJSI
25 Export Dev. 40 GRI
26 Airline 20
27 Petroleum 10 GRI
28 Engineering 20 GRI, UNGC
29 Telecom 50 GRI,26000
30 Mining 15 GRI
31 Technology 20 GRI
32 Home Care 30 GRI, UNGC, DJSI
33 Oil & Gas 10 GRI
34 Banking 40 ISAE3000
35 Elec. Gen. 10 GRI, 14001
36 Aviation 20
37 IT 45
38 Banking 40
39 Food 30 GRI
40 Mining 15 GRI, UNGC, 14001
41 Cosmetics 30 UNGC
42 Cement 15 GRI,DJSI
43 Airline 20 GRI
44 Real Estate 20
45 Oil 10 GRI, UNGC
46 Apparel, Food 25
47 Pharma. 35 GRI, UNGC
48 Software 45 GRI, UNGC
49 Telecom 50
50 Banking 45 GRI
IJMRR/ Feb 2014/ Volume 4/Issue 2/Article No-3/192-206 ISSN: 2249-7196
Copyright © 2012 Published by IJMRR. All rights reserved 201
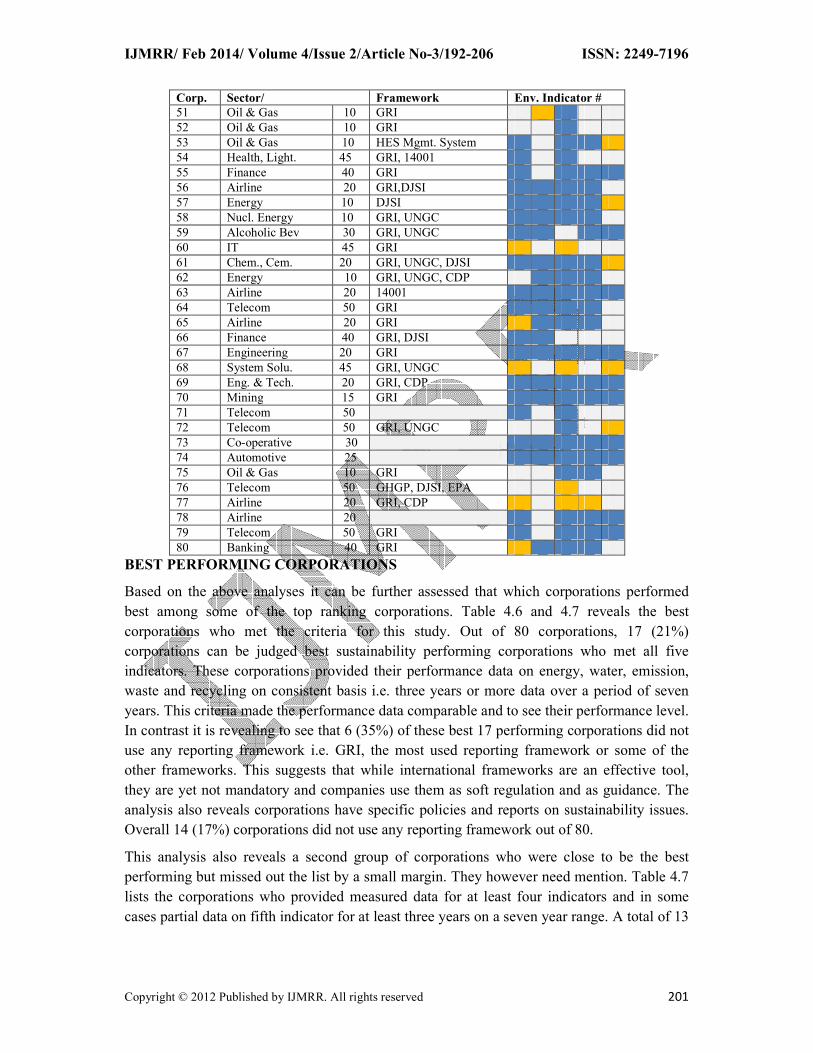
Corp. Sector/ Framework Env. Indicator #
51 Oil & Gas 10 GRI
52 Oil & Gas 10 GRI
53 Oil & Gas 10 HES Mgmt. System
54 Health, Light. 45 GRI, 14001
55 Finance 40 GRI
56 Airline 20 GRI,DJSI
57 Energy 10 DJSI
58 Nucl. Energy 10 GRI, UNGC
59 Alcoholic Bev 30 GRI, UNGC
60 IT 45 GRI
61 Chem., Cem. 20 GRI, UNGC, DJSI
62 Energy 10 GRI, UNGC, CDP
63 Airline 20 14001
64 Telecom 50 GRI
65 Airline 20 GRI
66 Finance 40 GRI, DJSI
67 Engineering 20 GRI
68 System Solu. 45 GRI, UNGC
69 Eng. & Tech. 20 GRI, CDP
70 Mining 15 GRI
71 Telecom 50
72 Telecom 50 GRI, UNGC
73 Co-operative 30
74 Automotive 25
75 Oil & Gas 10 GRI
76 Telecom 50 GHGP, DJSI, EPA
77 Airline 20 GRI, CDP
78 Airline 20
79 Telecom 50 GRI
80 Banking 40 GRI
BEST PERFORMING CORPORATIONS
Based on the above analyses it can be further assessed that which corporations performed
best among some of the top ranking corporations. Table 4.6 and 4.7 reveals the best
corporations who met the criteria for this study. Out of 80 corporations, 17 (21%)
corporations can be judged best sustainability performing corporations who met all five
indicators. These corporations provided their performance data on energy, water, emission,
waste and recycling on consistent basis i.e. three years or more data over a period of seven
years. This criteria made the performance data comparable and to see their performance level.
In contrast it is revealing to see that 6 (35%) of these best 17 performing corporations did not
use any reporting framework i.e. GRI, the most used reporting framework or some of the
other frameworks. This suggests that while international frameworks are an effective tool,
they are yet not mandatory and companies use them as soft regulation and as guidance. The
analysis also reveals corporations have specific policies and reports on sustainability issues.
Overall 14 (17%) corporations did not use any reporting framework out of 80.
This analysis also reveals a second group of corporations who were close to be the best
performing but missed out the list by a small margin. They however need mention. Table 4.7
lists the corporations who provided measured data for at least four indicators and in some
cases partial data on fifth indicator for at least three years on a seven year range. A total of 13
IJMRR/ Feb 2014/ Volume 4/Issue 2/Article No-3/192-206 ISSN: 2249-7196
Copyright © 2012 Published by IJMRR. All rights reserved 202
(16%) corporations were found to be in this group while only 1(8%) did not use any reporting
framework in this group.
A total of 30 corporations (tier 1 & 2) were found to be best performing corporations in line
with the criteria set for this study. This is by no means vindication of their overall
sustainability performance which is to be judged by an extensive analytical framework
covering broad spectrum of indicators as opposed to limited but vital indicators used for this
study. Most corporations are aware of the issues, but yet to developed corresponding policies
and practices. The analysis presented here indicates that best practice has still not permeated
through to all of the largest corporations in the world. If the first group alone is taken as
current best practice, then only about a fifth of the corporations studied can be said to employ
best practice in this area. Taking both groups into account it is about 37% corporations are
judged to be employing best practices judged on vital environmental indicators.
Although the sample was not analyzed for sector analysis, the corporations overall rankings
indicate that there is no evident segregation of sectors across the groups. No particular sector
demonstrates outright leadership in the overall rankings, although Industrial and Energy
sector has the highest number of corporations in the group. This sector’s performance could
be attributed to sector specific social and environmental challenges from stakeholder
concerns.
Energy Intensity
Energy consumption has a direct effect on operational cost and can increase exposure to
energy supply and prices. The environmental footprint of an organization is shaped greatly by
its choice of energy source. The consumption of non-renewable fuels ids the main contributor
to GHGs. It is very important for company to distinguish between fossil fuel energy and
renewable or clean energy. Fossil fuel energy is the main contributor to GHGs and increasing
consumption by industry is unsustainable. GRI-G4 requirements demands companies to
disclose following energy aspects, energy consumption within the organization (joules or
multiples), energy consumption outside of the organization, energy intensity, reduction of
energy consumption, and Reduction in energy requirements of products and services.
Water Intensity
The analysis of data reported from 80 companies’ show that up to 58 companies reported
their water consumption data. The peak was over 70 percent companies reporting in year
2009. Organizations water consumption pattern can also influence its relationship with
stakeholders. GRI-G4 guidelines recommend organization to measure their water use by,
total water withdrawal by source, water sources significantly affected by withdrawal of water,
percentage and total volume of water recycled and reused, and operations site adjacent to
high value biodiversity area. The rate of water reuse and recycling is a measure of efficiency
and demonstrate the success of organization in reducing total water withdrawal and
discharge.
Emission Intensity
Worldwide emissions of GHGs have increased steeply since 1945 and GHG emissions will
increase by another 50 percent by 2025 compared to current levels, with emissions in
IJMRR/ Feb 2014/ Volume 4/Issue 2/Article No-3/192-206 ISSN: 2249-7196
Copyright © 2012 Published by IJMRR. All rights reserved 203
developing countries growing the fastest. (www.WRI.org) Avoiding dangerous climate
change will require slowing this global trend in the short term, and reversing it over the next
one to two decades. Because of their large contributions, key policy targets are electricity and
heat, transport, buildings, industry, land-use change and forestry, and agriculture. Future
growth is likely to be especially high in the electricity and transport sectors, suggesting that
these are particularly important sectors for promoting policy change, investment, and
technology innovation.
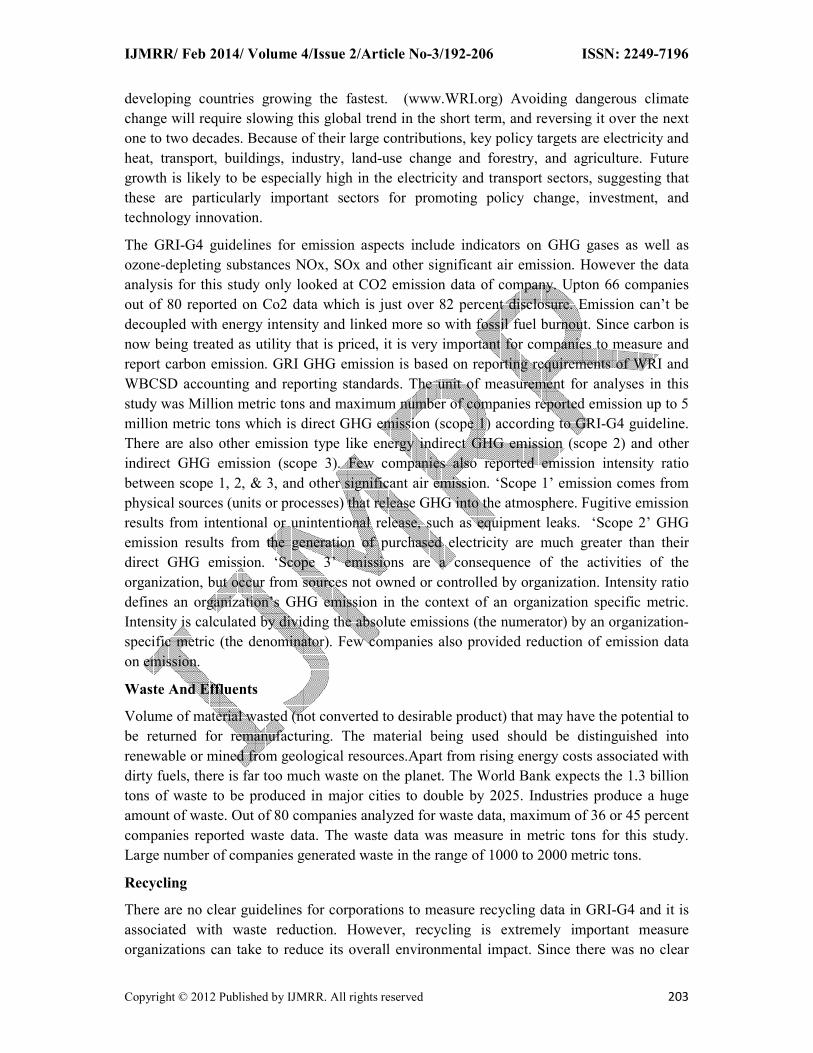
The GRI-G4 guidelines for emission aspects include indicators on GHG gases as well as
ozone-depleting substances NOx, SOx and other significant air emission. However the data
analysis for this study only looked at CO2 emission data of company. Upton 66 companies
out of 80 reported on Co2 data which is just over 82 percent disclosure. Emission can’t be
decoupled with energy intensity and linked more so with fossil fuel burnout. Since carbon is
now being treated as utility that is priced, it is very important for companies to measure and
report carbon emission. GRI GHG emission is based on reporting requirements of WRI and
WBCSD accounting and reporting standards. The unit of measurement for analyses in this
study was Million metric tons and maximum number of companies reported emission up to 5
million metric tons which is direct GHG emission (scope 1) according to GRI-G4 guideline.
There are also other emission type like energy indirect GHG emission (scope 2) and other
indirect GHG emission (scope 3). Few companies also reported emission intensity ratio
between scope 1, 2, & 3, and other significant air emission. ‘Scope 1’ emission comes from
physical sources (units or processes) that release GHG into the atmosphere. Fugitive emission
results from intentional or unintentional release, such as equipment leaks. ‘Scope 2’ GHG
emission results from the generation of purchased electricity are much greater than their
direct GHG emission. ‘Scope 3’ emissions are a consequence of the activities of the
organization, but occur from sources not owned or controlled by organization. Intensity ratio
defines an organization’s GHG emission in the context of an organization specific metric.
Intensity is calculated by dividing the absolute emissions (the numerator) by an organization-
specific metric (the denominator). Few companies also provided reduction of emission data
on emission.
Waste And Effluents
Volume of material wasted (not converted to desirable product) that may have the potential to
be returned for remanufacturing. The material being used should be distinguished into
renewable or mined from geological resources.Apart from rising energy costs associated with
dirty fuels, there is far too much waste on the planet. The World Bank expects the 1.3 billion
tons of waste to be produced in major cities to double by 2025. Industries produce a huge
amount of waste. Out of 80 companies analyzed for waste data, maximum of 36 or 45 percent
companies reported waste data. The waste data was measure in metric tons for this study.
Large number of companies generated waste in the range of 1000 to 2000 metric tons.
Recycling
There are no clear guidelines for corporations to measure recycling data in GRI-G4 and it is
associated with waste reduction. However, recycling is extremely important measure
organizations can take to reduce its overall environmental impact. Since there was no clear
IJMRR/ Feb 2014/ Volume 4/Issue 2/Article No-3/192-206 ISSN: 2249-7196
Copyright © 2012 Published by IJMRR. All rights reserved 204
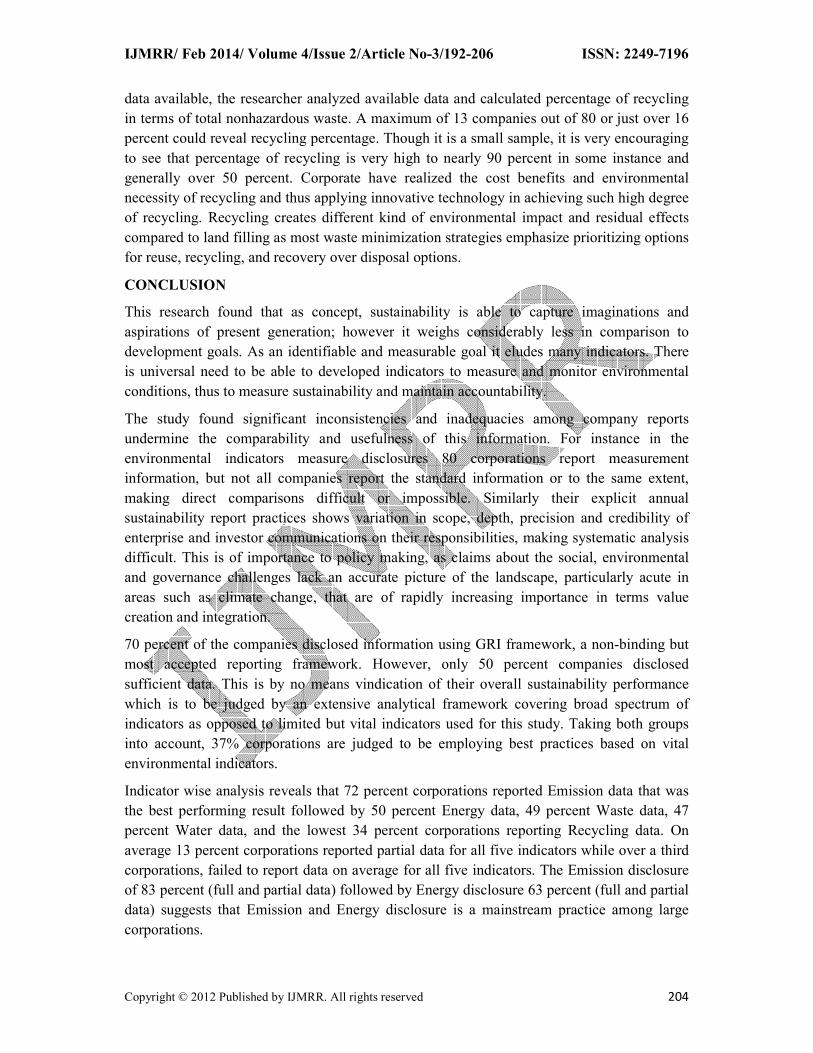
data available, the researcher analyzed available data and calculated percentage of recycling
in terms of total nonhazardous waste. A maximum of 13 companies out of 80 or just over 16
percent could reveal recycling percentage. Though it is a small sample, it is very encouraging
to see that percentage of recycling is very high to nearly 90 percent in some instance and
generally over 50 percent. Corporate have realized the cost benefits and environmental
necessity of recycling and thus applying innovative technology in achieving such high degree
of recycling. Recycling creates different kind of environmental impact and residual effects
compared to land filling as most waste minimization strategies emphasize prioritizing options
for reuse, recycling, and recovery over disposal options.
CONCLUSION
This research found that as concept, sustainability is able to capture imaginations and
aspirations of present generation; however it weighs considerably less in comparison to
development goals. As an identifiable and measurable goal it eludes many indicators. There
is universal need to be able to developed indicators to measure and monitor environmental
conditions, thus to measure sustainability and maintain accountability.
The study found significant inconsistencies and inadequacies among company reports
undermine the comparability and usefulness of this information. For instance in the
environmental indicators measure disclosures 80 corporations report measurement
information, but not all companies report the standard information or to the same extent,
making direct comparisons difficult or impossible. Similarly their explicit annual
sustainability report practices shows variation in scope, depth, precision and credibility of
enterprise and investor communications on their responsibilities, making systematic analysis
difficult. This is of importance to policy making, as claims about the social, environmental
and governance challenges lack an accurate picture of the landscape, particularly acute in
areas such as climate change, that are of rapidly increasing importance in terms value
creation and integration.
70 percent of the companies disclosed information using GRI framework, a non-binding but
most accepted reporting framework. However, only 50 percent companies disclosed
sufficient data. This is by no means vindication of their overall sustainability performance
which is to be judged by an extensive analytical framework covering broad spectrum of
indicators as opposed to limited but vital indicators used for this study. Taking both groups
into account, 37% corporations are judged to be employing best practices based on vital
environmental indicators.
Indicator wise analysis reveals that 72 percent corporations reported Emission data that was
the best performing result followed by 50 percent Energy data, 49 percent Waste data, 47
percent Water data, and the lowest 34 percent corporations reporting Recycling data. On
average 13 percent corporations reported partial data for all five indicators while over a third
corporations, failed to report data on average for all five indicators. The Emission disclosure
of 83 percent (full and partial data) followed by Energy disclosure 63 percent (full and partial
data) suggests that Emission and Energy disclosure is a mainstream practice among large
corporations.
IJMRR/ Feb 2014/ Volume 4/Issue 2/Article No-3/192-206 ISSN: 2249-7196
Copyright © 2012 Published by IJMRR. All rights reserved 205
Most large Corporations have found to be reporting high level of non-financial information,
however, significant inconsistencies and inadequacies among company reports occurs that
undermine the comparability and usefulness of this information. There are limitations in
current forms of reporting and analysis in describing the actual social and environmental
impact of companies because they are non-binding.
Sustainability reporting needs accelerated implementation to get in alignment with financial
reporting. Although widely acknowledged standards such as GRI Guidelines do exist, its
application in practice still lacks consistency. A better data base would provide more
meaningful and robust results of the analysis. As the results of this study have shown,
companies vary not just in respect of their environmental performance, but also in terms of
scope and quality of their compliance, disclosure and reporting.
The study also found that sustainability reports and disclosures need to distinguish between
the issue of materiality to an organization and the materiality to society as they are not always
the same.Unless reporting is produced in a consistent and comparable manner, it is difficult
for policy makers, investors and other stakeholders to use it to make informed decisions.
Policy makers could promote an internationally harmonized approach to the way companies
explain, calculate and define sustainability indicators.
REFRENCES
Amaratunga D. et al. Process Improvement through Performance Measurement: The
Balanced Scorecard Methodology. Work Study 2001; 50 (5): 170-189.
Bakan J. The Corporation: The Pathological Pursuit of Profit and Power. Free Press, New
York, 2000.
Doane D. Socially Responsible Business: The Myth of CSR. Stanford Social Innovation
Review, 2005. Retrieved on November 20, 2013 from
http://www.ssireview.org/articles/entry/the_myth_of_csr
Edwards AR. The Sustainability Revolution: Portrait of a Paradigm Shift. New Society
Publishers, Canada 2009.
Elkington J. Cannibals with Forks: Triple Bottom Line of 21st Century Business, CT USA,
1998.
Epstein MJ, Roy M-J. Sustainability in Action: Identifying and Measuring the Key
Performance Drivers. Long Range Planning 2001; 34: 585–604.
Epstein MJ. Making Sustainability Work: Best Practices in managing and Measuring
Corporate Social, Environmental, and Economic Impacts. Greenleaf Publishing Limited.
Sheiffelf, United Kingdom, 2008.
Gillis T, Spring N. Doing Good is Good for Business. Communication World 2001; 18(6):
23–27.
Kaplan RS, Norton DP. The Balanced Scorecard Measures that Drive Performance. Harvard
Business Review 1992; 71-79.
IJMRR/ Feb 2014/ Volume 4/Issue 2/Article No-3/192-206 ISSN: 2249-7196
Copyright © 2012 Published by IJMRR. All rights reserved 206
McNamara C, Mong S. Performance Measurement and Management: Some Insights from
Practice. Australian Accounting Review 2005; 15: 14-28.
Neely A. et al. Performance Measurement System Design: A literature Review and Research
Agenda. International Journal of Operations & Production Management 1995; 15(4): 80-116.
Neely A. The Evolution of Performance Measurement Research: Developments in the Last
Decade and Research Agenda for the Next. International Journal of Operations & Production
Management 2005; 25(12): 1264-1277.
Paine LS. Managing for Organizational Integrity. Harvard Business Review 1994; 72(2):
106–117.
Paine LS. Value shift. New York: McGraw-Hill, 2003.
Price waterhouse Coopers. Creating value from corporate responsibility: Does your reported
data get the respect it deserves? 2011. Retrieved on November, 10, 2012 from
www.pwc.com/us/sustainability
Schaltegger S, Wagner M. Integrative Management of Sustainability Performance,
Measurement and Reporting. International Journal of Accounting, Auditing and Performance
Evaluation 2006; 3(1): 1–19.
Tebo PV. Building Business Value through Sustainable Growth. Research Technology
Management 2005; 48(5): 28–32.