Embed Size (px)
Citation preview
April 2012/ Volume 2/Issue 4/Article No-14/623-636 ISSN: 2249-7196
*Corresponding Author www.ijmrr.com 623
INTERNATIONAL JOURNAL OF MANAGEMENT RESEARCH
AND REVIEW
IMPLEMENTATION OF TOTAL PRODUCTIVE MAINTENANCE IN AN INDIAN
PAPER MANUFACTURING COMPANY:A CASE STUDY
D T K Dora*1, S C Pattnaik1, R K Padhi1, P K Talapatra1
1 Department of Chemical Engineering, GIET, Gunupur-765 022, Rayagada, Orissa, India.
ABSTRACT
Indian paper industry is constrained by increasingly higher operating costs. The situation is
further aggravated as customers demand high product quality and reduced delivery time,
inevitably calling for sound maintenance strategies. Against this backdrop, this case study
makes an in-depth investigation into the effectiveness of implementation of total productive
maintenance (TPM) in an Indian paper manufacturing facility. Implementation of TPM
resulted in augmenting the company's profit by 12% owing to a decrease in breakdown and
maintenance costs by 80 % and 20% respectively. And, on the whole, the company also
benefited in terms of overall equipment effectiveness (OEE) by about 21%.
Keywords: Indian; total productive maintenance; overall equipment effectiveness; Jishu
Hozen.
1. INTRODUCTION
1. 1. An overview of TPM
The origin of TPM can be traced back to 1951 when preventive maintenance was introduced
in Japan. The time prior to this is referred to as the “breakdown maintenance” period. The
Japanese have developed TPM to support their lean manufacturing system based on
preventive maintenance (PM), corrective maintenance (CM) and maintenance prevention
(MP) concepts and methodologies that were originated and developed in the U.S.A.
Using PM, the service life of the plant equipment can be prolonged by reconditioning the
equipment before adverse conditions lead to failure. In this concept, the operator is not
empowered to maintain minor activities; rather he only operates the equipment. To decide
that the routine maintenance of equipment should be carried out by the operators to reduce
the maintenance personnel is one of the features of TPM. The Japanese accepted the concept
of CM system in 1957 which was expanded from PM to redesign the equipment with design
weakness in order to eliminate equipment failure and improve maintainability. They also
imported MP in 1960 to incorporate the modification of the weakness of the existing
equipment in the design of the new equipment to pull off maintenance free equipment.
1.2. Effectiveness enhancement through TPM
Yamashina (1995) states that no matter how well plants are equipped with advanced
manufacturing techniques, it is always the operators, not managers or systems, who affect the
plant’s performance. Equipment effectiveness is a measure of the value added to production
April 2012/ Volume 2/Issue 4/Article No-14/623-636 ISSN: 2249-7196
Copyright © 2012 Published by IJMRR. All rights reserved 624
through equipment. The goal is to increase equipment effectiveness so each piece of
equipment can be operated to its full potential and maintained at that level. Nakajima
describes in his book that TPM maximizes equipment effectiveness through two types of
activities to insure that the equipment performs to design specifications which is the true
focus of TPM.
• Quantitative: increasing the equipment‟s total availability & improving its productivity
within a given period of operating time.
• Qualitative: reducing the number of defective products, stabilizing & improving quality.
Although the equipment must operate at its design speed, produce at the design rate, and
produce a quality product at these speeds and rates, there are factors which might obscure
efficient utilization of the equipment. Examining, identifying and eliminating all losses which
obscure the efficiency of the equipment will increase the efficiency of the equipment. The
concept of zero breakdown and zero defect are inevitable to maximize equipment
effectiveness. These equipment losses include: equipment downtime loss, performance loss,
and defect loss. Thus, OEE is a function of machine availability (reduction of downtime
loss), performance efficiency (reduction of performance loss) and quality (reduction of defect
loss).
2. LITERATURE REVIEW
Most of the Indian manufacturing facilities are falling behind the desired level of
effectiveness and efficiency as they run below the capacity owing to the customary reactive
maintenance practices leading to reduced productivity. Khana (2008) from his study reports
that a large percentage of the total cost of doing business is due to reactive maintenance-
related activities in the organization. According to the study reported by Mobley (1990), 15%
to 40% (average 28%) of total production cost is attributed to maintenance activities in the
factory. In fact, these costs are associated with maintenance labour and materials and are
likely to go even higher in the future with the addition of factory automation through the
development of new technologies. Another study conducted by Wierman (1990) in 1989
states that the estimated cost of maintenance for a selected group of companies increased
from $200 billion in 1979 to $600 billion in 1989. He also estimated that only about 22% of
US firms were using PM methods. Further, detailed research by Mobley (1990) found that
CM cost is about three times higher than the same repair made in a preventive mode.
Maintenance techniques and tools are composed of corrective, scheduled, and PM. The
importance of maintenance function has increased due to its role in keeping and improving
the availability, product quality, safety requirements, and plant cost-effectiveness levels as
maintenance costs constitute an important part of the operating budget of manufacturing
firms (Al-Najjar and Alsyouf, 2003).
In response to the maintenance and support problems encountered in manufacturing
environments, the Japanese developed and introduced the concept of TPM, initially in 1971.
According to the Nakajima (1988), the word „total‟ in TPM has three meanings.
• Total effectiveness indicates pursuit of economic efficiency and profitability of TPM;
April 2012/ Volume 2/Issue 4/Article No-14/623-636 ISSN: 2249-7196
Copyright © 2012 Published by IJMRR. All rights reserved 625
• Total maintenance system includes MP and maintainability improvement (MI) as well as
PM. Basically, this refers to “maintenance-free” design through the incorporation of
reliability, maintainability, and supportability characteristics into the equipment design;
• Total participation of all employees includes autonomous maintenance (AM) by operators
through small group activities. Essentially, maintenance is accomplished through a „team‟
effort, with the operator being held responsible for the ultimate care of his/her equipment.
TPM is an aggressive strategy that focuses on actually improving the function and design of
the production equipment (Swanson, 2001). Tsarouhas (2007) from his case study on food
industry reports that the goal of TPM is to bring competitive advantages such as increasing
the productivity; improving the quality of the products; and reducing the cost production of
the line. Another goal of TPM as stated by Schippers (2001) is to reduce and to control the
variation in a process. According to Tsang & Chan (2000), TPM holds the potential for
enhancing effectiveness of production facilities. TPM, therefore, aims at increasing the
availability/effectiveness of existing equipment in a given situation, through the effort of
minimizing input (improving and maintaining equipment at optimal level to reduce its life
cycle cost) and the investment in human resources which results in better hardware
utilization.
Ahuja and Khamba (2007) from their study on an Indian manufacturing enterprise report that
TPM implementation initiatives have shown marked improvements in the equipment
efficiency and effectiveness, and have also brought about appreciable improvements in other
manufacturing functions in the organization. Similarly, another study conducted by Chan et al
(2003) reports that implementation of TPM in a semiconductor industry increases the
productivity of the model machine by 83%.
3. CASE STUDY OF TPM IMPLEMENTATION
In this section, TPM implementation is demonstrated through a case study in a paper
manufacturing facility. Some background information of the company is listed in section 3.1.
and then the TPM implementation procedures are discussed in detail. The company started
this TPM implementation in the first quarter of 1999.
3.1. An overview of the paper manufacturing company
The company under study is a leading coated, uncoated and market pulp manufacturing plant
located in the Eastern part of the country with a production capacity of 1, 25,000 TPA. The
integrated paper and pulp plant was commissioned in the year 1962 with 15,000 TPA
installed capacity for manufacturing high quality writing and printing paper. Over the years,
the production capacity has been enhanced to the present level with the addition of four more
paper machines manufacturing diversified products ranging from 29 to 300 GSM of different
grades of paper. In 2005, an offline coating machine was also set up to manufacture premium
grades of coated paper.
Prior to implementation of TPM, maintenance in the company was based on traditional
practices and was relative, i.e., only breakdown maintenance. The practice was wasteful and
ineffective with its inherent disadvantages such as unscheduled downtime of machinery,
April 2012/ Volume 2/Issue 4/Article No-14/623-636 ISSN: 2249-7196
Copyright © 2012 Published by IJMRR. All rights reserved 626
possibility of secondary damage, no warning of failure with possible safety risks, production
losses, delays and the need for standby machinery where necessary. Implementation of TPM
was believed to enable the company’s traditional maintenance practices to change from
reactive to proactive by sharing responsibilities for machine condition, performance and
maintenance.
The company implemented TPM with the following objectives, namely maximization of
equipment effectiveness, improvement of lifespan of equipment, reduction of bottlenecks and
losses, involvement of all personnel from top to shop floor, broadening of knowledge-base
and fine-tuning of skills of the workmen and promotion of AM.
Lured by enhanced OEE of a number of manufacturing plants that introduced TPM, the top-
level management of the plant under study decided to introduce TPM in consultation with
Japan Institute of Plant Maintenance (JIPM).
3.2. Groundwork for TPM implementation
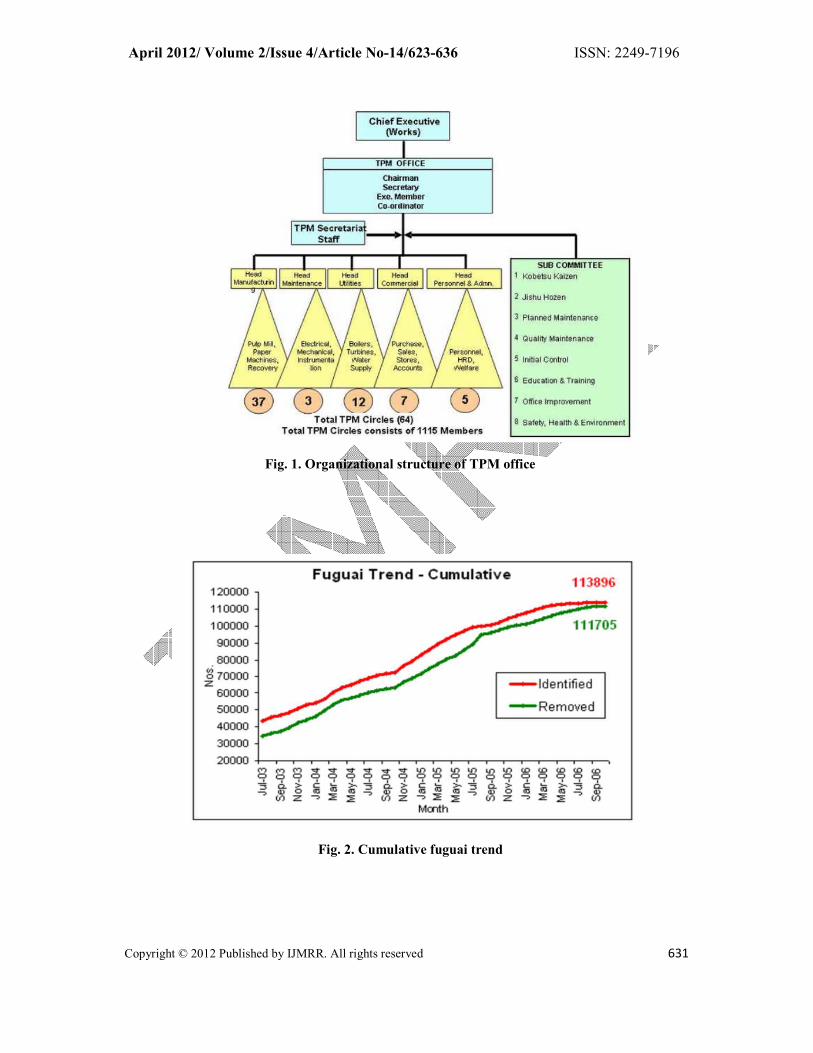
The company formed a TPM office in the run up to implementation of TPM in the plant. A
senior level manager was appointed as Chairman to head the office. The detailed organization
structure of the office consisting of 1115 members grouped into 64 TPM Circles is delineated
in Fig. 1. It forms an all-workers-participation type of office consisting of the overlapping
TPM circles. The role of the office is to co-ordinate the activities through setting a stage for
implementation of TPM culture throughout the company. The two broad functions of the
office are:
• Training & education
• Promotion
3.2.1. Training & Education
The activities under this function include development of a master plan for training personnel
from top to shop floor, conduct of internal TPM training, design of course material &
updating them at regular intervals, and reviewing progress of the training.
3.2.2. Promotion
Promotion activities include indoctrination of TPM philosophy, maintenance of a TPM-
friendly culture, continual review of the progress and modification, if any, in the light of the
review.
3.3. Execution stage of TPM
Out of the 8 pillars of TPM, only the first one, namely Jishu Hozen has been implemented in
the plant under study. The investigators made an in-depth study and collected extensive data
for a period of around 3 years from July 2003 and September 2006.
3.3.1. Steps for implementation of Jishu Hozen
• Initial cleaning and inspection;
• Elimination of sources of contaminations;
April 2012/ Volume 2/Issue 4/Article No-14/623-636 ISSN: 2249-7196
Copyright © 2012 Published by IJMRR. All rights reserved 627
• Development of tentative standard of cleaning, inspection and lubrication;
• General inspection;
The TPM office picked up a few areas like oil leakages, dirty equipment, unclamped pipe
lines, sites of unnecessary items, etc. Fig 4 describes the status of the above areas before
implementation of Jishu Hozen in the plant.
3.3.1.1. Step I activities
• Thorough cleaning of machines and identification of fuguais (abnormalities);
• Fixing tag for fuguais and indicating the type of fuguais;
• White tags for fuguais to be attended by the operators;
• Red tags for fuguais to be attended by the maintenance crew.
The seven types of fuguais leading to equipment deterioration are minor flaws, unfulfilled
basic conditions, inaccessible places, contamination sources, quality defect sources,
unnecessary items and unsafe places.
3.3.1.2. Step II activities
• Counter measures through kaizen for difficulty to inspect, clean and lubricate areas;
• Controlling the sources of dirt;
• Making cleaning & inspection easier;
• Minimizing the spread of dirt/dust.
3.3.1.2. Step III activities
• Preparing tentative standards for inspection, cleaning and lubrication;
• Following route map with check sheets for inspection, cleaning and lubrication;
• Developing visual controls for inspection, cleaning and lubrication
• Implementing visual control standards such as flow direction (arrows), pressure gauge
marking, oil level display, open close for valves, “I” marking, etc.
3.3.1.2. Step IV activities
Seven categories of general inspection for bolts & nuts, transmission system, lubrication
system, bearings, hydraulics & pneumatics, electrical system, and pumps & fan system are
done in this step.
4. RESULTS AND EVALUATION
Evaluation of TPM involves assessing if the company has achieved the objectives set before
it prior to implementation of TPM and obtained the benefits intended. The evaluation consists
of both tangible and intangible benefits. Data were collected by the investigators from the
Production Department for tangible measures as listed in section 4.1. Similarly, intangible
April 2012/ Volume 2/Issue 4/Article No-14/623-636 ISSN: 2249-7196
Copyright © 2012 Published by IJMRR. All rights reserved 628
benefits flowing from implementation of TPM were also obtained from reports of supervisors
as listed in section 4.2.
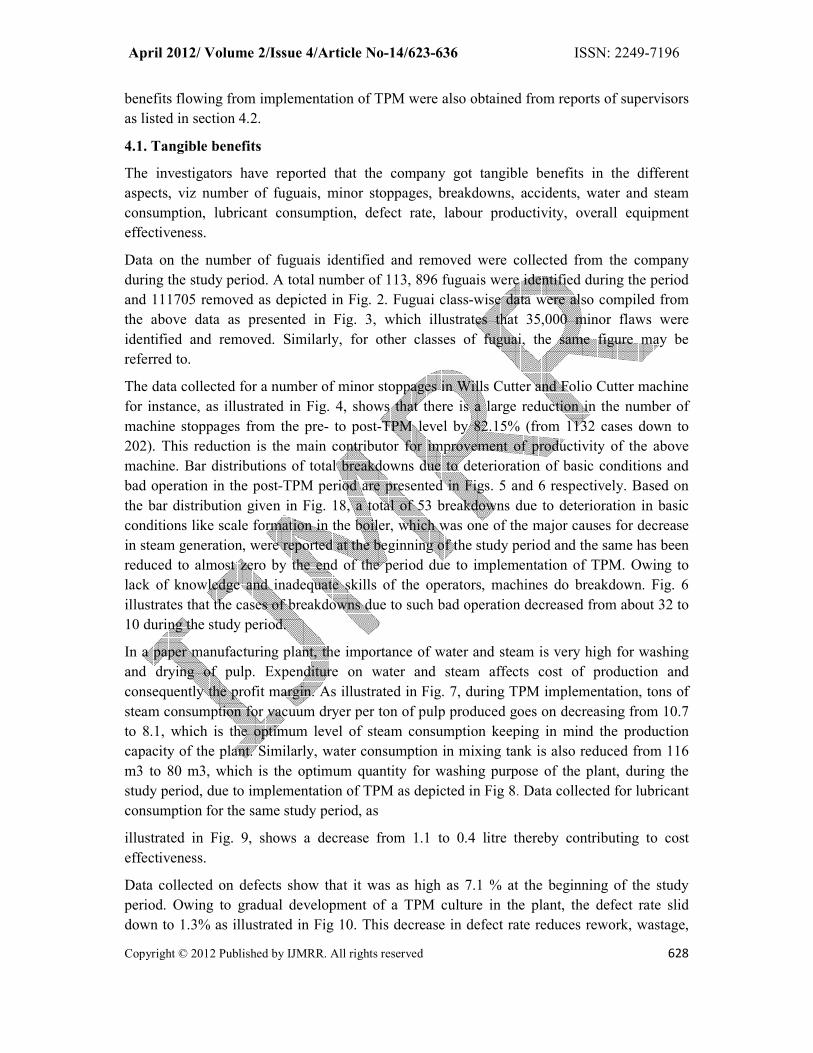
4.1. Tangible benefits
The investigators have reported that the company got tangible benefits in the different
aspects, viz number of fuguais, minor stoppages, breakdowns, accidents, water and steam
consumption, lubricant consumption, defect rate, labour productivity, overall equipment
effectiveness.
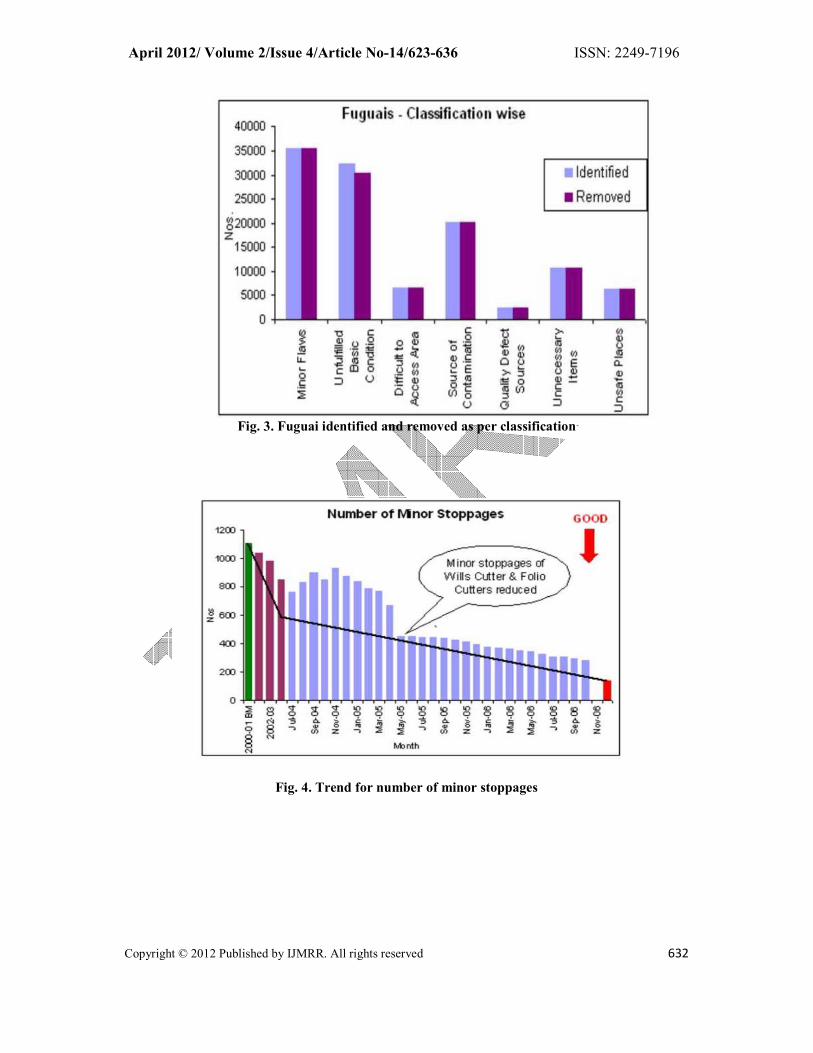
Data on the number of fuguais identified and removed were collected from the company
during the study period. A total number of 113, 896 fuguais were identified during the period
and 111705 removed as depicted in Fig. 2. Fuguai class-wise data were also compiled from
the above data as presented in Fig. 3, which illustrates that 35,000 minor flaws were
identified and removed. Similarly, for other classes of fuguai, the same figure may be
referred to.
The data collected for a number of minor stoppages in Wills Cutter and Folio Cutter machine
for instance, as illustrated in Fig. 4, shows that there is a large reduction in the number of
machine stoppages from the pre- to post-TPM level by 82.15% (from 1132 cases down to
202). This reduction is the main contributor for improvement of productivity of the above
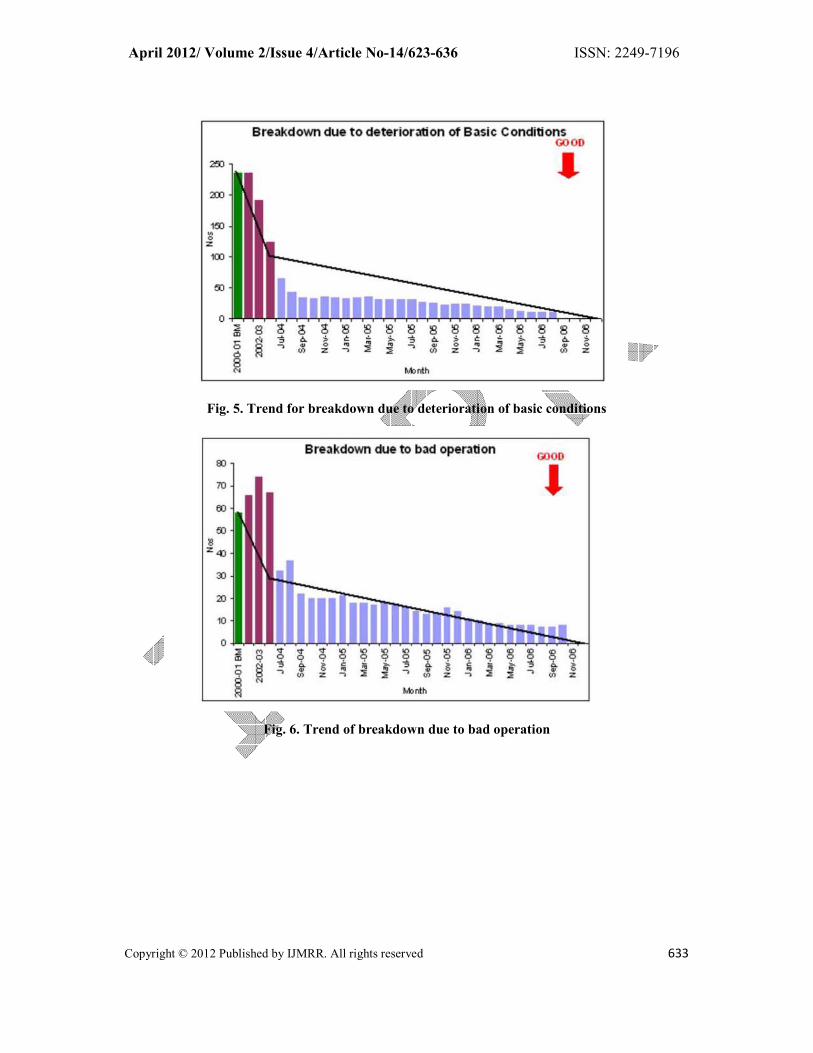
machine. Bar distributions of total breakdowns due to deterioration of basic conditions and
bad operation in the post-TPM period are presented in Figs. 5 and 6 respectively. Based on
the bar distribution given in Fig. 18, a total of 53 breakdowns due to deterioration in basic
conditions like scale formation in the boiler, which was one of the major causes for decrease
in steam generation, were reported at the beginning of the study period and the same has been
reduced to almost zero by the end of the period due to implementation of TPM. Owing to
lack of knowledge and inadequate skills of the operators, machines do breakdown. Fig. 6
illustrates that the cases of breakdowns due to such bad operation decreased from about 32 to
10 during the study period.
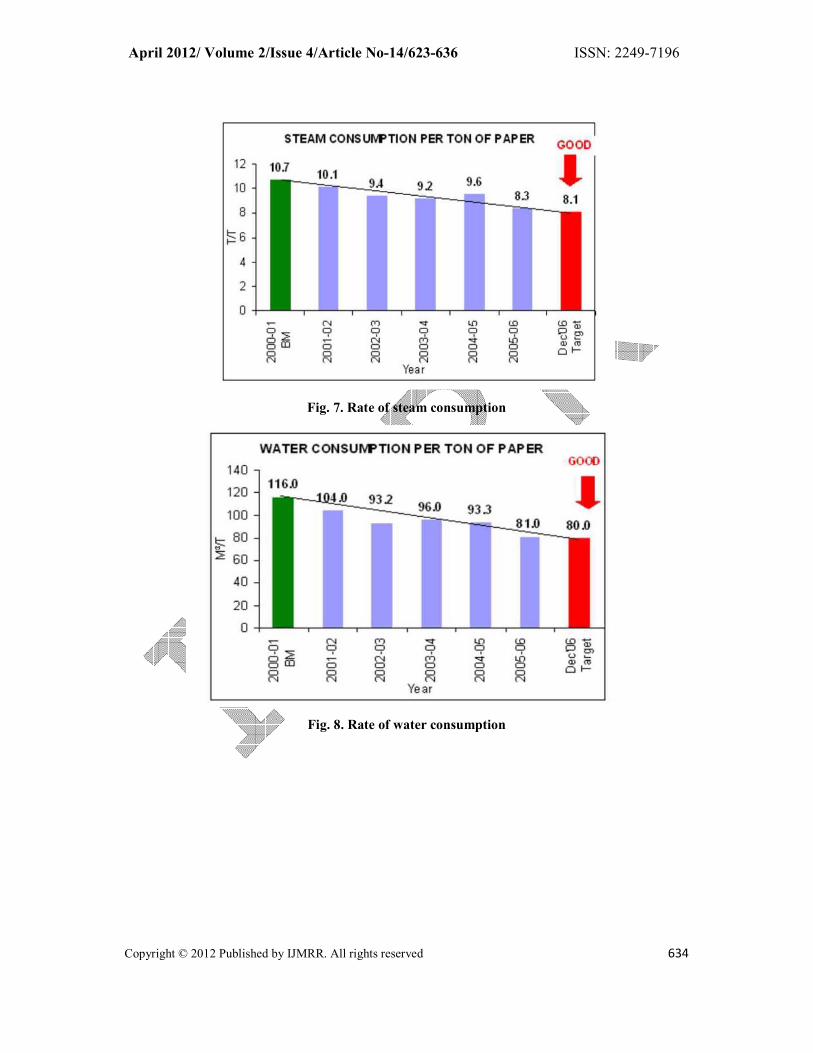
In a paper manufacturing plant, the importance of water and steam is very high for washing
and drying of pulp. Expenditure on water and steam affects cost of production and
consequently the profit margin. As illustrated in Fig. 7, during TPM implementation, tons of
steam consumption for vacuum dryer per ton of pulp produced goes on decreasing from 10.7
to 8.1, which is the optimum level of steam consumption keeping in mind the production
capacity of the plant. Similarly, water consumption in mixing tank is also reduced from 116
m3 to 80 m3, which is the optimum quantity for washing purpose of the plant, during the
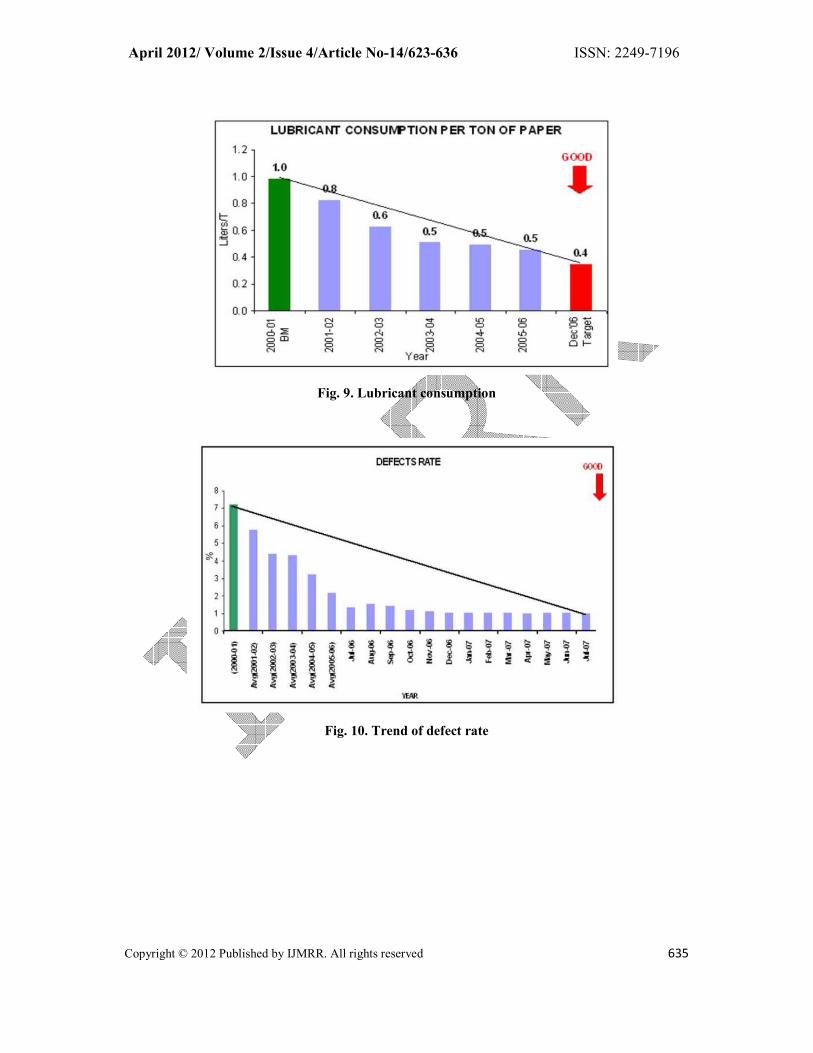
study period, due to implementation of TPM as depicted in Fig 8. Data collected for lubricant
consumption for the same study period, as
illustrated in Fig. 9, shows a decrease from 1.1 to 0.4 litre thereby contributing to cost
effectiveness.
Data collected on defects show that it was as high as 7.1 % at the beginning of the study
period. Owing to gradual development of a TPM culture in the plant, the defect rate slid
down to 1.3% as illustrated in Fig 10. This decrease in defect rate reduces rework, wastage,
April 2012/ Volume 2/Issue 4/Article No-14/623-636 ISSN: 2249-7196
Copyright © 2012 Published by IJMRR. All rights reserved 629
scrap, etc and increases quality and consumer satisfaction levels. Implementation of TPM
also benefited in such areas as reduction of accidents leading to worker safety and boosting
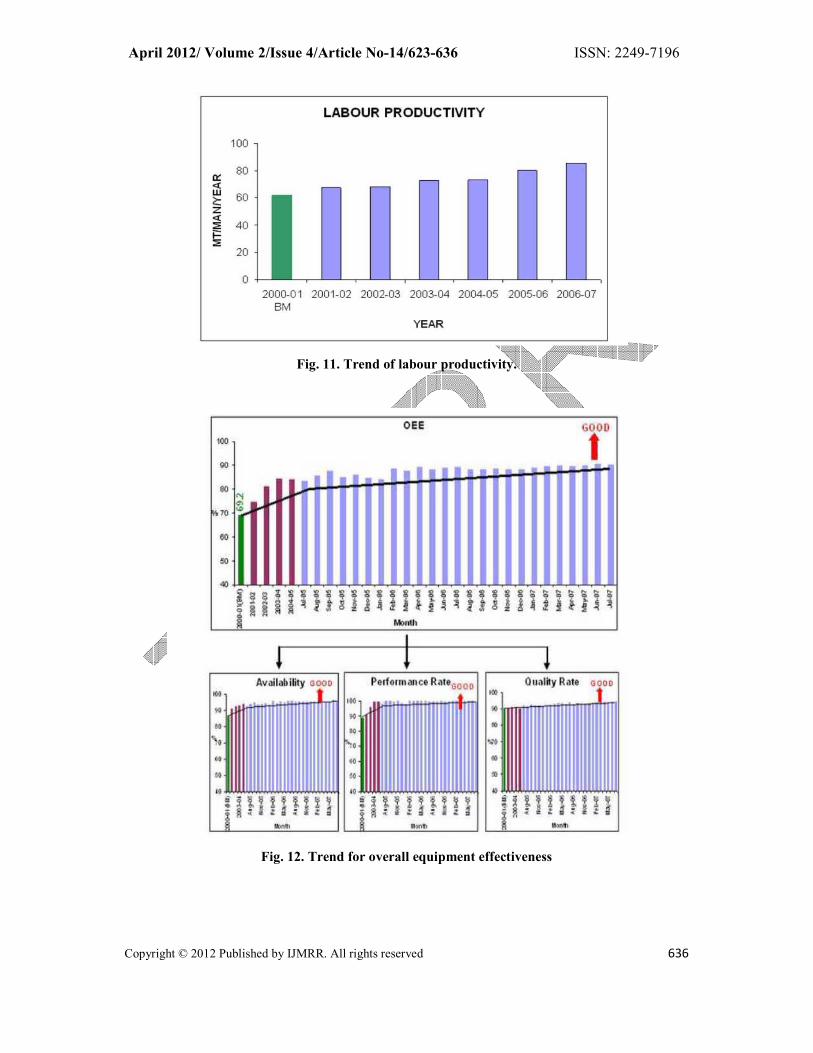
employee morale. Labour productivity cannot be considered in isolation as it is closely
related to a host of other factors such as work stoppages, breakdowns, defect rates, accidents,
etc. Over the years during the study period, the labour productivity enhanced from about 60
to 82 MT/man as shown in Fig. 11.
The goal of TPM is to increase equipment effectiveness so each piece of equipment can be
operated to its full potential and maintained at the optimum level. The most effective method
of evaluation of successful implementation of TPM is to analyze the OEE of the plant. OEE
is, in fact, a measure of the value added to production through equipment, which is a function
of machine availability, performance efficiency and the rate of quality. Fig. 12 illustrates an
increase in machine availability, performance rate and quality rate leading to an increase in
the OEE from 69.2 % to 90.2 % during the study period.
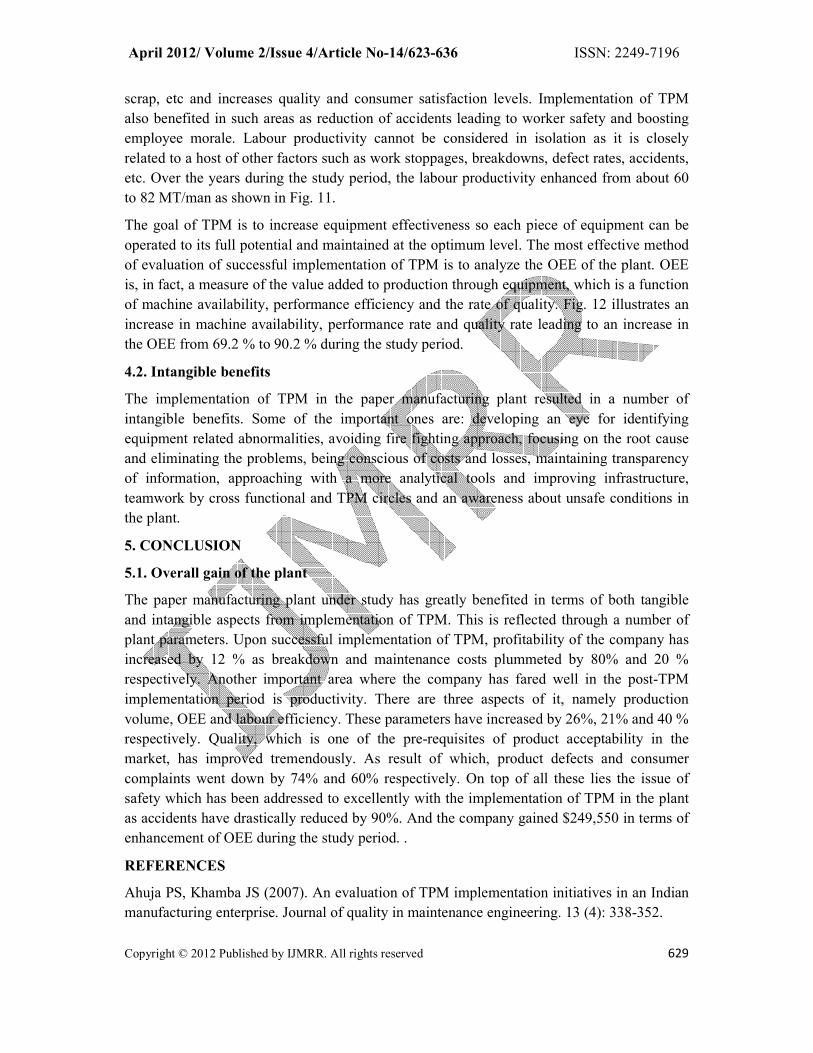
4.2. Intangible benefits
The implementation of TPM in the paper manufacturing plant resulted in a number of
intangible benefits. Some of the important ones are: developing an eye for identifying
equipment related abnormalities, avoiding fire fighting approach, focusing on the root cause
and eliminating the problems, being conscious of costs and losses, maintaining transparency
of information, approaching with a more analytical tools and improving infrastructure,
teamwork by cross functional and TPM circles and an awareness about unsafe conditions in
the plant.
5. CONCLUSION
5.1. Overall gain of the plant
The paper manufacturing plant under study has greatly benefited in terms of both tangible
and intangible aspects from implementation of TPM. This is reflected through a number of
plant parameters. Upon successful implementation of TPM, profitability of the company has
increased by 12 % as breakdown and maintenance costs plummeted by 80% and 20 %
respectively. Another important area where the company has fared well in the post-TPM
implementation period is productivity. There are three aspects of it, namely production
volume, OEE and labour efficiency. These parameters have increased by 26%, 21% and 40 %
respectively. Quality, which is one of the pre-requisites of product acceptability in the
market, has improved tremendously. As result of which, product defects and consumer
complaints went down by 74% and 60% respectively. On top of all these lies the issue of
safety which has been addressed to excellently with the implementation of TPM in the plant
as accidents have drastically reduced by 90%. And the company gained $249,550 in terms of
enhancement of OEE during the study period. .
REFERENCES
Ahuja PS, Khamba JS (2007). An evaluation of TPM implementation initiatives in an Indian
manufacturing enterprise. Journal of quality in maintenance engineering. 13 (4): 338-352.
April 2012/ Volume 2/Issue 4/Article No-14/623-636 ISSN: 2249-7196
Copyright © 2012 Published by IJMRR. All rights reserved 630
Al-Najjar B, Alsyouf I (2003). Selecting the most efficient maintenance approach using fuzzy
multiple criteria decision making. International journal of production economics. 84 (1): 85-
100.
Chan FTS, Lau HCW, Ip RWL, Chan HK, Kong S (2003). Implementation of total
productive maintenance: A case study. International journal of production economics. 95: 71-
94.
Khana VK (2008). Total productive maintenance experience-A case study. International
journal of productivity and quality management. 3 (1): 12-32.
Mobley RK (1990). An introduction to predictive maintenance. Van Nostrand Reinhold, New
York.
Nakajima S (1988). Introduction of TPM. Productivity Press, Cambridge (translated into
English from the original text published by Japan Institute for Plant Maintenance, Tokyo,
Japan, 1984).
Schippers WAJ (2001). An integrated approach to process control. International journal of
production economics. 70(3): 237-244.
Swanson L (2001). Linking maintenance strategies to performance. International journal of
production economics. 77 (3): 229-313.
Tsang, Albert HC, Chan PK (2000). TPM implementation in china. International Journal of
Quality & Reliability Management. 17 (2): 144-157.
Tsorouhas P (2007). Implementation of total productive maintenance in a food industry-A
case study. Journal of quality in maintenance engineering. 13 (1): 5-18.
Wireman, T (1990). World Class Maintenance Management. Industrial Press, New York.
Yamashina H (1995). Japanese manufacturing strategy and the role of total productive
maintenance. Journal of quality in maintenance engineering. 1 (1): 27-38.
List of figures
Fig. 1. Organizational structure of TPM office
Fig. 2. Cumulative fuguai trend
Fig. 3. Fuguai identified and removed as per classification
Fig. 4. Trend for number of minor stoppages
Fig. 5. Trend for breakdown due to deterioration of basic conditions
Fig. 6. Trend of breakdown due to bad operation
Fig. 7. Rate of steam consumption
Fig. 8. Rate of water consumption
Fig. 9. Lubricant consumption
Fig. 10. Trend of defect rate
Fig. 11. Trend of labour productivity.
Fig. 12. Trend for overall equipment effectiveness
April 2012/ Volume 2/Issue 4/Article No-14/623-636 ISSN: 2249-7196
Copyright © 2012 Published by IJMRR. All rights reserved 631
Fig. 1. Organizational structure of TPM office
Fig. 2. Cumulative fuguai trend
April 2012/ Volume 2/Issue 4/Article No-14/623-636 ISSN: 2249-7196
Copyright © 2012 Published by IJMRR. All rights reserved 632
Fig. 3. Fuguai identified and removed as per classification
Fig. 4. Trend for number of minor stoppages
April 2012/ Volume 2/Issue 4/Article No-14/623-636 ISSN: 2249-7196
Copyright © 2012 Published by IJMRR. All rights reserved 633
Fig. 5. Trend for breakdown due to deterioration of basic conditions
Fig. 6. Trend of breakdown due to bad operation
April 2012/ Volume 2/Issue 4/Article No-14/623-636 ISSN: 2249-7196
Copyright © 2012 Published by IJMRR. All rights reserved 634
Fig. 7. Rate of steam consumption
Fig. 8. Rate of water consumption
April 2012/ Volume 2/Issue 4/Article No-14/623-636 ISSN: 2249-7196
Copyright © 2012 Published by IJMRR. All rights reserved 635
Fig. 9. Lubricant consumption
Fig. 10. Trend of defect rate
April 2012/ Volume 2/Issue 4/Article No-14/623-636 ISSN: 2249-7196
Copyright © 2012 Published by IJMRR. All rights reserved 636
Fig. 11. Trend of labour productivity.
Fig. 12. Trend for overall equipment effectiveness