Embed Size (px)
Citation preview
International Journal of Multiphase Flow 85 (2016) 186–195
Contents lists available at ScienceDirect
International Journal of Multiphase Flow
journal homepage: www.elsevier.com/locate/ijmultiphaseflow
Air–water flow characteristics in high-velocity free-surface flows with
50% void fraction
Stefan Felder a , ∗, Hubert Chanson
b
a School of Civil and Environmental Engineering, Water Research Laboratory, UNSW Australia, 110 King Street, Manly Vale, NSW 2093, Australia b School of Civil Engineering, The University of Queensland, Brisbane, QLD 4072, Australia
a r t i c l e i n f o
Article history:
Received 20 December 2015
Revised 9 March 2016
Accepted 6 June 2016
Available online 23 June 2016
Keywords:
High-velocity free-surface flows
Air–water time scales
Interfacial aeration
Bubble droplet interactions
Microscopic flow properties
Characteristic frequencies
a b s t r a c t
High-velocity free-surface flows are complex two-phase flows and limited information is available about
the interactions between air and water for void fractions of about 50%. Herein a detailed experimen-
tal study was conducted in the intermediate flow region ( C ∼ 50%) on a stepped spillway and the mi-
croscopic air–water flow characteristics were investigated. The results showed differences in water and
droplet chord times with comparatively larger number of air chord times (0–2 ms), and larger number of
water chord times (2–6 ms). A monotonic decrease of particle chord modes was observed with increas-
ing bubble count rates. Several characteristic time scales were identified based upon inter-particle arrival
time analyses of characteristic chord time classes as well as spectral analyses of the instantaneous void
fraction signal. Chord times of 3–5 ms appeared to be characteristic time scales of the intermediate flow
region having similar time scales compared to the local correlation and integral turbulent time scales and
to time scales associated with bubble break-up and turbulent velocity fluctuations. A further characteris-
tic time scale of 100 ms was identified in a frequency analysis of instantaneous void fraction. This time
scale was of the same order of magnitude as free-surface auto-correlation time scales suggesting that the
air–water flow structure was affected by the free-surface fluctuations.
© 2016 Elsevier Ltd. All rights reserved.
d
a
e
fl
a
W
o
t
v
f
E
r
w
T
l
fl
1. Introduction
Gas–liquid flows are a common feature in water engineering
applications in chemical and mechanical engineering such as waste
water treatment plants, industrial mixing processes and aeration
of liquids in closed conduits ( Rao and Kobus, 1971; McKeogh and
Ervine, 1981; Thomas et al., 1981 ). In these engineering disciplines,
gas–liquid flows are often characterized by single bubbles or bub-
ble swarms surrounded by liquids in bubbly flows with average
void fractions below 30% or by single liquid droplets or droplet
swarms surrounded by gases with void fractions above 90%. Ex-
amples for bubbly flows include aeration in waste water treatment
facilities such as membrane reactors or mixing tanks, in boiling
fluids, aerated flows in pipes of various inclinations and multi-
tude of liquids ( Kobus, 1984 ). Spray flows with very high void frac-
tions occur in various applications where liquids are injected into
a gas phase using mechanical break-up of the liquid to increase the
∗ Corresponding author. Tel.: +61280719861
E-mail addresses: [email protected] (S. Felder), [email protected]
(H. Chanson).
c
t
c
1
c
v
http://dx.doi.org/10.1016/j.ijmultiphaseflow.2016.06.004
0301-9322/© 2016 Elsevier Ltd. All rights reserved.
roplet surface in misty and spray flows ( Wu et al., 1992; Crowe et
l., 1998 ). Both bubbly and spray flows are often associated with
ngineered processes in industrial applications.
A different occurrence of air–water flows are gravity driven
ows which can be found in water falls and drops, breaking waves
nd hydraulic jumps ( Hoyt ad Taylor, 1976; Hoyt and Sellin, 1989;
ood, 1991; Ervine, 1998 ) ( Fig. 1 ). A key feature of these naturally
ccurring gas–liquid flows is the existence of a range of void frac-
ions within the air–water flow column ranging from very small
oid fractions furthest away from the free-surface to very high void
ractions closest to the free-surface ( Straub and Anderson, 1958;
rvine and Falvey, 1987 ). While these types of flows occur natu-
ally, they may be observed in hydraulic structures, storm water-
ays and spillway systems of various slopes, and stilling basins.
he air entrainment is often a key feature and linked with turbu-
ence and boundary layer processes ( Ervine, 1998 ). In high-velocity
ows on spillways the air entrainment starts naturally at the in-
eption point of free-surface aeration when the outer edge of the
urbulent boundary layer reaches the free-surface, leading to a
omplex air–water flow mixture downstream (e.g. Rao and Kobus,
971; Wood, 1991; Chanson, 1997, 2013 ). The aerated flows are
haracterized by three dimensional turbulent flow processes in the
arious regions of the air–water flow column ( Fig. 1 ).

S. Felder, H. Chanson / International Journal of Multiphase Flow 85 (2016) 186–195 187
Fig. 1. High-velocity free-surface flows down a stepped spillway.

188 S. Felder, H. Chanson / International Journal of Multiphase Flow 85 (2016) 186–195
c
r
b
p
(
c
a
p
a
f
t
2
m
2
t
w
m
a
s
a
s
a
u
o
i
2
t
f
b
i
t
p
t
a
fi
a
a
3
i
r
c
s
T
e
C
v
c
c
w
p
c
t
t
s
i
s
A stepped chute is a type of spillway where a significant
amount of turbulent energy is dissipated in the lower water col-
umn (void fraction < 30%) in interactions with the solid bound-
aries including recirculation movements in the step cavities and
unsteady cavity ejection processes ( Chanson and Toombes, 2002 ).
In the upper flow region, substantial ejections of water droplets in
the spray region take place (void fraction > 70%) ( Fig. 1 ). Fig. 1 A
presents a prototype stepped spillway in operation. Fig. 1 B shows
a zoom of the upper air–water flow region. The flow processes in
both bubbly and spray regions are well researched with the occur-
rence of clearly defined air bubbles and water droplets surrounded
by water and air respectively (e.g. Matos, 1999; Ohtsu et al., 2004;
Felder and Chanson, 2011; Bung, 2011,2013 ). Similar to other bub-
bly and spray flows, phase detection intrusive probes and visual-
ization techniques proved successful in characterizing bubble and
droplet sizes within these flow regions.
Little information is however available on the air–water region
between the bubbly and spray flow regions, i.e. the so called in-
termediate flow region with void fractions between about 30% and
70%. This intermediate flow region is characterized by an air–water
mixture with a balanced ratio between air and water entities, by
collisions, deformations, coalescence and reformations of ’bubbles’
and ’droplets’ . High bubble count rates, large turbulence levels and
large integral turbulent scales were reported in this flow region in-
dicating strong turbulent and energy dissipation (e.g. Chanson and
Carosi, 2007; Felder and Chanson, 2011 ). Despite the important
role of this intermediate flow region for energy dissipation and
mixing processes, detailed information about the air–water flow
interactions are limited.
While the intermediate flow region is typically defined between
30% < C < 70%, the present investigation focused upon void frac-
tions C = 50% + / − 1% which was considered as a canonical repre-
sentation of the intermediate flow region. The void fraction is a
time-averaged measure of the gas–liquid flow and hence the in-
stantaneous representation of air–water entities within the inter-
mediate flow region is best represented by the median, i.e. C = 0.50
+ / − 0.01. Herein this contribution is a first attempt for an in
depths characterization of flows with equal quantity of air and wa-
ter. The study provides some novel insights into the characteristic
air–water time scales in a typical high-velocity flow on a stepped
chute.
2. Experiments and basic results
2.1. Experimental facility and instrumentation
Experiments were conducted in a large size spillway facil-
ity comprising two stepped configurations with plywood steps of
height h = 5 cm or h = 10 cm, respectively. The width of the facil-
ity was W = 1 m, the length L = 2.4 m and the slope was 1 V :2 H
( θ =26.6 °). Experiments were conducted with flow rates per unit
width between 0.02 < q w
< 0.21 m
2 /s corresponding to a dimen-
sionless discharge 0.69 < d c / h < 3.3 where d c is the critical flow
depth d c = ( q 2 / g ) 1/3 and to a Reynolds number defined in terms of
the hydraulic diameter of 8.1 × 10 4 < Re < 5.7 × 10 5 .
Air–water flow measurements were conducted with a dual-
tip conductivity probe with two identical probe tips of diameter
Ø= 0.25 mm separated in longitudinal direction �x = 7.2 mm and
transverse direction �z = 2.1 mm. At each vertical location, each
sensor was sampled at a rate of 20 kHz for 45 s as suggested by
Felder and Chanson (2015 ).
The post-processing of the raw Voltage data was conducted
based upon a single-threshold technique ( Cartellier and Achard,
1991 ) providing the time-averaged void fraction C , the bubble
count rate F and the air bubble and water droplet chord times
( Chanson and Toombes, 2002 ). A threshold of 50% was used be-
ause it was the most suitable threshold value for the various flow
egions ( Felder and Chanson, 2015 ). In further analyses, both air
ubble and water droplets chords were grouped into classes of
article chord sizes for which a similar behavior may be expected
Edward and Marx, 1995 ) and the inter-particle arrival times were
alculated. Further investigations were based upon the spectral
nalyses of the instantaneous void fraction signals.
The correlation analysis of the raw conductivity probe signals
rovided the local time-averaged interfacial velocity V, the auto-
nd cross-correlation integral time scale T x x and T xy respectively
ollowing the approach of Chanson and Carosi (2007) as well as the
urbulence levels Tu of the aerated flows ( Chanson and Toombes,
002 ).
Further details about the experimental facility and the instru-
entation can be found in Felder (2013) .
.2. Air–water flow patterns and properties
For a range of flow conditions (0.69 < d c /h < 3.3), flow observa-
ions and detailed measurements of the air–water flow properties
ere conducted in transition flows (0.69 < d c /h < 0.96) and skim-
ing flows (0.96 < d c /h < 3.3). The observations of flow patterns
nd flow properties were reported previously on the same stepped
pillway facility and with the same double-tip conductivity probe
s in the present study ( Felder and Chanson, 2011, 2015 ). The re-
ults comprised detailed descriptions of flow patterns in transition
nd skimming flows ( Felder and Chanson, 2015 ) as well as doc-
mentations of air–water flow properties including distributions
f void fraction, bubble count rate, interfacial velocity, turbulence
ntensity and integral turbulent scales ( Felder and Chanson, 2011,
015 ).
Past observations of the air–water flow properties highlighted
he special role of the intermediate flow region (30% < C < 70%)
or strong air–water interfacial interactions including largest bub-
le count rates, turbulence levels and auto-and cross-correlation
ntegral time scales as well as large transverse integral turbulent
ime and length scales ( Felder and Chanson, 2015) . For a central
osition within the intermediate flow region, i.e. C = 0.5 + / − 0.01,
he turbulence levels were about 100–140% and the time scales
bout 3.5–5.2 ms. The interfacial velocity exhibited a uniform pro-
le in both intermediate flow region and spray region highlighting
close link between the interfacial velocities within the strongly
erated region above the bubbly flow region.
. Characterization of air–water flows with 50% void fraction
To date, no attempt has been made to provide further insights
nto the air–water flow interactions within the intermediate flow
egion. In this section, the air–water flow interactions for the spe-
ial case of equal liquid and void fractions are presented. Table 1
ummarizes the flow conditions corresponding to C = 50% + / − 1%.
able 1 lists also a number of characteristic air–water flow param-
ters including the depth averaged void fraction in a cross-section
mean , the bubble count rate F 50 and the interfacial velocity V 50 for
oid fractions of C = 50% + / − 1% as well as the maximum bubble
ount rate in a cross-section F max .
The present data analyses focused upon the identification of
haracteristic time scales describing the air–water flow interactions
ithin the bulk of the high-velocity flows. These time scales com-
rised the air bubble and droplet chord times and the interparti-
le arrival times. Further time scales were identified using spec-
ral analyses of the instantaneous void fractions. The investiga-
ions comprised a range of flow conditions in both transition and
kimming flows in the two stepped models. Only data were taken
nto consideration at locations at least three step edges down-
tream of the inception point of air entrainment to exclude data

S. Felder, H. Chanson / International Journal of Multiphase Flow 85 (2016) 186–195 189
Ta
ble 1
Ex
pe
rim
en
tal
flo
w co
nd
itio
ns
an
d ch
ara
cte
rist
ic a
ir–
wa
ter
flo
w p
ara
me
ters fo
r th
e in
ve
stig
ati
on o
f a
ir–
wa
ter
flo
ws
wit
h v
oid fr
act
ion o
f C =
0.5
0 ( +
/ −0
.01
) o
n fl
at
ste
pp
ed sp
illw
ay
s ( θ
=2
6.6 °)
; d
ou
ble
-tip co
nd
uct
ivit
y p
rob
e
da
ta ( Ø
= 0
.25 m
m).
h [m
] d c / h [-
] q w
[m 2
/s]
Re
[-]
Flo
w re
gim
e
Ince
p.
po
int
C m
ean
[-]
Y 9
0
[mm
] S
tep e
dg
e
C [-
] F 5
0
[Hz]
V 5
0
[m/s
] y [m
m]
F ma
x [H
z]
0.1
0 .6
9
0 .0
56
2 .2 ×1
0 5
TR
A
3 to 4
0.5
58
56 .8
7
0.4
92
19
1 .7
2 .7
2
22
20
2 .8
0 .6
9
0 .0
56
2 .2 ×1
0 5
TR
A
3 to 4
0.4
15
44 .8
8
0.4
99
22
7 .8
2 .7
7
26
22
9 .0
1 .1
1
0 .1
16
4 .6 ×1
0 5
SK
6
0.3
75
69 .8
9
0.5
02
19
1 .3
3 .6
1
44
19
8 .4
1 .2
8
0 .1
43
5 .7 ×1
0 5
SK
6 to 7
0.3
74
85 .4
10
0.4
91
172 .1
3 .7
4
54
179 .9
1 .2
8
0 .1
43
5 .7 ×1
0 5
SK
6 to 7
0.3
74
85 .4
10
0.4
93
172 .2
3 .6
5
56
179 .9
0.0
5
0 .7
0
0 .0
20
8 .1 ×1
0 4
TR
A
4
0.5
80
30 .5
10
0.4
97
12
8 .2
1 .9
2
11
13
0 .8
0 .7
0
0 .0
20
8 .1 ×1
0 4
TR
A
4
0.5
21
24 .8
13
0.5
02
13
8 .2
1 .9
7
11
13
8 .2
0 .7
0
0 .0
20
8 .1 ×1
0 4
TR
A
4
0.5
07
25 .5
15
0.5
02
14
4 .6
1 .9
7
12
14
9 .0
0 .7
0
0 .0
20
8 .1 ×1
0 4
TR
A
4
0.5
27
26 .7
16
0.5
05
14
5 .7
2 .0
0
12
14
8 .2
0 .7
0
0 .0
20
8 .1 ×1
0 4
TR
A
4
0.6
44
34 .1
18
0.4
98
12
9 .0
2 .0
6
8
13
4 .3
1 .1
4
0 .0
42
1 .7 ×1
0 5
SK
6 to 7
0.3
33
33 .9
15
0.4
97
173 .3
2 .6
2
23
18
1 .9
1 .1
4
0 .0
42
1 .7 ×1
0 5
SK
6 to 7
0.3
26
31 .6
17
0.5
07
20
0 .2
2 .6
7
22
20
3 .8
1 .6
6
0 .0
75
3 .0 ×1
0 5
SK
8 to 9
0.3
11
46 .5
11
0.4
95
10
5 .6
2 .7
7
32
10
6 .7
1 .6
6
0 .0
75
3 .0 ×1
0 5
SK
8 to 9
0.2
84
44 .8
17
0.5
08
15
5 .7
3 .0
0
33
16
2 .0
1 .6
6
0 .0
75
3 .0 ×1
0 5
SK
8 to 9
0.3
19
48 .4
18
0.4
92
15
5 .3
3 .0
0
34
16
5 .3
2 .2
2
0 .1
16
4 .6 ×1
0 5
SK
12
0.2
61
56 .3
17
0.4
92
12
3 .9
3 .4
3
43
12
5 .0
2 .2
2
0 .1
16
4 .6 ×1
0 5
SK
12
0.2
94
59 .7
18
0.5
10
12
7 .3
3 .5
1
44
13
1 .9
2 .2
2
0 .1
16
4 .6 ×1
0 5
SK
12
0.2
89
56 .3
19
0.5
07
13
6 .3
3 .5
1
40
14
7 .4
i
(
f
3
a
s
a
p
a
fl
t
c
F
c
b
c
t
c
t
(
w
t
s
b
t
d
t
b
a
b
t
t
f
t
t
b
s
t
a
l
t
g
3
m
s
p
f
e
p
t
b
c
o
a
d
n
n the rapidly varied flows just downstream of the inception point
Table 1 ). Herein a variety of experimental configurations was used
or the analyses of air −water flows with 50% void fraction.
.1. Air bubble and water droplet chord times
For all flow conditions with C = 50% ( + / − 1%), the air bubble
nd water droplet chord times were calculated providing a mea-
ure of the sizes of the air and water entities at a fixed position in
flow region with average void fraction of C = 50% + / − 1%. Typical
robability distribution functions are illustrated in Fig. 2 allowing
direct comparison of sizes of air and water chords for the same
ow conditions. The PDFs of air bubble and water droplet chord
imes indicated differences in chord sizes for positions with identi-
al number of detected particles and identical void/liquid fractions.
or all data, differences between the air bubble and water droplet
hord times were observed with a larger amount of smaller air
ubble chord sizes between 0–1 ms. The numbers of water droplet
hord sizes were proportionally slightly larger for chord times be-
ween about 2–6 ms ( Fig. 2 ).
Significant differences were also observed depending upon the
haracteristic bubble count rate F 50 and step height h . The chord
ime distributions were regrouped into four different patterns
Fig. 2 ). For the stepped spillway with h = 0.05 m, three groups
ith similar bubble count rates were best suited ( Fig. 2 A–C) and
he data for the steps with h = 0.10 m are illustrated in Fig. 2 D for
imilar bubble count rates.
The finding of different probability functions for different bub-
le count rates ( Fig. 2 ) suggested some link between the charac-
eristic bubble count rate F 50 and the mode of the chord time PDF
istributions tch mode . For all data, the relationship between F 50 and
ch mode is illustrated in Fig. 3 for both step heights and for the air
ubble and water droplet chord times. The observations indicated
monotonic decrease in the chord time mode with increasing bub-
le count rate ( Fig. 3 ). Despite large data scatter, the present data
rend was correlated by a power law:
c h mod e = 30 . 8 × F −0 . 916 50 (1)
Note that the number of data was limited and the inclusion of
urther data sets with 50% void fraction might provide more de-
ails about the relationship. The present results were comparable
o limited observations by Toombes and Chanson (2008) at a single
ackward-facing step ( Fig. 3 ). Toombes and Chanson (2007) used
urface wave modeling to show the effects of surface waves upon
he air bubble chord sizes. The differences between air bubble
nd water droplet chord times in the present study might also be
inked with periodic variation of the pseudo-free-surface affecting
he distribution of air–water interfaces in the intermediate flow re-
ion.
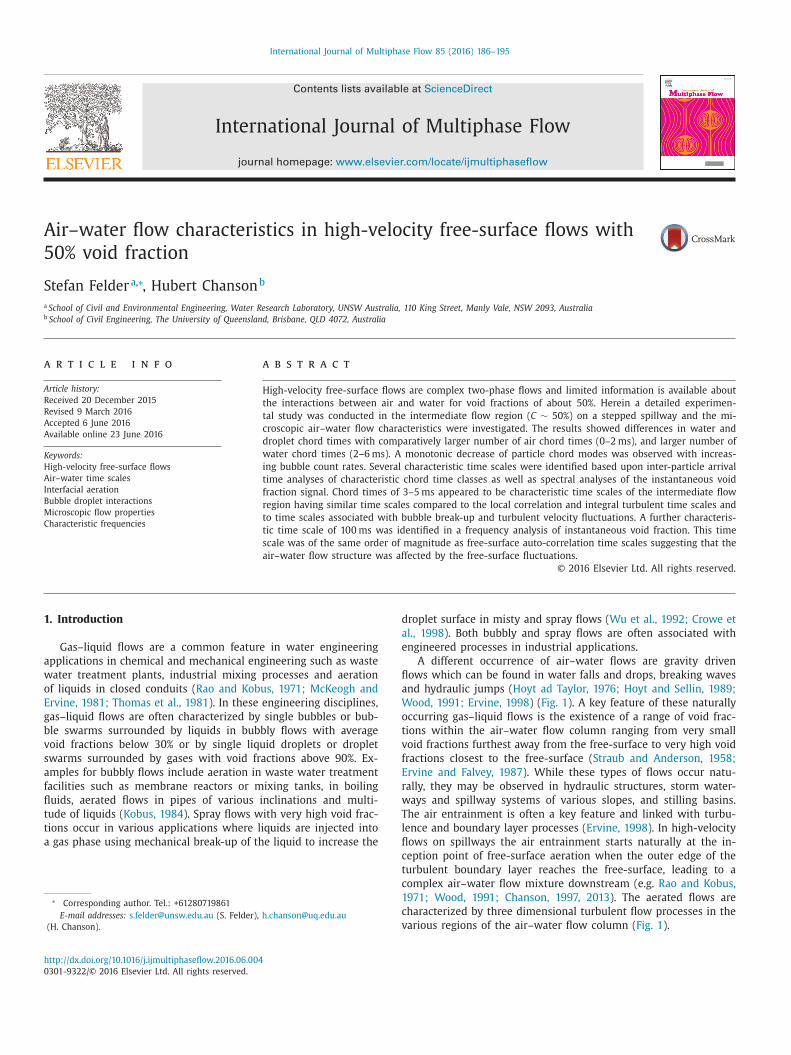
.2. Inter-particle arrival times
For a dispersed phase, the analysis of inter-particle arrival times
ay provide some information on the randomness of the air–water
tructure and on preferential clustering for particular classes of
article sizes. Herein the inter-particle arrival times were analyzed
or all measurement positions with C = 50% ( + / − 1%) for five differ-
nt chord time classes. Typical results are illustrated in Fig. 4 com-
rising both air bubble and water droplet PDFs. Little differences in
he PDFs of the inter-particle arrival times were observed between
ubble and droplet chord time distributions for all data and most
hord time classes. For all present data, differences were however
bserved for the chord time classes 3–5 ms ( Fig. 4 D) which showed
larger number of smaller inter-particle arrival times for the water
roplet chord times. The differences were associated with different
umbers of air and water entities within this chord time class and

190 S. Felder, H. Chanson / International Journal of Multiphase Flow 85 (2016) 186–195
Fig. 2. Probability distribution functions of air bubble and water droplet chord times for void fractions of C = 0.5 ( + / − 0.01) in transition and skimming flows.
r
o
I
c
t
(
k
t
a
3
w
o
for all experiments, the number of bubble chords was about 40–
60% of the number of droplet chords ( Fig. 4 D). For all other chord
time classes, the numbers of bubbles and droplets were about the
same.
These findings were observed for all data in transition and
skimming flows and independent of the step heights. The shapes
of the inter-particle arrival time distributions were affected by the
number of particles in a chord time class. A larger number of par-
ticles resulted in a proportionally larger number of smaller inter-
particle arrival times.
The reason for these differences for the chord time class 3–5 ms
remains unknown. It is in agreement with the observations of
a comparatively larger number of droplets with chord times of
2–6 ms ( Fig. 2 ). The observations of the interparticle arrival time
distributions for similar chord times were consistent with these
findings. It appeared that the chord times of 3–5 ms might rep-
cesent a characteristic time scale associated with the interaction
f air bubbles and water droplets in the intermediate flow region.
nterestingly the chord time scales were of similar magnitude
ompared to auto- and cross-correlation time scales and integral
urbulent time scales observed in the intermediate flow region
Chanson and Carosi, 2007; Felder and Chanson, 2015 ). It is not
nown if there is a direct connection between the large size
urbulent structures and the interparticle arrival times of bubble
nd droplet chords with chord sizes of 3–5 ms.
.3. Spectral analyses of instantaneous void fractions
The instantaneous void fraction signal represented the stream-
ise distribution of air–water interfaces at the fixed position
f the conductivity probe’s leading tip. A spectral analysis was
onducted for the instantaneous signals to identify characteristic

S. Felder, H. Chanson / International Journal of Multiphase Flow 85 (2016) 186–195 191
Fig. 3. Dimensionless relationship between mode of the chord time PDF and characteristic bubble count rate F 50 ; comparison with best-fit correlation ( Eq. (1) ) and data by
Toombes and Chanson (2008) .
f
1
o
w
i
t
e
i
n
s
t
b
i
o
p
d
s
s
f
i
s
t
f
w
s
b
t
n
d
r
t
t
s
i
m
t
f
s
g
c
a
t
o
l
t
v
a
c
Y
C
o
a
C
w
d
s
4
(
i
m
t
l
t
i
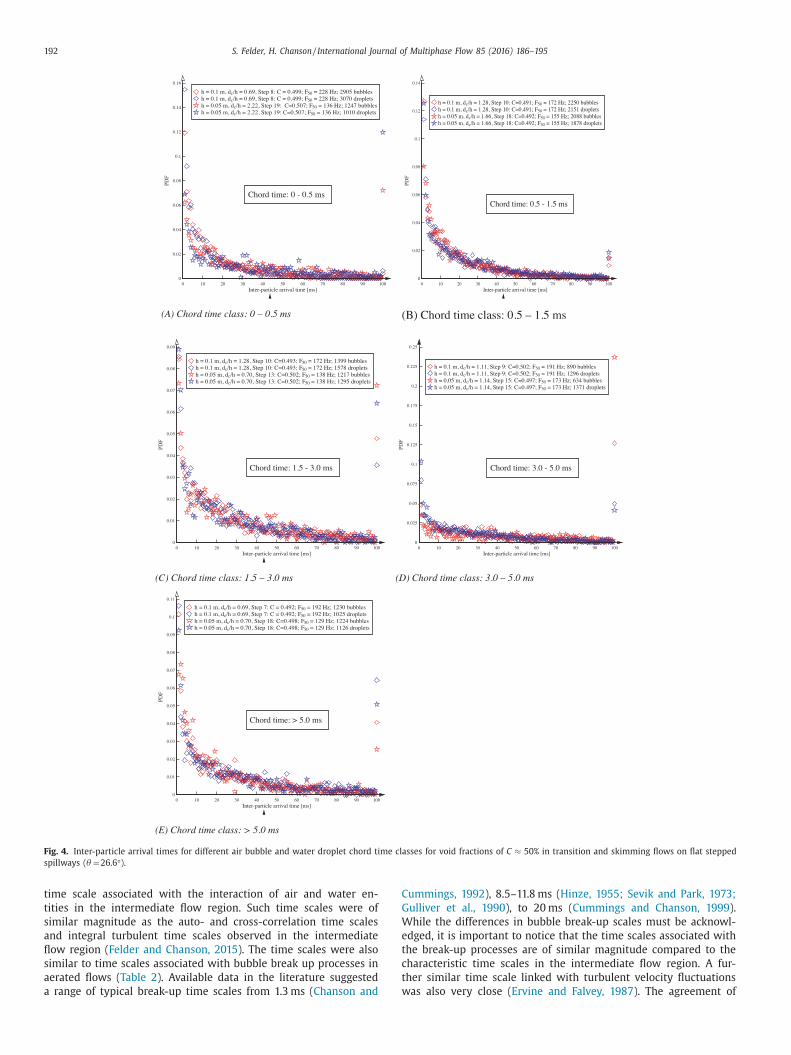
requencies associated with the air–water flows with C = 50% ( + / −%). For each data set, an FFT analysis was conducted for 13 non-
verlapping intervals of 65,536 ( = 2 16 ) points and the results
ere averaged ( Fig. 5 ). The ensemble averaging allowed an easier
dentification of the characteristic frequencies due to a strong scat-
er of data. Further sensitivity analyses were conducted using sev-
ral filter and smoothing techniques. Little effects on the character-
stic frequencies were observed and the ensemble averaging of 13
on-overlapping instantaneous void fraction components was con-
idered suitable.
Fig. 5 illustrates typical power spectrum density functions of
he instantaneous void fractions for transition and skimming flows,
oth step heights and C = 50% ( + / − 1%). In Fig. 5 , the black curves
llustrate the ensemble averaged data. All curves showed a range
f characteristic frequencies between 0.9 and 100 Hz with various
eaks within this frequency range ( Fig. 5 ). For all data sets, all
ominant characteristic frequencies and the corresponding power
pectrum density (PSD) were recorded. The present results differed
ubstantially to observations in the bubbly flow region investigated
or a similarly sloped stepped chute by Gonzalez (2005) .
The characteristic frequencies for all data sets are summarized
n Fig. 6 as a function of the corresponding PSD maxima. The ob-
ervations for all experiments showed consistent results as illus-
rated by the median curve ( Fig. 6 ). It appeared that a distinctive
requency of about 9–10 Hz was representative for air–water flows
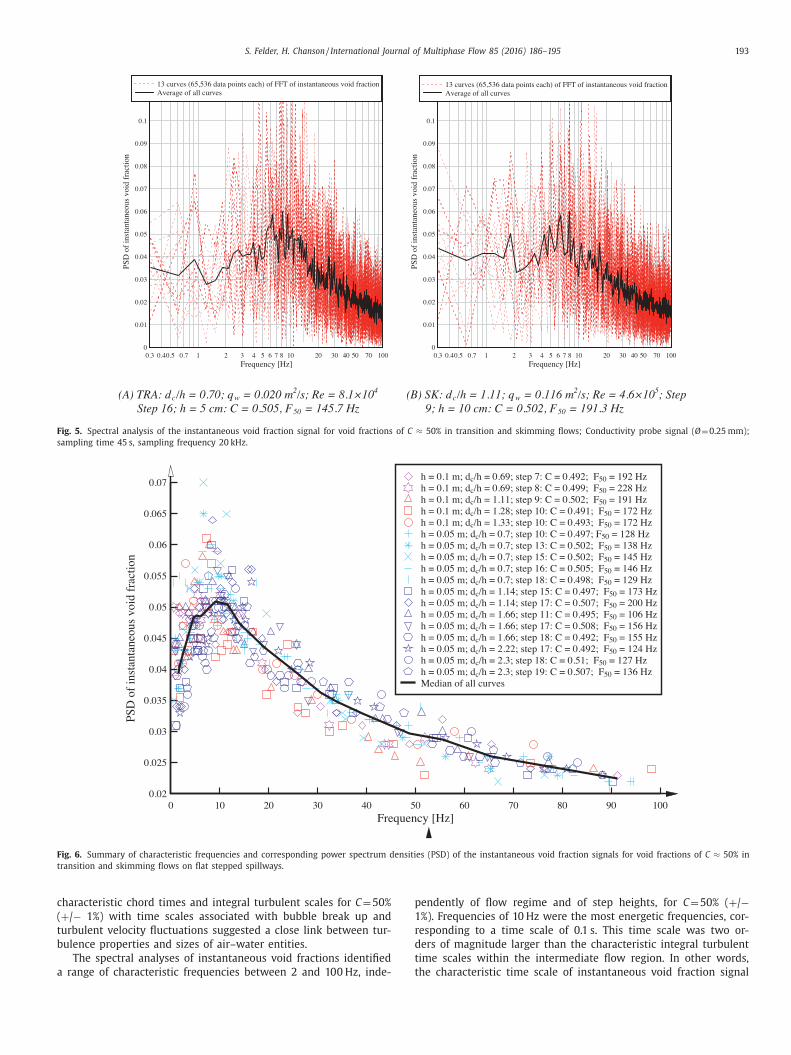
ith C = 50% ( + / − 1%). Similar characteristic frequencies were ob-
erved in probability distribution functions of the PSD values with
in sizes of 1 Hz and 3 Hz respectively ( Fig. 7 ).
The present observation was significant since the characteris-
ic frequencies observed in the PSDs identified a range of domi-
ant time scales of the air–water interactions within the interme-
iate flow region for C = 50% ( + / − 1%). The results indicated a wide
ange of characteristic frequencies within 2 to 100 Hz, with a dis-
inctive frequency of about 9–10 Hz. That is, the interactions be-
ween the air–water interfaces were most energetic with relatively
low fluctuating processes with a time scale of about 0.1 s. With
ncreasing frequency, and decreasing time scale, the PSD function
axima decreased monotonically ( Fig. 6 ) indicating a smaller con-
iribution of the fast fluctuating interactions of the air–water inter-
aces. The PSD density function for frequencies smaller about 10 Hz
howed a decrease in PSD maxima with decreasing frequency.
Overall, the air–water interactions in the intermediate flow re-
ion were mostly characterized by relatively slow fluctuating pro-
esses, rather than very fast, rapid interactions between air bubbles
nd water droplets. The most energetic time scales were compara-
ively slow.
The characteristic time scale in the intermediate flow region
f about 0.1 s was used for the calculation of the corresponding
ength scale using two different characteristic velocities, i.e. the in-
erfacial velocity V 50 and the free-surface celerity C S . The interfacial
elocity V 50 was measured with a double-tip conductivity probe
nd the characteristic values are listed in Table 1 . The free-surface
elerity was calculated based upon the characteristic flow depth
90 as a representative value of the air–water free-surface depth:
S =
√
g × Y 90 (2)
For the present data set, the resulting length scales were in the
rder of 200–350 mm calculated with the interfacial velocity V 50
nd in a range of about 50–100 mm for the free-surface celerity
S . These length scales were significantly larger than scales linked
ith the millimetric and sub-millimetric processes in the interme-
iate flow region. They were in a similar order of magnitude as the
tep heights, the cavity length and the air–water flow depths.
. Discussion
The analysis of instantaneous void fraction data with C = 50%
+ /-1%) highlighted a number of air–water time scales character-
zing the interactions between air–water interfaces. Table 2 sum-
arizes these characteristic time scales (upper half), while further
ime scales observed on the same stepped spillway models are also
isted (middle section). In the lower part of Table 2 , several other
ime scales for high-velocity air–water flows are listed for compar-
son.
The present findings identified chord times of 3–5 ms in the
ntermediate flow region which might represent a characteristic
192 S. Felder, H. Chanson / International Journal of Multiphase Flow 85 (2016) 186–195
Fig. 4. Inter-particle arrival times for different air bubble and water droplet chord time classes for void fractions of C ≈ 50% in transition and skimming flows on flat stepped
spillways ( θ =26.6 °).
C
G
W
e
t
c
t
w
time scale associated with the interaction of air and water en-
tities in the intermediate flow region. Such time scales were of
similar magnitude as the auto- and cross-correlation time scales
and integral turbulent time scales observed in the intermediate
flow region ( Felder and Chanson, 2015 ). The time scales were also
similar to time scales associated with bubble break up processes in
aerated flows ( Table 2 ). Available data in the literature suggested
a range of typical break-up time scales from 1.3 ms ( Chanson and
ummings, 1992 ), 8.5–11.8 ms ( Hinze, 1955; Sevik and Park, 1973;
ulliver et al., 1990 ), to 20 ms ( Cummings and Chanson, 1999 ).
hile the differences in bubble break-up scales must be acknowl-
dged, it is important to notice that the time scales associated with
he break-up processes are of similar magnitude compared to the
haracteristic time scales in the intermediate flow region. A fur-
her similar time scale linked with turbulent velocity fluctuations
as also very close ( Ervine and Falvey, 1987 ). The agreement of
S. Felder, H. Chanson / International Journal of Multiphase Flow 85 (2016) 186–195 193
Fig. 5. Spectral analysis of the instantaneous void fraction signal for void fractions of C ≈ 50% in transition and skimming flows; Conductivity probe signal ( Ø= 0.25 mm);
sampling time 45 s, sampling frequency 20 kHz.
Fig. 6. Summary of characteristic frequencies and corresponding power spectrum densities (PSD) of the instantaneous void fraction signals for void fractions of C ≈ 50% in
transition and skimming flows on flat stepped spillways.
c
(
t
b
a
p
1
r
d
t
t
haracteristic chord times and integral turbulent scales for C = 50%
+ / − 1%) with time scales associated with bubble break up and
urbulent velocity fluctuations suggested a close link between tur-
ulence properties and sizes of air–water entities.
The spectral analyses of instantaneous void fractions identified
range of characteristic frequencies between 2 and 100 Hz, inde-
endently of flow regime and of step heights, for C = 50% ( + / −%). Frequencies of 10 Hz were the most energetic frequencies, cor-
esponding to a time scale of 0.1 s. This time scale was two or-
ers of magnitude larger than the characteristic integral turbulent
ime scales within the intermediate flow region. In other words,
he characteristic time scale of instantaneous void fraction signal

194 S. Felder, H. Chanson / International Journal of Multiphase Flow 85 (2016) 186–195
(A) Bin size of frequency: 1 Hz (B) Bin size of frequency: 3 HzFig. 7. PDF of characteristic frequencies of the instantaneous void fraction signals for void fractions of C ≈ 50% in transition and skimming flows.
Table 2
Summary of characteristic time scales in the intermediate flow region ( C = 0.50 ( + / − 0.01)). Air–water flow measurements on flat stepped spillways with θ =26.6 °.
Time scale [ms] Comment Section/reference
3–5 Differences in inter-particle arrival times for air bubble and water droplets ( C = 0.50
( + / − 0.01))
Section 3.2
100 Time scale based upon FFT analysis of instantaneous void fraction ( C = 0.50 ( + / − 0.01)) Section 3.3
3.5–5.2 Maximum auto- and cross-correlation time scales in a cross-section for a double-tip
conductivity probes (0.3 < C < 0.7)
Felder (2013), Felder and Chanson (2015)
3–4 Maximum integral turbulent time and length scales in a cross-section for an array of
two single-tip conductivity probes for (0.3 < C < 0.7)
Felder (2013), Felder and Chanson (2015)
50–200 Free-surface auto-correlation time scales in the air–water flow region ( C > 0.7) Felder (2013), Felder and Chanson (2014)
10 0 0–50 0 0 Time scales based upon visual observations of characteristic cavity ejection frequencies
( C < 0.3)
Guenther et al. (2013)
8.5–11.8 Bubble break-up time scales Hinze (1955), Sevik and Park (1973), Gulliver et al. (1990)
1.3 Bubble break-up time scales Chanson and Cummings (1992)
3.6 Time scales linked with turbulent velocity fluctuations Ervine and Falvey (1987)
20 Bubble break-up time scale in vertical supported jets Cummings and Chanson (1999)
a
f
n
s
d
a
t
3
t
i
t
b
u
a
n
a
S
s
f
fi
e
i
s
was possibly linked to large scale free-surface fluctuations rather
than to the air −water interactions on a sub-millimetric level. Free-
surface measurements with acoustic displacement meters in the
aerated flow region identified free-surface auto-correlation time
scales of a similar order of magnitude of about 0.05–0.2 s ( Bung,
2013; Felder and Chanson, 2014 ). It is believed that this agree-
ment confirmed some coupling between vertical free-surface mo-
tion and air–water flow properties, as reported previously ( Killen,
1968; Wilhelms and Gulliver, 2005; Toombes and Chanson, 2007,
2008 ).
In contrast, cavity ejection frequencies were investigated on a
stepped spillway with θ =26.6 ° ( Guenther et al., 2013 ). The charac-
teristic cavity ejection frequencies were about 0.2–1 Hz. They dif-
fered from the characteristic frequencies in the intermediate flow
region, indicating that the cavity ejection processes did not impact
upon the air–water flow structure in the intermediate flow region.
5. Conclusion
Air–water flow experiments were conducted in high-velocity
free-surface flows on a stepped spillway, with a focus on the de-
tailed air–water interactions in the flow region with same amount
of air and water phases: i.e., C = 50% ( + / − 1%). The data comprised
range of flow conditions in both transition and skimming flows
or two step heights. Several processing techniques of the instanta-
eous void fraction signal provided estimates of characteristic time
cales. The comparison of air bubble and water droplet chord time
istributions showed a larger number of smaller air chord times
nd a larger number of water chords with times of 2–6 ms. An in-
erparticle arrival time analysis identified particle chord times of
–5 ms as a representative characteristic time scale associated with
he interaction between air–water and water–air interfaces in the
ntermediate flow region. Such time scales were of similar magni-
ude to the auto- and cross-correlation time scales, to integral tur-
ulent time scales and to time scales associated with bubble break
p and turbulent velocity fluctuations. A distinctive frequency of
bout 10 Hz was identified using spectral analyses of the instanta-
eous void fraction signals. The corresponding time scale of 0.1 s
ppeared to be linked with large scale free-surface fluctuations.
uch a magnitude was similar to free-surface auto-correlation time
cales indicating that the air–water flow structure might be af-
ected by free-surface waves. While the present results provided
rst in-depth insights into the characteristics of flows with equal
ntities of air and water, the air–water flow processes within the
ntermediate flow region remain poorly understood and further re-
earch is needed.

S. Felder, H. Chanson / International Journal of Multiphase Flow 85 (2016) 186–195 195
A
D
R
B
B
C
C
C
C
C
C
C
C
E
E
E
F
F
F
F
G
G
G
H
H
H
K
K
M
M
O
R
S
S
T
T
T
W
W
W
cknowledgments
The financial support of the Australian Research Council (Grants
P0818922 and DP120100481 ) is acknowledged.
eferences
ung, D.B., 2011. Developing flow in skimming flow regime on embankment stepped
spillways. J. Hydraul. Res. IAHR 4 9 (5), 639–64 8. doi: 10.1080/00221686.2011.584372 .
ung, D.B., 2013. Non-intrusive detection of air–water surface roughness in self-aerated chute flows. J. Hydraul. Res. IAHR 51 (3), 322–329. doi: 10.1080/
00221686.2013.777373 .
artellier, A. , Achard, J.L. , 1991. Local phase detection probes in fluid/fluid two-phaseflows. Rev. Sci. Instrum. 62, 279–303 .
hanson, H. , 1997. Air Bubble Entrainment in Free-Surface Turbulent Shear Flows.Academic Press, London, UK, p. 401 .
hanson, H., 2013. Hydraulics of aerated flows: Qui Pro Quo? J. Hydraul. Res. IAHR51 (3), 223–243. doi: 10.1080/00221686.2013.795917 , Invited Vision paper .
hanson, H., Carosi, G., 2007. Advanced post-processing and correlation analyses
in high-velocity air-water flows. Environ. Fluid Mech. 5, 495–508. doi: 10.1007/s10652- 007- 9038 .
hanson, H., and Cummings, P.D. (1992). "Aeration of the Ocean due to PlungingBreaking Waves.Research Report No. CE142, Dept. of Civil Engineering, Univer-
sity of Queensland, Australia, Nov., 42 pages (ISBN 0 86776 502 X). hanson, H. , Toombes, L. , 2002. Air-water flows down stepped chutes: turbulence
and flow structure observations. Int. J. Multiph. Flow 27 (11), 1737–1761 .
rowe, C. , Sommerfield, M. , Tsuji, Y. , 1998. Multiphase Flows with Droplets and Par-ticles. CRC Press, Boca Raton, USA, p. 471 .
ummings, P.D. , Chanson, H. , 1999. An experimental study of individual air bubbleentrainment at a planar plunging jet. Chem. Eng. Res. Des. Trans. IChemE Part
A 77 (A2), 159–164 . dward, C.F. , Marx, K.D. , 1995. Multipoint statistical structure of the ideal spray, part
ii: evaluating steadiness using the interparticle time distribution. At. Sprays 5,
435–455 . rvine, D.A. , 1998. Air entrainment in hydraulic structures: a review. Proc. Inst. Civ.
Eng. Water Marit. Energy 130, 142–153 . rvine, D.A. , Falvey, H.T. , 1987. Behaviour of turbulent water jets in the atmosphere
and in plunge pools. Proc. Inst. Civ. Eng. Lond. Part 2 83, 295–314 . elder, S. (2013). "Air-Water Flow Properties on Stepped Spillways for Embankment
Dams: Aeration, Energy Dissipation and Turbulence on Uniform, Non-Uniform
and Pooled Stepped Chutes." Ph.D. thesis, School of Civil Engineering, The Uni-versity of Queensland, Brisbane, Australia
elder, S., Chanson, H., 2011. Air-water flow properties in step cavity down a steppedchute. Int. J. Multiph. Flow 37 (7), 732–745. doi: 10.1016/j.ijmultiphaseflow.2011.
02.009 . elder, S., Chanson, H., 2014. Air–water flows and free-surface profiles on a non-
uniform stepped chute. J. Hydraul. Res. 52, 253–263. doi: 10.1080/00221686.2013.841780 .
elder, S., Chanson, H., 2015. Phase-detection probe measurements in high-velocityfree-surface flows including a discussion of key sampling parameters. Exp.
Therm. Fluid Sci. 61, 66–78. doi: 10.1016/j.expthermflusci.2014.10.009 . onzalez, C.A. (2005). "An Experimental Study of Free-Surface Aeration on Embank-
ment Stepped Chutes", Ph.D. thesis, University of Queensland, Australia. uenther, P., Felder, S., Chanson, H., 2013. Flow aeration, cavity processes and en-
ergy dissipation on flat and pooled stepped spillways for embankments. Envi-ron. Fluid Mech. 13, 503–525. doi: 10.1007/s10652- 013- 9277- 4 .
ulliver, J.S. , Thene, J.R. , Rindels, A.J. , 1990. Indexing gas transfer in self-aerated
flows. J. Environ. Eng. ASCE 116 (3), 503–523 . inze, J. , 1955. Fundamentals of hydrodynamic mechanism of splitting in dispersion
process. AIChE J. 1 (3), 289–295 . oyt, J.W. , Sellin, R.H.J. , 1989. Hydraulic jump as ’mixing layer’. J. Hydraul. Eng. ASCE
115 (12), 1607–1614 . oyt, J.W. , Taylor, J.J. , 1976. Mechanism of air entrainment in a high speed water jet.
In: Proceedings of the IAHR/SHF Symposium. Grenoble, France, pp. 329–335 .
illen, J.M. (1968). "The Surface Characteristics of Self-Aerated Flow in Steep Chan-nels." Ph.D. thesis, University of Minnesota, Minneapolis, USA.
obus, H. , 1984. Symposium on scale effects in modelling hydraulic structures. In:Proceedings of the IAHR World Congress. Esslingen, Germany .
cKeogh, E.J. , Ervine, D.A. , 1981. Air entrainment rate and diffusion pattern ofplunging liquid jets. Chem. Eng. Sci. 36, 1161–1172 .
atos, J. (1999). "Emulsionamento de ar e Dissipação De Energia do Escoamento em
Descarregadores em Degraus." (’Air entrainment and energy dissipation in flowover stepped spillways.’) Ph.D. thesis, IST, Lisbon, Portugal (in Portuguese).
htsu, I. , Yasuda, Y. , Takahashi, M. , 2004. Flow characteristics of skimming flows instepped channels. J. Hydraul. Eng. ASCE 130 (9), 860–869 .
ao, N.S.L. , Kobus, H.E. , 1971. Characteristics of self-aerated free-surface flows. WaterWaste Water/Current Research and Practice, 10. Eric Schmidt Verlag, Berlin .
evik, M. , Park, S.H. , 1973. The splitting of drops and bubbles by turbulent fluid
flow. J. Fluids Eng. ASME 95, 53–60 . traub, L.G. , Anderson, A.G. , 1958. Experiments on self-aerated flow in open chan-
nels. J. Hydraul. Div. Proc. ASCE 84 (HY7) paper 1890, 1–35 . homas, R.M. , 1981. Bubble coalescence in turbulent flows. Int. J. Multiph. Flow 7
(6), 709–717 . oombes, L., Chanson, H., 2007. Surface waves and roughness in self-aerated
supercritical flow. Environ. Fluid Mech. 7 (3), 259–270. doi: 10.1007/
s10652- 007- 9022- y . oombes, L. , Chanson, H. , 2008. Interfacial aeration and bubble count rate distribu-
tions in a supercritical flow past a backward-facing step. Int. J. Multiph. Flow34 (5), 427–436 (doi.org/10.1016/j.ijmultiphaseflow.2008.01.005) .
ilhelms, S.C. , Gulliver, J.S. , 2005. Bubbles and waves description of self-aeratedspillway flow. J. Hydraul. Res. 43, 522–531 .
ood, I.R. , 1991. Air entrainment in free-surface flows. IAHR Hydraulic Structures
Design Manual, 4. Balkema Publ., Rotterdam . u, P.K. , Tseng, L.K. , Faeth, G.M. , 1992. Primary breakup in gas/liquid mixing layers
for turbulent liquids. At. Sprays 2, 295–317 .