Embed Size (px)
Citation preview

International Journal of Research and Development in Applied Science and Engineering (IJRDASE) ISSN: 2454-6844
Available online at: www.ijrdase.com Volume 10, Issue 1, May 2016 All Rights Reserved © 2016 IJRDASE
PSO Optimized Improved Fuzzy Logic based MPPT Algorithm for Fast and Stable Control Quality
Incorporated Photo Voltaic System Array Abstract--In recent times a huge attention has been given on development of proper planning at the global, national and regional level to handle the energy consumption on one hand and consequent emissions on the other. We have focused on MPPT based solar system performance enhancement by use of fuzzy logic controller’s designs optimized by particle swarm optimization (PSO). We have described about different latest A.I. techniques that has been hybrid with fuzzy logic for improving PV array based solar plants performance in recent time. The artificial intelligence technique applied in this work is the Particle Swarm Optimization (PSO) algorithm and is used to optimize the membership functions for maximum power point tracking rule set of the FLC. By using PSO algorithm, the optimized FLC is able to maximize energy to the system loads while also maintaining a higher stability and speed as compared to P& O based MPPT algorithm. Keywords-- Fuzzy Logic Controller, MPPT, PSO, P&O, Solar System. 1. Introduction: Despite the cascade effects of the financial crisis that have affected every sector, in varying degree and geography, the investment in renewable energy continues growing with a sustainable trend. According to the new report of the UNEP (United Nation Environment Programme) [1], the investment in renewable energy rose 5% in 2008 proving definitely the establishment of new methods of electric power generation and confirms that this sector represents now a mainstream energy investment [2]. The climate of the good health of renewable energy is the fruit of the interactions of the governmental and societal engagement towards tangible actions to mitigate climate change by reducing Green House Gases (GHG), reducing their dependency on fossil fuel supply and making energy security a strategic priority. Certainly, the current financial and economical crisis may have slowed down the demand on the fossil fuel energy and driven down prices. But, the world opinion is still convinced, that is only a temporary pause. It seems that there is a latent threat form energy crisis, and will constitute a good stimulus for the emergence of the renewable energy era. To face this threat from resources depletion, solar energy is recognized as a robust alternative to unsustainable energy
use in developed and developing countries. During the last two decades, the rhythm of the implementation of solar farm using Photovoltaic (PV) panels or Concentrated Solar Power (CSP) technologies has accelerated in the countries situated in the solar energy belt, despite their prohibitive costs. According to the International Energy Agency (IEA) solar electricity will grow up to 20e25% by 2050 [1]. The IEA has also foreseen that, by 2050, the PV and CSP systems will be able to generate 9000 TWh of electricity and reduce the yearly CO2 emissions by almost 6 billion tones [3]. Solar energy resource assessment and site suitability for large PV farms implementations is affected by different factors which can be classified in three main categories: Technical, Economical and Environmental. These factors depend on the geographical location, biophysical attributes and socio-economical infrastructure of the country under study. Notice that the dust and sand risk factors are only specific to the region and may not apply for other countries with temperate climate. The suitability of the location of a PV farm is determined based on the combination with different weights of all the factors listed above. The most insolated areas are predisposed to high suitability. Proximity to roads avoids additional cost of infrastructure construction and consequential damage to the environments. Lands that have minimal value due to past use and present conditions should be evaluated for potential PV farms deployment. PV farms are particularly suitable where the connection to the existing electric grid is effortless. The arrangement to implement PV farms in close proximity to the existing grid and loads pole reduce significantly transmission losses. Large-scale PV farms require flat terrain or fairly steep slope that is facing south with less than a 5% graded slope. The deployments of the PV at large scale were adopted in the perspective of sustainable development and mitigation of climate change, because it operates for long periods with low maintenance. PV systems were recognized as technologies that have virtually no environmental impact, because, they are clean and silent. From this standpoint, the implementation of PV farms, should respect the sensitive areas under landscape and monument protection due to esthetic requirements. Zone of influences identified as critical risk zone for PV farms such as floods and windy area, should be avoided. Also, area with abundance of dust, combined with the occurrence of fog and mist, will affect the efficiency (revenue) of PV farms. For instance, if a solar collector surface is maintained at a cleanliness level of 90%,
Abhishek Gautam Electrical & Electronics Engg. Integral University, Lucknow, (U.P.) [email protected]
Asif Jamil Ansari Electrical & Electronics Engg. Integral University, Lucknow, (U.P.) [email protected]
Akhlaque Ahmad Khan Electrical & Electronics Engg. Integral University, Lucknow, (U.P.) [email protected]

International Journal of Research and Development in Applied Science and Engineering (IJRDASE) ISSN: 2454-6844
Available online at: www.ijrdase.com Volume 10, Issue 1, May 2016 All Rights Reserved © 2016 IJRDASE
the estimated annual loss in revenue reach up to 10% [26]. Furthermore, washing with water (conventional cleaning method) may well involve prohibitive costs. 2. Related Work: This work presented by Richard L. Welch, Ganesh Kumar and Venayagamoorthy (2010), [1] the development of an optimized fuzzy logic based photovoltaic (PV) energy dispatch controller using a swarm intelligence algorithm The PV system considered is grid-independent and consists of a fuzzy logic controller (FLC), PV arrays, battery storage, and two types of loads: a constant critical load and a time-varying non-critical load. The swarm intelligence applied in this work is the particle swarm optimization (PSO) algorithm and is used to optimize both membership functions and rule set of the FLC. By using PSO algorithm, the optimized FLC is able to maximize energy to the system loads while also maintaining a higher average state of battery charge. This optimized FLC is then compared with the standard energy dispatch controller, referred to as the ‘‘PV-priority” controller. The PV-priority controller attempts to power all loads and then charge the battery resulting on lesser number of days of power to critical loads unlike the optimized FLC. Amy H.I. Lee, Hsing Hung Chen, and He-Yau Kangc, (2011), [2] according to them with natural resource scarcity and environmental protection, the use of renewable energy has become a promise for offering clean and plentiful energy. Photovoltaic (PV) solar cell is one of the emerging renewable energy applications; however, it suffers a large difficulty in high production cost with low conversion efficiency currently. Hence, an urgent pressure to upgrade technology and to formulate product strategy is evident in the solar cell power industry. In order to prosper PV silicone solar cell power industry, the work develops a conceptual model, which is composed of a fuzzy analytic network process with interpretive structural modeling and benefits, opportunities, costs and risks, to help analyze suitable strategic products. The empirical study shows that the conceptual model can effectively and precisely handle such a complicated problem and can lead to an outstanding performance result. This work presented by Yassine Charabi and Adel Gastli (2011), [3] some preliminary results from a research study conducted on solar energy resource assessment in Oman. GIS-based spatial multi-criteria evaluation approach, in terms of the FLOWA module was used to assess the land suitability for large PV farms implementation in Oman. The tool used applies fuzzy quantifiers within ArcGIS environment allowing the integration of a multi-criteria decision analysis. Land suitability analysis for large PV farms implementation was carried out for the case study of Oman. The overlay results obtained from the analysis of the resultant maps showed that 0.5% of the total land area demonstrate a high suitability level. Different PV technologies were considered for implementation. It was found that the CPV technology provides very high technical potential for implementing large solar plants. In fact, if all highly suitable land is completely exploited for CPV
implementation, it can produce almost 45.5 times the present total power demand in Oman. Gorka Landeras , José Javier López, Ozgur Kisi, and Jalal Shiri (2012), [4] according to them surface incoming solar radiation is a key variable for many agricultural, meteorological and solar energy conversion related applications. In absence of the required meteorological sensors for the detection of global solar radiation it is necessary to estimate this variable. Temperature based modeling procedures are reported in this study for estimating daily incoming solar radiation by using Gene Expression Programming (GEP) for the first time, and other artificial intelligence models such as Artificial Neural Networks (ANNs), and Adaptive Neuro-Fuzzy Inference System (ANFIS). A comparison was also made among these techniques and traditional temperature based global solar radiation estimation equations. Root mean square error (RMSE), mean absolute error (MAE) RMSE-based skill score (SSRMSE), MAE-based skill score (SSMAE) and r2 criterion of Nash and Sutcliffe criteria were used to assess the models’ performances. An ANN (a four-input multilayer perceptron with 10 neurons in the hidden layer) presented the best performance among the studied models (2.93 MJ m-
2 d-1 of RMSE). The ability of GEP approach to model global solar radiation based on daily atmospheric variables was found to be satisfactory. This work presented by S.X. Chen, H.B. Gooi, and M.Q. Wang (2013), [5] a solar radiation forecast technique based on fuzzy and neural networks, which aims to achieve a good accuracy at different weather conditions. The accuracy of forecasted solar radiation will affect the power output forecast of grid-connected photovoltaic systems which is important for power system operation and planning. The future sky conditions and temperature information is obtained from National Environment Agency (NEA) and the sky and temperature information will be classified as different fuzzy sets based on fuzzy rules. By using fuzzy logic and neural network together, the forecast results can follow the real values very well under different sky and temperature conditions. The effectiveness of the approach is validated by a case study where four different scenarios are tested. The Mean Absolute Percentage Error (MAPE) is much smaller compared with that of the other solar radiation method. 3. Methodology: 3.1 Maximum Power Point Tracking (MPPT): In recent years, because of global warming and the rise in crude oil price, countries worldwide have begun to invest heavily in research and development related to renewable energy sources. Among renewable energy generation systems, solar power generation has received the most attention; from small-scale applications (e.g., energy provision to consumer electronics) to large-scale operations (e.g., solar power plants), the scope of solar power applications is broad. However, because the energy conversion efficiency of photovoltaic (PV) generation system (PGS) is low and the cost of solar power generation is higher than that of thermal power generation or nuclear
International Journal of Research and Development in Applied Science and Engineering (IJRDASE) ISSN: 2454-6844
Available online at: www.ijrdase.com Volume 10, Issue 1, May 2016 All Rights Reserved © 2016 IJRDASE
generation, determining how to acquire maximum power from a PGS has become an essential topic. The characteristic curves of a solar cell are nonlinear and depend on the irradiance level and ambient temperature, resulting in a unique current‒voltage (I‒V) curve. Consequently, the operating point (OP) of a PGS must be adjusted to the extent in which the maximum efficiency of the solar cells can be achieved, and this technique is called maximum power point tracking (MPPT) [14]. The perturb and observe (P&O) method is the most common MPPT approach applied in commercial PGSs [15]. This method determines the system control commands according to the difference in the power output between the current system state and previous system state. Consequently, determining the perturbation step applied to a system is an essential topic. At the point when a considerable annoyance step is used by a framework, the time required for the framework to track the maximum power point (MPP) and accomplish an unfaltering state is short, yet the measure of force misfortune brought about by the bother is high. By complexity, a little annoyance step can reduce the force misfortune brought about by the bother however diminish the following rate of the framework. This marvel is for the most part known as the exchange off between following speed and following exactness [16]. By and large, MPPT strategies that apply the altered step size strategy are influenced by the exchange off. Thusly, scientists have proposed various variable step size MPPT strategies to ease this difficulty. The center idea of variable step size MPPT is that, when the OP of a framework is far off from the MPP, a considerable annoyance step is acquainted with the framework control, along these lines expanding the following rate of the framework. Then again, when the OP approximates the MPP, a little irritation step is acquainted with the framework control to enhance the adequacy of the framework in accomplishing an enduring state [17]. The variable step MPPT strategies specified in past concentrates for the most part decide the irritation venture as per the OP in the power‒voltage (P‒V) bend of sunlight based cells. In any case, the trademark bends of sun based cells can change as indicated by the working environment; in this manner, deciding a bother step size appropriate to a wide range of working condition is an essential subject with respect to variable step MPPT. Alternatively, fuzzy logic controller (FLC)-based techniques can be applied to nonlinear systems. Moreover, such techniques do not require accurate system parameters or complex mathematics models to achieve superior control performance. Therefore, FLC-based MPPT methods have become a worthy research topic [18]. 3.2 Fuzzy Logic: “In almost every case you can build the same product without fuzzy logic, but fuzzy is faster and cheaper . . .” [26]. It is seen that fuzzy logic has been considered as the superset of conventional logic or classical logic. This fuzzy logic has been used to take into account the concept of partial truth, wherein truth values lies between completely false and completely true. Fuzzy logic is discussed in detail in [24][25]. Fuzzy logic concerns the relative importance of precision. How important is it to be exactly correct when a rough answer will do? Fuzzy logic balances significance and
precision (see Fig.1), something that humans have been managing for a very long time.
Fig.1. Precision versus significance (Source Matlab,
2013) Fuzzy logic has been considered as an easy way of input –output mapping, leading to the capture of the expert knowledge. For example, a user states how good the service was at a restaurant, and fuzzy logic tells the user what the tip should be. Graphical representation of input and output mapping is depicted in Fig.2.
Fig. 2. Mapping of input and output (Source Matlab,
2013) Between the input and the output, there is a black box that maps the input to the correct output. In the black box there can be a number of systems for example fuzzy systems, linear systems, expert systems, neural networks and differential equations. The advantages of using fuzzy logic in the black box are that firstly, it is conceptually easy to understand. Also it is seen that the mathematics involved in case of fuzzy reasoning is simple. Next, it has the characteristics of flexibility inherent in its nature. Thus for any given system, it is easy for one to introduce more functionality into its nature without having to go into its details. Thirdly, fuzzy logic is very well able to handle imprecise data. Fuzzy reasoning compensates for imprecise data sets in its processes. Fourthly, it can model nonlinear functions of arbitrary complexity. Fifthly, it is to be understood that fuzzy logic is built on the knowledge and experience of the experts. This is different to ANN, which is based on the development of the input-output model, taking into the training data. Thus fuzzy logic has been built by the
International Journal of Research and Development in Applied Science and Engineering (IJRDASE) ISSN: 2454-6844
Available online at: www.ijrdase.com Volume 10, Issue 1, May 2016 All Rights Reserved © 2016 IJRDASE
people who have the total understanding of the system under consideration. Sixthly, fuzzy logic have not been seen as replacing the usual methods, rather assisting it in achieving the desired results. In the end, it is based on the concept of natural language, which is the basis for human interaction. 3.3 Particle Swarm Optimization: Particle Swarm Optimization (PSO) is an evolutionary computation technique, which is inspired by flocks of birds and shoals of fish. In PSO, a number of simple entities ( the particles) are placed in the space of some problem and each evaluates its fitness as its current location. Each particle determines its movement through the space by considering the particle which had the best fitness and the history of its own, then it moves with a velocity. At last, the swarm is liable to move near the best area. The speed and position of every molecule is balanced by the accompanying formulas:
Vid =WXVid + c1Xrand()X(Pid-Xid)+C2XRand()X(Pad-Xid) Xid =Xid + Vid
where c1 and c2 are termed the cognitive and social learning rates. These two parameters control the relative importance of the memory of the particle itself to the memory of the neighborhood. The variable rand() and Rand() are two random functions that is uniformly distributed in the range [0,1]. Xi = (Xi1, Xi2, … , XiD) represents the ith particle. Pi = (Pi1, Pi2, …, PiD) represents the best previous position of the ith particle. The symbol g represents the index of the best particle among all the particles. Vi = (Vi1, Vi2, … , ViD) represents the velocity of the ith particle. Variable is the inertia weight. The general process of PSO is as follows. Do Calculate fitness of particle Update pbest if the current fitness is better than pbest Determine nbest for each particle: choose the particle with the best fitness value of all the neighbors as the nbest For each particle Calculate particle velocity according to (1) Update particle position according to (2) While maximum iterations or minimum criteria is not attained Since the introduction of the PSO algorithm, several improvements have been suggested. In 1998, inertia weight was first proposed by Shi and Eberhart [27]. The function of inertia weight is to balance global exploration and local exploitation. In the following year, Clerc proposed the constriction factors to ensure the convergence of PSO [28]. Eberhart and Shi compared inertia weight with constriction factors and found that the constriction factors was better convergence than inertia weight [28]. 4. Result and Discussion: In this section we will demonstrate the result for FIS rule application that is optimized for achieving MPPT control. The PSO algorithm is designed to generate a fuzzy membership function for input values of error and change in error. It has been observed that at different choice of membership function range of E and Ec the output power varies and it is very typical to search the Emin ,Emax, Ecmin and Ecmax values at which designed MF can give highest output power by achieving the duty cycle at an optimum value of near about 0.8.
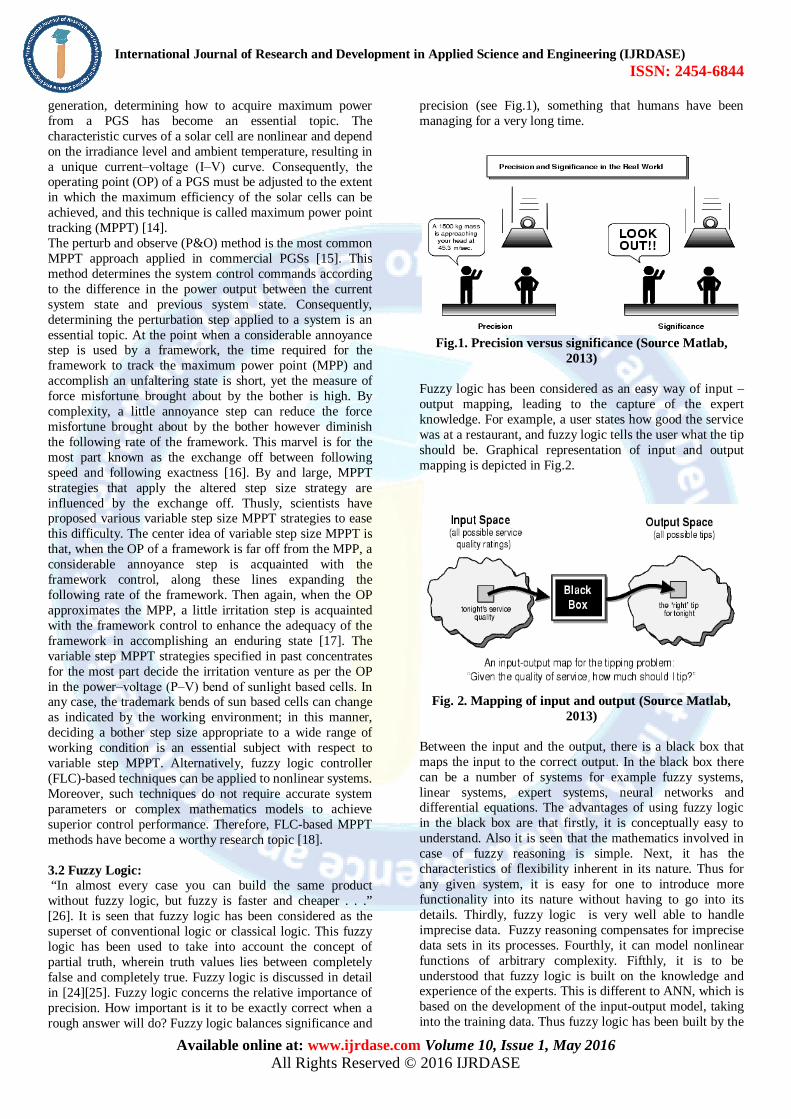
We have selected a particle swarm of size n=10 and the algorithm is run several times for maximum number of iterations value of birdstep=20. The PSO generates the n particles in terms of randomly initialize value of Emin ,Emax in between -30 to 30 and Ecmin , Ecmax in between -50 to 150. Hence each particle represent a dimension space of 4 parameter [Emin, Emax, Ecmin, Ecmax]. Hence initially a 4xn matrix of n particles is generated for in a limited range with an equal dimension size of velocity associated with each parameter. The main PSO algorithm calls the fitness function named as ‘tracslq.m’ to design the FIS structure for given particle parameters by adding fuzzy input vectors membership functions by equally partitioning the error in range Emin to Emax and change in error by Ecmin to Ecmax, after generating the MF for each particle in name of linguistic variable given as NB, NS, Z, PS and PB as shown in fig. 3.
Fig. 3. MF Function Plot for an Arbitrary PSO
Generated Particle Parameters of [Emin, Emax, Ecmin, Ecmax].
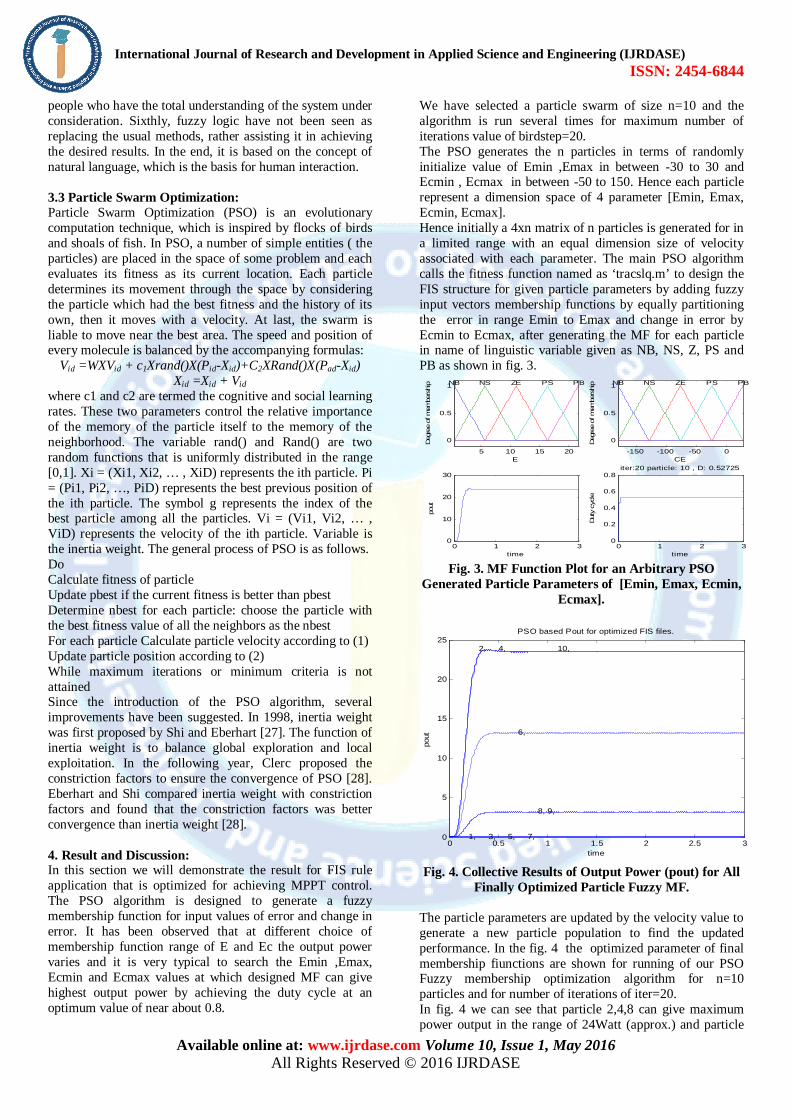
Fig. 4. Collective Results of Output Power (pout) for All
Finally Optimized Particle Fuzzy MF. The particle parameters are updated by the velocity value to generate a new particle population to find the updated performance. In the fig. 4 the optimized parameter of final membership fiunctions are shown for running of our PSO Fuzzy membership optimization algorithm for n=10 particles and for number of iterations of iter=20. In fig. 4 we can see that particle 2,4,8 can give maximum power output in the range of 24Watt (approx.) and particle
5 10 15 20
0
0.5
1
E
Deg
ree
of m
embe
rshi
p NB NS ZE PS PB
-150 -100 -50 0
0
0.5
1
CE
Deg
ree
of m
embe
rshi
p NB NS ZE PS PB
0 1 2 30
10
20
30
pout
t ime0 1 2 3
0
0.2
0.4
0.6
0.8
Duty
cyc
le
time
iter:20 particle: 10 , D: 0.52725
0 0.5 1 1.5 2 2.5 30
5
10
15
20
25
1,
pout
time
PSO based Pout for optimized FIS files.
2,
3,
4,
5,
6,
7,
8, 9,
10,
International Journal of Research and Development in Applied Science and Engineering (IJRDASE) ISSN: 2454-6844
Available online at: www.ijrdase.com Volume 10, Issue 1, May 2016 All Rights Reserved © 2016 IJRDASE
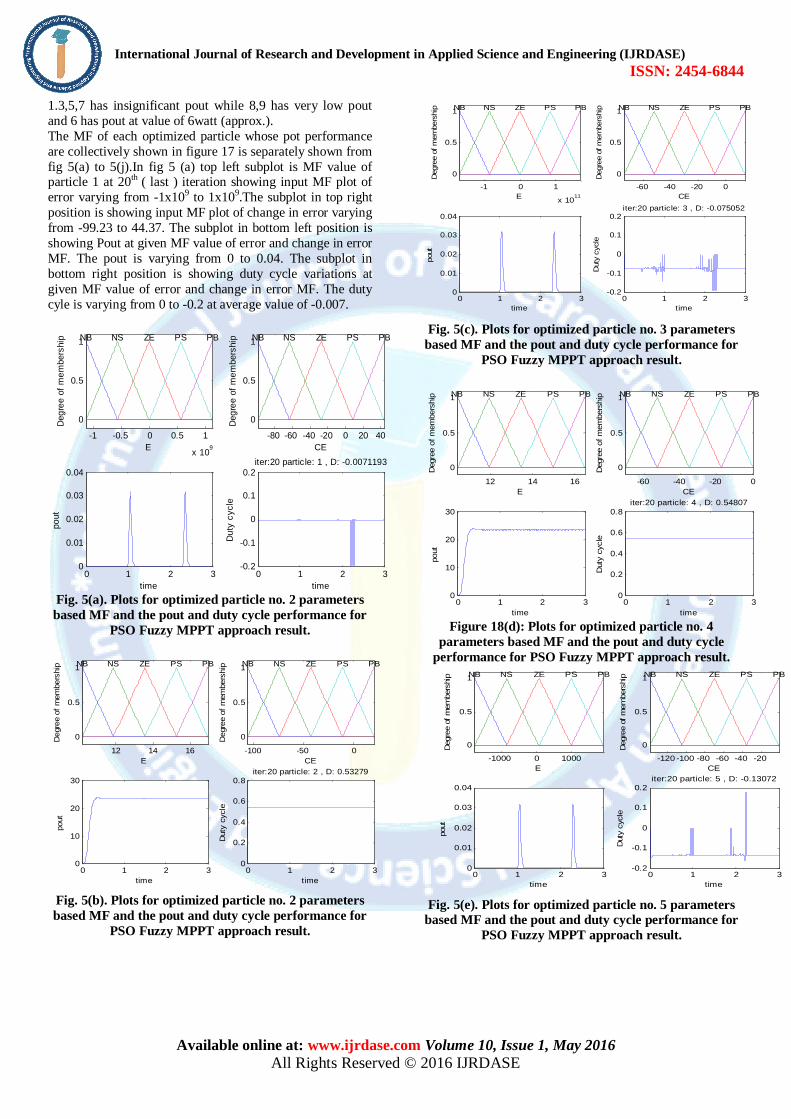
1.3,5,7 has insignificant pout while 8,9 has very low pout and 6 has pout at value of 6watt (approx.). The MF of each optimized particle whose pot performance are collectively shown in figure 17 is separately shown from fig 5(a) to 5(j).In fig 5 (a) top left subplot is MF value of particle 1 at 20th ( last ) iteration showing input MF plot of error varying from -1x10⁹ to 1x10⁹.The subplot in top right position is showing input MF plot of change in error varying from -99.23 to 44.37. The subplot in bottom left position is showing Pout at given MF value of error and change in error MF. The pout is varying from 0 to 0.04. The subplot in bottom right position is showing duty cycle variations at given MF value of error and change in error MF. The duty cyle is varying from 0 to -0.2 at average value of -0.007.
Fig. 5(a). Plots for optimized particle no. 2 parameters based MF and the pout and duty cycle performance for
PSO Fuzzy MPPT approach result.
Fig. 5(b). Plots for optimized particle no. 2 parameters based MF and the pout and duty cycle performance for
PSO Fuzzy MPPT approach result.
Fig. 5(c). Plots for optimized particle no. 3 parameters
based MF and the pout and duty cycle performance for PSO Fuzzy MPPT approach result.
Figure 18(d): Plots for optimized particle no. 4
parameters based MF and the pout and duty cycle performance for PSO Fuzzy MPPT approach result.
Fig. 5(e). Plots for optimized particle no. 5 parameters based MF and the pout and duty cycle performance for
PSO Fuzzy MPPT approach result.
-1 -0.5 0 0.5 1
x 109
0
0.5
1
E
Degr
ee o
f mem
bers
hip NB NS ZE PS PB
-80 -60 -40 -20 0 20 40
0
0.5
1
CE
Degr
ee o
f mem
bers
hip NB NS ZE PS PB
0 1 2 30
0.01
0.02
0.03
0.04
pout
time0 1 2 3
-0.2
-0.1
0
0.1
0.2
Duty
cyc
le
time
iter:20 particle: 1 , D: -0.0071193
12 14 16
0
0.5
1
E
Deg
ree
of m
embe
rshi
p NB NS ZE PS PB
-100 -50 0
0
0.5
1
CE
Deg
ree
of m
embe
rshi
p NB NS ZE PS PB
0 1 2 30
10
20
30
pout
time0 1 2 3
0
0.2
0.4
0.6
0.8
Dut
y cy
cle
t ime
iter:20 particle: 2 , D: 0.53279
-1 0 1
x 1011
0
0.5
1
E
Deg
ree
of m
embe
rshi
p NB NS ZE PS PB
-60 -40 -20 0
0
0.5
1
CE
Deg
ree
of m
embe
rshi
p NB NS ZE PS PB
0 1 2 30
0.01
0.02
0.03
0.04
pout
time0 1 2 3
-0.2
-0.1
0
0.1
0.2
Dut
y cy
cle
t ime
iter:20 particle: 3 , D: -0.075052
12 14 16
0
0.5
1
E
Deg
ree
of m
embe
rshi
p NB NS ZE PS PB
-60 -40 -20 0
0
0.5
1
CE
Deg
ree
of m
embe
rshi
p NB NS ZE PS PB
0 1 2 30
10
20
30
pout
time0 1 2 3
0
0.2
0.4
0.6
0.8
Dut
y cy
cle
time
iter:20 particle: 4 , D: 0.54807
-1000 0 1000
0
0.5
1
E
Degr
ee o
f mem
bers
hip NB NS ZE PS PB
-120 -100 -80 -60 -40 -20
0
0.5
1
CE
Degr
ee o
f mem
bers
hip NB NS ZE PS PB
0 1 2 30
0.01
0.02
0.03
0.04
pout
time0 1 2 3
-0.2
-0.1
0
0.1
0.2
Dut
y cy
cle
time
iter:20 particle: 5 , D: -0.13072
International Journal of Research and Development in Applied Science and Engineering (IJRDASE) ISSN: 2454-6844
Available online at: www.ijrdase.com Volume 10, Issue 1, May 2016 All Rights Reserved © 2016 IJRDASE
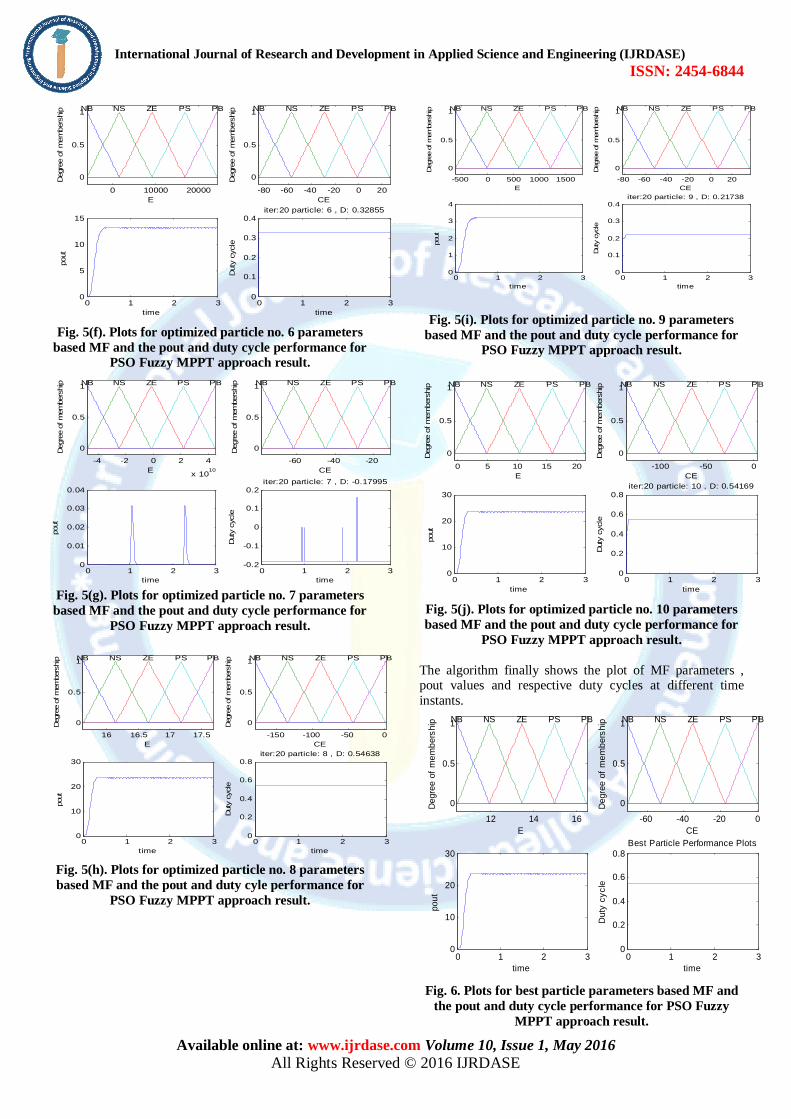
Fig. 5(f). Plots for optimized particle no. 6 parameters
based MF and the pout and duty cycle performance for PSO Fuzzy MPPT approach result.
Fig. 5(g). Plots for optimized particle no. 7 parameters based MF and the pout and duty cycle performance for
PSO Fuzzy MPPT approach result.
Fig. 5(h). Plots for optimized particle no. 8 parameters based MF and the pout and duty cyle performance for
PSO Fuzzy MPPT approach result.
Fig. 5(i). Plots for optimized particle no. 9 parameters based MF and the pout and duty cycle performance for
PSO Fuzzy MPPT approach result.
Fig. 5(j). Plots for optimized particle no. 10 parameters based MF and the pout and duty cycle performance for
PSO Fuzzy MPPT approach result. The algorithm finally shows the plot of MF parameters , pout values and respective duty cycles at different time instants.
Fig. 6. Plots for best particle parameters based MF and
the pout and duty cycle performance for PSO Fuzzy MPPT approach result.
0 10000 20000
0
0.5
1
E
Deg
ree
of m
embe
rshi
p NB NS ZE PS PB
-80 -60 -40 -20 0 20
0
0.5
1
CE
Deg
ree
of m
embe
rshi
p NB NS ZE PS PB
0 1 2 30
5
10
15
pout
time0 1 2 3
0
0.1
0.2
0.3
0.4
Dut
y cy
cle
time
iter:20 particle: 6 , D: 0.32855
-4 -2 0 2 4
x 1010
0
0.5
1
E
Deg
ree
of m
embe
rshi
p NB NS ZE PS PB
-60 -40 -20
0
0.5
1
CE
Deg
ree
of m
embe
rshi
p NB NS ZE PS PB
0 1 2 30
0.01
0.02
0.03
0.04
pout
time0 1 2 3
-0.2
-0.1
0
0.1
0.2
Duty
cyc
le
time
iter:20 particle: 7 , D: -0.17995
16 16.5 17 17.5
0
0.5
1
E
Deg
ree
of m
embe
rshi
p NB NS ZE PS PB
-150 -100 -50 0
0
0.5
1
CE
Deg
ree
of m
embe
rshi
p NB NS ZE PS PB
0 1 2 30
10
20
30
pout
time0 1 2 3
0
0.2
0.4
0.6
0.8
Dut
y cy
cle
time
iter:20 particle: 8 , D: 0.54638
-500 0 500 1000 1500
0
0.5
1
E
Deg
ree
of m
embe
rshi
p NB NS ZE PS PB
-80 -60 -40 -20 0 20
0
0.5
1
CE
Deg
ree
of m
embe
rshi
p NB NS ZE PS PB
0 1 2 30
1
2
3
4
pout
time0 1 2 3
0
0.1
0.2
0.3
0.4
Duty
cyc
le
time
iter:20 particle: 9 , D: 0.21738
0 5 10 15 20
0
0.5
1
E
Deg
ree
of m
embe
rshi
p NB NS ZE PS PB
-100 -50 0
0
0.5
1
CE
Deg
ree
of m
embe
rshi
p NB NS ZE PS PB
0 1 2 30
10
20
30
pout
time0 1 2 3
0
0.2
0.4
0.6
0.8
Dut
y cy
cle
time
iter:20 particle: 10 , D: 0.54169
12 14 16
0
0.5
1
E
Degr
ee o
f mem
bers
hip NB NS ZE PS PB
-60 -40 -20 0
0
0.5
1
CE
Degr
ee o
f mem
bers
hip NB NS ZE PS PB
0 1 2 30
10
20
30
pout
time0 1 2 3
0
0.2
0.4
0.6
0.8
Dut
y cy
cle
time
Best Particle Performance Plots

International Journal of Research and Development in Applied Science and Engineering (IJRDASE) ISSN: 2454-6844
Available online at: www.ijrdase.com Volume 10, Issue 1, May 2016 All Rights Reserved © 2016 IJRDASE
Fig. 7. Comparative plot for output power and duty cycle
range obtained for P& MPPT, Fuzzy MPPT and PSO optimized fuzzy MPPT.
Figure 7 demonstrates the plot of all the power output of different MPPT approach for the solar cell array. all the simulink models are run for three sec. one by one and there output power along with the duty cycle values are transferred at Matlab workspace to generate the multivariable plots. The blue line is the pout (top) of P& O based MPPT model having maximum power of 20 watt approx. reaches it peak at time 0.4 seconds approx. But the pout fluctuates multiple time and takes long time to stabilize even at small dip in the duty cycle as we see the duty cycle in bottom figure (blue line).The P& O MPPT has duty cycle of 0.8 at most of the time there are two small value dips in duty cycle but it creates large amount of oscillations that stays for long time in Pout. The red line is the plot for fuzzy based controller the pout has maximum value of 18Watt that is less than the pout line of P & O based MPPT and it is too much rippling duty to frequent amendment and fluctuations in fuzzy rules. We can observe that the duty cycle in bottom plot(red line) never crossed the duty cycle above than 0.5 however fuzzy rules are made to acces max. duty cycle of 0.8.It makes the reduction in Vout value and Ton time thus the average current also reduces thus the Pout is reduced considerable. The third plot is for PSO optimized input MF of fuzzy controller input for the finally selected best particle having highest average duty cycle (see fig. 6).The Pout (top subplot,black line) has Pout pf 25 Watt higher than the both fuzzy controller(red ) and P& O MPPT hence the best particle MF values gives highest out power for solar array. The oscillations in this case are nil hence the Pout performance are ripple free hence shows reduction in harmonics it has bben also observed that there is no peak overshoot in PSO optimized fuzzy MF output power plot. The last advantage that can be observed in the pout plot is that the fastest performance (i.e least rise time ) is in the Pout of PSO optimized fuzzy MPPT and the duty cycle in this case is also not goes above than 0.5 to 0.6 range but still the obtained power output is better than P&O based MPPT approach.
5. Conclusion: The PSO optimized fuzzy logic controller based results are compared with the conventional techniques such as P&O and normal fuzzy controlling methods which shows that the power output by the PSO optimized fuzzy scheme gives higher power than both methods. The design consists of electronically gate controlled IGBT based buck converter interfaced with photovoltaic arrays for DC-DC converter development operating at MPPT conditions. By applying the gate pulse width IGBT switching are controlled with appropriate duty cycle evaluation by MPPT algorithm related fuzzy rules. The proposed scheme based PSO optimized fuzzy controller results also have an advantage that the Pout has ripple free performance and it is faster than fuzzy and P&O controlling scheme. In future obtained investigation and simulation results of the proposed PSO optimized can be validated on real time experimental setup based practical’s to shows that the simulation results closely agree with the experimentally obtained results for validating the experimental power circuit and control circuits of the dc- dc converter. References: [1] Welch RL, Venayagamoorthy GK. Energy dispatch fuzzy controller for a grid independent photo voltaic system. Energy Convers Manag 2010;51:928–37. [2] Lee AHI, Chen HH, Kang HY. A model to analyze strategic products for photo voltaic silicon thin-film solar cell power industry. Renew Sustain Energy Rev 2011;15:1271–83. [3] Charabi Y, Gastli A. PV site suitability analysis using GIS- based spatial fuzzy multi-criteria evaluation. Renew Energy 2011; 36: 2554–61. [4] Landeras G, López JJ, Kisi O, Shiri J. Comparison of Gene Expression Programming with neuro-fuzzy and neural network computing techniques in estimating daily incoming solar radiation in the Basque Country (Northern Spain). Energy Convers Manag 2012; 62 : 1–13. [5] Chen SX, Gooi HB, Wang MQ. Solar radiation forecast based on fuzzy logic and neural networks. Renew Energy 2013; 60:195–201. [6] Chen, Y.T.; Lai, Z.H.; Liang, R.H. A novel auto-scaling variable step-size MPPT method for a PV system. Sol. Energy 2014, 102, 247–256. [7] Liu, F.; Duan, S.; Liu, F.; Liu, B.; Kang, Y. A Variable Step Size INC MPPT Method for PV Systems. IEEE Trans. Ind. Electron. 2008, 55, 2622–2628. [8] Messai, A.; Mellit, A.; Massi Pavan, A.; Guessoum, A.; Mekki, H. FPGA-based implementation of a fuzzy controller (MPPT) for photovoltaic module. Energy Convers. Manag. 2011, 52, 2695–2704. [9] Lee, J.S.; Lee, K.B. Variable DC-link voltage algorithm with a wide range of maximum power point tracking for a two-string PV system. Energies 2013, 6, 58–78. [10] Sera, D.; Kerekes, T.; Teodorescu, R.; Blaabjerg, F. Improved MPPT Algorithms for Rapidly Changing Environmental Conditions. In Proceedings of Power Electronics and Motion Control, Portoroz, Slovenia, 30 August–1 September 2006; pp. 1614–1619. [11] Jang, J-S. R., (1992), “Neuro-Fuzzy Modeling: Architecture, Analyses and Applications”, P.hd. Thesis.
0 0.5 1 1.5 2 2.5 30
10
20
30
pout
time
MPPTFUZZY MPPTFUZZY PSO MPPT
0 0.5 1 1.5 2 2.5 3-1
-0.5
0
0.5
1
Dut
y cy
cle
time
MPPTFUZZY MPPTFUZZY PSO MPPT

International Journal of Research and Development in Applied Science and Engineering (IJRDASE) ISSN: 2454-6844
Available online at: www.ijrdase.com Volume 10, Issue 1, May 2016 All Rights Reserved © 2016 IJRDASE
[12] Jang, J-S. R., (1993), “ANFIS-Adaptive-Network Based Fuzzy Inference System”, IEEE Transactions on Systems, Man and Cybernatics, 23(3), pp 665-685. [13] Zadeh, L.A., (1965), “Fuzzy sets, Information and Control”, 8, pp 338–353.
[14] Eberhart, R. C. and Shi, Y., A Modified Particle Swarm Optimization, Proceedings of IEEE International Conference on Evolutionary Computation, 1998, pp.69-73. [15] Eberhart, R. C. and Shi, Y., Comparing Inertia Weights and Constriction Factors in Particle Swarm Optimization, Proceedings of the 2000 Congress on Evolutionary Computation, Vol. 1, 2000, pp.84-88.