Embed Size (px)
Citation preview
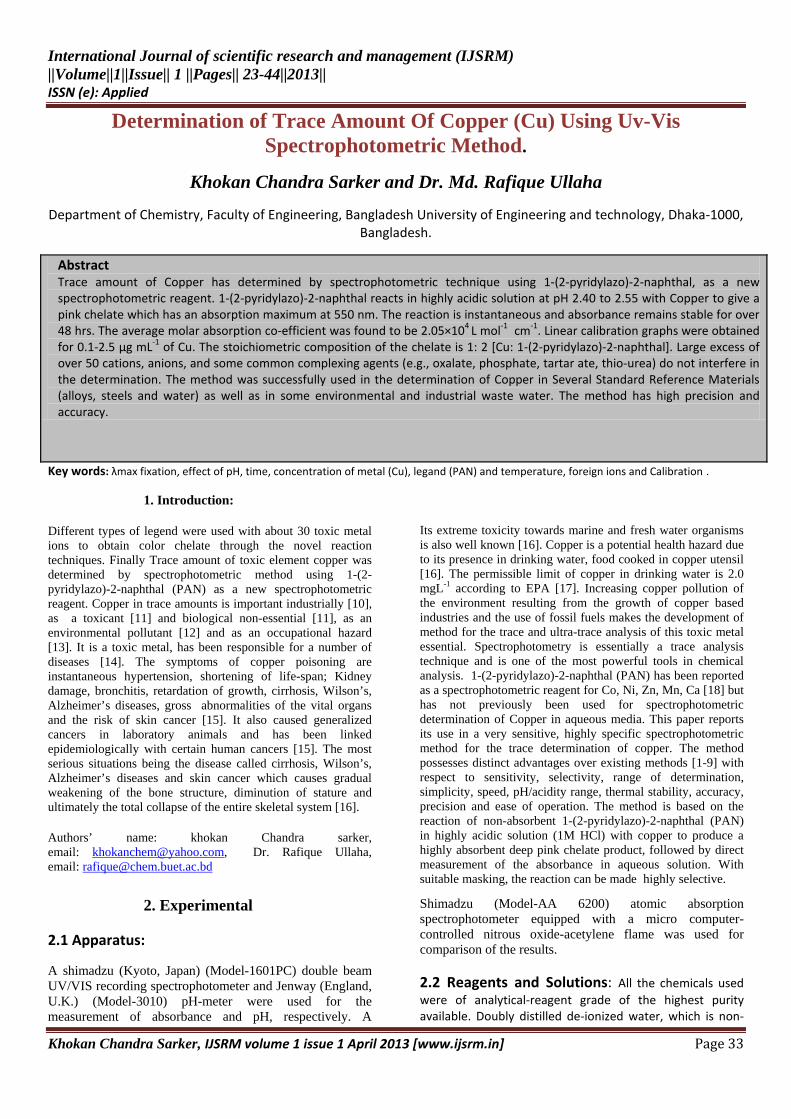
International Journal of scientific research and management (IJSRM) ||Volume||1||Issue|| 1 ||Pages|| 23-44||2013|| ISSN (e): Applied
Khokan Chandra Sarker, IJSRM volume 1 issue 1 April 2013 [www.ijsrm.in] Page 33
Determination of Trace Amount Of Copper (Cu) Using Uv-Vis Spectrophotometric Method.
Khokan Chandra Sarker and Dr. Md. Rafique Ullaha
Department of Chemistry, Faculty of Engineering, Bangladesh University of Engineering and technology, Dhaka-1000, Bangladesh.
Abstract Trace amount of Copper has determined by spectrophotometric technique using 1-(2-pyridylazo)-2-naphthal, as a new spectrophotometric reagent. 1-(2-pyridylazo)-2-naphthal reacts in highly acidic solution at pH 2.40 to 2.55 with Copper to give a pink chelate which has an absorption maximum at 550 nm. The reaction is instantaneous and absorbance remains stable for over 48 hrs. The average molar absorption co-efficient was found to be 2.05×10⁴ L mol-1 cm-1. Linear calibration graphs were obtained for 0.1-2.5 μg mL-1 of Cu. The stoichiometric composition of the chelate is 1: 2 [Cu: 1-(2-pyridylazo)-2-naphthal]. Large excess of over 50 cations, anions, and some common complexing agents (e.g., oxalate, phosphate, tartar ate, thio-urea) do not interfere in the determination. The method was successfully used in the determination of Copper in Several Standard Reference Materials (alloys, steels and water) as well as in some environmental and industrial waste water. The method has high precision and accuracy.
Key words: λmax fixation, effect of pH, time, concentration of metal (Cu), legand (PAN) and temperature, foreign ions and Calibration .
1. Introduction:
Different types of legend were used with about 30 toxic metal ions to obtain color chelate through the novel reaction techniques. Finally Trace amount of toxic element copper was determined by spectrophotometric method using 1-(2-pyridylazo)-2-naphthal (PAN) as a new spectrophotometric reagent. Copper in trace amounts is important industrially [10], as a toxicant [11] and biological non-essential [11], as an environmental pollutant [12] and as an occupational hazard [13]. It is a toxic metal, has been responsible for a number of diseases [14]. The symptoms of copper poisoning are instantaneous hypertension, shortening of life-span; Kidney damage, bronchitis, retardation of growth, cirrhosis, Wilson’s, Alzheimer’s diseases, gross abnormalities of the vital organs and the risk of skin cancer [15]. It also caused generalized cancers in laboratory animals and has been linked epidemiologically with certain human cancers [15]. The most serious situations being the disease called cirrhosis, Wilson’s, Alzheimer’s diseases and skin cancer which causes gradual weakening of the bone structure, diminution of stature and ultimately the total collapse of the entire skeletal system [16].
Authors’ name: khokan Chandra sarker, email: [email protected], Dr. Rafique Ullaha, email: [email protected]
Its extreme toxicity towards marine and fresh water organisms is also well known [16]. Copper is a potential health hazard due to its presence in drinking water, food cooked in copper utensil [16]. The permissible limit of copper in drinking water is 2.0 mgL-1 according to EPA [17]. Increasing copper pollution of the environment resulting from the growth of copper based industries and the use of fossil fuels makes the development of method for the trace and ultra-trace analysis of this toxic metal essential. Spectrophotometry is essentially a trace analysis technique and is one of the most powerful tools in chemical analysis. 1-(2-pyridylazo)-2-naphthal (PAN) has been reported as a spectrophotometric reagent for Co, Ni, Zn, Mn, Ca [18] but has not previously been used for spectrophotometric determination of Copper in aqueous media. This paper reports its use in a very sensitive, highly specific spectrophotometric method for the trace determination of copper. The method possesses distinct advantages over existing methods [1-9] with respect to sensitivity, selectivity, range of determination, simplicity, speed, pH/acidity range, thermal stability, accuracy, precision and ease of operation. The method is based on the reaction of non-absorbent 1-(2-pyridylazo)-2-naphthal (PAN) in highly acidic solution (1M HCl) with copper to produce a highly absorbent deep pink chelate product, followed by direct measurement of the absorbance in aqueous solution. With suitable masking, the reaction can be made highly selective.
2. Experimental
2.1 Apparatus:
A shimadzu (Kyoto, Japan) (Model-1601PC) double beam UV/VIS recording spectrophotometer and Jenway (England, U.K.) (Model-3010) pH-meter were used for the measurement of absorbance and pH, respectively. A
Shimadzu (Model-AA 6200) atomic absorption spectrophotometer equipped with a micro computer-controlled nitrous oxide-acetylene flame was used for comparison of the results.
2.2 Reagents and Solutions: All the chemicals used were of analytical-reagent grade of the highest purity available. Doubly distilled de-ionized water, which is non-
Khokan Chandra Sarker, IJSRM volume 1 issue 1 April 2013 [www.ijsrm.in] Page 34
absorbent under ultraviolet radiation, was used throughout.
Glass vessels were cleaned by soaking in acidified solutions of KMnO4 or K2Cr2O7 followed by washing with nitric acid (1+1) and rinsed several times with high-purity de-ionized water. Stock solutions and environmental water samples (1000mL each) were kept in polypropylene bottles containing 1 mL of concentrated HNO3. More rigorous contamination control was used when the copper levels in the specimens were low.
2.3 1-(2-pyridylazo)-2-naphthal (PAN) Solution, 4.01x 10⁻⁴ M : Prepared by dissolving the requisite amount of 1-(2-pyridylazo)-2-naphthal (PAN) (BDH chemicals) in a known volume of highly acidified (HCl) de-ionized water. More dilute solutions of the reagent were prepared as required. PAN is insoluble in water but soluble in acidic water and organic solvent.
2.4 Copper Standard Solutions: A 100mL of stock solution of divalent copper was prepared by dissolving 0.03929mg of AR crystallize copper sulfate (Cu SO4. 5H2O) (Merck) in doubly distilled de-ionized water. Aliquots of this solution were standardized by EDTA titration using Sulfon black-T as indictor. More dilute standard solutions were prepared by appropriate dilution of aliquots from the stock solution with de-ionized water and when required.
2.5 EDTA Solution: 100-mL stock solution of EDTA (0.01% W/v) was prepared by dissolving 10 mg of A.C.S.-grade (≥ 99%) of disodium dihydrogen ethylenediamine tetraacetate dihydrate in (100-mL) de-ionized water.
2.6 Potassium permanganate Solution: A 1% potassium permanganate Solution (Merck) was prepared by dissolving in de-ionized water. Aliquots of this
solution were standardized with oxalic acid. Sodium azide solution(2.5% W/v) (purity >99%) was also used.
2.7 Tartarate Solution: A 100-mL stock solution of tartarate (0.01% W/v) was prepared by dissolving 10 mg of A.C.S grade (99%) potassium sodium tartarate tetrahydrate in (100-mL) de-ionized water.
2.8 Aqueous Ammonia Solution: A 100-mL solution of aqueous ammonia was prepared by diluting 10-mL concentrated NH4OH (28 – 30%, A.C.S grade) to 100-mL with deionized water. The solution was stored in polypropylene bottle.
2.9 Other Solutions: Solutions of a large number of inorganic ions and complexing agents were prepared from their analar grade or equivalent grade water soluble salts ( or the oxides and carbonates in hydrochloric acid); those of niobium, titanium, zirconium and hafnium were specially prepared from their corresponding oxides (Specpure, Johnson Matthey) according to the recommended procedures of Mukharjee [19]. In the case of insoluble substances, special dissolution methods were adopted [20].
2.10 Procedure: To 0.1–1.0 mL of a neutral aqueous (pH= 4 ) solution containing 1–10 µg of copper in a 10-mL calibrated flask was mixed with 1:5-1:10 fold molar excess of 1-(2-pyridylazo)-2-naphthal (PAN) reagent solution preferably 0.01% or 4.01 x 10⁻⁴M followed by the addition of 0.5M hydrochloric acid (HCl) and NaOH or NH4OH to control pH of solution at around 2.5. The mixture was diluted to the mark with de-ionized water. The absorbance was measured at 550 nm against a corresponding reagent blank. The copper content in an unknown sample was determined using concurrently prepared calibration graph.
3. Results and discussion
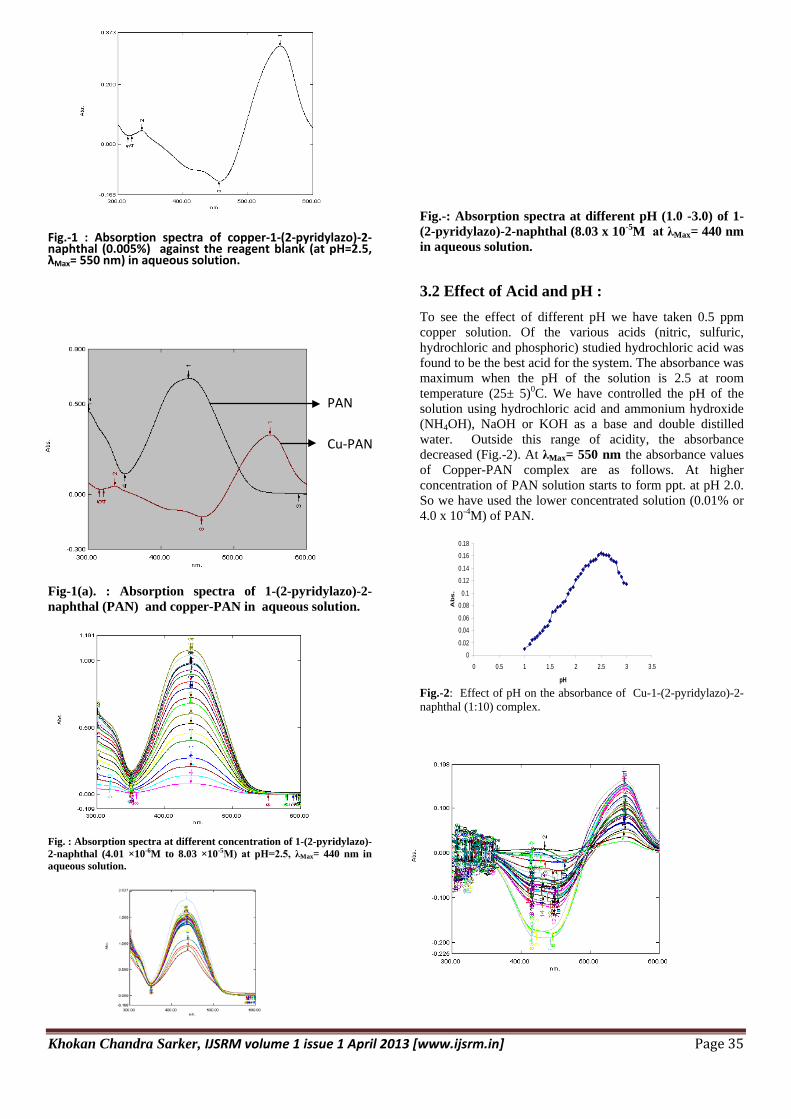
3.1 Absorption spectra: The absorption spectra of the copper-1-(2-pyridylazo)-2-naphthal (PAN) solution system in 1(M) HCl medium was recorded using the UV-Vis spectrophotometer. The absorption spectra of the copper-PAN is a symmetric curve with the maximum absorbance co-efficient is shown in Fig-1. In all instances measurements were made at 550 nm against a reagent blank. The reaction mechanism of the present method is as reported earlier [21].
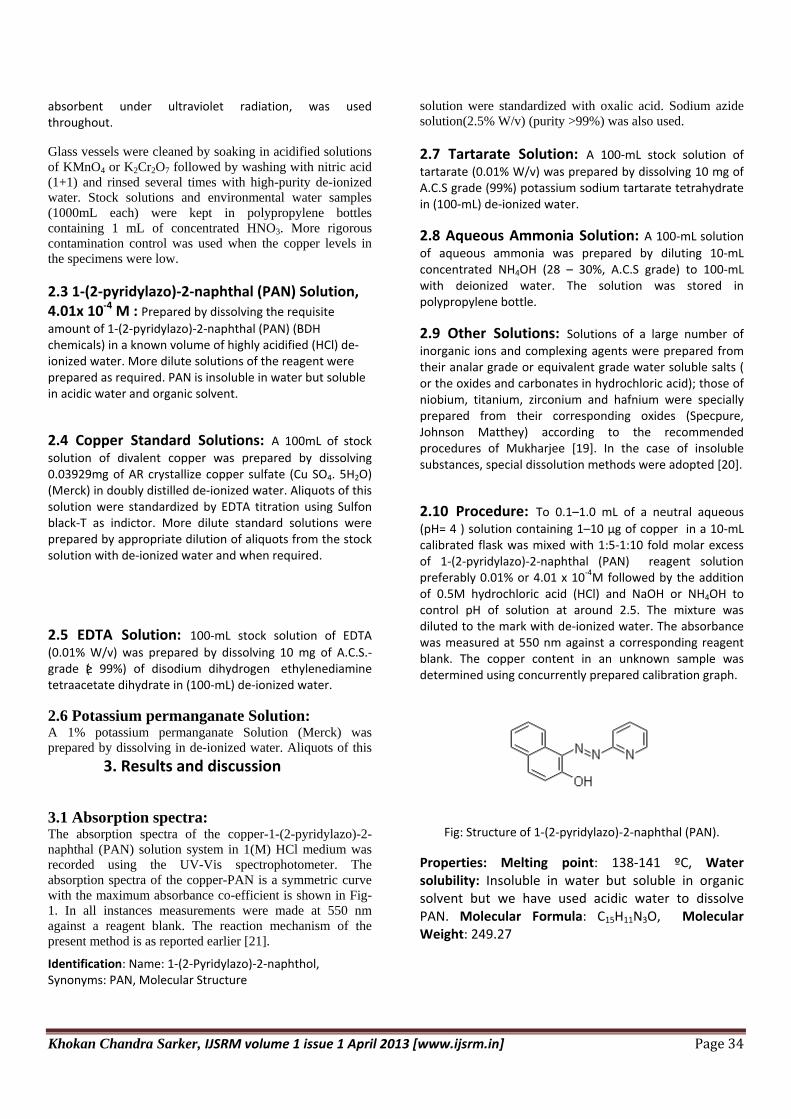
Identification: Name: 1-(2-Pyridylazo)-2-naphthol, Synonyms: PAN, Molecular Structure
Fig: Structure of 1-(2-pyridylazo)-2-naphthal (PAN).
Properties: Melting point: 138-141 ºC, Water solubility: Insoluble in water but soluble in organic solvent but we have used acidic water to dissolve PAN. Molecular Formula: C15H11N3O, Molecular Weight: 249.27
Khokan Chandra Sarker, IJSRM volume 1 issue 1 April 2013 [www.ijsrm.in] Page 35
0
0.02
0.04
0.06
0.08
0.1
0.12
0.14
0.16
0.18
0 0.5 1 1.5 2 2.5 3 3.5
pH
Ab
s.
PAN
Fig.-1 : Absorption spectra of copper-1-(2-pyridylazo)-2-naphthal (0.005%) against the reagent blank (at pH=2.5, λMax= 550 nm) in aqueous solution.
Fig-1(a). : Absorption spectra of 1-(2-pyridylazo)-2-naphthal (PAN) and copper-PAN in aqueous solution.
Fig. : Absorption spectra at different concentration of 1-(2-pyridylazo)-2-naphthal (4.01 ×10⁻⁶M to 8.03 ×10⁻⁵M) at pH=2.5, λMax= 440 nm in aqueous solution.
Fig.-: Absorption spectra at different pH (1.0 -3.0) of 1-(2-pyridylazo)-2-naphthal (8.03 x 10⁻⁵M at λMax= 440 nm in aqueous solution.
3.2 Effect of Acid and pH : To see the effect of different pH we have taken 0.5 ppm copper solution. Of the various acids (nitric, sulfuric, hydrochloric and phosphoric) studied hydrochloric acid was found to be the best acid for the system. The absorbance was maximum when the pH of the solution is 2.5 at room temperature (25± 5)0C. We have controlled the pH of the solution using hydrochloric acid and ammonium hydroxide (NH4OH), NaOH or KOH as a base and double distilled water. Outside this range of acidity, the absorbance decreased (Fig.-2). At λMax= 550 nm the absorbance values of Copper-PAN complex are as follows. At higher concentration of PAN solution starts to form ppt. at pH 2.0. So we have used the lower concentrated solution (0.01% or 4.0 x 10⁻⁴M) of PAN.
Fig.-2: Effect of pH on the absorbance of Cu-1-(2-pyridylazo)-2-naphthal (1:10) complex.
Cu-PAN
Khokan Chandra Sarker, IJSRM volume 1 issue 1 April 2013 [www.ijsrm.in] Page 36
0
0.05
0.1
0.15
0.2
0.25
0.3
0.35
0 10 20 30 40 50 60 70
Time( min.)
Abs.
0
0.05
0.1
0.15
0.2
0.25
0.3
0.35
0 10 20 30 40 50 60
Time (hrs)
Abs.
PAN
Cu-PAN
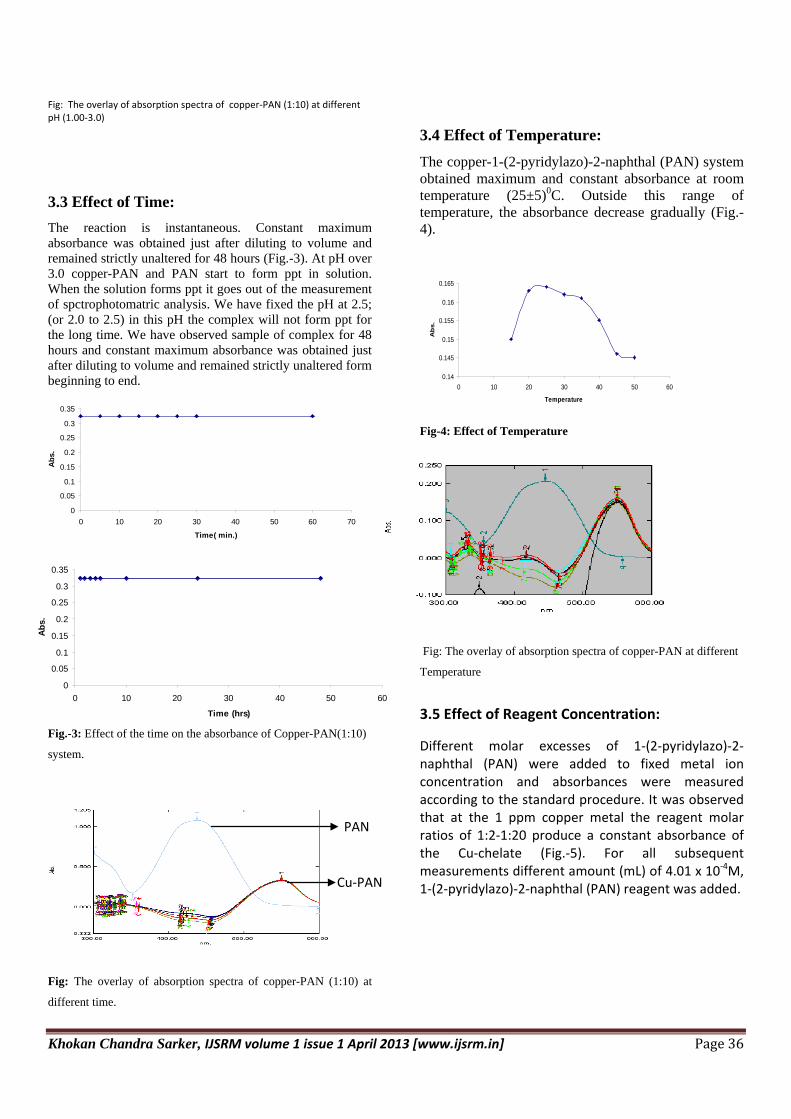
Fig: The overlay of absorption spectra of copper-PAN (1:10) at different pH (1.00-3.0)
3.3 Effect of Time: The reaction is instantaneous. Constant maximum absorbance was obtained just after diluting to volume and remained strictly unaltered for 48 hours (Fig.-3). At pH over 3.0 copper-PAN and PAN start to form ppt in solution. When the solution forms ppt it goes out of the measurement of spctrophotomatric analysis. We have fixed the pH at 2.5; (or 2.0 to 2.5) in this pH the complex will not form ppt for the long time. We have observed sample of complex for 48 hours and constant maximum absorbance was obtained just after diluting to volume and remained strictly unaltered form beginning to end.
Fig.-3: Effect of the time on the absorbance of Copper-PAN(1:10)
system.
Fig: The overlay of absorption spectra of copper-PAN (1:10) at
different time.
3.4 Effect of Temperature: The copper-1-(2-pyridylazo)-2-naphthal (PAN) system obtained maximum and constant absorbance at room temperature (25±5)0C. Outside this range of temperature, the absorbance decrease gradually (Fig.-4).
Fig-4: Effect of Temperature
Fig: The overlay of absorption spectra of copper-PAN at different
Temperature
3.5 Effect of Reagent Concentration:
Different molar excesses of 1-(2-pyridylazo)-2-naphthal (PAN) were added to fixed metal ion concentration and absorbances were measured according to the standard procedure. It was observed that at the 1 ppm copper metal the reagent molar ratios of 1:2-1:20 produce a constant absorbance of the Cu-chelate (Fig.-5). For all subsequent measurements different amount (mL) of 4.01 x 10⁻⁴M, 1-(2-pyridylazo)-2-naphthal (PAN) reagent was added.
0.14
0.145
0.15
0.155
0.16
0.165
0 10 20 30 40 50 60
Temperature
Ab
s.

Khokan Chandra Sarker, IJSRM volume 1 issue 1 April 2013 [www.ijsrm.in] Page 37
0
0.1
0.2
0.3
0.4
0.5
0.6
0.7
0.8
0.9
0 0.5 1 1.5 2 2.5 3
Concentration
Ab
s.
Concentration of PAN
0 1 2 3 4 5 6
Abso
rbanc
e
0.00
0.05
0.10
0.15
0.20
0.25
0.30
0.35
Fig.-5: Effect of reagent copper-1-(2-pyridylazo)-2-naphthal (PAN) molar concentration ratio on the absorbance of copper-PAN system.
Fig: The overlay of absorption spectra of Copper-PAN at different Reagent (PAN) Concentration (0.0001%-0.005% or 4.01 x 10⁻⁶M-2.00 x 10⁻⁴M )
3.6 Calibration Graph (Beer’s law and Sensitivity):
The well-known equation for spectrophotometric analysis in very dilute solution was derived from Beer’s law. The effect of metal concentration was studied over 0.1-5.0 µg mL-1 distributed in two different sets (0.1 – 2.5 and 1 – 5.0 µg mL-1 for convenience of measurement. The absorbance was linear for 0.1 – 2.50µg mL-1 of copper at 550 nm. The molar absorption co-efficient [22] was found to be 2.052 x 10⁴ L mol-1 cm-1. Of the calibration graph which that showing the limit of linearity range is given in Fig.-6(a).
Fig- 6(a): Calibration graph of absorbance of Cu –PAN (0.005%) complex against the different concentration of Cu ( 0.1 to 2.5\[ ppm)
Fig: The overlay of absorption spectra of copper-PAN (0.005%) for 0.1 – 2.5 µg mL-1 of Copper at pH= 2.5, λmax =550 nm.
Concentration (ppm)
0 1 2 3 4 5
Abso
rban
ce
0
1
2
Fig.-6 (b): Calibration graph of absorbance of Cu –PAN (0.005%) complex against the different concentration of Cu ( 0.1 to 5.0 ppm).
Khokan Chandra Sarker, IJSRM volume 1 issue 1 April 2013 [www.ijsrm.in] Page 38
Fig: The overlay of absorption spectra of copper-PAN (0.005%) for 0.1 –5.0 µg mL-1 of Copper at pH= 2.5, λmax =550 nm.
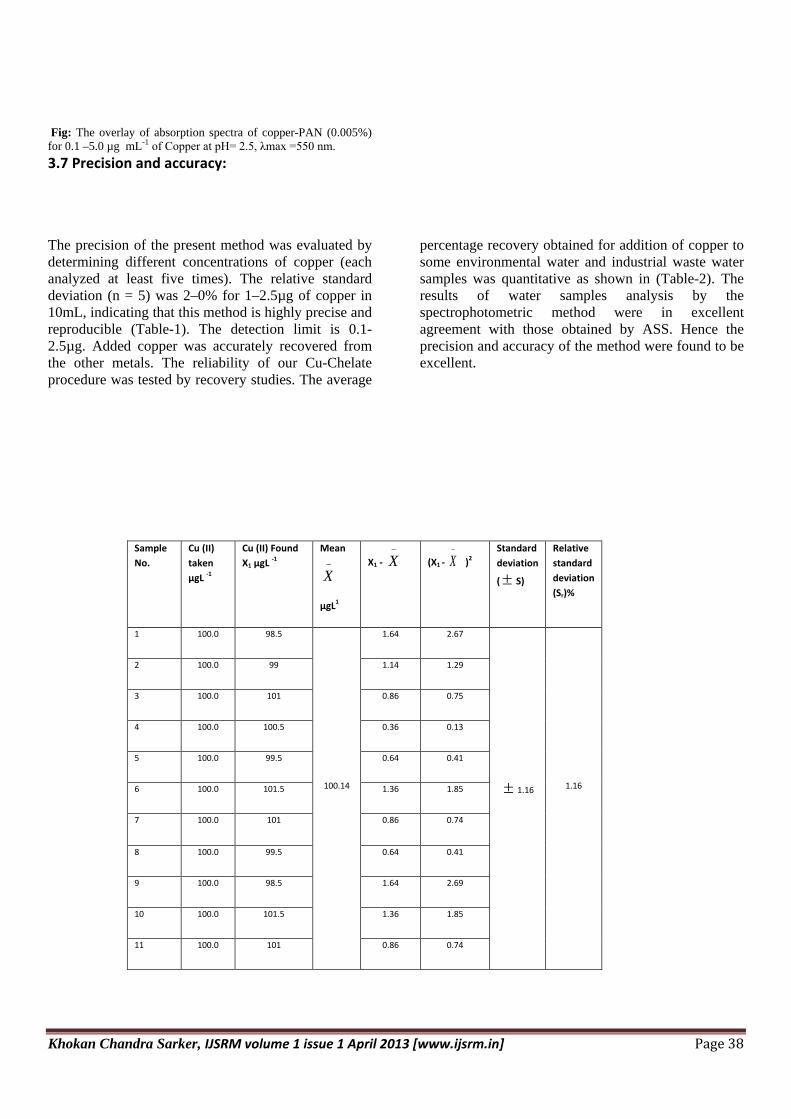
3.7 Precision and accuracy:
The precision of the present method was evaluated by determining different concentrations of copper (each analyzed at least five times). The relative standard deviation (n = 5) was 2–0% for 1–2.5µg of copper in 10mL, indicating that this method is highly precise and reproducible (Table-1). The detection limit is 0.1-2.5µg. Added copper was accurately recovered from the other metals. The reliability of our Cu-Chelate procedure was tested by recovery studies. The average
percentage recovery obtained for addition of copper to some environmental water and industrial waste water samples was quantitative as shown in (Table-2). The results of water samples analysis by the spectrophotometric method were in excellent agreement with those obtained by ASS. Hence the precision and accuracy of the method were found to be excellent.
Sample No.
Cu (II) taken µgL -1
Cu (II) Found X1 µgL -1
Mean−
X
µgL1
X1 - −
X (X1 - −
X )2 Standard deviation
(± S)
Relative standard deviation (Sr)%
1 100.0 98.5
100.14
1.64 2.67
± 1.16
1.16
2 100.0 99 1.14 1.29
3 100.0 101 0.86 0.75
4 100.0 100.5 0.36 0.13
5 100.0 99.5 0.64 0.41
6 100.0 101.5 1.36 1.85
7 100.0 101 0.86 0.74
8 100.0 99.5 0.64 0.41
9 100.0 98.5 1.64 2.69
10 100.0 101.5 1.36 1.85
11 100.0 101 0.86 0.74
Khokan Chandra Sarker, IJSRM volume 1 issue 1 April 2013 [www.ijsrm.in] Page 39
TABLE-1: STANDARD DEVIATION AND RELATIVE STANDARD DEVIATION OF Cu(II)- 1-(2-PYRIDYLAZO)-2-NAPHTHAL (PAN) SYSTEM.
Mean −
X 14.10011
5.1101X1 ==∑N
Standard deviation, S = 1
)(2
1
−
−∑N
XX =
11153.13−
353.1 = ± 1.16
Relative Standard deviation (Sr) % 100×=XS =
14.10010016.1 ×
= 1.16
3.8 Effect of foreign ions:
The effect of over 50 ions and complexing agents on the determination of only 1µg mL-1 of copper was studied. The criterion for interference [23] was an absorbance value varying by more than ± 5% from the expected value for copper alone. The most serious interferences were from Ni (II), Co (II) and Fe (III) ions. Interference from these ions is probably due to complex formation with PAN.
The greater tolerance limits for these ions can be achieved by using several masking agents. In order to eliminate the interference if Ni and Co are present in the sample they are eliminated by extraction from the sample using 15 ml of 10×10-3mole/L DMG solution in 1,2-dichloroethane. If the aqueous phase contains mercury and iron, 1g of KI was added masking agent for Hg and 10g of KF dissolved in 4mole/L HNO3 solution was used to preclude the interference of iron [24].
Interference from these metal ions Ni (II), Co (II) and Fe (III) have been effectively removed by a short single step ion-exchange separation process, using an Amberlite XAD-8 resin (100-200 mesh) anion exchanger [25].
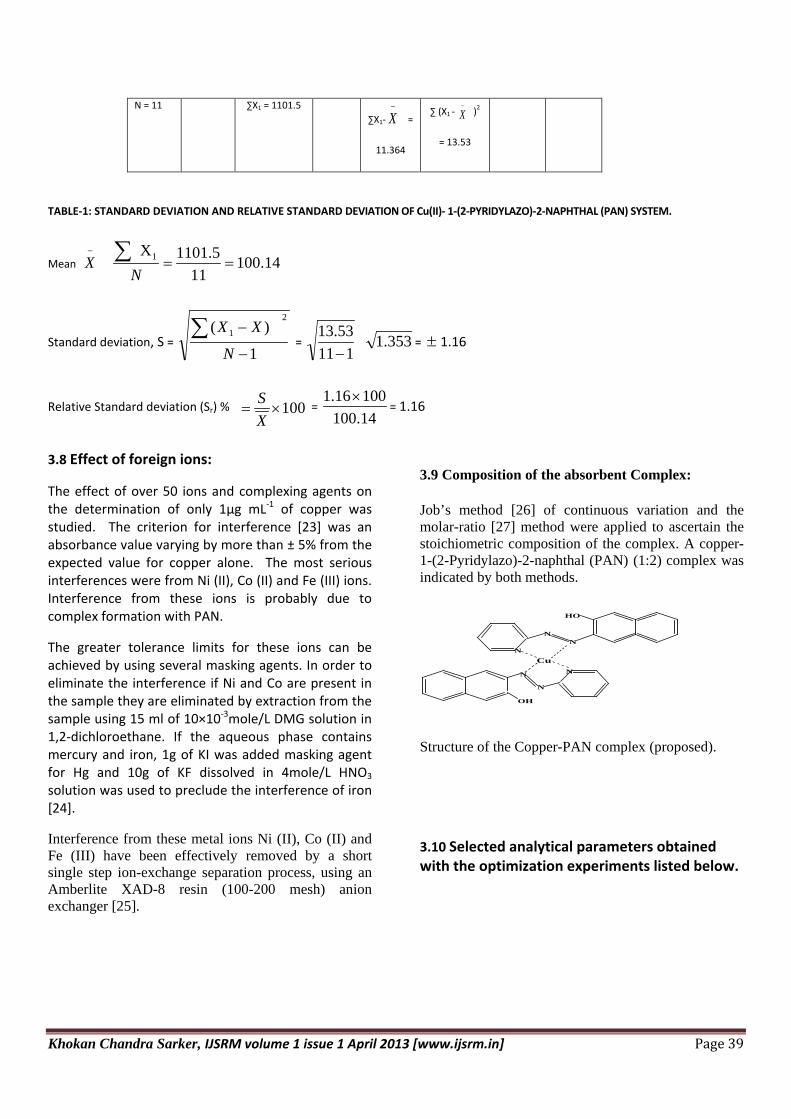
3.9 Composition of the absorbent Complex:
Job’s method [26] of continuous variation and the molar-ratio [27] method were applied to ascertain the stoichiometric composition of the complex. A copper- 1-(2-Pyridylazo)-2-naphthal (PAN) (1:2) complex was indicated by both methods.
HO
NN
N
Cu
OH
N N
N
Structure of the Copper-PAN complex (proposed).
3.10 Selected analytical parameters obtained with the optimization experiments listed below.
N = 11 ∑X1 = 1101.5 ∑X1-
−
X =
11.364
∑ (X1 - −
X )2
= 13.53

Khokan Chandra Sarker, IJSRM volume 1 issue 1 April 2013 [www.ijsrm.in] Page 40
4. Applications
The present method was successfully applied to the determination of copper (II) in various industrial waste
water samples of various compositions (Table-2) and also in number of real samples, e.g several Certified Reference Materials (CRM). The method was also extended to the determination of copper in a number of environmental samples. In view of the unknown composition of environmental water samples, the same equivalent portions of each such sample was analyzed for copper content, recoveries in both the ‘spiked` (added to the samples before the mineralization or dissolution) and the ‘unspiked` samples are in good agreement (Table-2). The results of industrial waste water analysis by spectrophotometric method were found to be in excellent agreement with those obtained by AAS. The precision and accuracy of the method were excellent.
4.1 Determination of Copper in Environmental and Industrial Water: Each filtered (with whatman No.-40) environmental water sampl (1000-mL) was evaporated nearly to dryness with a mixture of 5mL of concentrated H2SO4 and 10-mL of concentrated HNO3 in a fume cupboard following a method recommended by Greenberg et al [29], and was then cooled to room temperature. The residue was then heated with 10-mL of de-ionized water in order to dissolve the salts. The solution was then cooled and neutralized with dilute NH4OH in the presence of 1–2 mL of 0.01%(W/V) tartarate solution. The resulting solution was then filtered and quantitatively transferred into a 25-mL calibrated flask and made up to the mark with de-ionized water.
Parameter Studied range Selected Value
Wavelength/λmax(nm) 200 - 800 550
pH 1.0 – 3.5 2.40 - 2.55
Time/h 0 - 72 24
Temperature/°C 1 - 50 25 ±5
Reagent (fold molar excess, M: R) 1 : 2 – 1: 20 1 : 5 – 1: 10
Linear range/µg/mL-1 0.01 - 20 0.1 – 5.0
Detection limit/µg mL-1 0.1 - 20 0.1 – 2.50
Reproducibility (% RSD) 0 - 2 0 – 2
Khokan Chandra Sarker, IJSRM volume 1 issue 1 April 2013 [www.ijsrm.in] Page 41
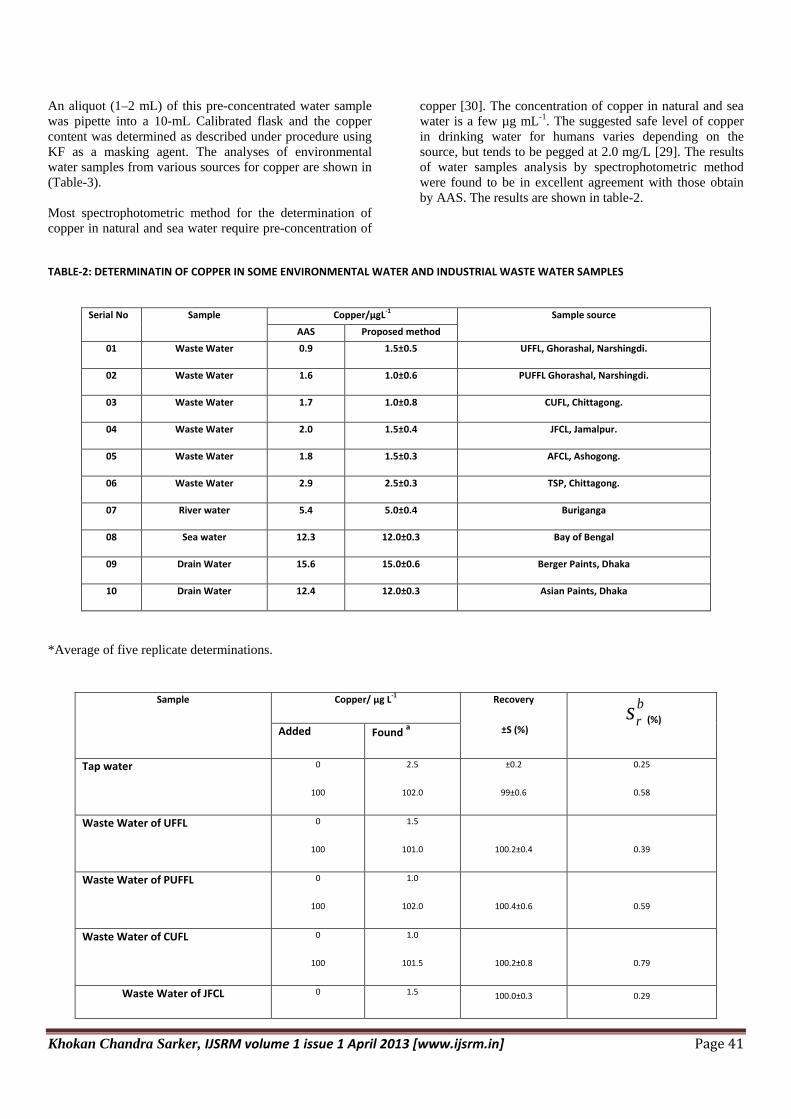
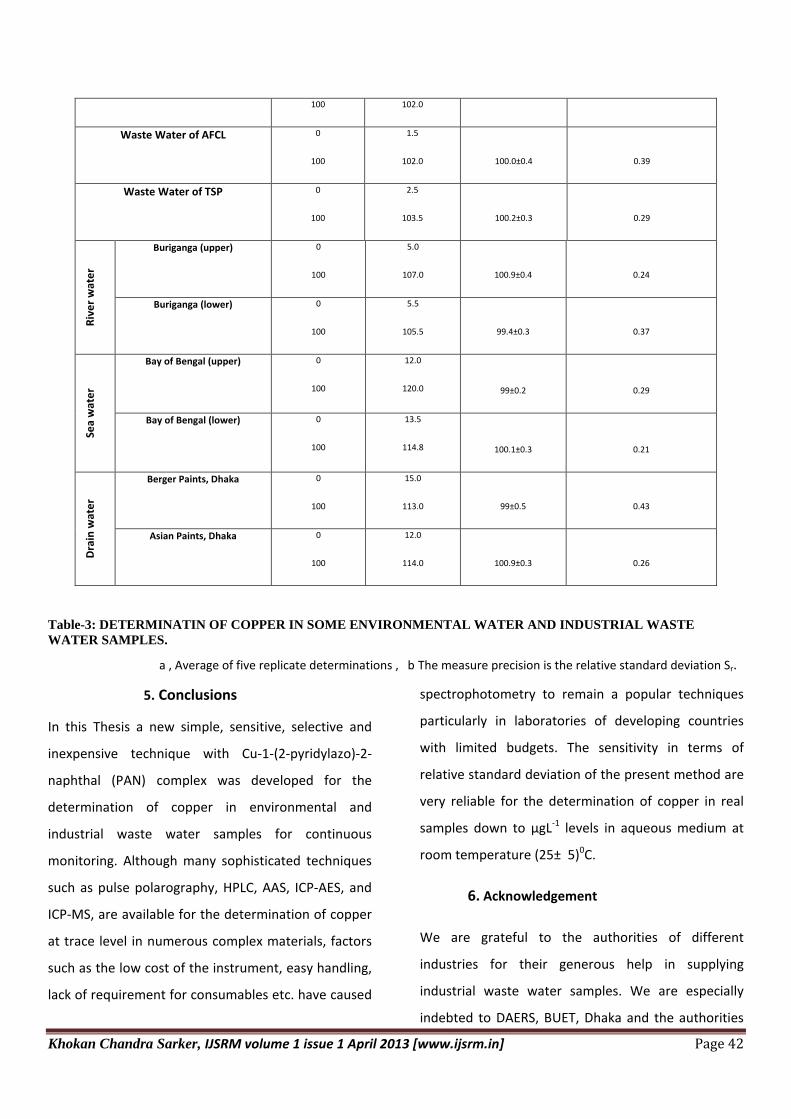
An aliquot (1–2 mL) of this pre-concentrated water sample was pipette into a 10-mL Calibrated flask and the copper content was determined as described under procedure using KF as a masking agent. The analyses of environmental water samples from various sources for copper are shown in (Table-3). Most spectrophotometric method for the determination of copper in natural and sea water require pre-concentration of
copper [30]. The concentration of copper in natural and sea water is a few µg mL-1. The suggested safe level of copper in drinking water for humans varies depending on the source, but tends to be pegged at 2.0 mg/L [29]. The results of water samples analysis by spectrophotometric method were found to be in excellent agreement with those obtain by AAS. The results are shown in table-2.
TABLE-2: DETERMINATIN OF COPPER IN SOME ENVIRONMENTAL WATER AND INDUSTRIAL WASTE WATER SAMPLES
*Average of five replicate determinations.
Serial No
Sample
Copper/µgL-1
Sample source
AAS Proposed method
01 Waste Water 0.9 1.5±0.5 UFFL, Ghorashal, Narshingdi.
02 Waste Water 1.6 1.0±0.6 PUFFL Ghorashal, Narshingdi.
03 Waste Water 1.7 1.0±0.8 CUFL, Chittagong.
04 Waste Water 2.0 1.5±0.4 JFCL, Jamalpur.
05 Waste Water 1.8 1.5±0.3 AFCL, Ashogong.
06 Waste Water 2.9 2.5±0.3 TSP, Chittagong.
07 River water 5.4 5.0±0.4 Buriganga
08 Sea water 12.3 12.0±0.3 Bay of Bengal
09 Drain Water 15.6 15.0±0.6 Berger Paints, Dhaka
10 Drain Water 12.4 12.0±0.3 Asian Paints, Dhaka
Sample Copper/ µg L-1 Recovery
±S (%)
brs (%)
Added Found a
Tap water 0
100
2.5
102.0
±0.2
99±0.6
0.25
0.58
Waste Water of UFFL 0
100
1.5
101.0 100.2±0.4 0.39
Waste Water of PUFFL 0
100
1.0
102.0 100.4±0.6 0.59
Waste Water of CUFL 0
100
1.0
101.5 100.2±0.8 0.79
Waste Water of JFCL 0 1.5 100.0±0.3 0.29
Khokan Chandra Sarker, IJSRM volume 1 issue 1 April 2013 [www.ijsrm.in] Page 42
Table-3: DETERMINATIN OF COPPER IN SOME ENVIRONMENTAL WATER AND INDUSTRIAL WASTE WATER SAMPLES. a , Average of five replicate determinations , b The measure precision is the relative standard deviation Sr.
5. Conclusions
In this Thesis a new simple, sensitive, selective and
inexpensive technique with Cu-1-(2-pyridylazo)-2-
naphthal (PAN) complex was developed for the
determination of copper in environmental and
industrial waste water samples for continuous
monitoring. Although many sophisticated techniques
such as pulse polarography, HPLC, AAS, ICP-AES, and
ICP-MS, are available for the determination of copper
at trace level in numerous complex materials, factors
such as the low cost of the instrument, easy handling,
lack of requirement for consumables etc. have caused
spectrophotometry to remain a popular techniques
particularly in laboratories of developing countries
with limited budgets. The sensitivity in terms of
relative standard deviation of the present method are
very reliable for the determination of copper in real
samples down to µgL-1 levels in aqueous medium at
room temperature (25± 5)0C.
6. Acknowledgement
We are grateful to the authorities of different
industries for their generous help in supplying
industrial waste water samples. We are especially
indebted to DAERS, BUET, Dhaka and the authorities
100 102.0
Waste Water of AFCL 0
100
1.5
102.0 100.0±0.4 0.39
Waste Water of TSP 0
100
2.5
103.5 100.2±0.3 0.29
Rive
r wat
er
Buriganga (upper) 0
100
5.0
107.0
100.9±0.4
0.24
Buriganga (lower) 0
100
5.5
105.5 99.4±0.3 0.37
Sea
wat
er
Bay of Bengal (upper)
0
100
12.0
120.0 99±0.2 0.29
Bay of Bengal (lower)
0
100
13.5
114.8 100.1±0.3 0.21
Dra
in w
ater
Berger Paints, Dhaka 0
100
15.0
113.0 99±0.5 0.43
Asian Paints, Dhaka 0
100
12.0
114.0 100.9±0.3 0.26

Khokan Chandra Sarker, IJSRM volume 1 issue 1 April 2013 [www.ijsrm.in] Page 43
of analytical Research Division of BCSIR Laboratories,
Dhaka for analyzing the samples by AAS.
References
[1] F. Shaohua, Z. Yishan, N. Qidao, and J. Lihua, Fence Huaxue, 35(2) (1999) 79, (Chem. Abstr., 131 (1999) 37304U.)
[2] G. Jiang, W. Xiaoju, T. Yanhong, and L. Zhetl. Guang puxue Yu Guangpu Fenxi, 19(3) (1999) 474[Chem. Abstr, 131 (1999) 96547f].
[3] M. Yang, C. Gong. G Li, and C. Jin, Fenxi Shiyanshi, 18(3) (1999) 52-54[Chem. Abstr. 131 (1999) 129614w].
[4] L. Shutin, and Z. Shulin, Jezin Fenxi, 19(3) (1999) 21[Chem. Abstr, 131(1999) 237200b]
[5] S. Kattikeyan, T. P. Rao, C. S. P. lyer and A. D. Damodaran, Talants., 40(1993) 771.
[6] T.P. Rao and T.V. Ramakrishna, Analyst, 107 (1982) 704.
[7] J. Hu. W.B. Qi and B. Y. Pu, Mikrochim. Acta., 109 (1992) 295.
[8] Jose Anchieta Gomes Neto, H. Bergamin Fo, Elias Ayres, G. Zagotto and Francisco J. Krug, Anal. Chim. Acta., 308 (1995) 439.
[9] Dr. Md. Rafiqullah and Md. Enamul Haque, Analytical Sciences, (communicated-2007).
[10] G. D. Clayton and F. A. Clayton (Eds.), Patty’s Industrial Hygene and Toxicology, Vol. 2A, 3rd edn., John Wiley and Sons, New York, 1981, P.1563.
[11] P. B. Hammond and Robert P. Beliles, Metals in “Casarett and Doull’s Toxicology”, C.D. Klassen, M.O. Amdur and J. Doull (Eds.) 3rd end. Macmillan, New York, 1986, P. 428.
[12] L. Friberg, M. Piscator, G. F. Nordberg and T. Kjellstrom (Eds.) “Cadmium in the Environment”, 2nd Edn., CRC Press, InC., Cleveland. 1974.
[13] D.M. Taylor and D.R. Williams, Trace Elemint Medicine and Chelation Therapy, The Royal Society of Chemistry, Cambridge, 1995, p. 22.
[14] M. M. Key, A.F. Henschel, J. Butter, R. N. Ligo and I.R. Tabershaed (Eds.), “Occuptional Diseases-A Guide to Their Recognition”, U. S. Department of
health, Education ande Welfare, US Government Printing, Washington, DC, June, 1977,p 265.
[15] J.E. Fergusson, The toxicity of heavy element to human beings in : “The Heavy Elements : Chemistry, Environmental Impact and Health Effects”, Pergamon Press, Oxford, 1989, p.548.
[16] B. Venugopal and T.D. Luckey, “Metal Toxicity in Mammals-2”, Plemum Press, New York, 1979,p.76
[17] Second Annual Report of Carcinogens, Environmental Protection agency, NTP, 81-43, Dec., 1981.
[18] M. Jamaluddin Ahmed and M. Jobaer Hassan, Research Journal of Chemistry and Environment. 3(3) (1999) 9.
[19] A.K. Mukharjee, Analytical Chemistry of Zirconium and Hafnium, 1st Ed; Pergamon Press, New York, 1970, p. 12.
[20] B.K. Pal and B. Chowdhuary, Mikrochim. Acta., 11(1994) 121.
[21] A. L Busev, V.G. Tiptsova and V.M. lvanov, Analytical Chemistry of Rare Elements, (Eds) Mir Publishers. Moscow, 1981. p. 385.
[22] E.B. Sandell, “Colorimetric Determination of Traces of Metals”, Interscience, New York. 1965, p. 269.
[23] C Bosch Ojeda, A. Garcia de Torres, F. Sanchez Rojas and J. M. Cano Pavon, Analyst, 112 (1987) 1499.
[24] B.K. Pal, K. A. Singh and K. Dutta, Talanta, 39, (1992) 971.
[25] I. Nukatsuka, A. Nashimura and O. Kunio, Anal. Chim. Acta., 304 (1995) 243.
[26] P. Job. Ann. Chim. (Paris) 9(1928) 113.
[27] J.A. Yoe, A. L. Jones, Ind. Eng. Chem. Anal. Ed. 16 (1944) 11.
[28] G.A. Parker, “Analytical Chemistry of Molybdmum”, Springer-Verlag, Berlin, 1983.
[29] E.A. Greenberg. S.L. Vlesceri and D.A. Eaton (Eds.) “Standard Methods for the Examination of water and wastewater”, 18th ed. American Public Health Association, Washington, D.C., p. 3-82

Khokan Chandra Sarker, IJSRM volume 1 issue 1 April 2013 [www.ijsrm.in] Page 44
[30] Ch. S.S.S. Murthy and Y. Anjaneyaula, “Heavy Metals and Organochlorine Level in Kakindada Bay In: Proceedings of the International Conference on
Industrial Pollution and Control Technologies” Y. Anjaneyulu (Ed.), Allied Publishers Limited, Hyderabad, 1997, pp. 747-753.